3.1. Microstructure and Phase Composition
Optical micrographs are shown in
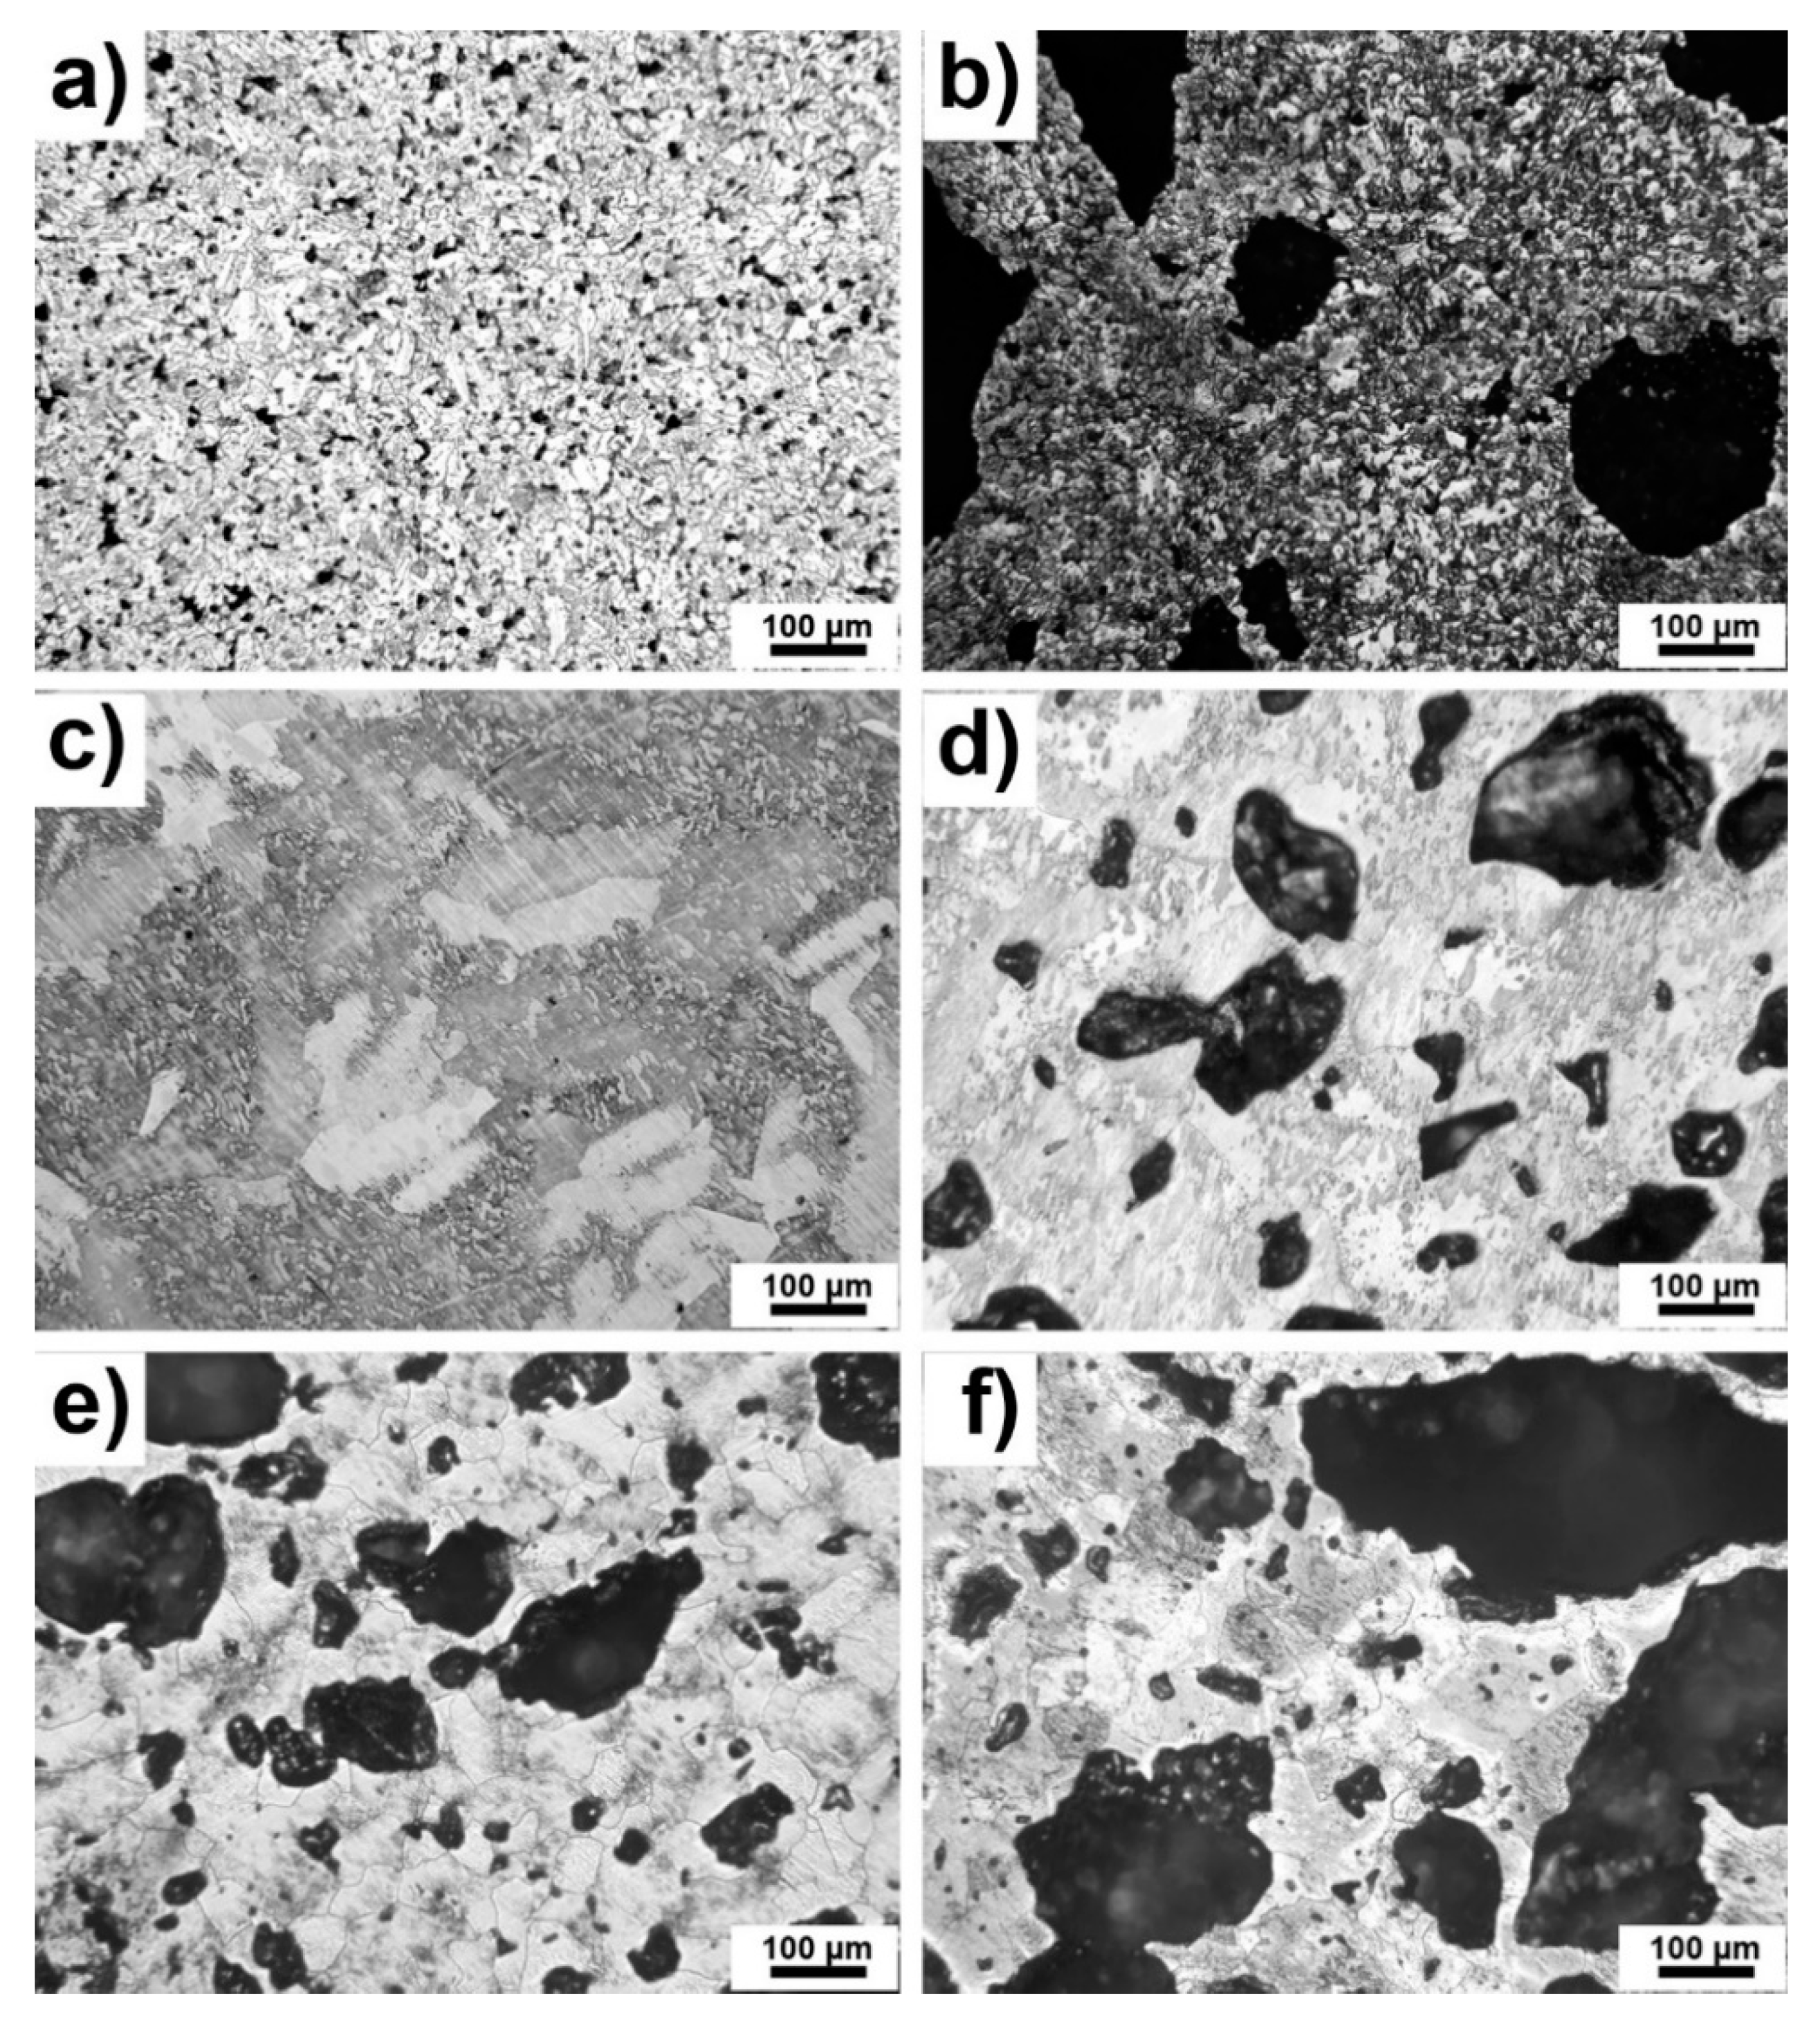
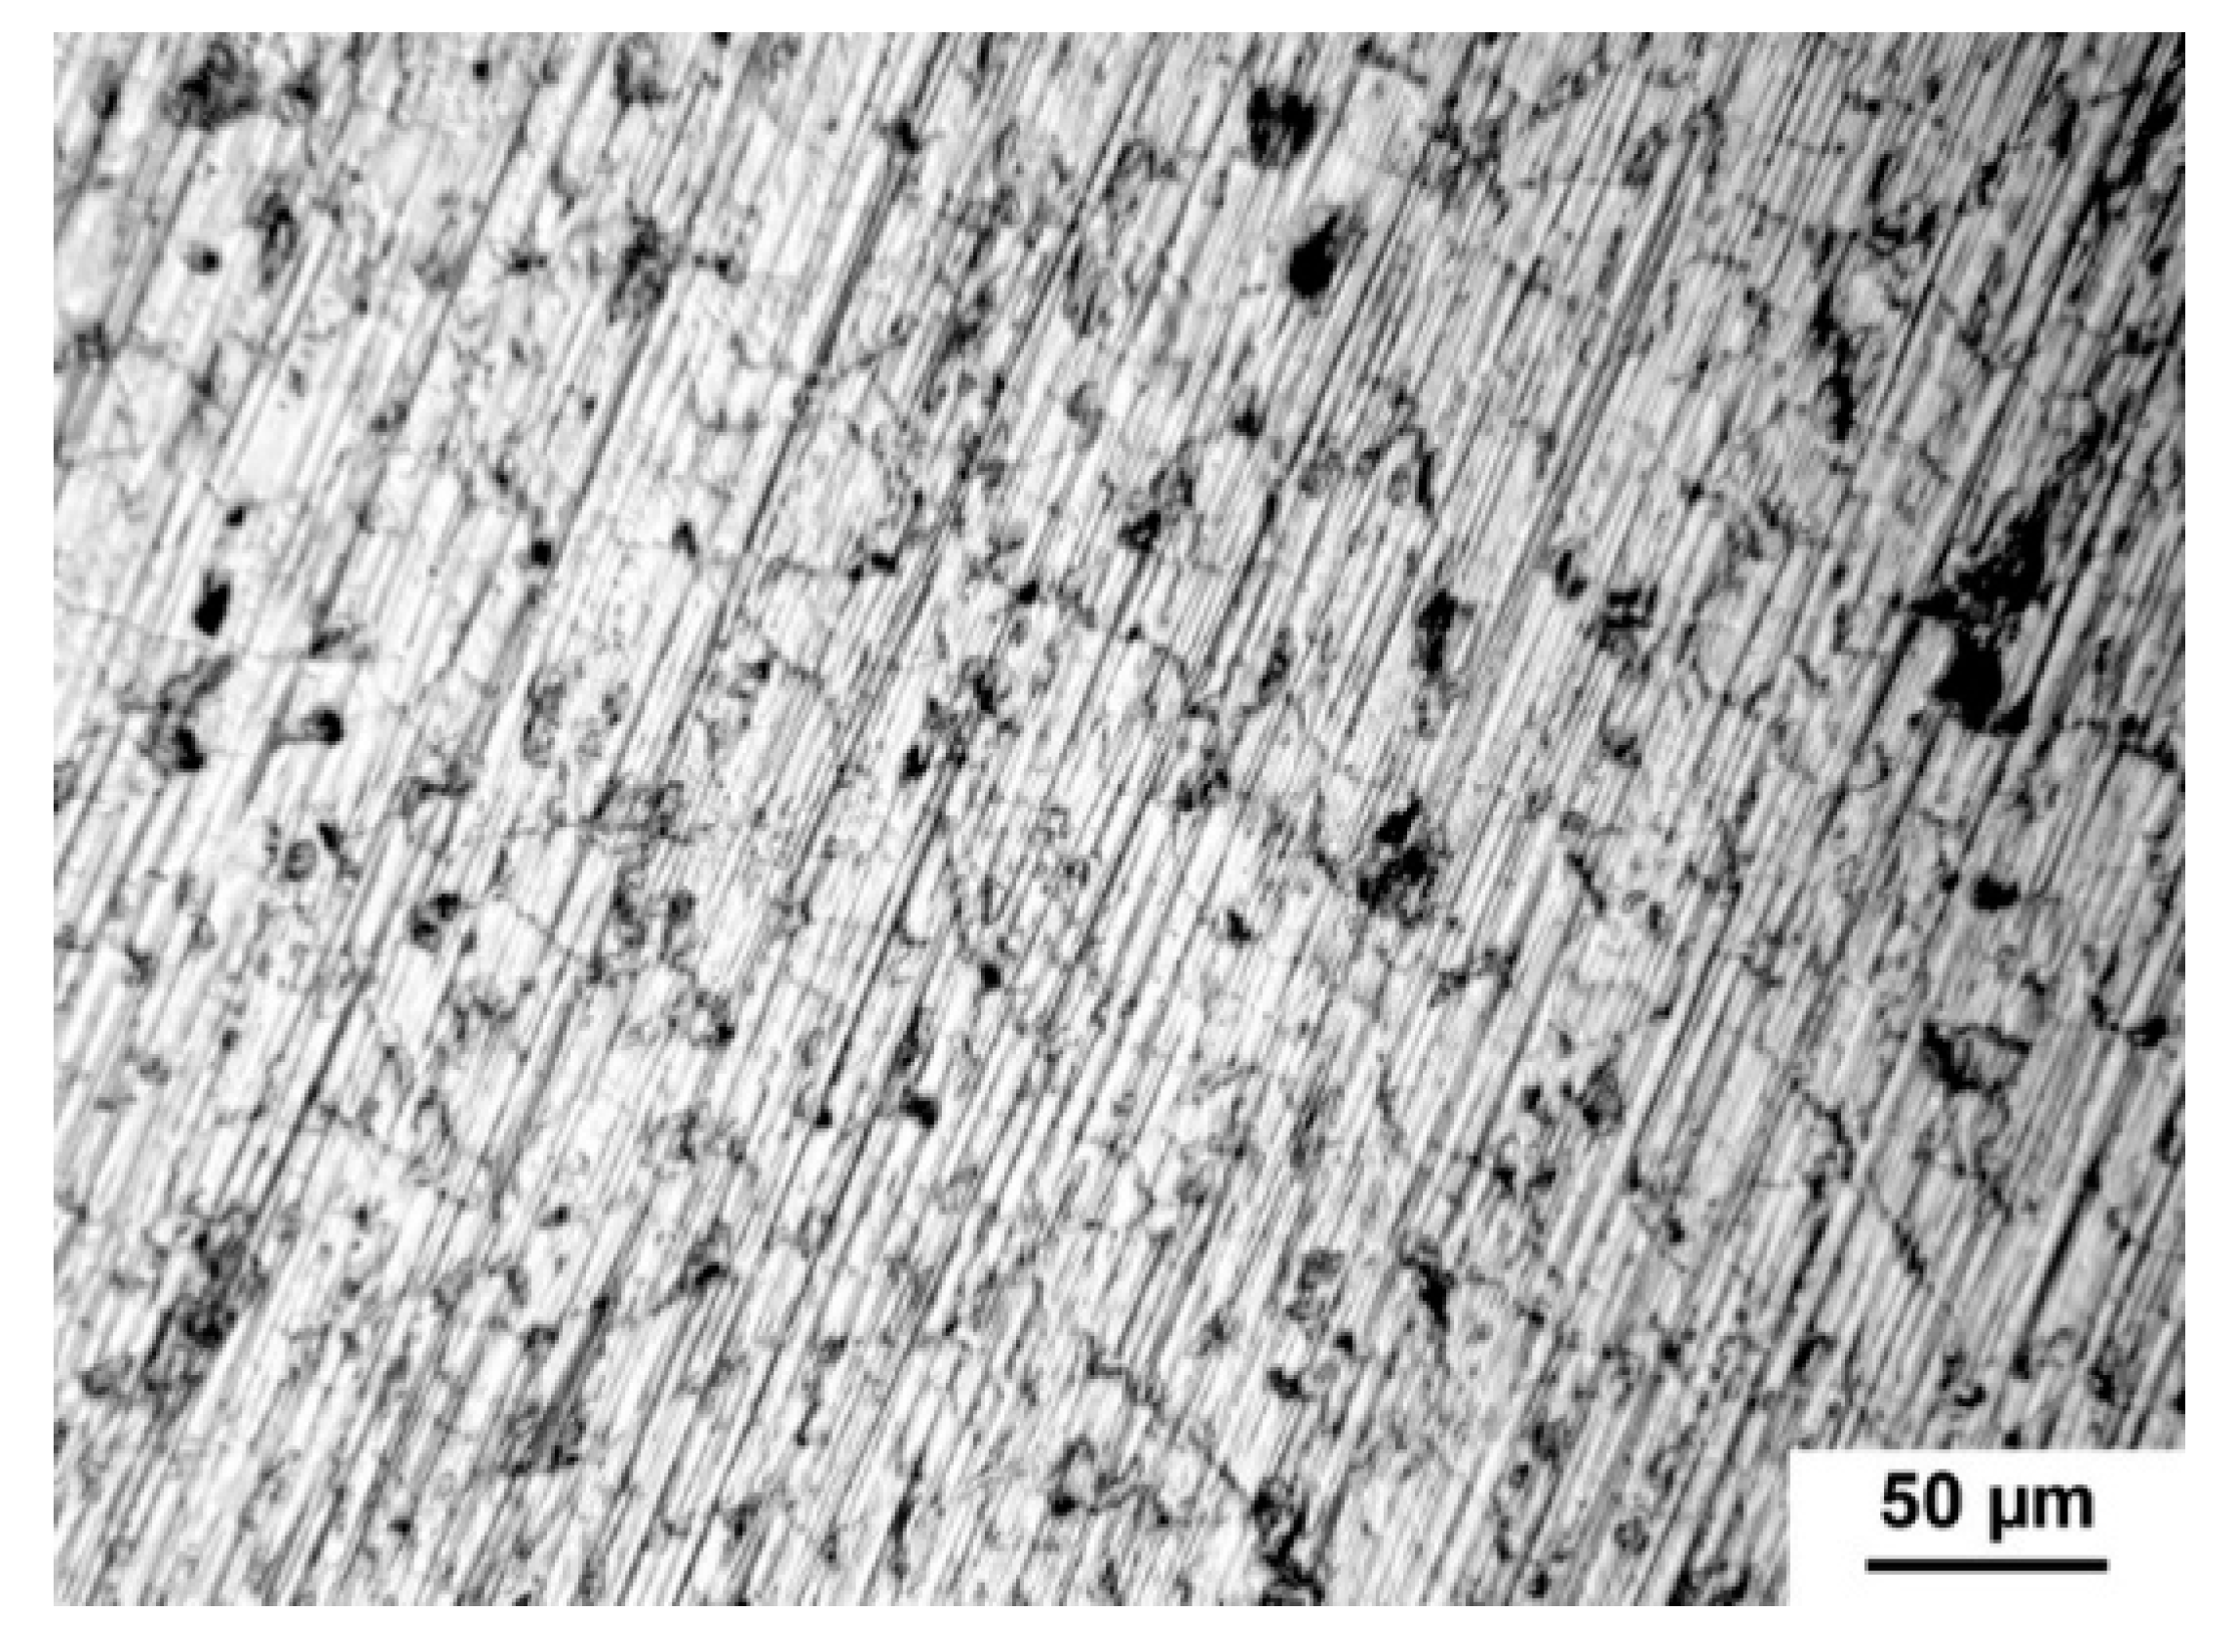
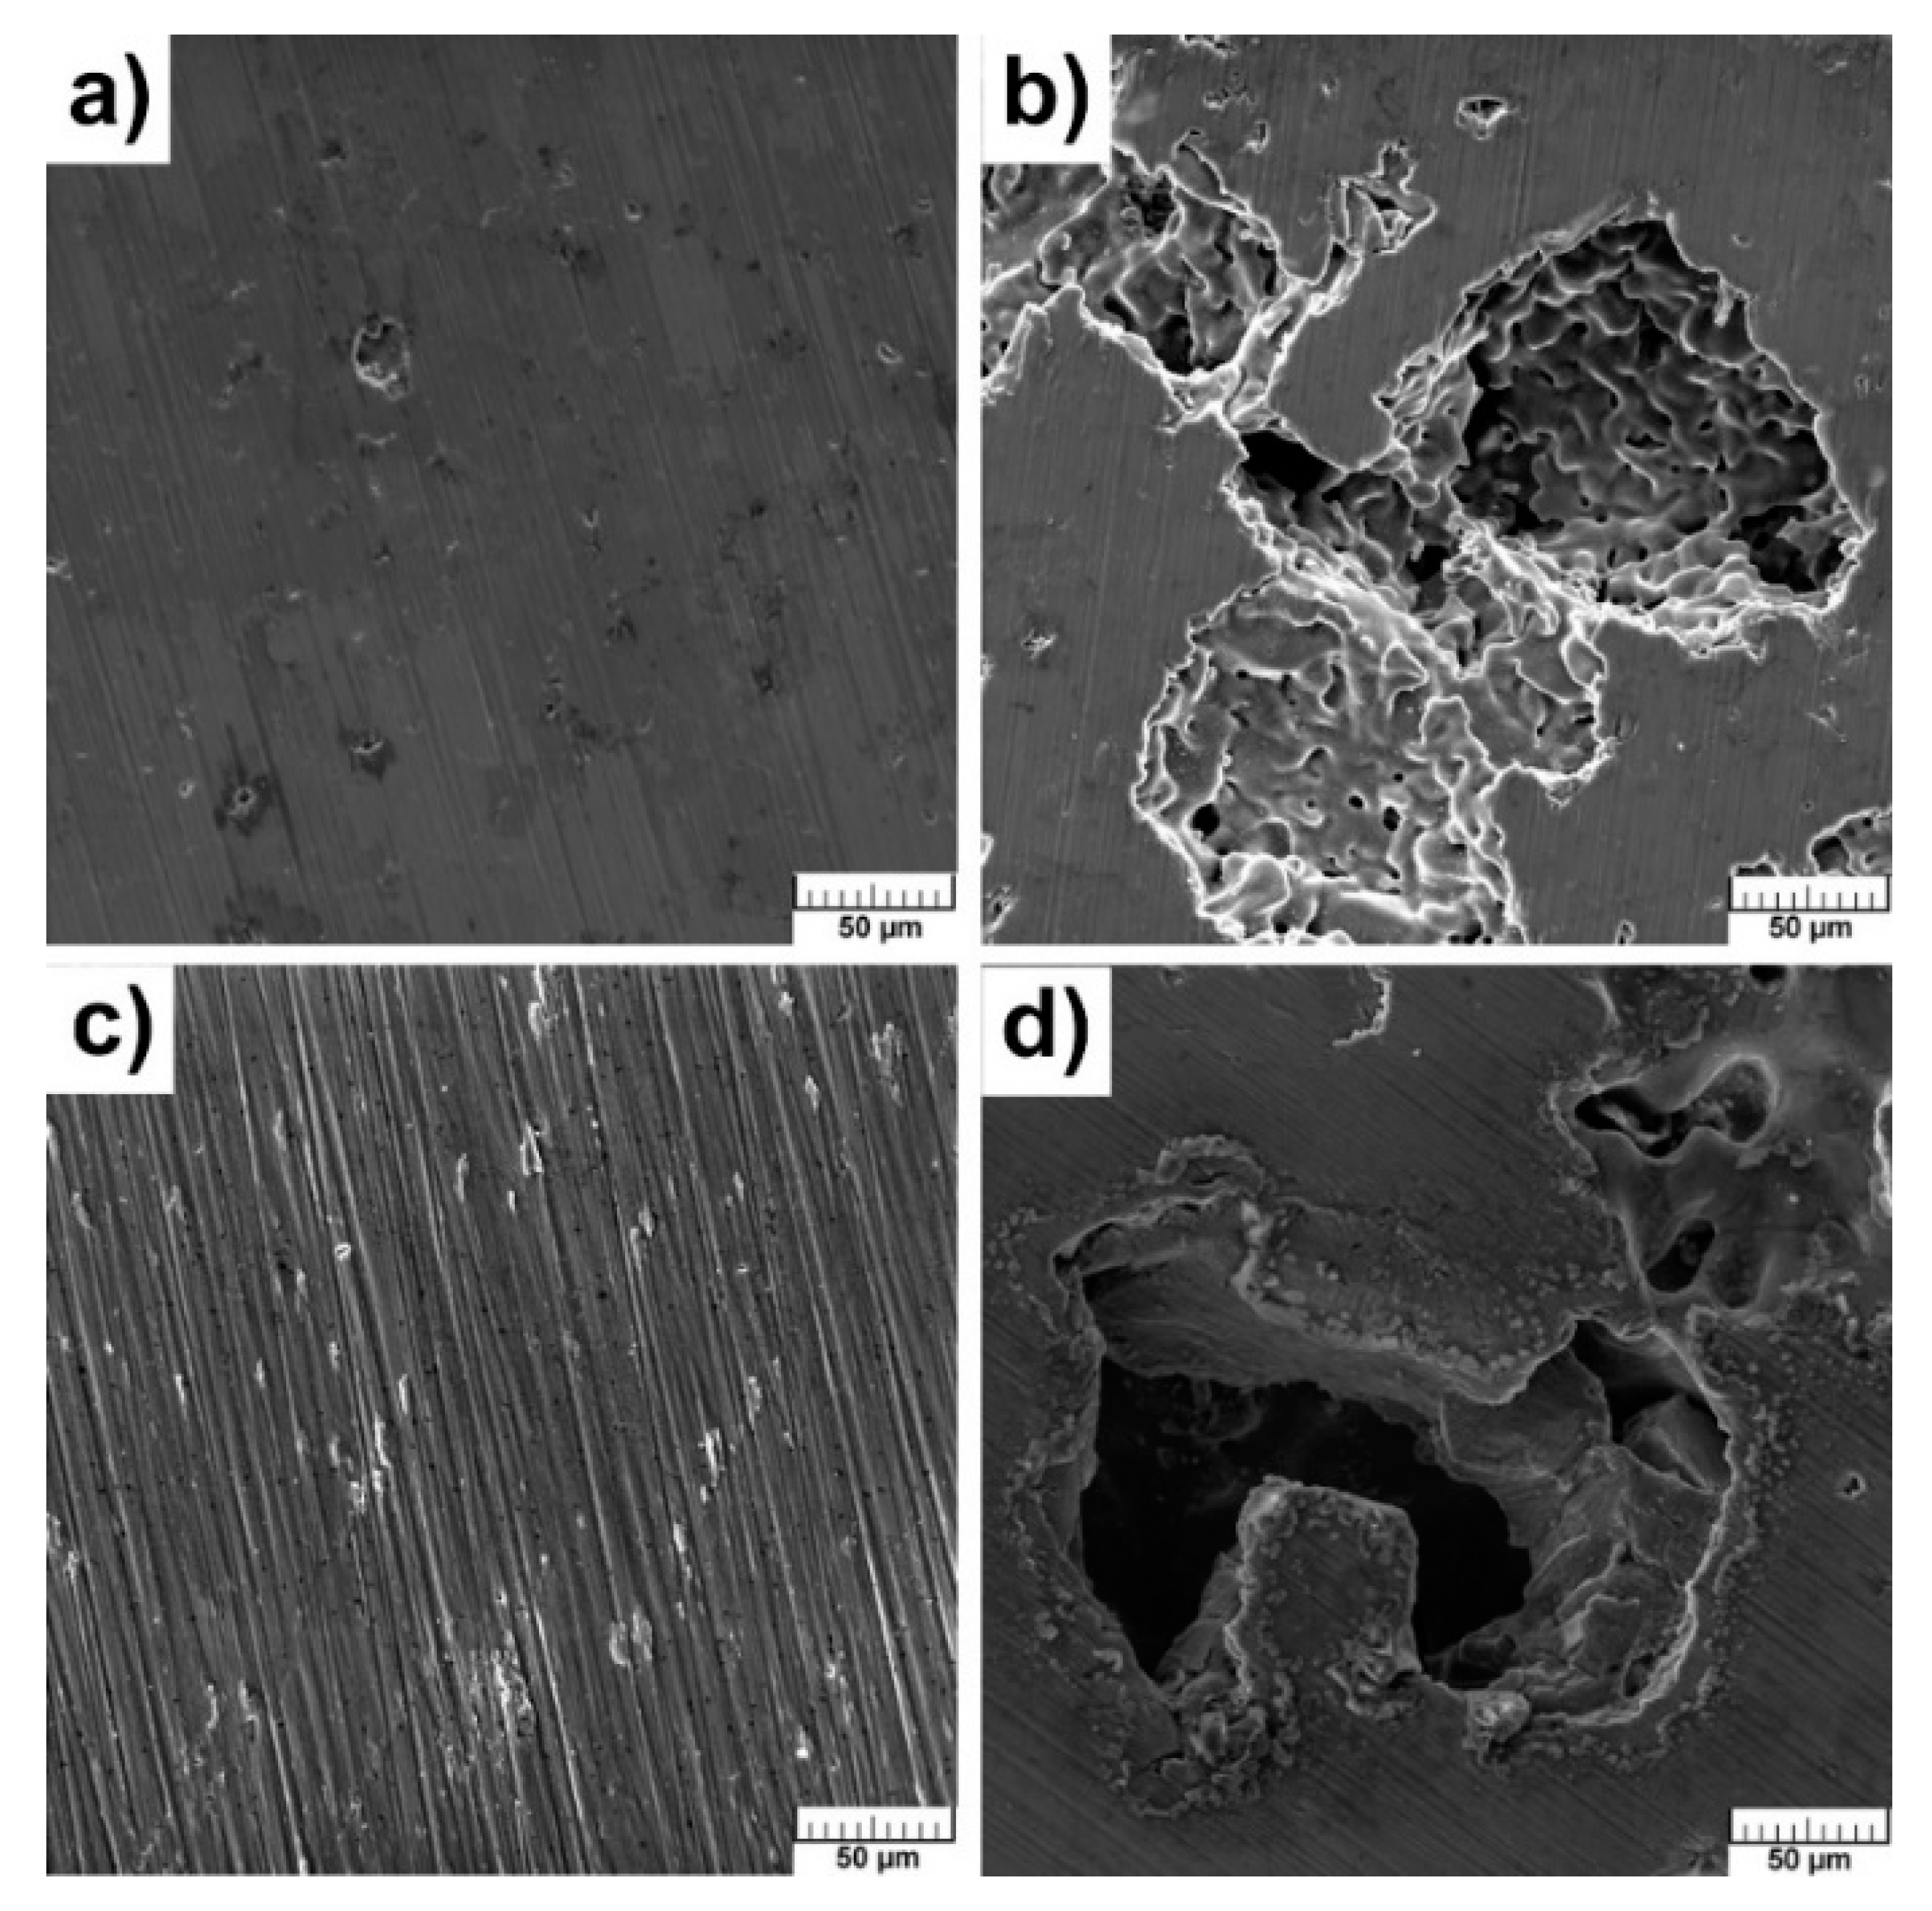
Figure 2a–f. The present pores can be observed as black spots from the smallest ones to the largest ones depending on chemical composition. It seems that pores are open and interconnected which was also observed in [
27]. Residual porosity was low and caused by the reactive sintering of pure Ti. Furthermore, the obvious differences in the structure of Ti were affected by the orientation of titanium grains which were etched differently (
Figure 2c). It can be seen that the pores were much larger in TiSi2 alloy than in pure Ti (
Figure 2a,c), which is caused by the Kirkendall effect and by the different lattice parameters of titanium and silicon influencing the resulted porosity. In the cases of studied alloys with PA, the porosity was caused by both sintering and the decomposition of the pore-forming agent. It is obvious that the porosity evidently increased with the addition of PA. The pore-forming agent was decomposed to gaseous ammonia and carbon dioxide resulting in the formation of the pores. Moreover, in the cases of TiSi2 + 20 wt.% PA alloy (
Figure 2b), pores were formed by Kirkendall effect due to unbalanced diffusivities of titanium and silicon during reactive sintering itself and by the decomposition of PA.
Table 1 listed porosity by image analysis and porosity by weight calculated from the theoretical and real weight of samples. If the samples are isotropic (the absence of a directional dependence of porosity), uniform (the absence of porosity gradients) and the location of pores is random (without periodicity of the porosity), the Delesse–Rosiwal law should be valid [
28]. According to this law, the porosity by image analysis is equal to porosity by weight. This one was confirmed by the presented values shown in
Table 1. Only in the case of TiSi2 alloy, the porosity by weight was significantly higher than porosity by image analysis, suggesting the non-uniform distribution of pores within the alloy.
As was expected, the porosity increased with increasing addition of PA which was already obvious from microstructure (
Figure 2a–f). The porosity of TiSi2 + 20 wt.% PA was approximately twice as high as of Ti + 20 wt.% PA alloy. The explanation lies in the mentioned Kirkendall effect and the differences between titanium and silicon lattice parameters. This one explained also the porosity determined for pure Ti and TiSi2 because all processes of sintering elemental powders are susceptible to the formation of Kirkendall pores.
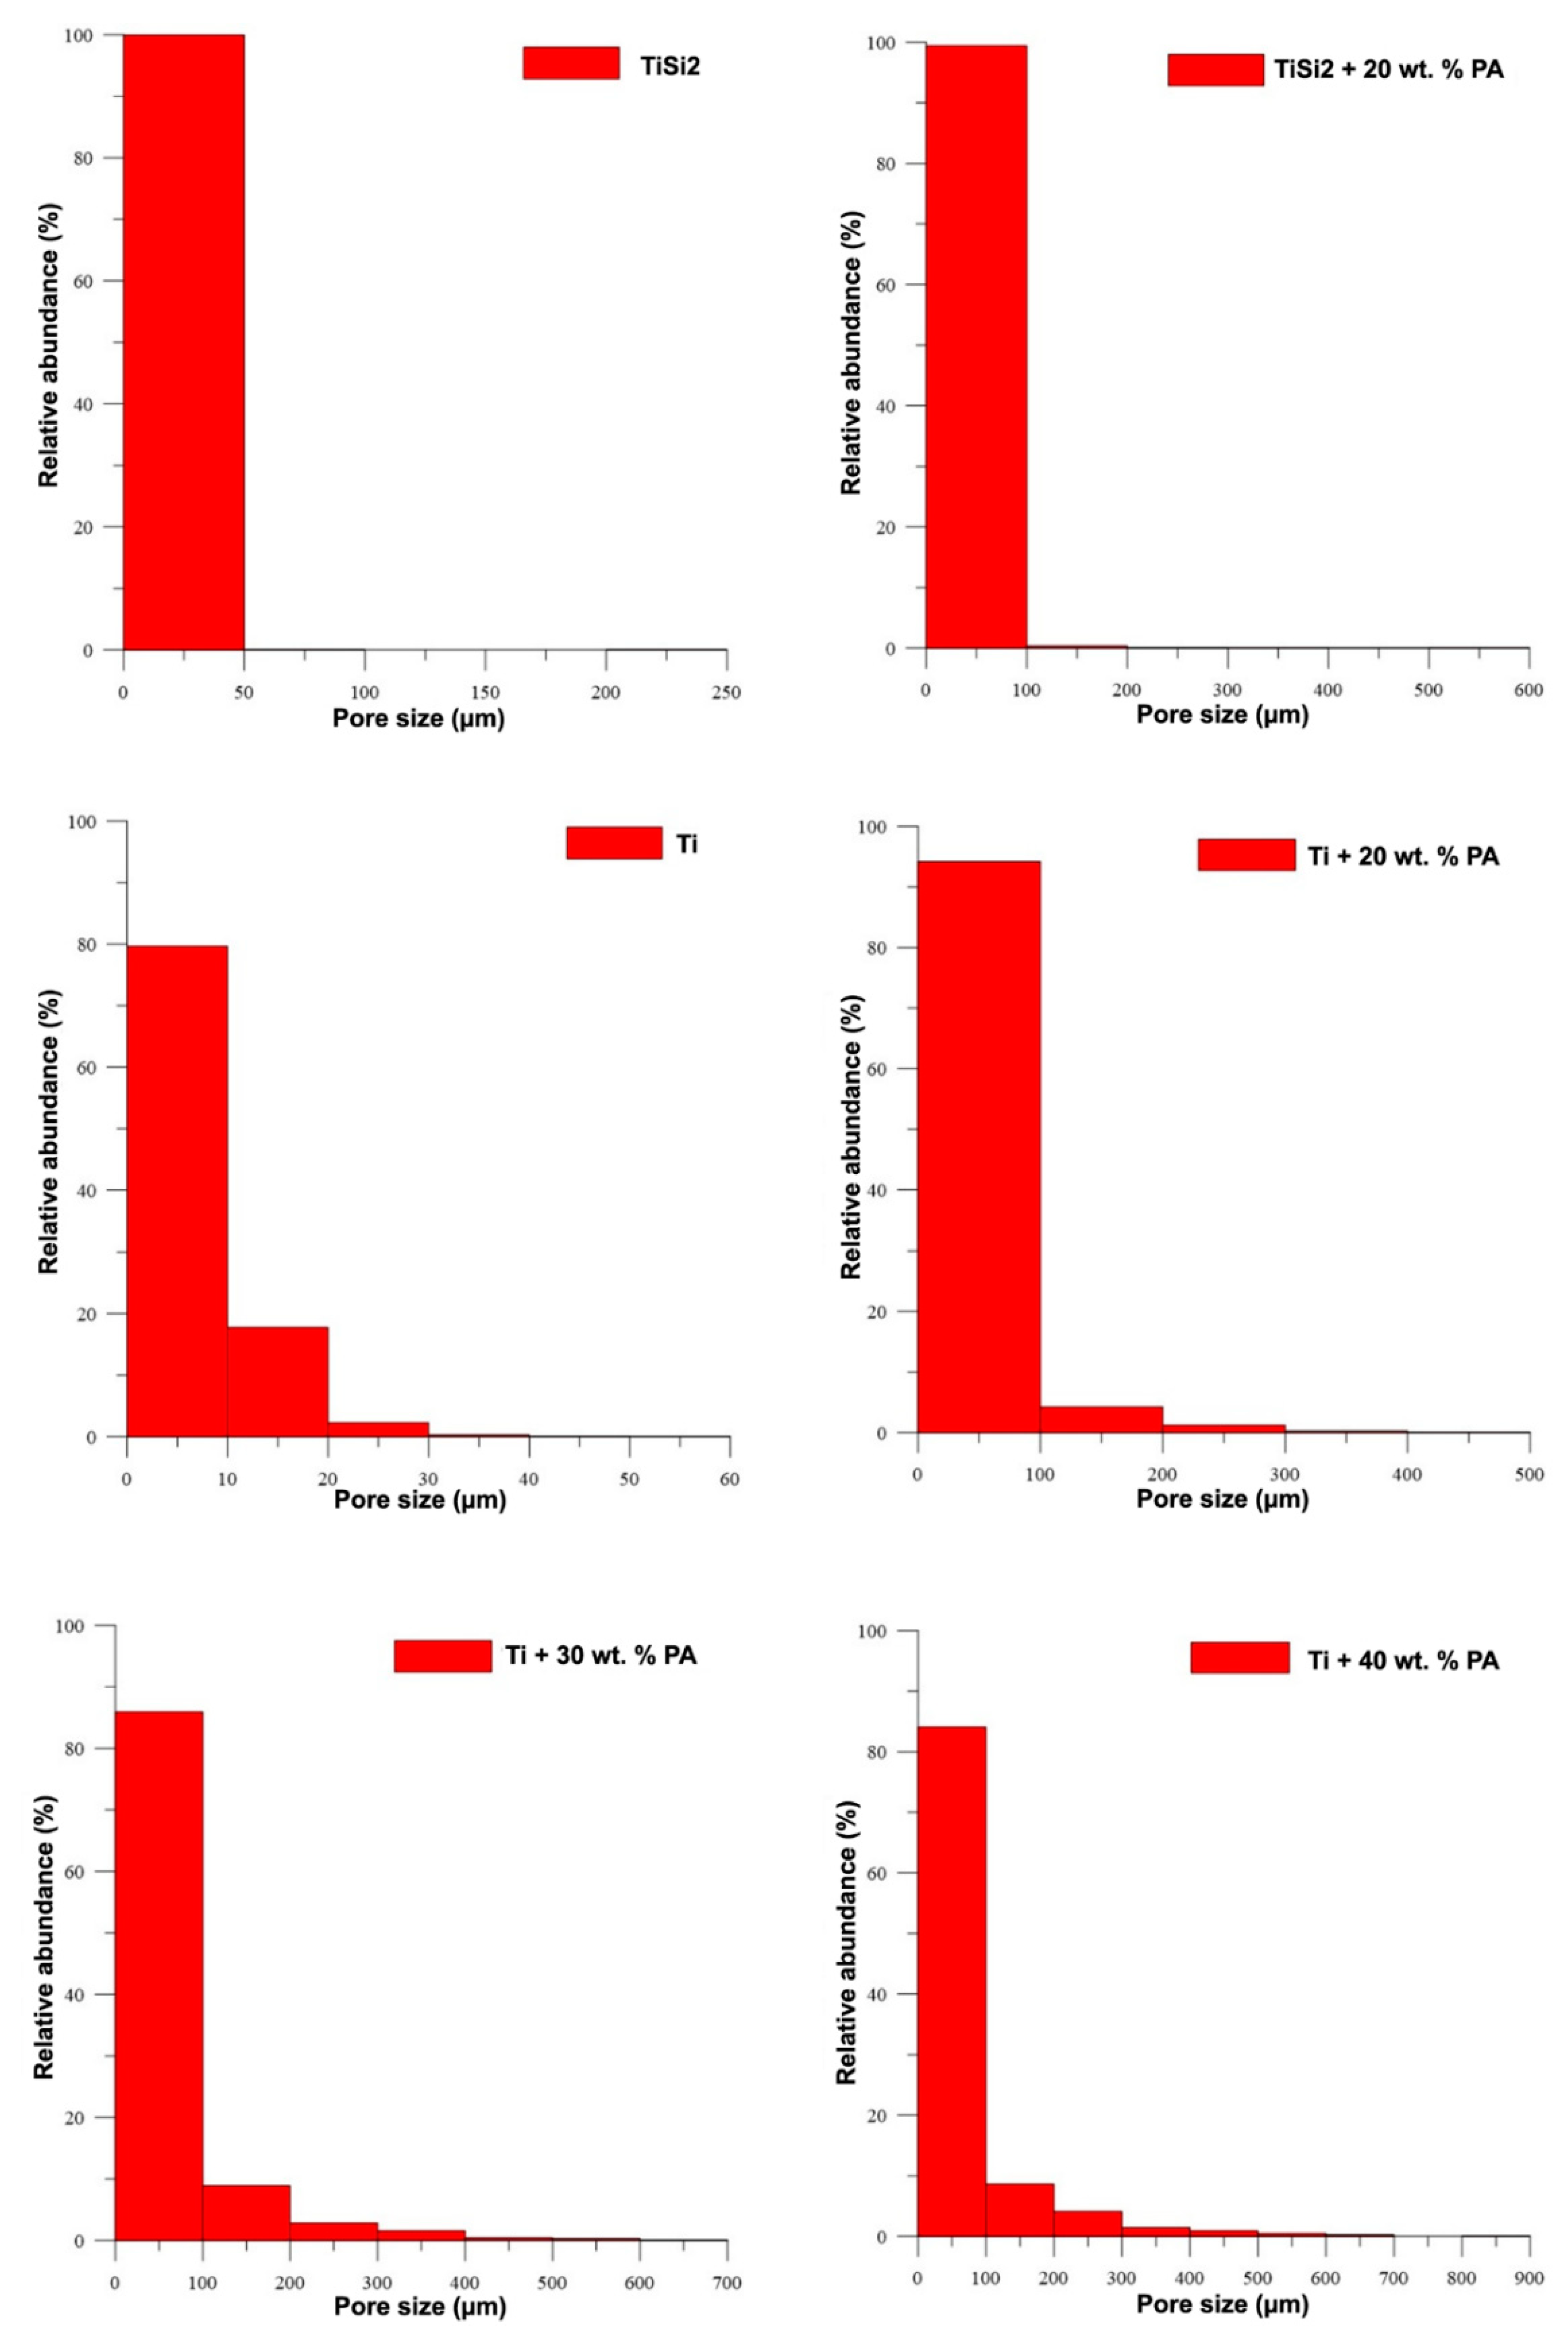
The histograms shown in
Figure 3 illustrate the relative representation of pore size for all studied samples. These results confirmed the increasing pore size with the amount of added PA and the beneficial addition of PA for the synthesis of porous alloys. The observed pores with the size smaller than 100 µm were found in TiSi2 + 20 wt.% PA. Only a few of pores have the size larger than 200 µm. On the contrary, titanium with 20 wt.% PA contained above 90 % of pores with size below 100 µm, 5% of pores smaller than 200 µm and 2 wt.% of pores whose dimensions did not exceed 300 µm. The rest of the observed pores have a size of approximately 500 µm. It is known that the optimal pore size varies in the range of 100–500 µm [
2] for the ingrowth of bone tissue into the implants. Only the samples with pore-forming addition contained such large pores; however, almost 80% of them were smaller than 100 µm.
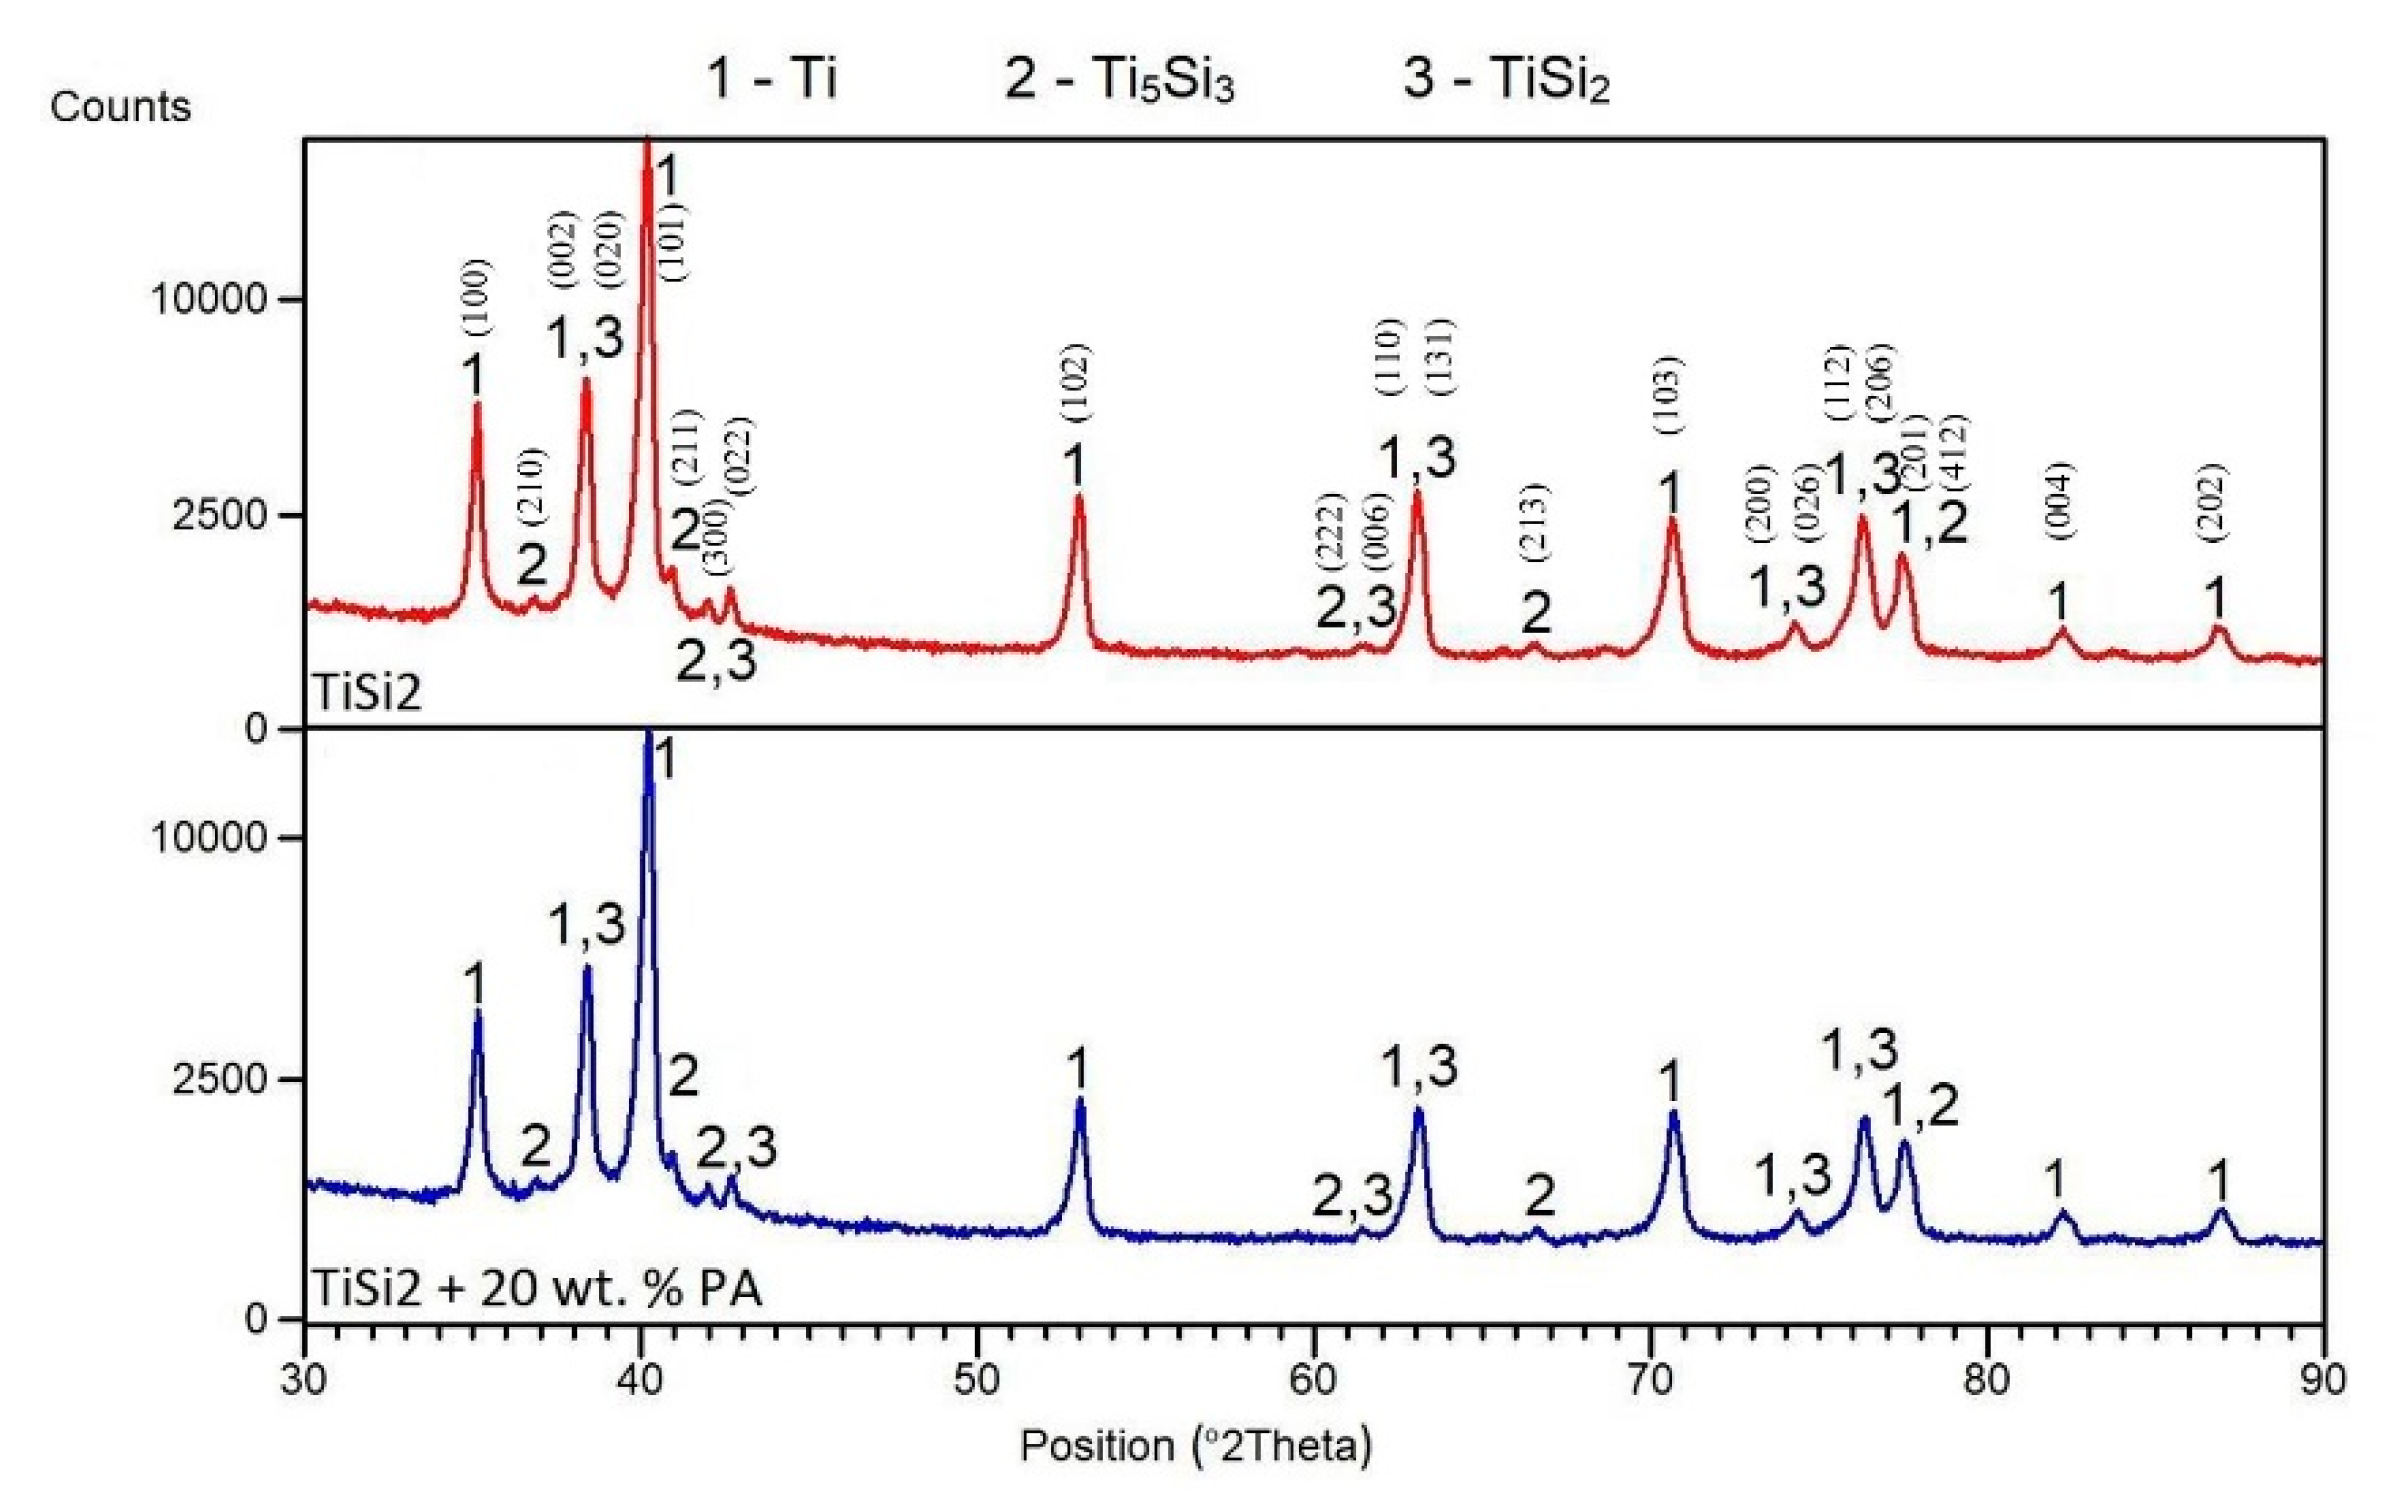
The matrix was formed by hexagonal titanium and a solid solution of silicon in α-Ti, which was confirmed by X-ray analysis. X-ray diffraction was performed to identify the types of silicides formed in TiSi2 and TiSi2 + 20 wt.% PA alloys during reactive sintering. X-rays analyses revealed the presence of Ti
5Si
3 and TiSi
2 silicides (
Figure 4) suggesting the nonequilibrium behavior during reactive sintering. This claim was confirmed by comparison of the expected phase composition with the equilibrium phase diagram [
29]. Therefore, it is obvious that Ti
5Si
3 phase formed due to the kinetical factors [
30]. Despite the presence of the pore-forming agent, phase composition was not influenced.
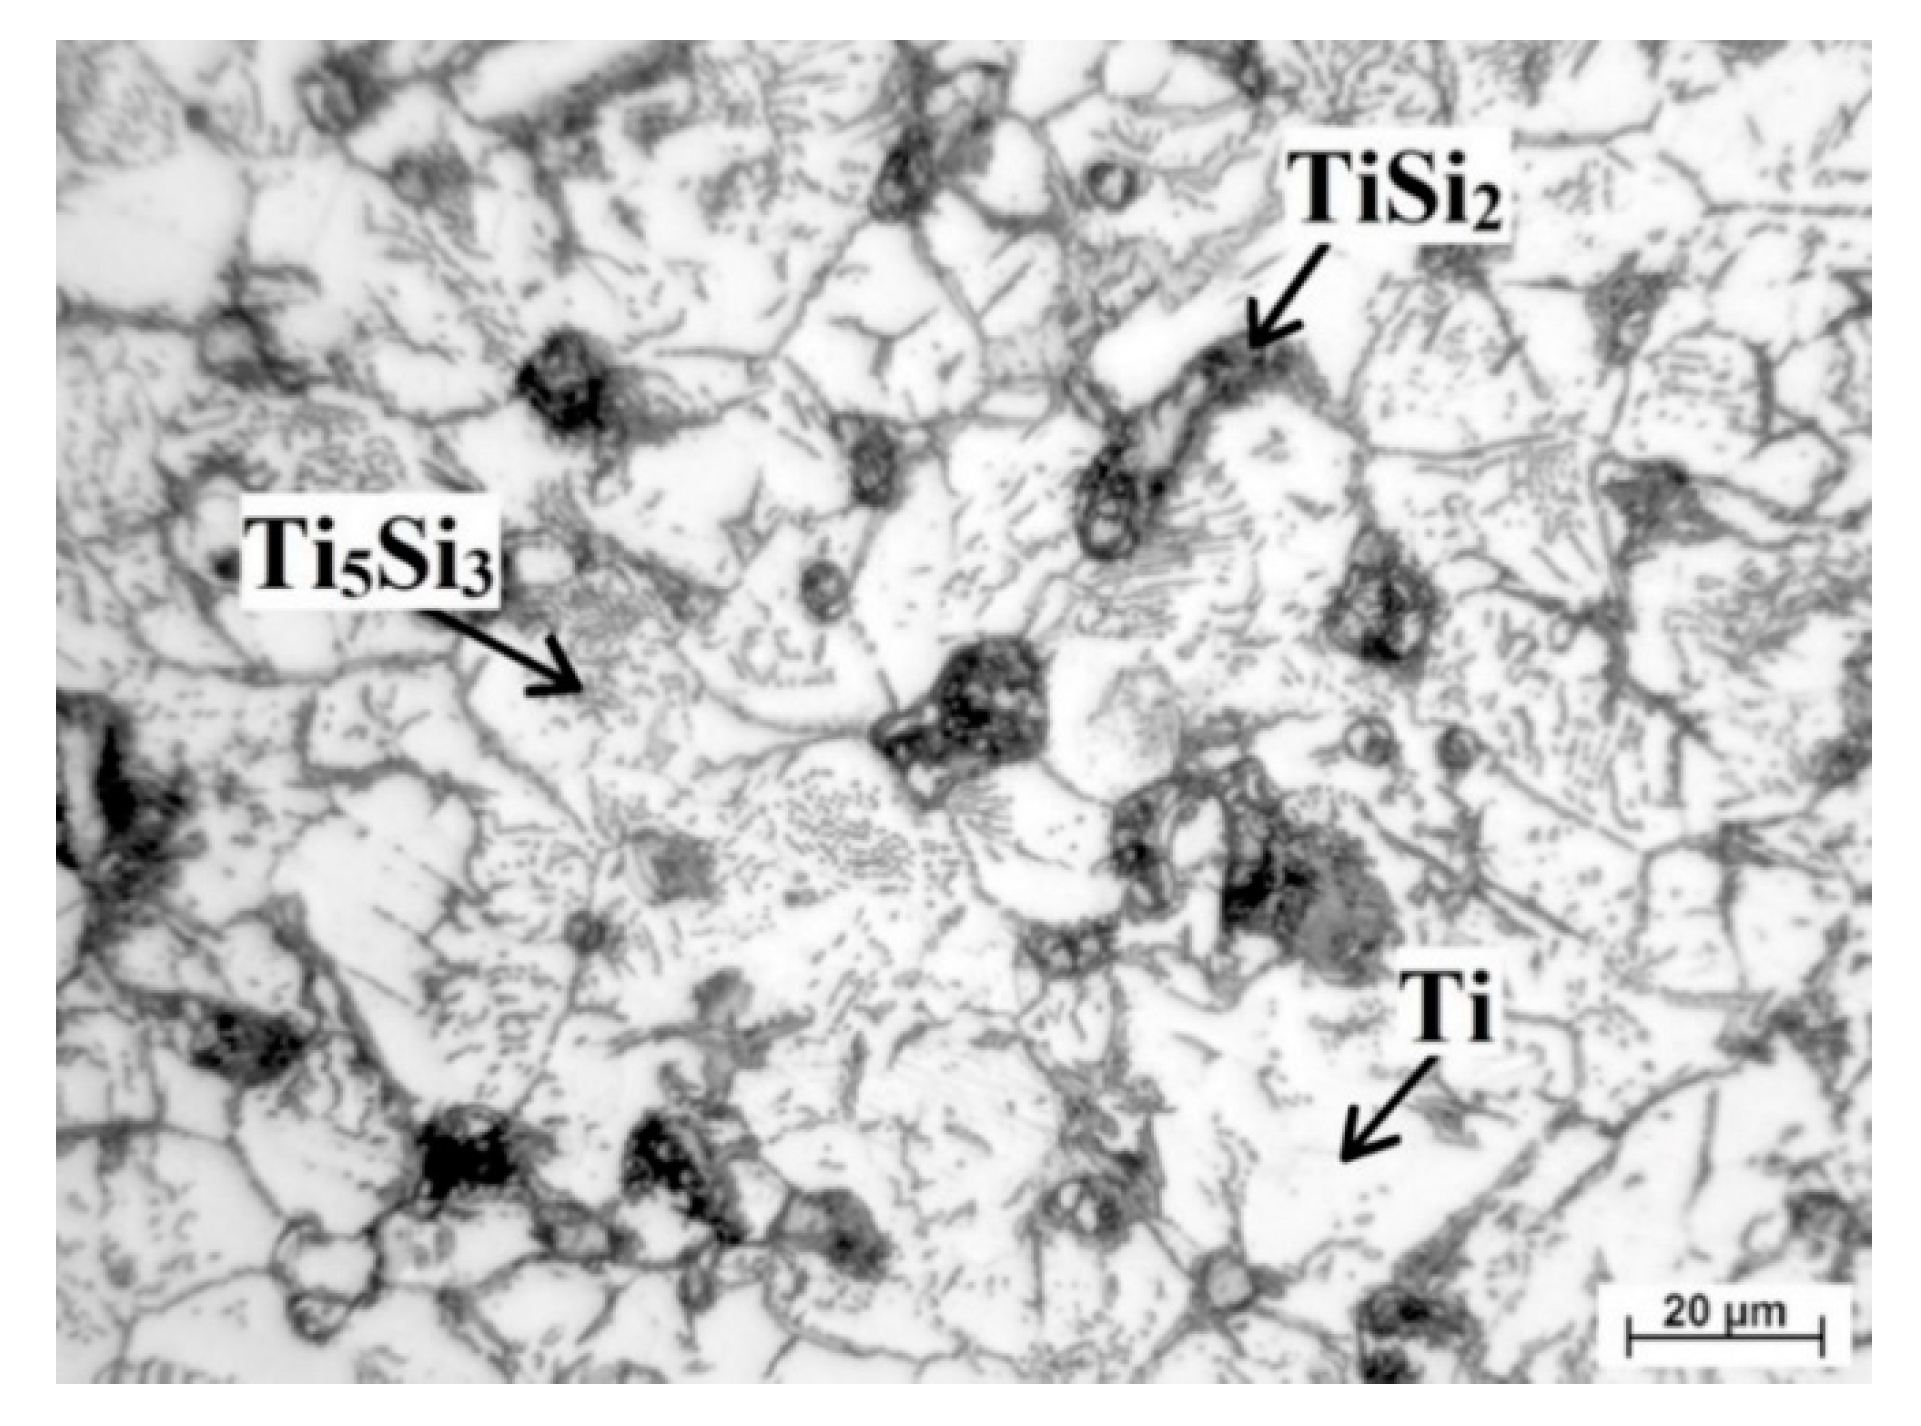
Found phases are marked in
Figure 5 and was identified according to work [
22], which studied the formation of silicides in porous Ti-Si alloy. Titanium formed matrix (white area) while the light grey round particles at the boundaries were Ti
5Si
3 phase (confirmed during EDS analysis). Silicides TiSi
2 occurred primarily at the edges of pores. The presence of those phases is not a surprise. Trambukis et al. [
31] found the phases sequence of formation during SHS, which is: TiSi
2 → TiSi → Ti
5Si
4 → Ti
5Si
3. According to this sequence, it is clear that TiSi
2 phase forms preferentially and it is gradually transformed to the more stable Ti
5Si
3 phase. Moreover, it was confirmed that Ti
5Si
3 phase can also form by the direct reaction between titanium and silicon [
32] and it is the most thermodynamically stable phase (∆H
f = −579 kJ/mol) in the Ti-Si system [
33]. The high surface-to-volume ratio of small titanium particles enables full contact between titanium and silicon, resulting in the formation of intermediate phase at lower temperatures and the mechanism in the initiation of the SHS reaction was the transformation of α-Ti to β-Ti, as shown in [
33].
3.2. Mechanical Properties
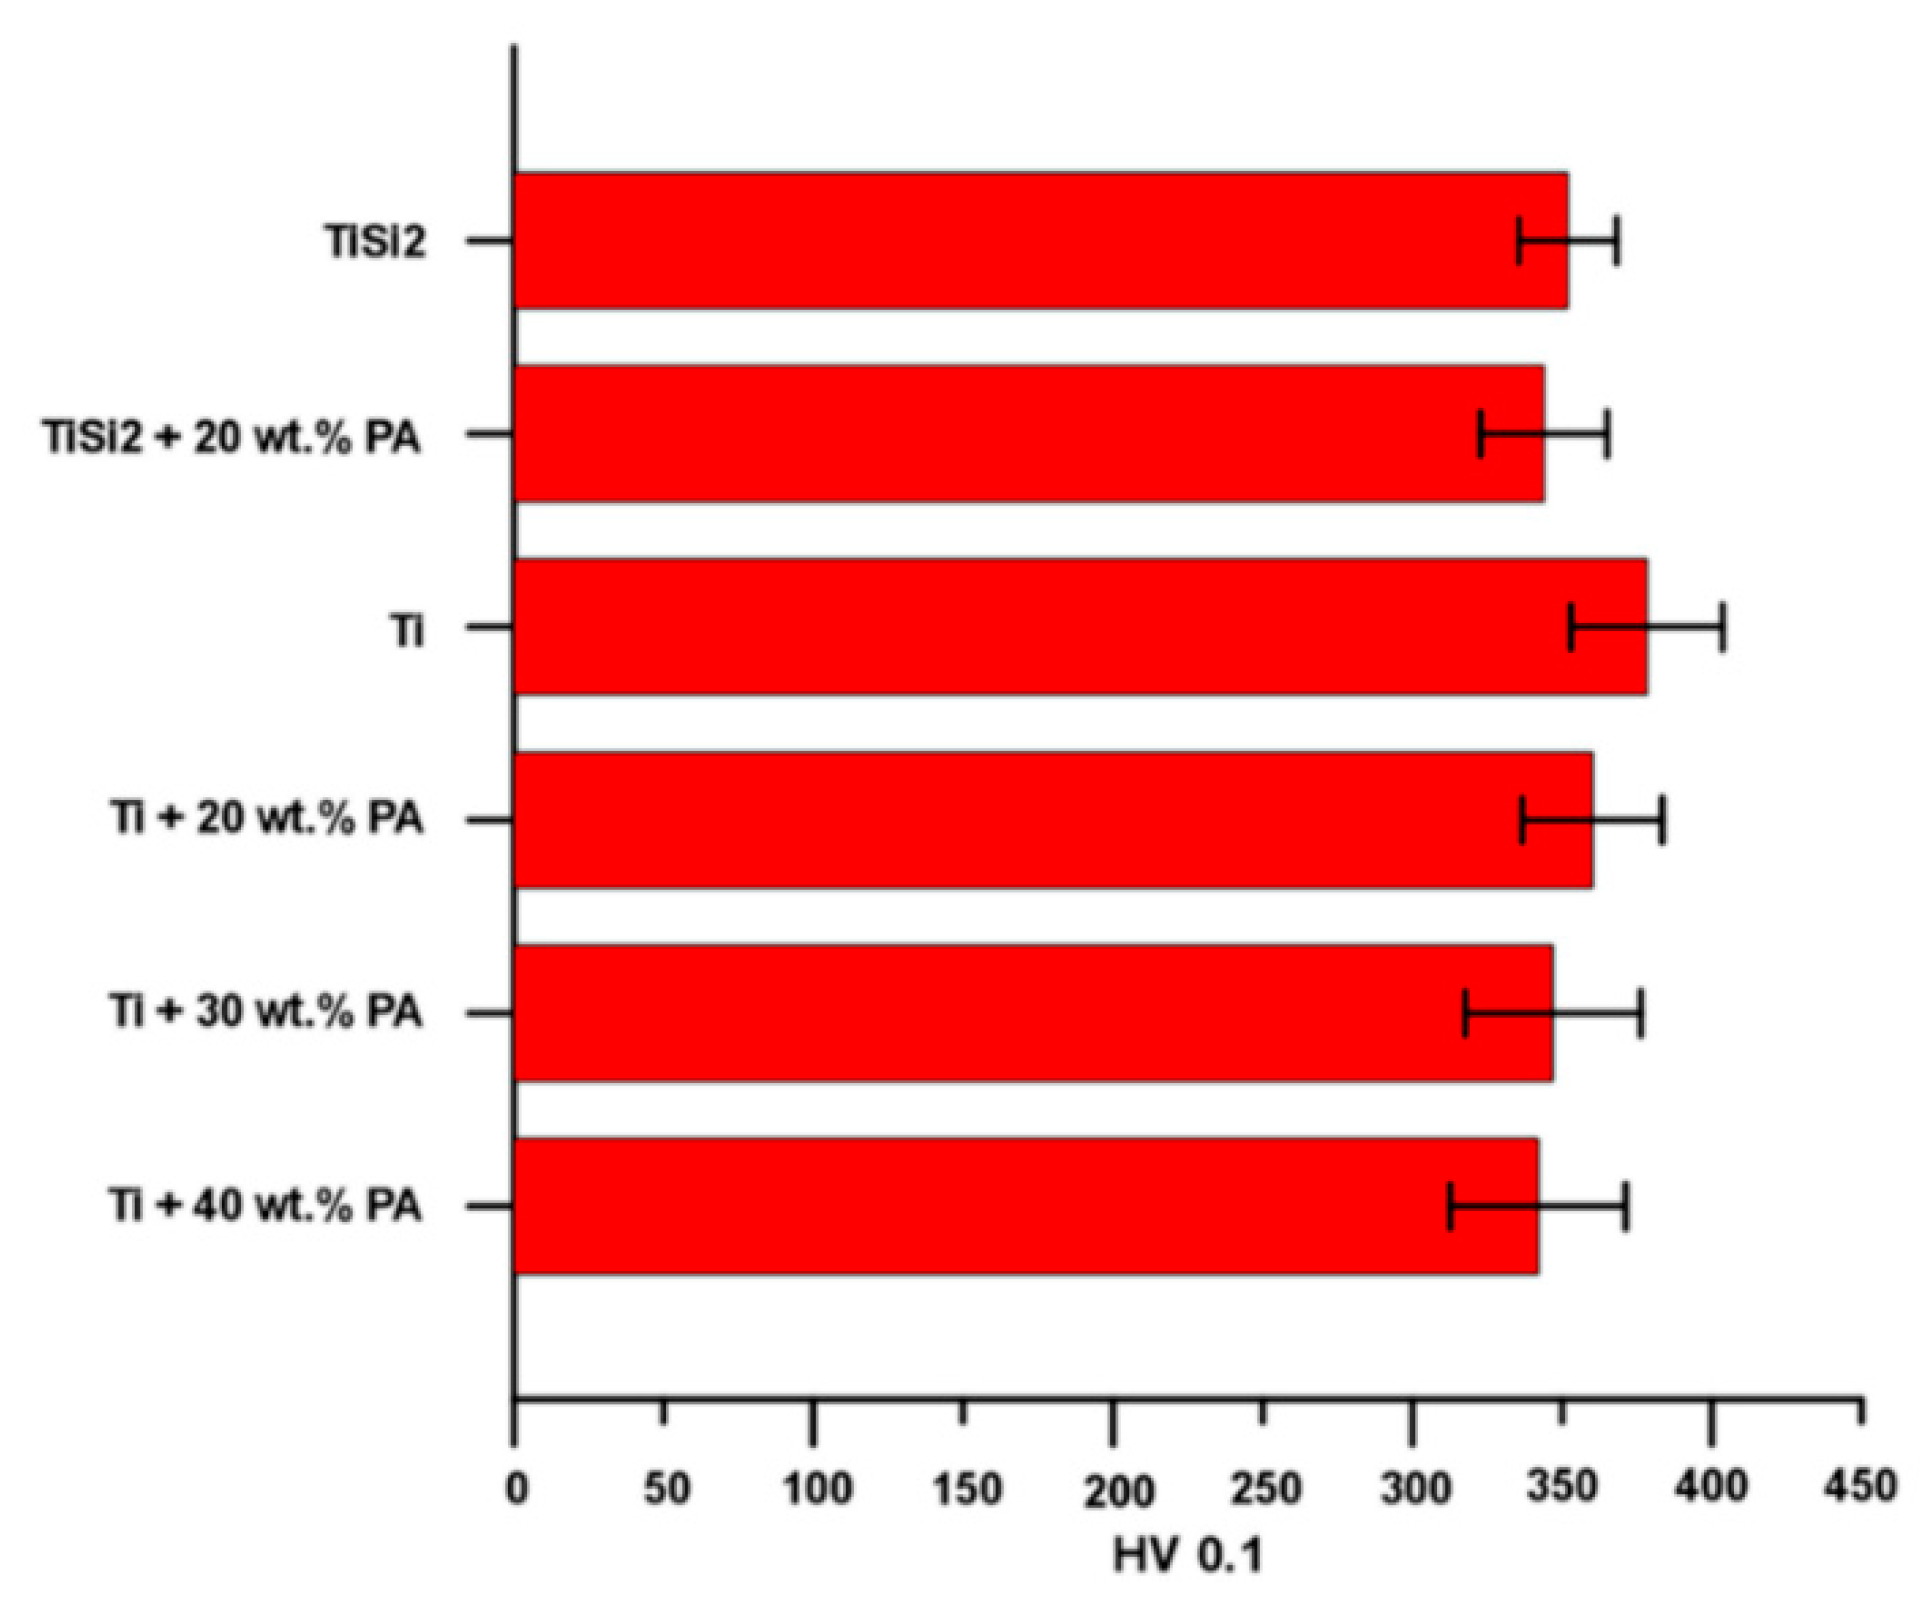
First of all, the microhardness was measured only on areas without pores and results are shown in
Figure 6. In the case of TiSi2 and TiSi2 + 20 wt.% PA, the microhardness of the matrix (not silicides) was determined. The microhardness of silicides was impossible to measure because as it was shown, they appeared as thin and elongated particles close to pores (
Figure 2a,b). The resulted values of microhardness were approximately similar for all tested alloys.
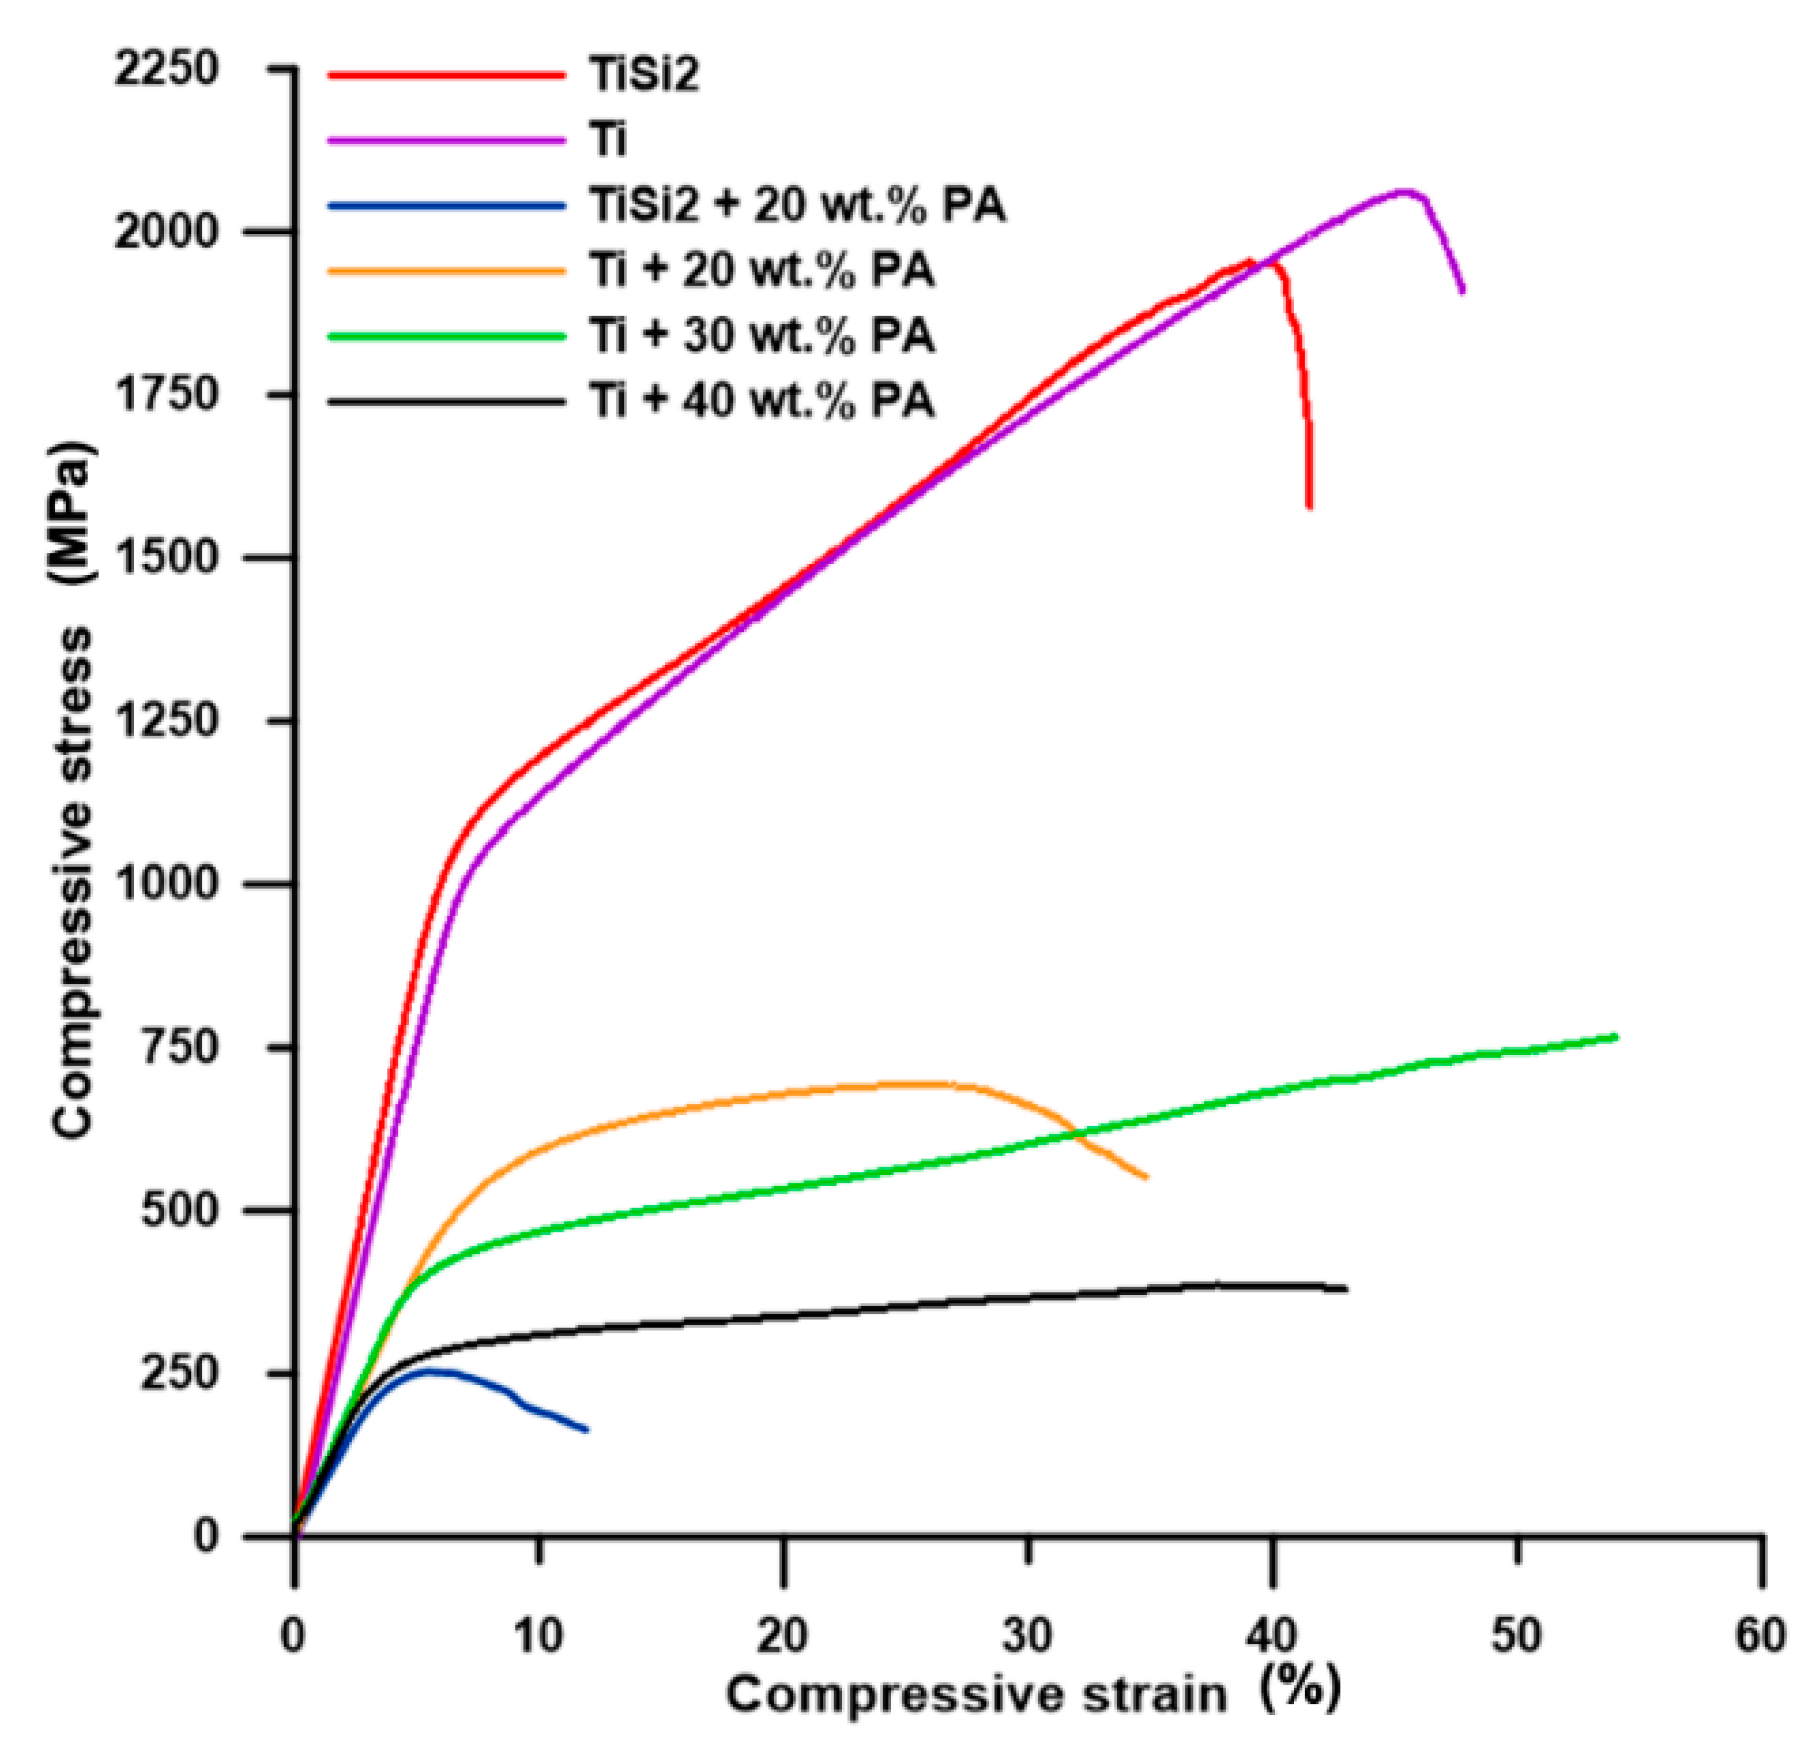
The course of compressive stress–strain curves of pure Ti and TiSi2 alloy was similar (
Figure 7) and the slight decrease in compressive strength belonging to TiSi2 alloy was mainly affected by higher volume porosity. However, both samples exhibited high compressive strength (
Table 2) resulting from their microstructure.
The shape of the compressive stress–strain curve of Ti + 40 wt.% PA was typical for highly porous metallic materials. The present pores absorb the applied strain which can be seen as the low increase or almost constant stress accompanied by a significant increase in compressive strain (
Figure 7). Tang et al. [
34] presented the deformation course of Ti with 40–70% porosity compared to deformation curve observed for Ti + 40 wt.% PA alloy in this work. The course of the deformation curve belonging to Ti + 30 wt.% PA (
Figure 7) was the same. The increase in compressive strain is also obvious, together with compressive stress, which is associated with lower porosity and pore size for both alloys. In these two cases, the compressive stress–strain tests were stopped manually when the compressive stress increased significantly. Thus, the values of R
p0.2 (yield strength) could be deducted while the values of R
m (ultimate compressive strength) were not listed in
Table 2. All prepared alloys possessed much higher yield strength, compressive ultimate strength and higher or same the value of Young’s modulus than those of porous titanium scaffolds shown in work [
1] and TiAl6V4 scaffolds presented in work [
5]. Nevertheless, the values were too high for human cancellous bone (E = 0.9 GPa and R
m = 22 MPa) [
1], but the obtained modulus generally suits the modulus for cortical bone varying in the range of 10–30 GPa [
16].
The sample Ti + 20 wt.% PA exhibited low plasticity in comparison with samples containing more pores (
Figure 7). However, the fracture could be observed in Ti, Ti + 20 wt.% PA, TiSi2 + 20 wt.% PA and TiSi2 alloy. The deviations of stress were observed on the stress–strain curve of TiSi2 + 20 wt.% PA during loading. It can be assumed that they are caused by the presence of silicides around pores. These silicides could hinder the absorption of loading by pores which influenced the plastic behavior of the material. The unusual large pores also caused very low R
m of TiSi2 + 20 wt.% PA (
Table 2) suggesting the decreasing of Rp
0.2 and E with increasing the porosity (
Table 2).
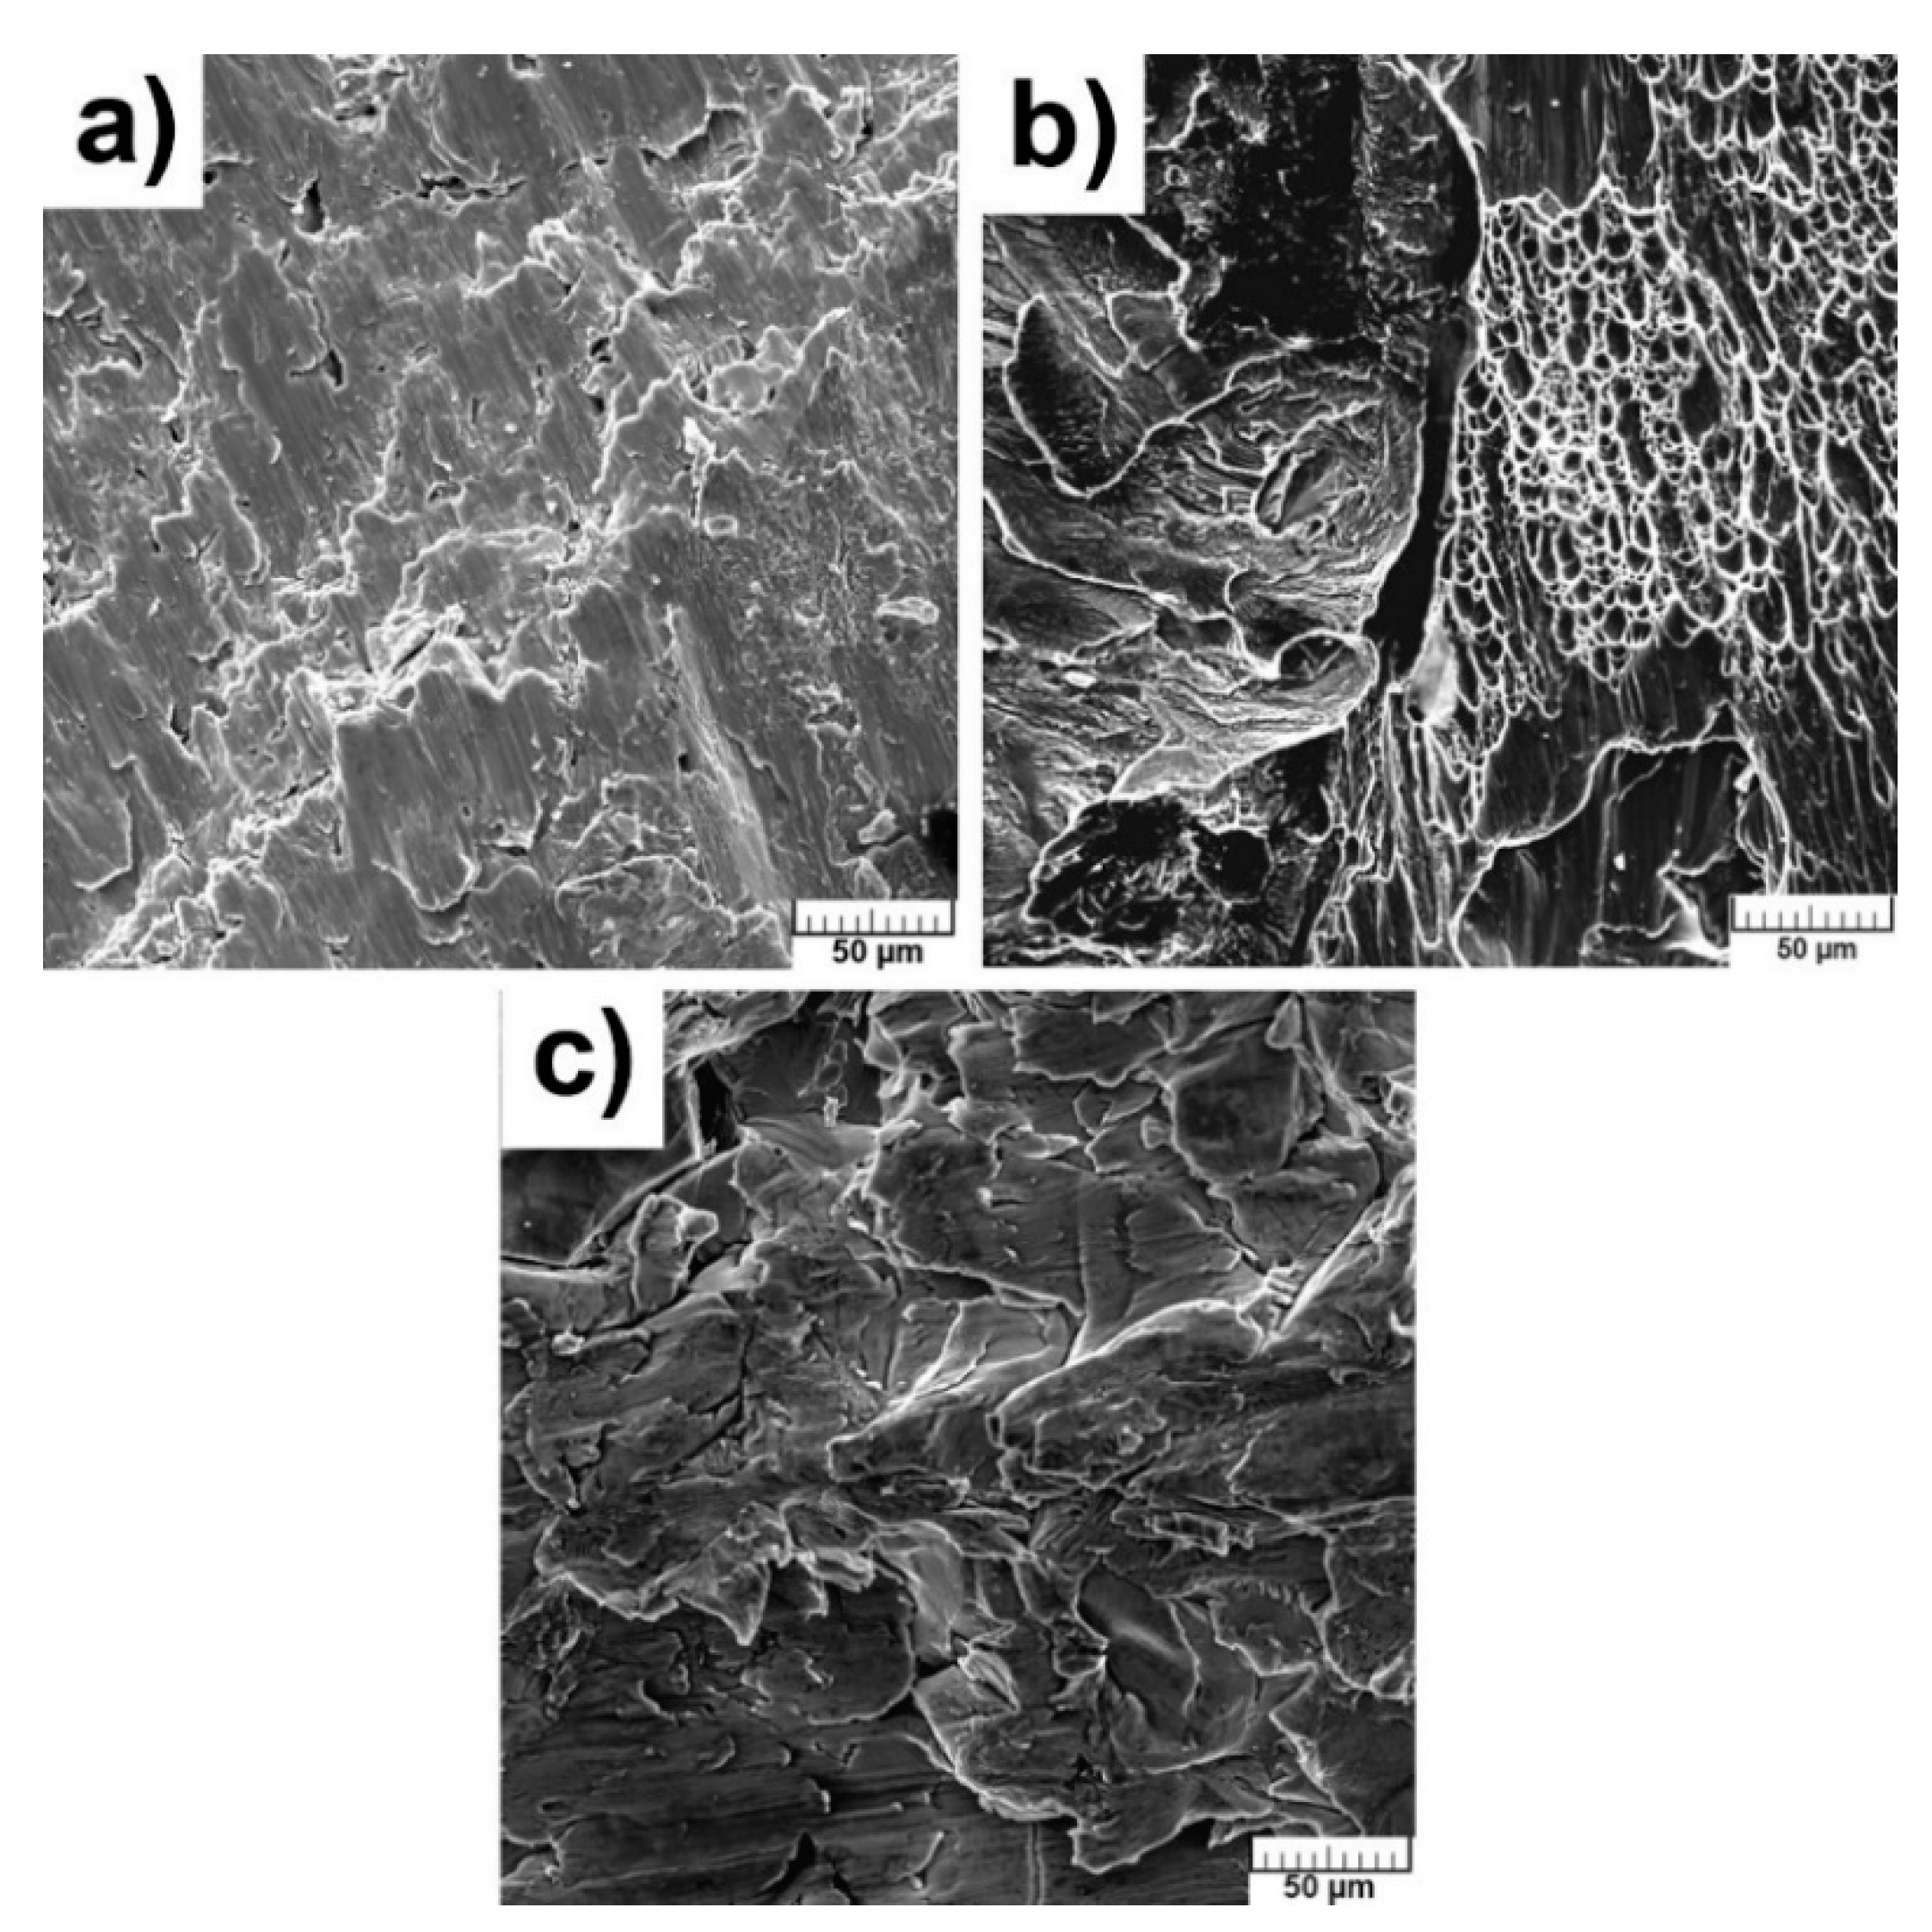
The fractographic characterizations were performed after compressive stress–strain tests to reveal the mechanism of failure and morphologies are shown in
Figure 8a–c. The dimples, meaning the ductile fracture, are obvious only in pure Ti (
Figure 8b). The morphology of fractures of TiSi2 and Ti + 20 wt.% PA alloys did not contain dimples (
Figure 8a,c) but no facets were also observed, so the cleavage fracture could not be considered. However, the courses of obtained curves can be proof of the ductile fracture of studied materials. The fracture took place diagonally suggesting the shear stress acting at the end of measurement due to dislocation slip. The grain boundaries were weakened by the presence of brittle Ti
5Si
3 phase in the case of TiSi2 alloy.
The results obtained by impulse excitation are shown in
Table 3. The value of the Poisson number (µ) of the studied titanium sample is very close to the value of pure titanium (0.32) [
35]. On the other hand, the Poisson number of TiSi2 is the lower which is probably caused by the higher volume porosity and by the presence of silicides.
Table 3 also revealed that porosity has a significant effect on the value of the Poisson number. Its value decreased with the increment of porosity. The shear modulus was calculated from the Poisson number and Young modulus and results are also shown in
Table 3. The calculated value of the shear modulus of studied titanium is close to the value stated for pure titanium, which is approximately 43 GPa [
35]. Because the values of shear modulus are dependent on measured Poisson number and Young’s modulus, the trends between values are the same as mentioned above. The values of modulus of TiSi2, Ti, Ti + 20 wt.% PA samples are satisfied for the using as the trabecular bone replacement [
36]. On the other hand, the values of the modulus of all samples were higher than those of human cancellous bone, although they fulfill the requirements to pore size and porosity (
Table 1,
Figure 5) for human cancellous bone (pore size of 20–1000 µm and porosity 30–95%) [
18]. Obviously, Ti + 30 wt.% PA having volume porosity 35 ± 1%, Young’s modulus 47 ± 1 GPa (from compressive tests) and 9 ± 1 GPa (impulse excitation) is suited as the replacement of human cortical bones [
37]. The elastic modulus of porous alloys strongly depends on the number of pores, the pore size and also the pore morphology [
34] which is reflected by our results in
Table 1 and
Table 3, and confirmed this statement. The different values of Young’s modulus obtained by impulse excitation and from the compressive stress–strain curves are affected by the method of measurement. The samples contained the pores acting as stress concentrator and, thus, they make easier the spreading of crack. The value of Young’s modulus is deducted from the linear part of obtained compressive stress–strain curve. Meanwhile, the samples are not loaded during impulse excitation and, therefore, the present pores do not affect the mechanical properties.
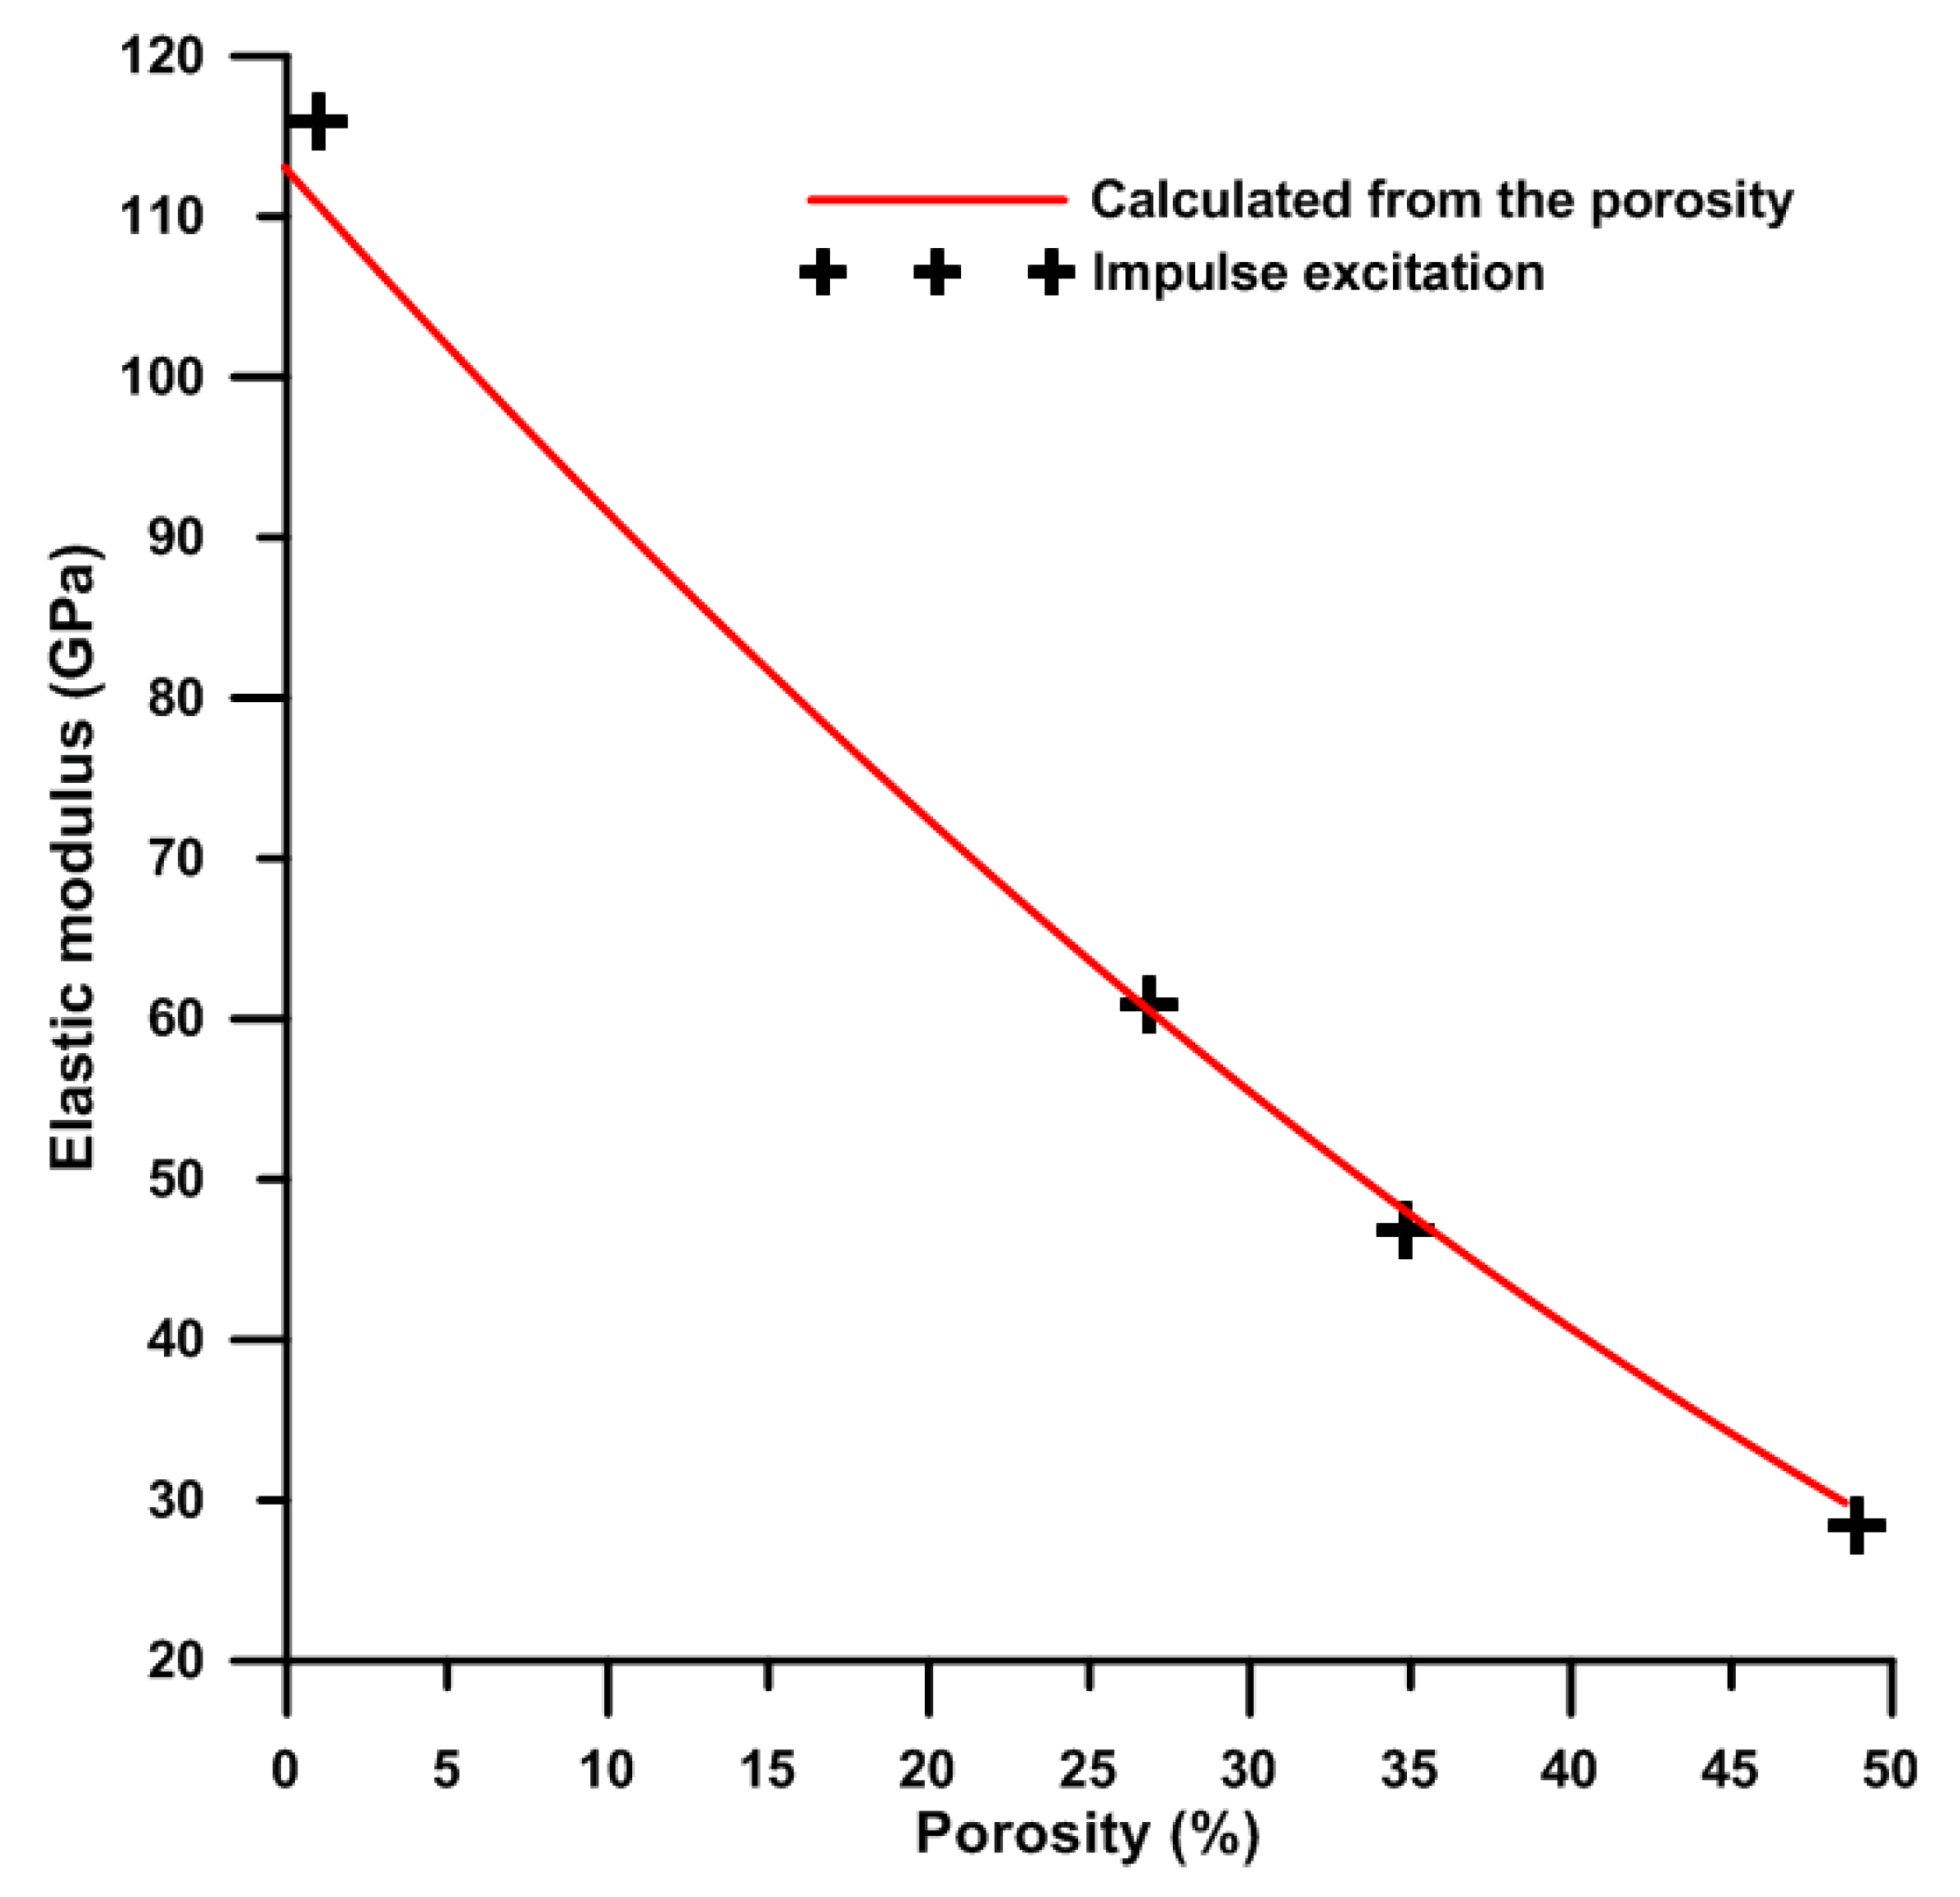
The Young’s modulus obtained from impulse excitation was compared with the theoretical one calculated according to the Gibson–Ashby model [
18] is expressed by Equation (2):
where E is Young’s modulus for porous titanium, E
0 is Young’s modulus for compact titanium, k is the constant (equal to 1 for metals) and P is the porosity of porous titanium. The value 113 GPa [
35] belonging to pure titanium without pores was considered for calculation. As can be seen, the values obtained from impulse excitation lies on the curve of theoretically calculated values (
Figure 9). This means that the impulse excitation is an accurate method for the determination of the Young’s modulus, unlike the compressive stress–strain tests. Furthermore, for both of the experimental (impulse excitation) and calculated results, Young’s modulus decreases with the increasing porosity (
Figure 9).
The bending strength obtained during three-point flexural tests is listed in
Table 4. Besides the results of compressive stress–strain tests, the bending strength during flexural tests varied in a wide range. The reason lies in the presence of silicides and less the volume porosity. When the TiSi2 + 20 wt.% PA is compared to Ti + 40 wt.% PA with the same volume porosity, the different bending strength is affected by silicides, but increasing porosity decreased the bending strength. The bending strengths were also about 2.5–16 times lower than as-cast TiSi1 in [
21], which can be explained by the presence of pores.

 ,
, 


