Article

Experimental Study of Utilizing Recycled Fine Aggregate for the Preparation of High Ductility Cementitious Composites

1
School of Civil Engineering, Zhengzhou University, Zhengzhou 450001, China
2
School of Water Conservancy Engineering, Zhengzhou University, Zhengzhou 450001, China
3
School of Civil Engineering, Henan University of Engineering, Zhengzhou 451191, China
*
Author to whom correspondence should be addressed.
Materials 2020, 13(3), 679; https://doi.org/10.3390/ma13030679
Submission received: 7 January 2020 / Revised: 24 January 2020 / Accepted: 1 February 2020 / Published: 3 February 2020
(This article belongs to the Special Issue Mechanical Behavior of Composite Materials)

Abstract

:
Waste concrete was recycled and crushed into fine aggregate to prepare a high ductility cementitious composite (HDCC) in this study, for helping dispose the massive amount of construction waste and for reserving natural resources. Firstly, the features of recycled fine aggregate (RFA) were analyzed in detail and compared with natural fine aggregate (NFA). After that, the mechanical properties, including compression, flexure, bending and tension, and the microstructure of high ductility cementitious composite (HDCC) prepared with RFA were systematically investigated and compared with that of HDCC prepared with NFA. The results show that, since RFA has a higher water absorption rate and contains 4.86 times as much crush dust as NFA, HDCC with RFA forms a denser matrix and a higher bond between fiber and matrix than HDCC with NFA. Thus, HDCC with RFA has higher compressive, flexural, bending and tensile strength. Meanwhile, the higher bond between the fiber and matrix of HDCC with RFA and the finer particle sizes of RFA can greatly promote the development of multiple cracking. As a result, HDCC with RFA exhibits more remarkable stain hardening, and presents 182.73% higher peak deflection in bending and 183.33% higher peak strain in tension than HDCC with NFA. Finally, with the consideration of fiber volume fraction, the prediction models for the peak strengths of HDCC with RFA were proposed. The prediction results show a good agreement with the test results.

1. Introduction

Construction and demolition debris contribute a considerable fraction of solid waste, wherein the waste concrete constitutes the largest component with a percentage of about 70% [1]. Most of the construction waste is released in open air or dumped in landfills because of the high disposal costs, thereby causing a scarcity of cultivated lands and severe pollution in the atmosphere, aquifer and soil [2,3,4,5]. In addition, as the most important building material, millions of tons of concrete are produced worldwide each year. The raw materials, such as aggregates, which occupy about 60–75% of total concrete [6], are also consumed in large quantities [4,7]. As an efficient way to reduce damage to the environment and to save non-renewable resources, recycling and crushing the construction waste into recycled aggregate for concrete has attracted much attention [2,8,9,10,11,12]. Recycled coarse aggregate has been studied and applied to roadway construction, concrete pavement and other civil engineering works recently [4,13,14,15,16]. A large amount of fine particles with a maximum size of 0.5 mm has been produced [17] during the production of recycled coarse aggregate. These fine particles called recycled fine aggregate (RFA) have also been investigated a lot. Yang et al. [18] found that the performance of RFA containing crush dust is a significant improvement over traditional RFA with a lower water demand and higher strength of mortar. Lederer et al. [19] reported that the use of crush dust can form a good particle gradation with cement, fly ash and RFA and having a good filling effect, which then increases the compressive strength of mortar. Nili et al. [20] reported that concrete with 50% RFA replacement has reduced compressive strength, tensile strength, and energy absorption. Liang et al. [21] found that the compressive strength and elastic modulus of concrete containing both recycled coarse aggregate and RFA is lower than that of concrete containing natural coarse aggregate and RFA after enduring high temperatures. Evangelista and de Brito [22] demonstrated that the use of RFA up to 30% shows little influence on the properties of concrete.
On the other hand, as conventional concrete hardly satisfies the needs of some high-rise and large-span structures, high ductility cementitious composite (HDCC), which is characterized by strain hardening and multiple cracking, has been developed. HDCC exhibits higher strength, greater strain capacity of 3–5%, lower elastic modulus and more extreme energy absorption ability [23,24,25,26,27,28,29] compared with concrete, and has been widely applied in engineering. Furthermore, HDCC has good durability including high freezing-thawing resistance [30,31] and low water and ion permeability [32,33], thereby making it very suitable for structures in harsh environments. Sand, one of the raw materials of HDCC, is almost exhausted so using RFA as an alternative to sand can effectively alleviate the scarcity of natural resources and expand the application of waste concrete. Li and Yang [34] utilized recycled concrete fines, which was treated according to a modified Fuller’s curve, in order to replace microsilica sand for preparing engineering cementitious composites. The results prove that ECC with recycled concrete fines features a decent tensile strain capacity of several percent. Zhang et al. [35] investigated the flexural and compressive strength of ultra-high performance concrete prepared with RFA and found that the strength decreases as more RFA is introduced but is enhanced by the autoclaved curing. Yu et al. [36] added recycled fine powder to replace cement to prepare ultra high performance-engineering cementitious composites and demonstrated that recycled fine powder has an accelerating effect on the hydration of the matrix and can significantly reduce the autogenous shrinkage of UHP-ECC. However, according to the Fuller’s curve treatment, the fine particles from crushed waste concrete need to be separated by multiple screens and then remixed by specified weight. Meanwhile, meeting Fuller’s curve requires a higher proportion of crush dust, which means that more waste concrete needs to be crushed. In addition, the behavior under bending and tension of HDCC prepared with 100% RFA has not been studied in detail.
In this study, RFA was obtained by sieving the crushed waste concrete particles with only one screen of 1.18 mm. In other words, RFA with a maximum particle size of 1.18 mm and original particle size distribution was employed as the substitute of natural fine aggregate (NFA) in the preparation of HDCC. We expect to achieve two goals in this way, one is reducing the steps and dust pollution in the raw materials process, and the other is that HDCC with great bending and tensile behaviors can be prepared. The features of RFA were analyzed in detail and compared with NFA. Then, the mechanical properties of HDCC prepared with RFA (named R-HDCC in this study), including compression, flexure, bending and axial tension, were systematically investigated and compared with those of HDCC prepared with NFA (named N-HDCC in this study). The microstructure investigations of two kinds of aggregates and HDCCs were conducted to provide the arguments for mechanical analysis. Moreover, with consideration of fiber volume fraction, the prediction models for the peak strengths of R-HDCC were put forward, providing the basis for preliminary design and application.

2. Experimental Program

2.1. Materials

Ordinary Portland cement 42.5R and GradeⅠFly ash obtained from Hejin power plant (Shanxi province, China) were used in this work. Their chemical compositions are listed in Table 1. The manufacturing process of RFA includes four steps: (1) collect the waste concrete, (2) crush the waste concrete using a jaw crusher, (3) further crush the waste concrete using a hammer crusher and (4) sieve the crushed particles to a maximum size of 1.18 mm. River sand with a maximum size of 1.18 mm was used as NFA. The physical properties of polyvinyl alcohol (PVA) fiber are shown in Table 2. Polycarboxylate water reducer produced by the Subote Company was used to control the workability of mixtures.

2.2. Mix Proportion and Preparation of Specimens

The mix proportions are shown in Table 3. Ten groups of prism specimens (25R00-25N20) with the dimension of 40 mm × 40 mm × 160 mm (Width × Height × Length) were prepared to conduct the three-point flexural test and compressive test. Ten groups of slab specimens (25R00-25N20) with dimensions of 400 mm × 100 mm × 15 mm (Length × Width × Height) were prepared to carry out the four-point bending test. Ten groups of dog bone specimens (45R00-45N20) were prepared for the axial tensile test. The specific dimension of the dog bone specimens is shown in Figure 1. All specimens were prepared by the following procedure: solid raw materials including cement, aggregate and fly ash were added into the mixer together and stirred slowly for about 2 min. After that, the liquid including water and the water reducer was slowly added into the mixer and continuously stirred. When the fresh mortar was uniform, the fibers were added and mixed for 2 min, and then stirred with a high speed to increase the dispersion of fibers. Finally, the mixtures were poured into the steel molds and then vibrated on a vibrating table for 30 s. The specimens were cured for 24 h in the standard curing chamber (20 °C, RH ≥ 98%) before demolding. After demolding, all the specimens were cured in water (20 °C) until 28 days.

2.3. Test Method

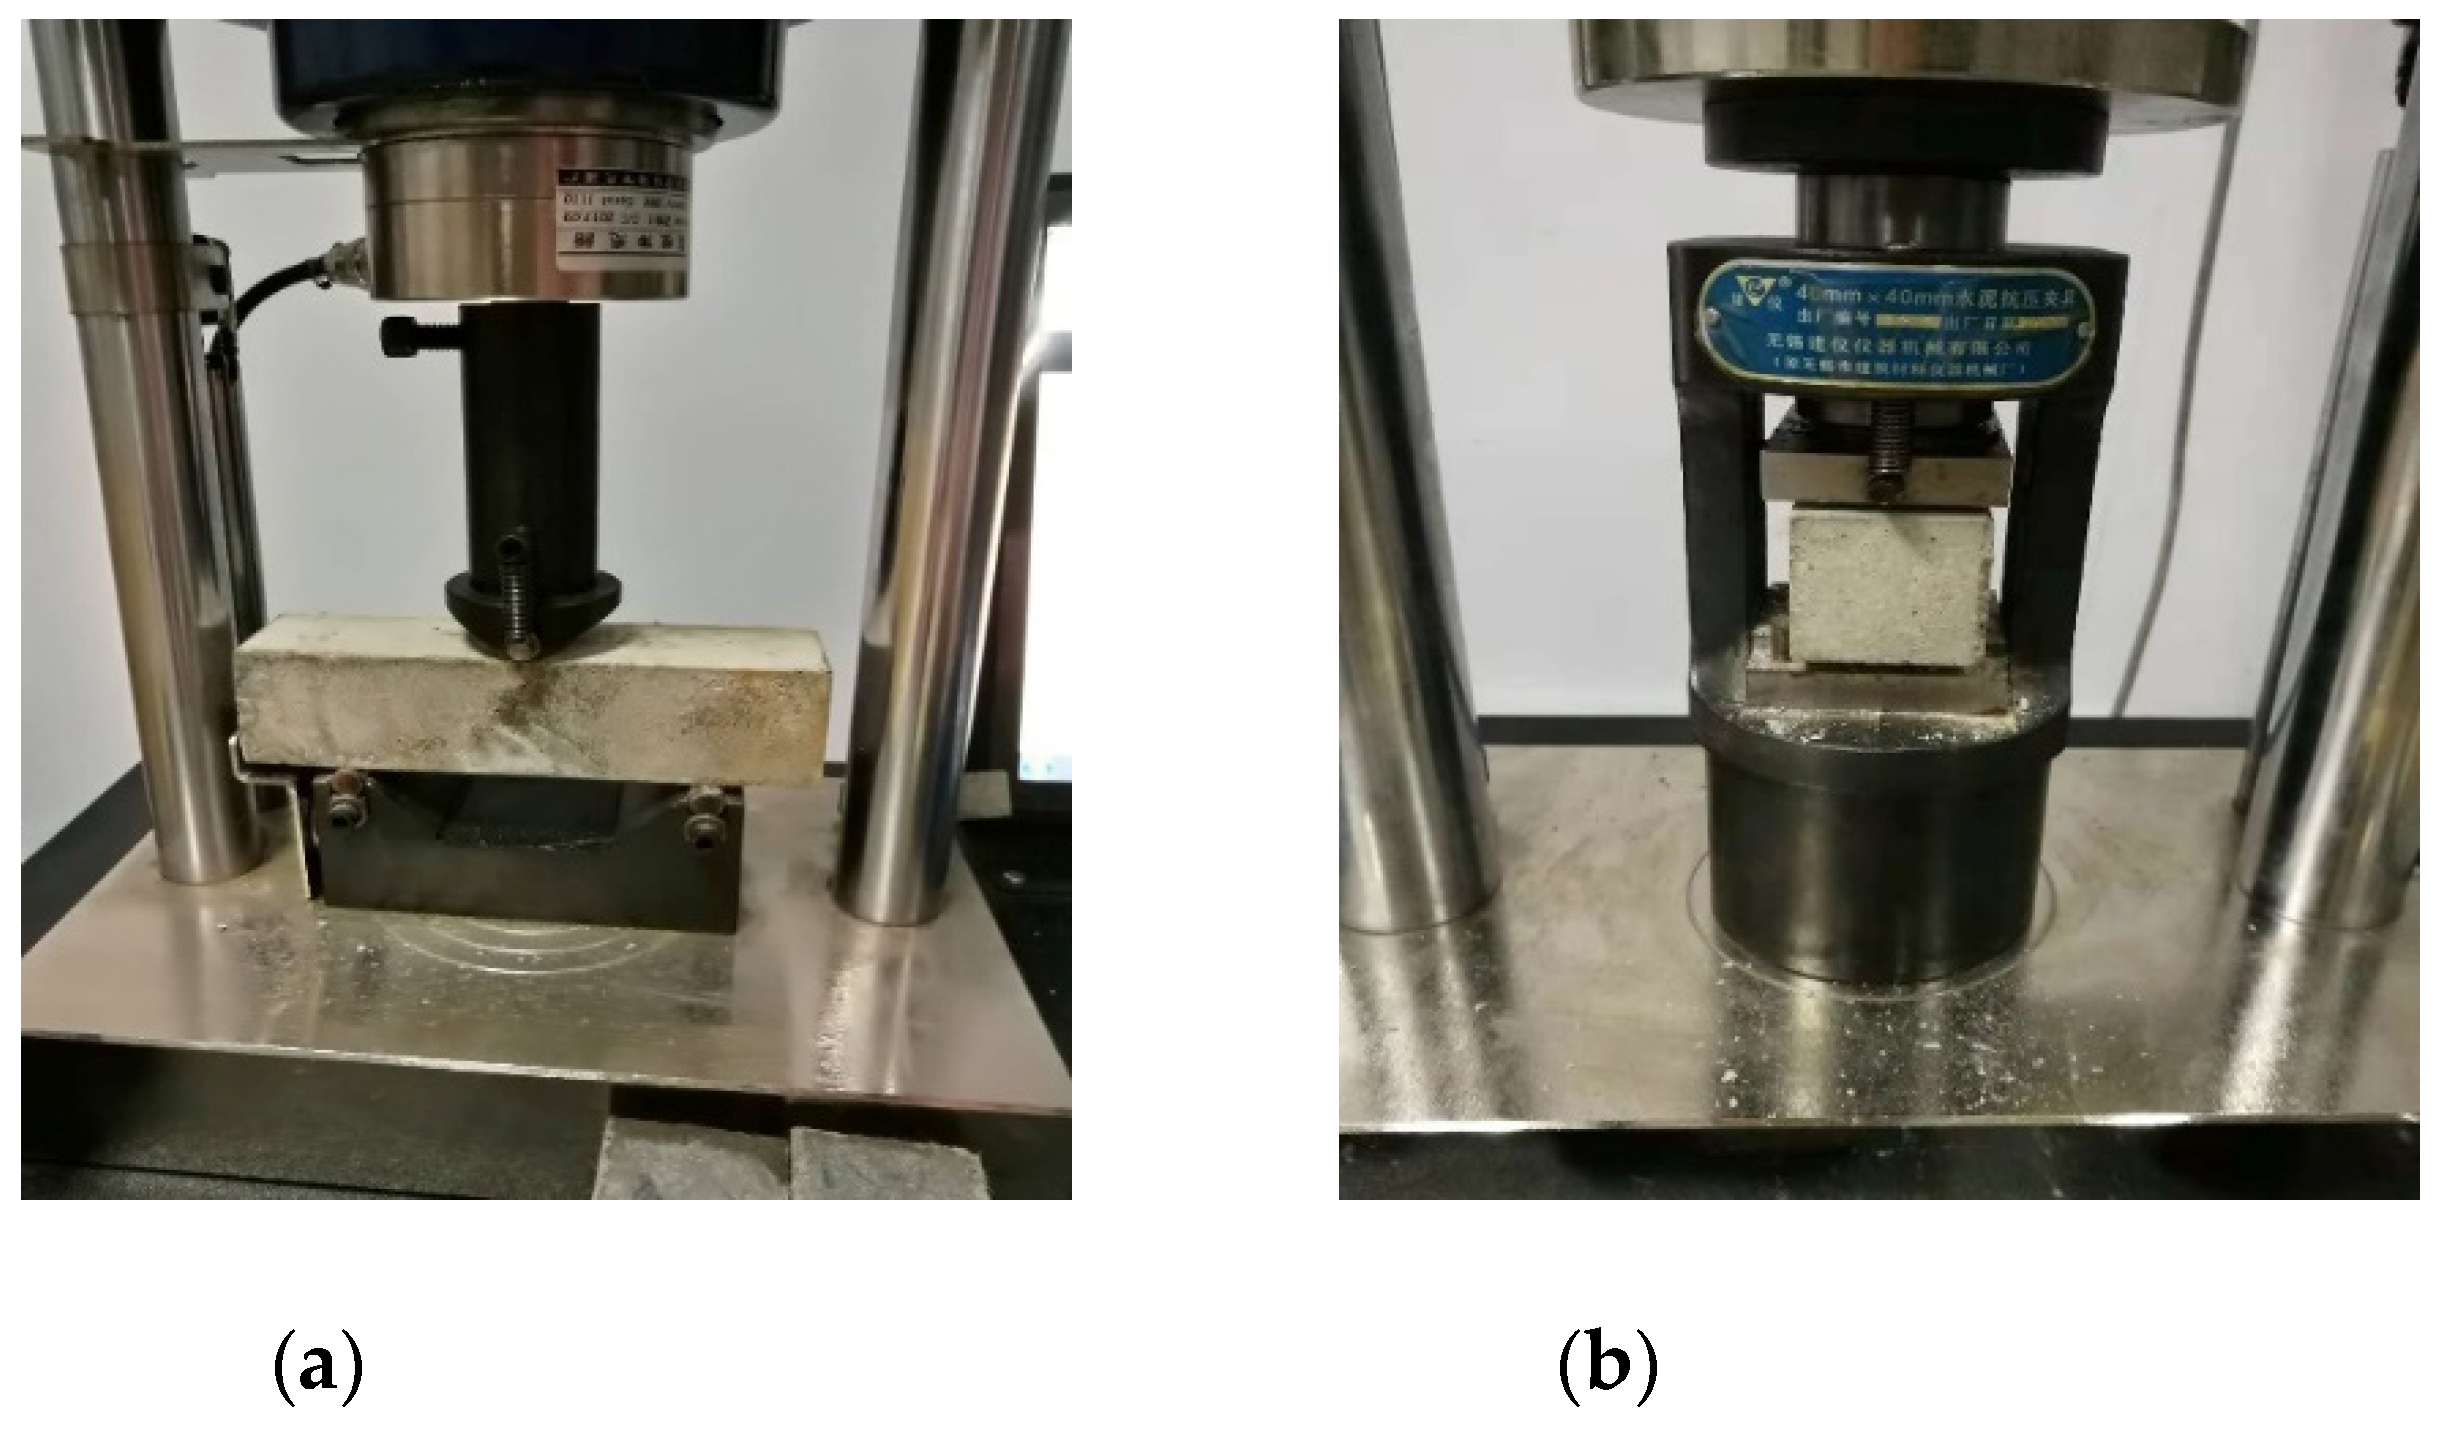
2.3.1. Flexural and Compressive Strength Test

The three-point flexural test and compressive test were conducted on a universal testing machine (Wuxi Construction Instrument Manufacturing, Wuxi, China) of 300 kN capacity according to Chinese Standard GB/T17671-1999, as shown in Figure 2. First, the prism specimen with the span length of 100 mm was loaded in the middle span to measure the flexural strength (Figure 2a). The loading rate was 50 N/s. Afterwards, the two parts of each fractured prism specimen were placed on the test setup with an area of 40 mm × 40 mm (Figure 2b) to test compressive strength at a loading rate of 2.4 kN/s. The average flexural strength and compressive strength were determined by the three samples of each group.

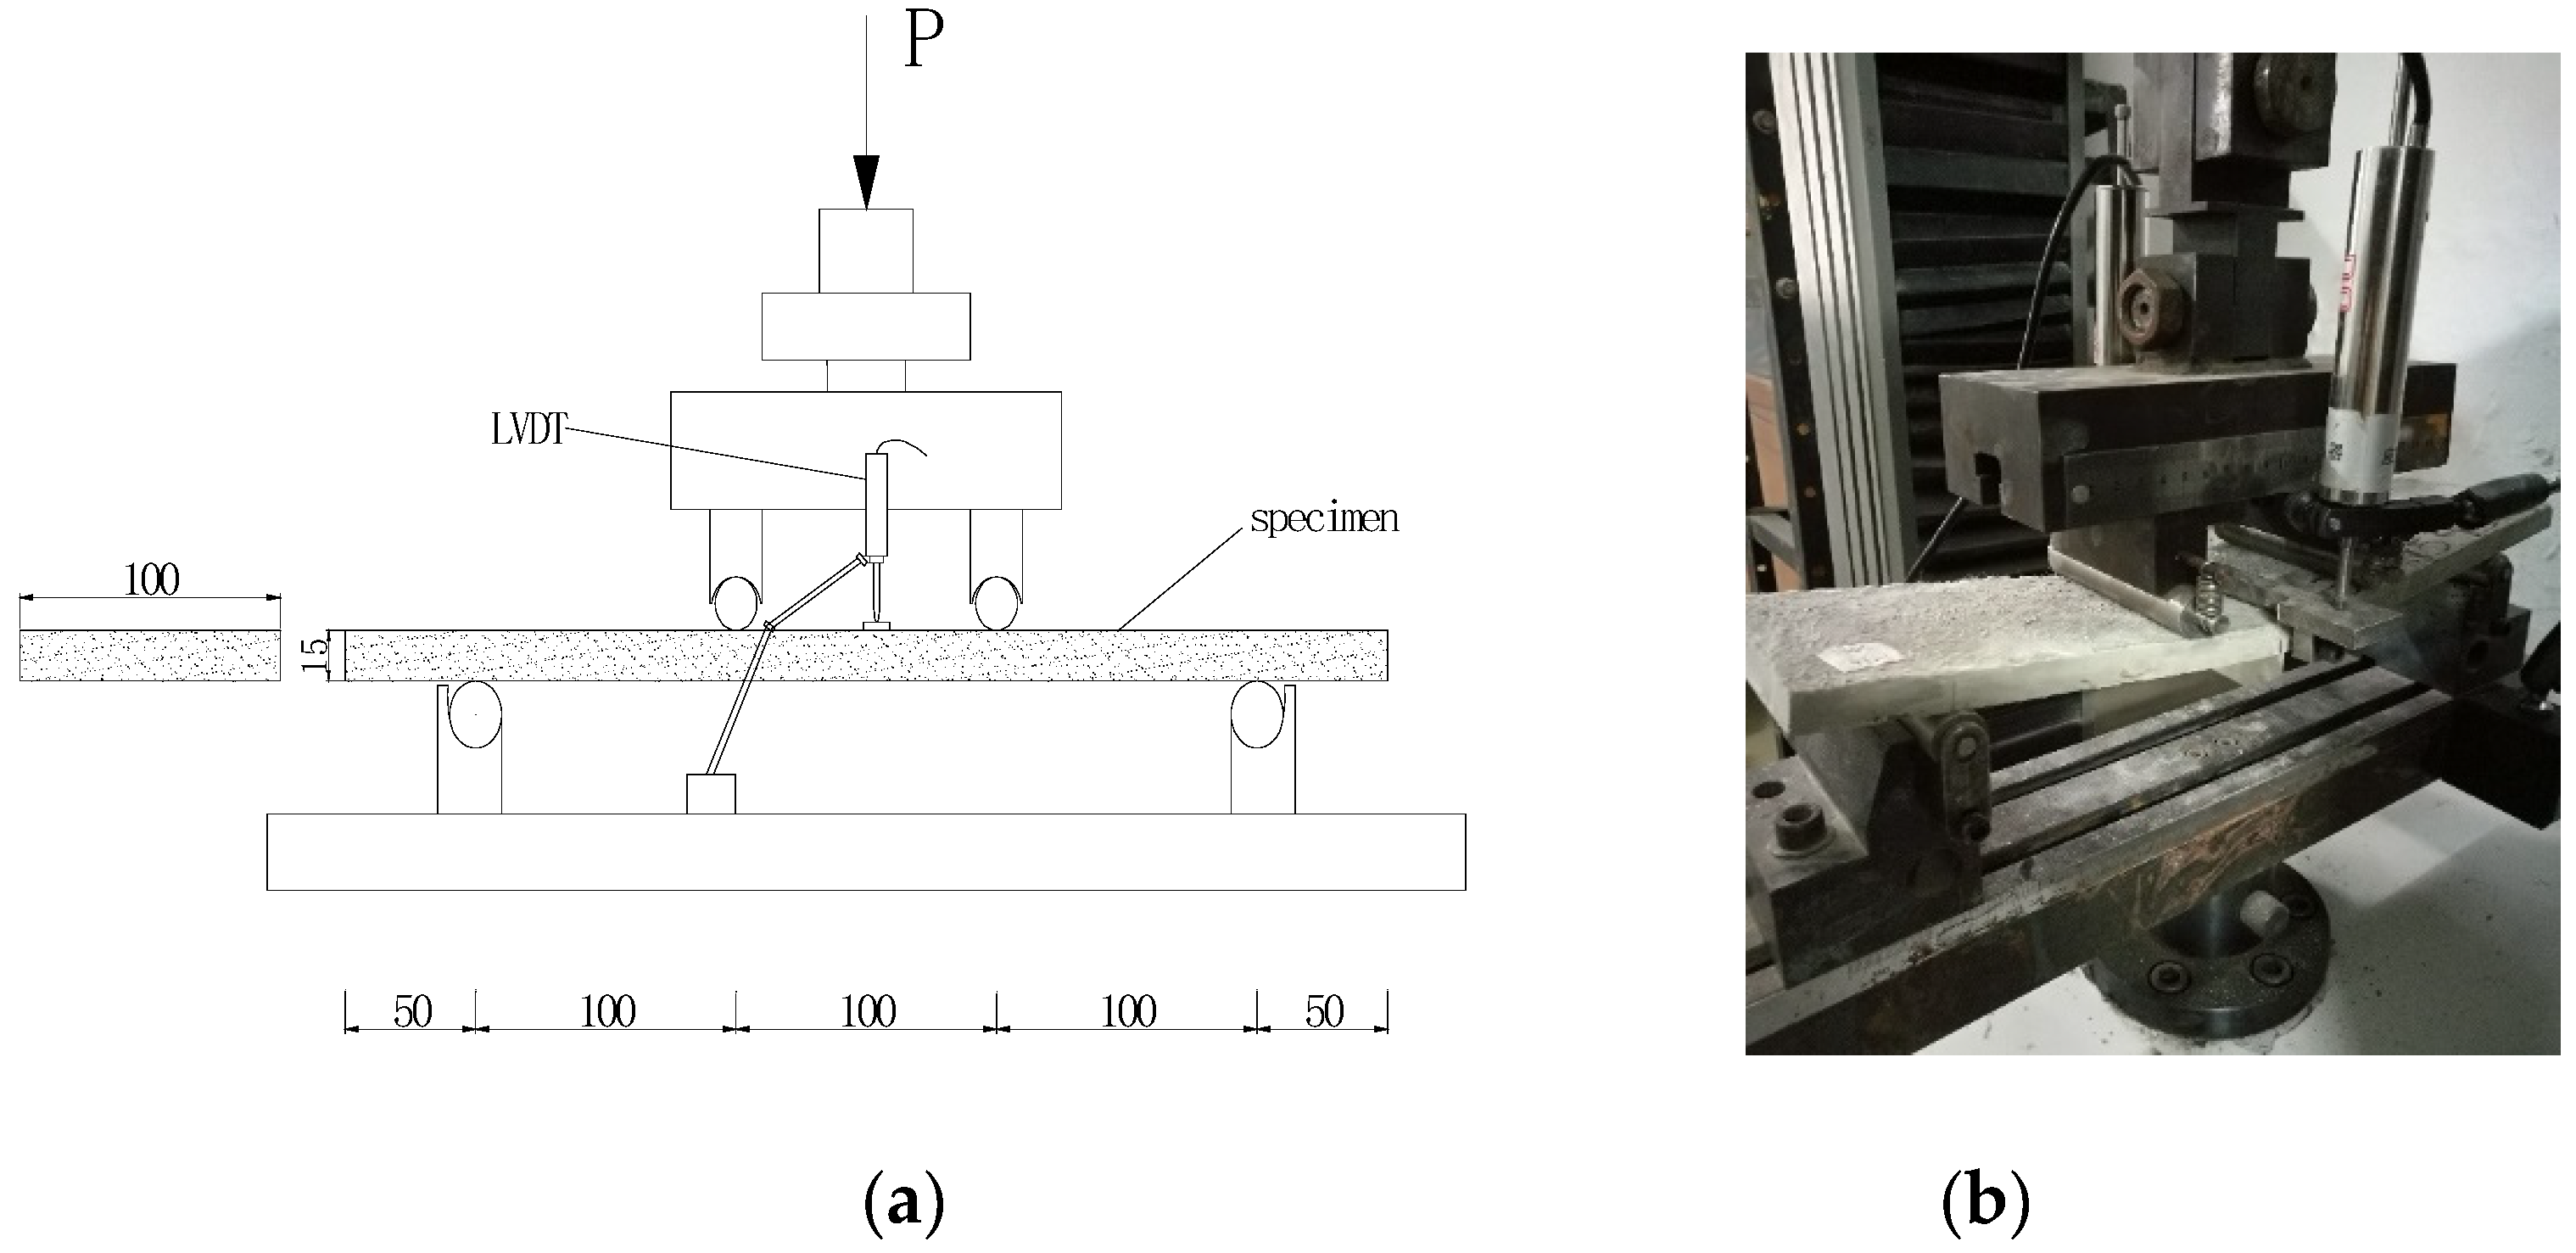
2.3.2. Four-Point Bending Test

The four-point bending test was conducted on an electronic universal testing machine (SANS, MTS Industrial systems (China), Shenzhen City, China) of 50 kN capacity. The span of 300 mm was equally divided into three parts. The loading was controlled by displacement with a rate of 0.1 mm/min. Two linear variable displacement transducers (LVDTs) were mounted at the midspan to measure deflection (Figure 3). The readings of load and LVDTs were collected by data logger once per second.
According to ASTM C1018 and ASTM C78 [37,38], the load is transformed into stress by Equation (1). The point in the stress-deflection curve, where the curve begins to become nonlinear, is recorded as the first crack point, and the stress and deflection corresponding to it are defined as first crack stress σbc and first crack deflection δbc, respectively. The maximum bending stress in the curve is defined as peak stress σbp, and the deflection corresponding to it is defined as peak deflection δbp. The maximum deflection is defined as ultimate deflection δbu. The area under the whole load-deflection curve is defined as bending fracture energy Gb. The test results are the average of three samples.
σ = P L b d 2 ,
where: σ is the bending stress, P is the applied load, L is the span length, b is the width of the specimen and d is the depth of the specimen.

2.3.3. Axial Tensile Test

The axial tensile test was conducted on the MTS universal testing machine with a loading rate of 0.001 mm/s. Four clip extensometers were mounted at the middle segment of the specimen to measure the longitudinal and transverse elongation (Figure 4). The load and deformation were automatically recorded by MTS. The results are the average of valid samples for each series. Only the results of specimens failed in the gauge length and without eccentricity were employed. In this case, at least two results should be valid and the deviation should be less than 30% for each series; otherwise, the test of this series was repeated.
The load and deformation are transformed into stress and strain by Equations (2)–(4). The point in the stress-strain curve where the stress starts to drop is termed the first crack point, and the stress and strain corresponding to it are defined as first crack stress σtc and first crack strain εtc, respectively. The maximum tensile stress in the curve is defined as peak stress σtp, and the strain corresponding to it is defined as peak strain εtp. The maximum strain is defined as ultimate strain εtu. The area under the whole load-deformation curve is defined as tensile fracture energy Gt.
σ = P A
ε l = l l L l 0
ε t = l t L t 0 ,
where σ is the tensile stress, εl and εt is the longitudinal and transverse strain, P is the tensile load, A is the cross-section area in the middle of specimen (40 mm × 40 mm), ll and lt is the longitudinal and transverse deformation, Ll0 and Lt0 is the gauge length of longitudinal (50 mm) and transverse (25 mm).

2.3.4. Microstructure Analysis

The mineral phases of RFA and NFA were detected using X-ray diffraction (XRD) (PANalytical X’Pert3 Powder, Netherlands, Cu-Kα, voltage 40 kV, current 40 mA, scan speed 0.04 s/step, step size 0.013°). The defects of two kinds of high ductility cementitious composites suffering from loading were detected using X-ray Computed tomography (CT) (Xradia 410 Versa, ZEISS, Germany). The working voltage and power of the X-ray tube were 140 kV and 10 W, respectively, and the ORS Visual software was used to analyze the test results. The interface between aggregate and cement paste, fiber and matrix after tensile failure of R-HDCC and N-HDCC were obtained by using a scanning electron microscope (SEM) (EVO HD15, ZEISS, voltage 10 kV).

3. Results and Discussion

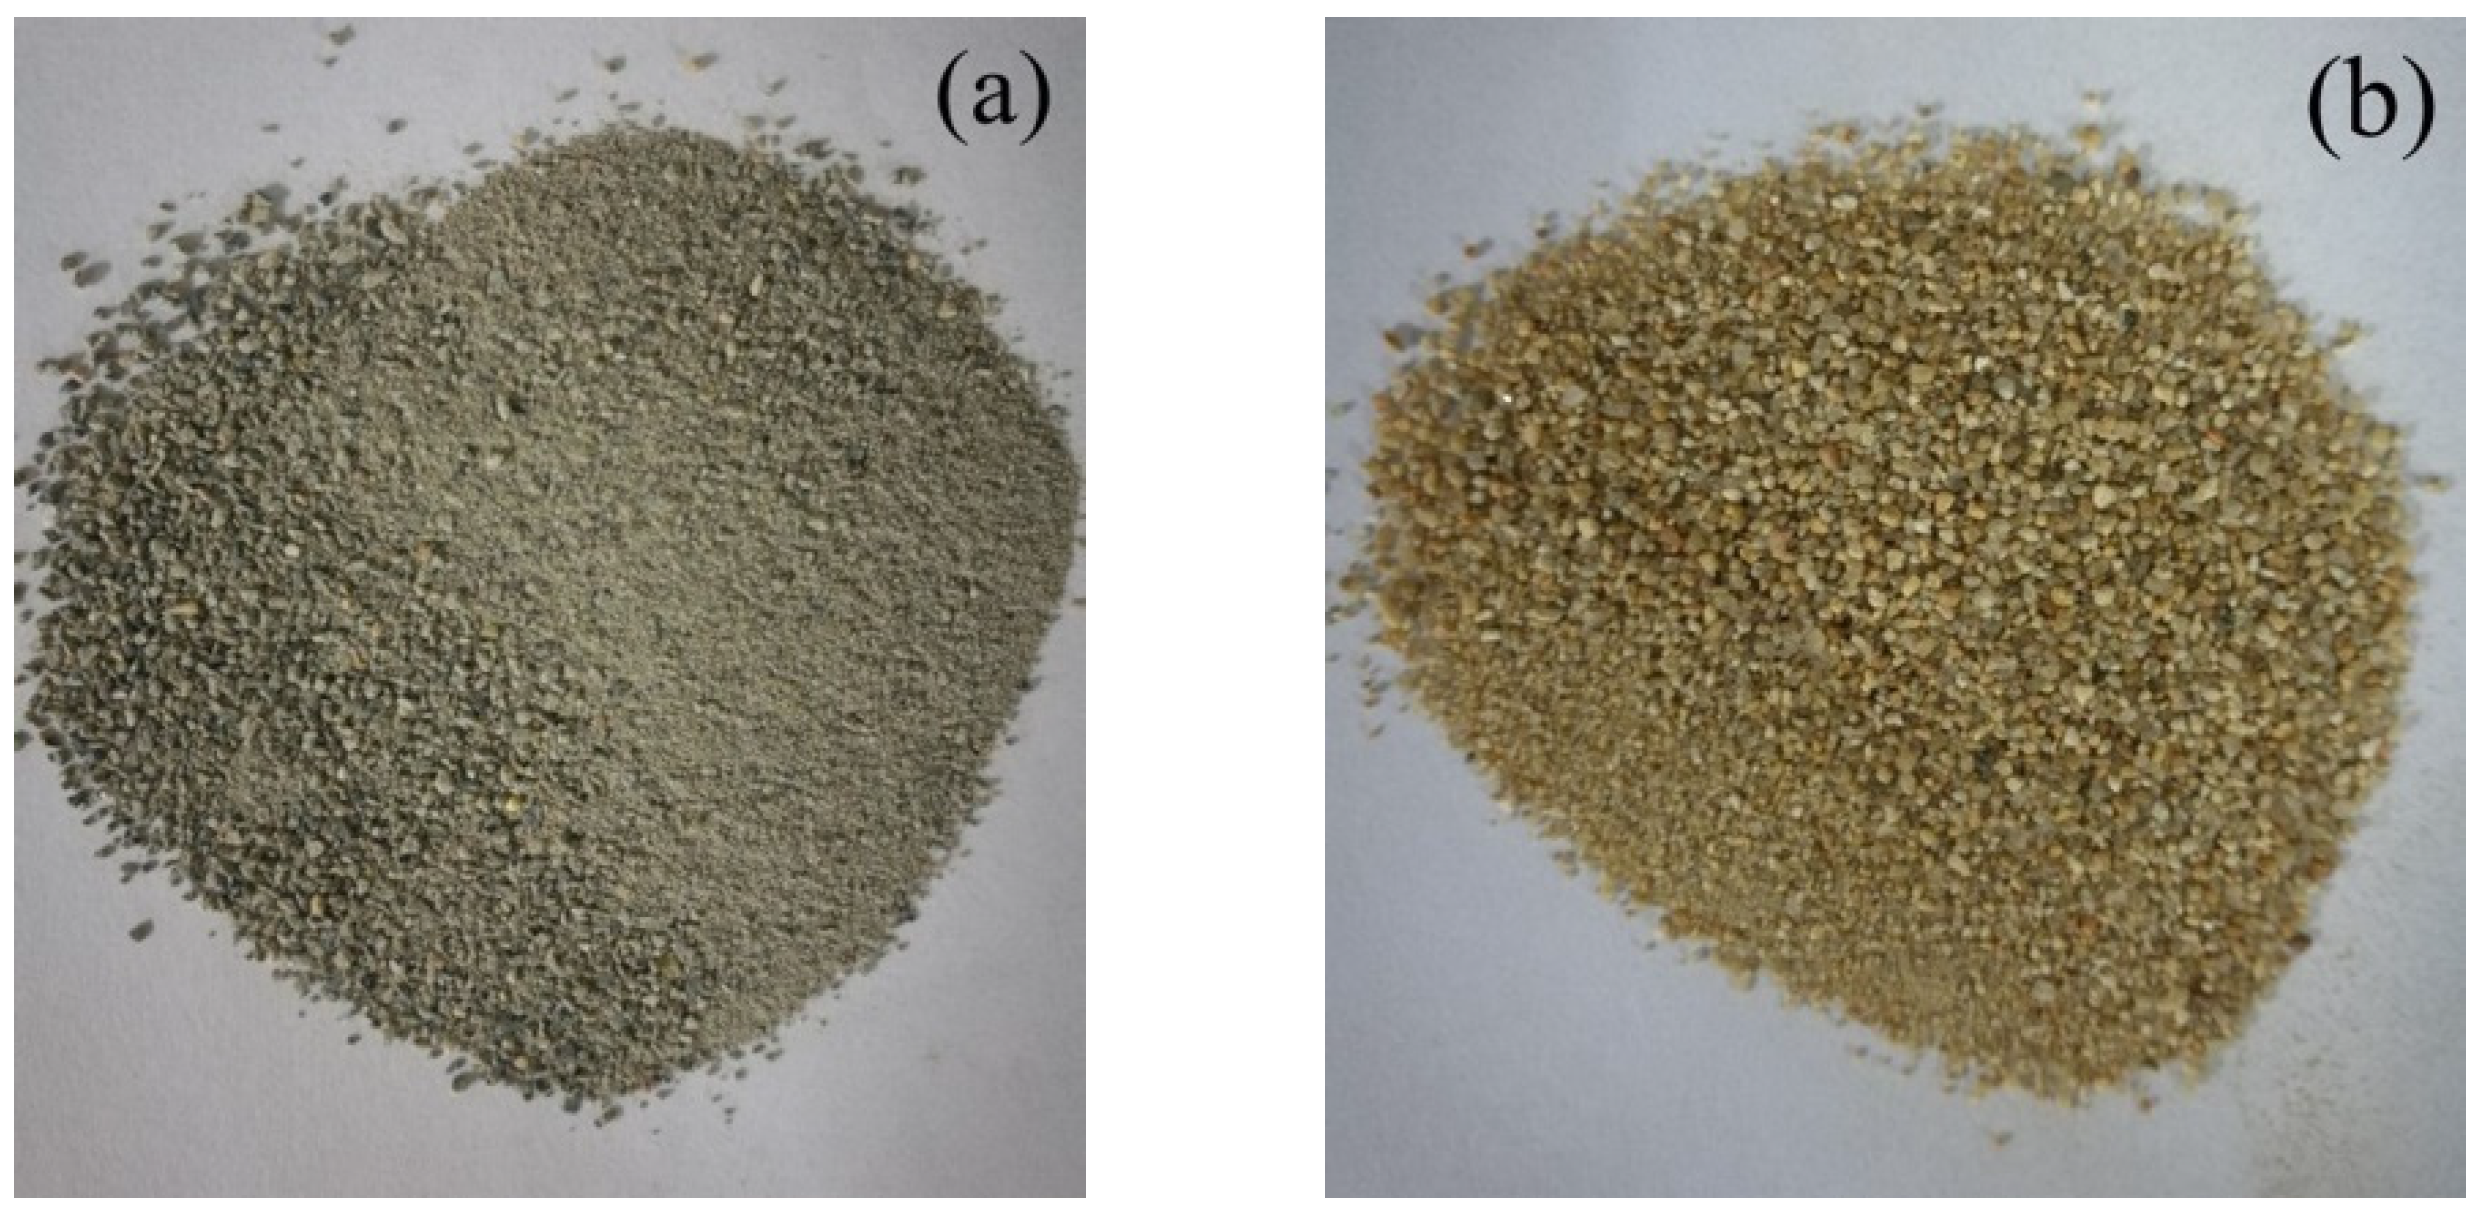
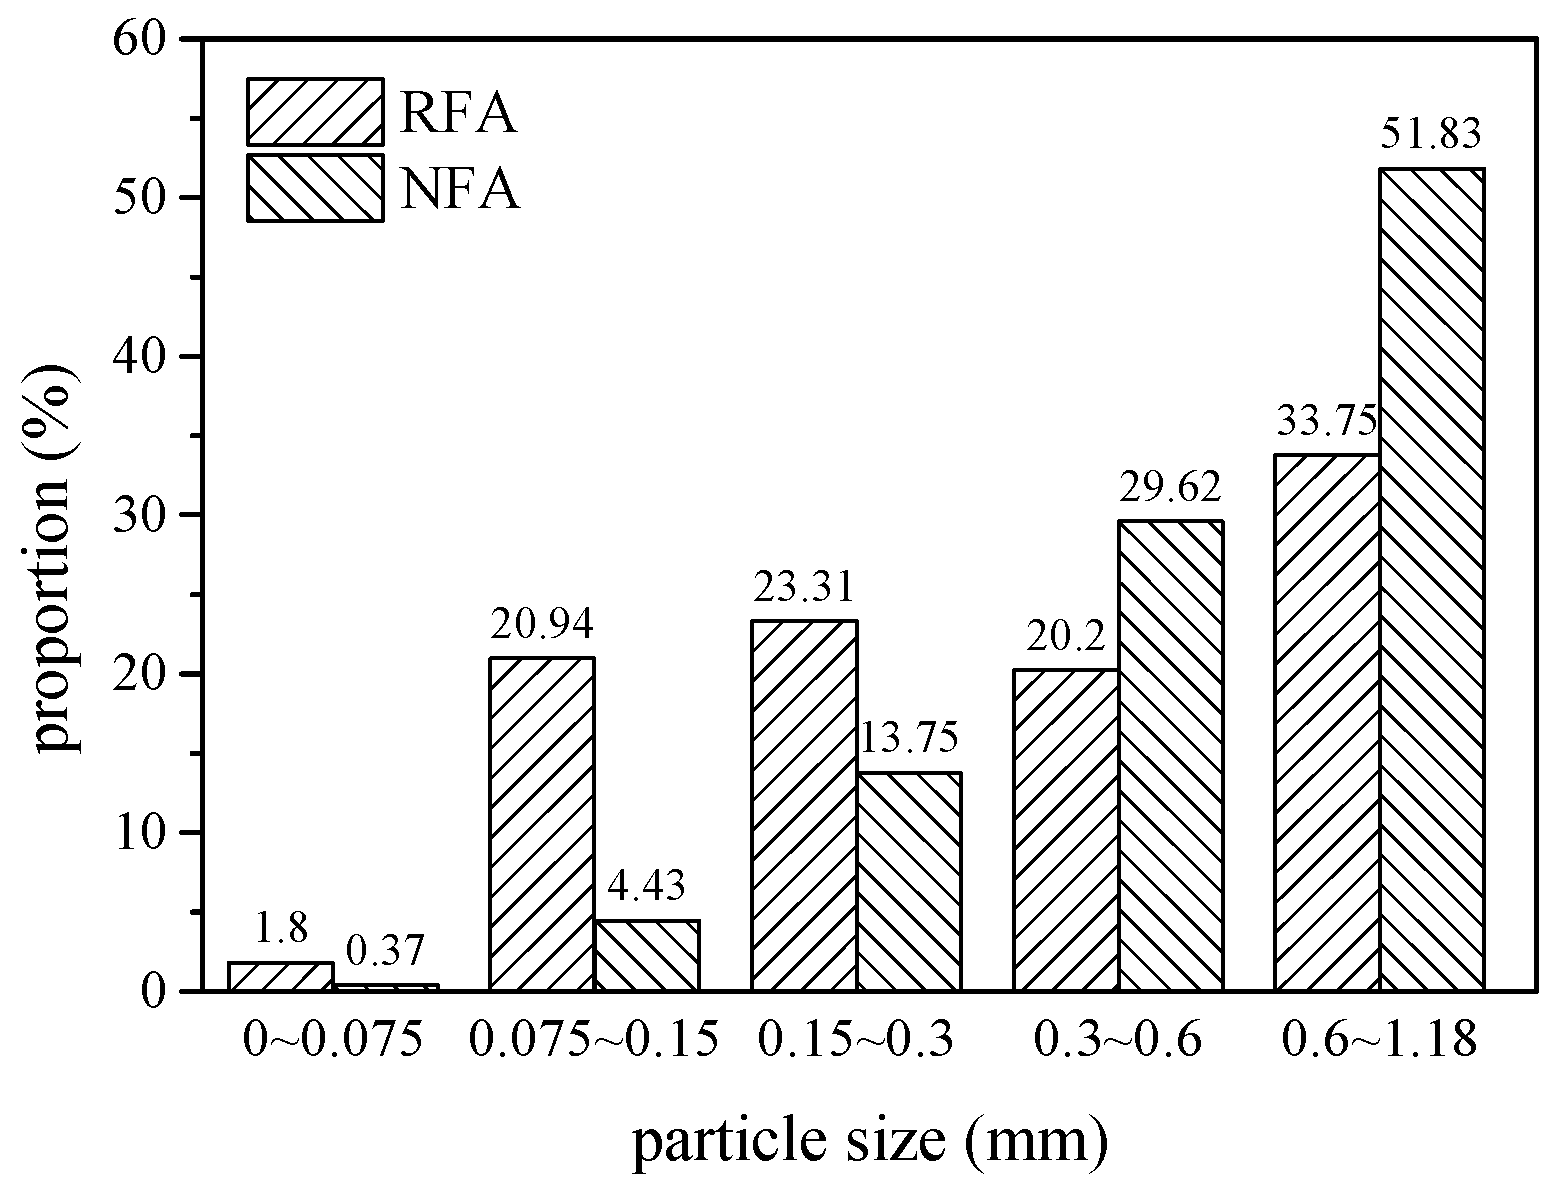
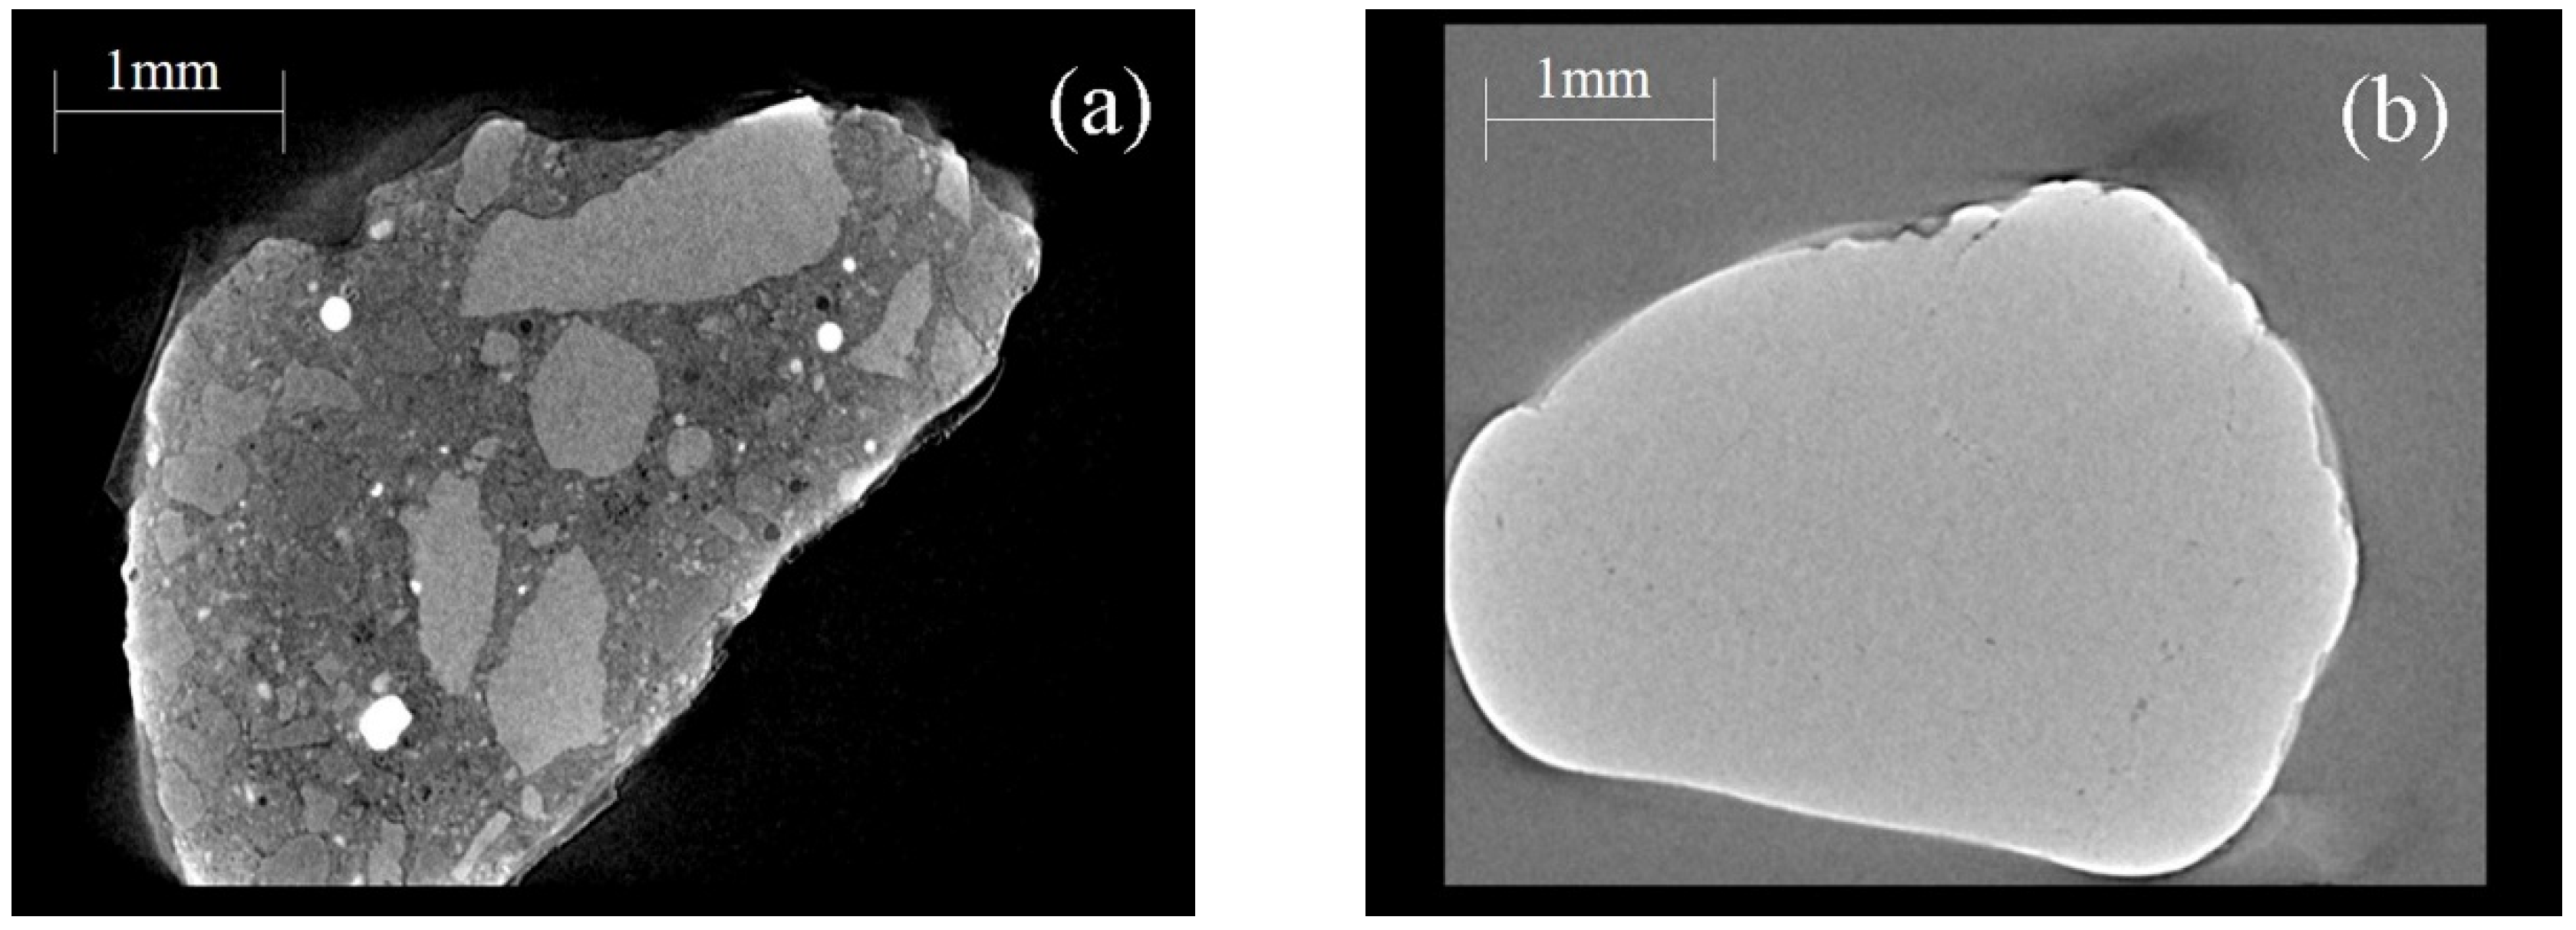
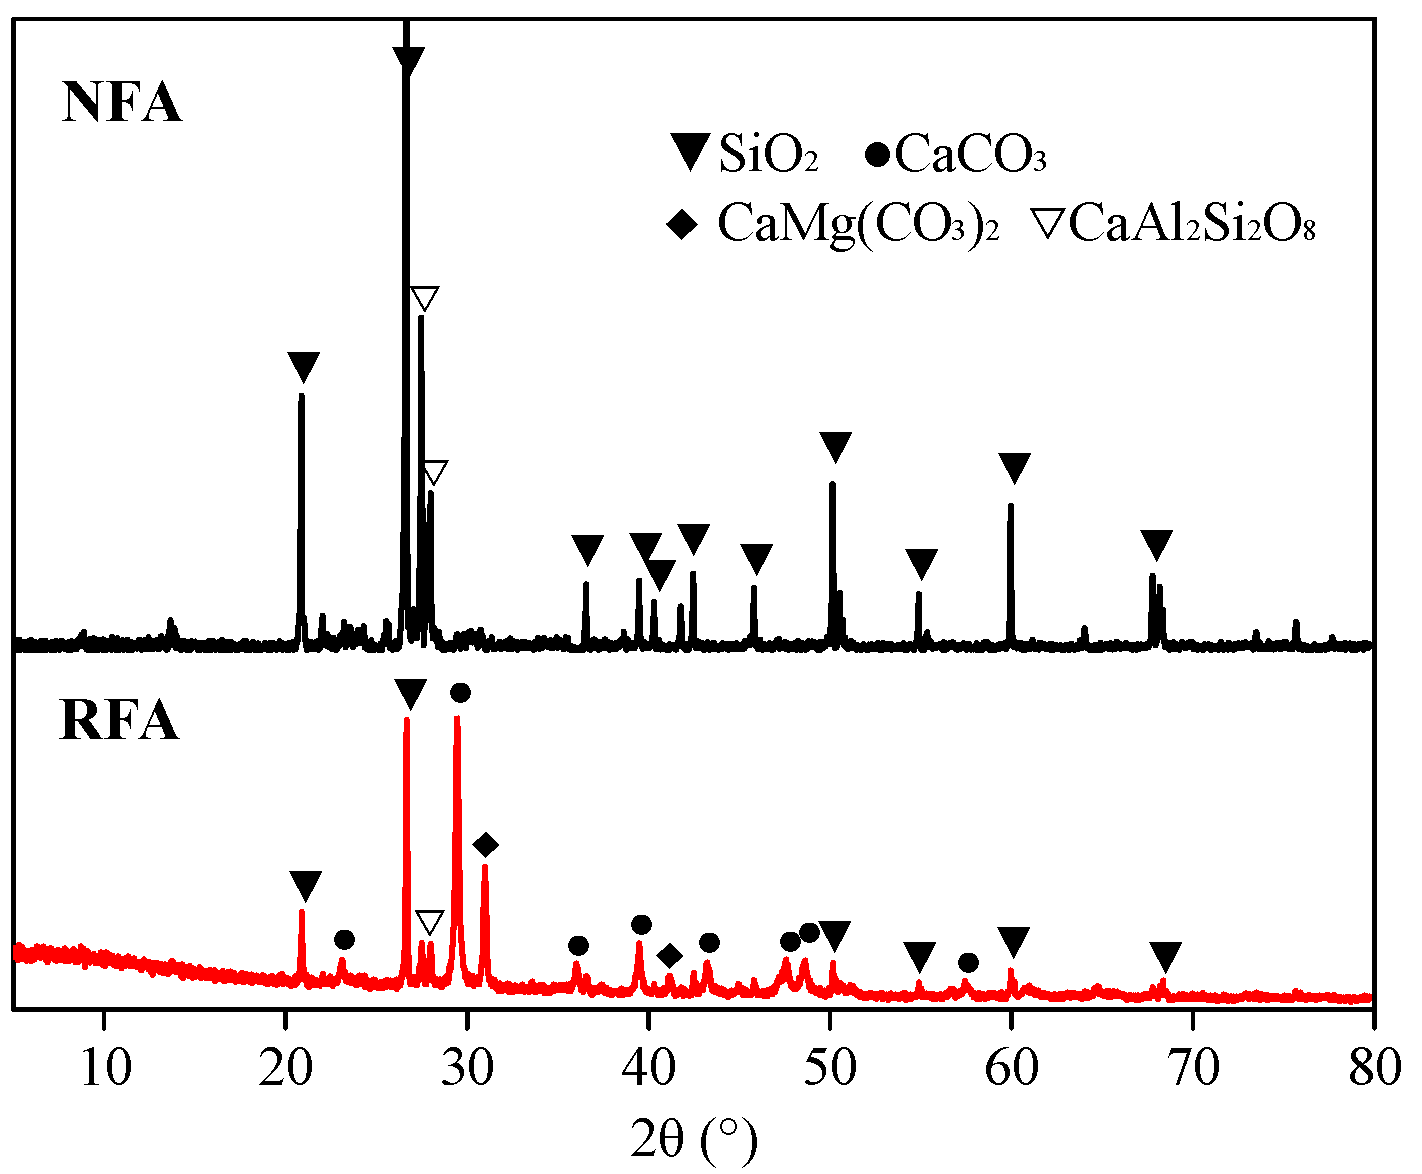
3.1. Properties of RFA and NFA

Figure 5 shows the photos of the two kinds of fine aggregate. As can be seen, the surface of RFA is angular and rough, while that of NFA is comparatively smooth. The particle of RFA is finer than NFA generally, which is proved by the tested particle size distribution, as shown in Figure 6. RFA has scattered particle sizes while NFA particles are mainly concentrated at 0.3~1.18 mm. The particles’ proportions of 0.075~0.15 mm and 0.15~0.3 mm of RFA are 20.94% and 23.31%, which are 372.69% and 69.53% higher than those of NFA, respectively. Furthermore, RFA contains 4.86 times as much concrete crush dust (particles < 0.075 mm) as NFA.
The main physical properties of RFA and NFA, tested according to Chinese Standard GB/T 14864-2011 and GB/T 25176-2010, are listed in Table 4. As can be seen, the bulky density of RFA is 10.34% smaller than that of NFA. The water absorption and crushing index of RFA is high, up to 6.72% and 18.3%, which is 5.69 and 1.43 times of those of NFA, respectively.
Figure 7 shows the CT images. It is found that RFA is a heterogeneous material consisting of NFA, natural coarse aggregate and original cement paste (Figure 7a), while NFA is homogeneous (Figure 7b), which is the main reason for the difference in physical properties between RFA and NFA.
Figure 8 shows the XRD patterns of the two kinds of fine aggregate. RFA primarily consists of SiO2, CaCO3 and CaMg(CO3)2, while NFA is mainly composed of SiO2. The CaCO3 and CaMg(CO3)2 are introduced by the natural coarse aggregate existing in RFA, corresponding well with the CT images (Figure 7). Meanwhile, there is a small amount of CaAl2Si2O8 in both aggregates.

3.2. Compressive and Flexural Strength

The average compressive and flexural strengths of R-HDCC and N-HDCC with different fiber volume fractions (Vf) are presented in Figure 9. With the increasing Vf, both R-HDCC and N-HDCC show an indistinct fluctuation in compressive strength and a significant increase in flexural strength. Moreover, for specimens with 0%, 0.5%, 1.0%, 1.5% and 2.0% fiber, the compressive strengths of R-HDCC are 10.58%, 6.67%, 15.51%, 18.45% and 18.19% higher than those of N-HDCC, respectively, illustrating the higher matrix strength of R-HDCC. This can be attributed to the denser matrix of R-HDCC caused by the following four factors: First, a lot of old cement paste crumbs and concrete crush dusts existing in RFA have a certain activity that can promote hydration; Second, the concrete crush dust can form a good particle gradation with cement, fly ash and RFA, and fill in the interfacial transition zones and the gaps between the cement hydration products, as mentioned by Lederer et al. [23]; Third, RFA possesses a larger proportion of finer particles and rougher surfaces; Fourth, due to the higher water absorption rate of RFA as listed in Table 4, the water on the surface of RFA will be absorbed during the hydration reaction because of the unbalanced pressure inside and outside the RFA. The thickness of water film between the RFA and cement paste is therefore reduced, resulting in a tighter RFA/cement paste interface.
For specimens with 0%, 0.5%, 1.0%, 1.5% and 2.0% fiber, the flexural strengths of R-HDCC are 2.17%, 10.71%, 13.21%, 20.18% and 22.5% higher than those of N-HDCC, respectively. In addition, as Vf increases from 0% to 2%, the flexural strength of R-HDCC increases by 264.89%, while that of N-HDCC only increases by 204.35%, demonstrating the higher enhancement of fibers in R-HDCC. This should be attributed to the higher bond between fiber and matrix of R-HDCC, which is caused by the denser matrix as mentioned above.

3.3. Bending Stress-Deflection Curves

The four-point bending stress-deflection curves of R-HDCC and N-HDCC with Vf varying from 0% to 2.0% are shown in Figure 10a–e, and the bottom surfaces of tested specimens are shown in Figure 11. The performance parameters calculated according to curves are presented in Table 5.
It can be observed that specimens without fiber presented a brittle failure. As shown in Figure 10a, the bending stress-deflection curves of two types of HDCC exhibit a similar shape that tends to be linearly elastic until crack occurs and then the specimen suddenly fractures, as shown in Figure 11. Finally, as compared with N-HDCC (25N00), R-HDCC (25R00) produces a 27.1% increase in bending stress and a 10% decrease in deflection, as presented in Table 5. The fracture energy of R-HDCC is almost no different to that of N-HDCC in this case.
The specimens with 0.5% fibers failed in the ductile mode and the bending stress-deflection curves become fatter (Figure 10b), which reflects a higher ductility compared with the plain mortar. The deflection hardening process does not appear because the maximum fiber bridging stress at this dosage is smaller than the cracking strength of the matrix. The fibers that bridge across cracks are ruptured and the onset of multiple cracking is arrested as depicted by the first cracking strength criterion [39]. Both R-HDCC and N-HDCC present increasing performance parameters with the addition of fiber, as shown in Table 5. Moreover, when Vf = 0.5%, the σbc and σbp of R-HDCC (25R05) are 6.25 MPa and 6.47 MPa, which is 30.75% and 33.68% higher than those of N-HDCC (25R05), respectively. On the contrary, the δbc, δbp, δbu and Gb of R-HDCC are 47.62%, 45.45%, 66.79% and 48.18% lower than those of N-HDCC, respectively. This should be attributed to the higher bond between fiber and matrix as explained in Section 3.2., which makes fibers in R-HDCC easier to rupture. Therefore, the reinforced effects of fibers on the ductility and energy absorption ability of R-HDCC has not been well exploited.
For specimens with Vf ≥ 1.0%, R-HDCC failed with multiple cracking and exhibits an observable deflection hardening; however, this phenomenon of N-HDCC is less remarkable, as shown in Figure 10c–e and Figure 11. Most of the fibers are pulled out and the whole failure process develops as follows: the stress increases in proportion to the deflection until the first crack appears, and continues to increase up to the first peak point, then it drops slightly and immediately rises again through the fiber bridging effect. Once the stress exceeds the matrix cracking strength, new cracks will appear and the stress will decrease slightly again. This process is repeated until the microcracks are saturated. Subsequently, the number of cracks no longer increases, but the width continues to increase. Finally, a localized crack opening occurs at one of the weak sections and the stress decreases continuously, causing the failure of the specimen.
R-HDCC presents many advantages compared with N-HDCC when Vf ≥ 1.0%. First, as shown in Figure 10c–e, the height and plumpness of the whole curves of R-HDCC are much higher than those of N-HDCC, which shows that R-HDCC has higher bending strength and ductility. Second, as presented in Table 5, all performance parameters of R-HDCC are much higher than those of N-HDCC. The δbp of R-HDCC (25R10), especially, is 182.73% higher than that of N-HDCC (25N10) when Vf = 1.0%, and the Gb of R-HDCC (25R20) is 95.22% higher than that of N-HDCC (25N20) when Vf = 2.0%. The higher bond between fiber and matrix interface leads to higher fiber bridging stress, and thus the fiber deformation is larger. Meanwhile, in the condition of strain hardening, the higher bond between fiber and matrix interface can enhance the development of multiple cracking. The lower elastic module of RFA also contributes to the larger deformation of R-HDCC. In addition, it needs less detour for cracks to propagate due to the finer particle size of RFA, as described in Figure 6, which greatly promotes the multiple cracking according to the crack trapping mechanism [23]. As a result, R-HDCC achieves a higher peak load, larger peak deflection and better energy absorption ability than N-HDCC.

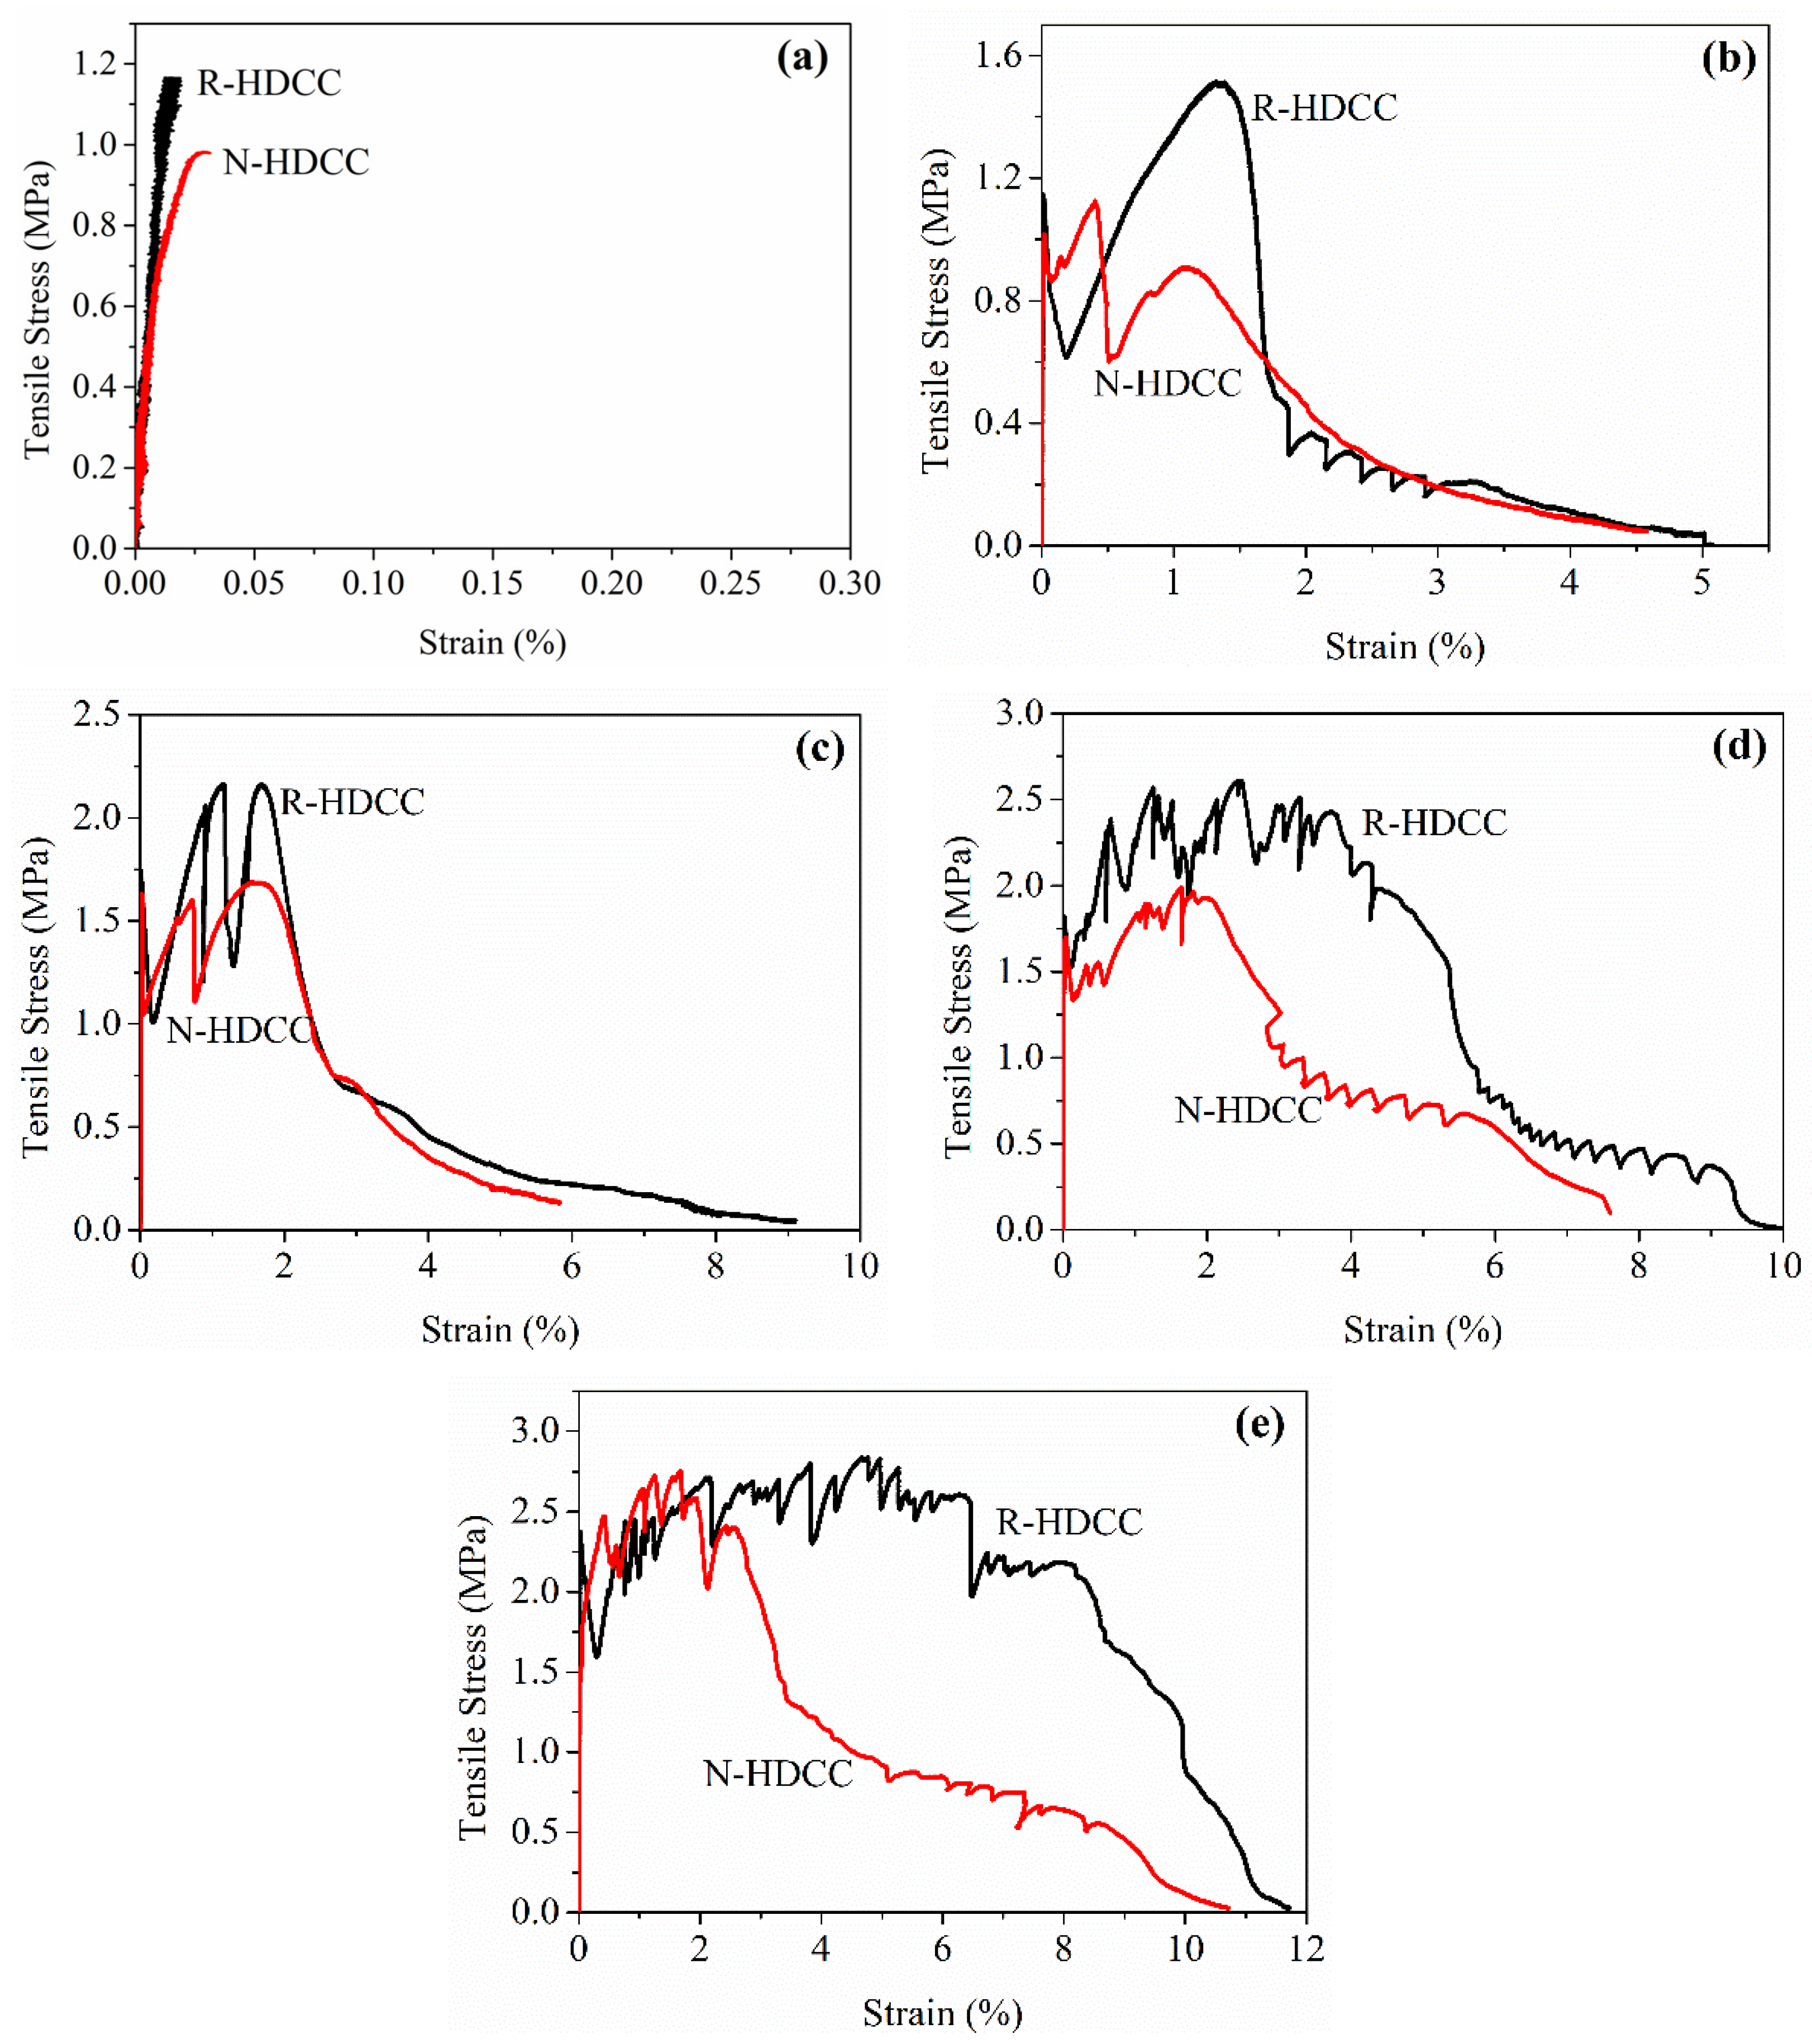
3.4. Axial Tensile Stress-Strain Curves

The tensile stress-strain curves of R-HDCC and N-HDCC with Vf varying from 0% to 2.0% are presented in Figure 12a–e, and the failure modes of specimens are displayed in Figure 13. After the tensile test, the defects including cracks and voids in the gauge length of specimens with Vf = 1.0%~2.0% were scanned by CT, as shown in Figure 14. The tensile properties calculated according to stress-strain curve are listed in Table 6.
For specimens without fibers, the tensile stress increases with the increase in strain until the occurrence of the crack (Figure 12a), and then it was broken into two halves (Figure 13). The σtc and Et of R-HDCC (45R00) are 17.35% and 80.12% higher whereas the εtc and Gt of R-HDCC are 33.33% and 32.11% lower than those of N-HDCC (45N00), respectively, as show in Table 6.
For specimens with 0.5% and 1.0% fiber, both R-HDCC and N-HDCC failed in ductile mode and show a similar stress-strain curve shape that stress exhibits a few fluctuations and then decreases continuously as the crack opening localizes, as presented in Figure 12b,c. For specimens with 1.5% and 2.0% fibers, R-HDCC exhibits an evident strain hardening and failed with apparent multiple cracking. However, N-HDCC only exhibited some fluctuations in curve and several cracks around the major crack, as shown in Figure 12d,e and Figure 13. These phenomena can be demonstrated more intuitive and powerfully by the CT images shown in Figure 14. On the other hand, the void size of R-HDCC is smaller and is distributed in a narrow range compared to that of N-HDCC, which may promote the development of multiple cracking. The whole failure mechanism of the tensile test is similar to that of bending. The results listed in Table 6 indicate that the σtp, εtp, εtu, Et and Gt of R-HDCC increases continuously by 88.08%, 260.60%, 130.91%, 58.74% and 824.84% with Vf increasing from 0.5% to 2.0%, showing the significant enhancement of the fiber. Moreover, all the tensile stress parameters of R-HDCC are higher than those of N-HDCC with corresponding Vf. The σtc of R-HDCC (45R20), especially, is 51.59% higher than that of N-HDCC (45N20) when Vf = 2.0%, and the σtp of R-HDCC (45R15) is 34.82% higher than that of N-HDCC (45N15) when Vf = 1.5%. Similarly, the Et of R-HDCC is generally higher than that of N-HDCC under tensile load. Especially for specimens with 2.0% fiber, the Et of R-HDCC is 20.35 GPa, which is 56.9% higher than that of N-HDCC. Furthermore, R-HDCC with 2.0% fiber exhibits a superior tensile behavior with εtp up to 4.76% and εtu up to 11.73%, which are 2.83 and 1.09 times of those of N-HDCC, respectively. R-HDCC also has a better energy absorption ability with a much higher Gt than N-HDCC, except for specimens without fiber. The νt is in the range of 0.1~0.3 without regular change. It can be concluded that R-HDCC possesses better load carrying capacity, higher ductility and greater energy absorption ability than N-HDCC under axial tensile load. This should be attributed to the same reasons as explained above for bending.
In order to confirm the inferences in mechanical analysis, the interfacial transition zones between aggregate and cement paste, fiber and matrix in R-HDCC and N-HDCC were investigated through SEM after tensile test. As shown in Figure 15, there is nearly no space between RFA and cement paste, while there is an obvious gap between NFA and cement paste, which indicates a tighter RFA/cement paste interface of R-HDCC, corresponding well with the explanation for compressive strength. Moreover, as shown in Figure 16, after being pulled out from R-HDCC, the fibers presented a rough surface with a large amount of hydrated product. Meanwhile, the fibers were so seriously damaged that the surface filaments were stripped and remained in the holes during pull-out, whereas the surfaces of the fibers pulled out from N-HDCC were relatively smooth with few abrasions. This shows that the bond between fibers and matrix in R-HDCC is higher than that in N-HDCC, which shows an agreement with the inferences in bending and tension. All the test results effectively demonstrate that R-HDCC exhibits better mechanical properties than N-HDCC.

4. Prediction of Mechanical Properties

It can be seen in Figure 9a that the fiber content Vf has little impact on the compressive strength fc of R-HDCC. However, the bending peak stress σbp and tensile peak stress σtp of R-HDCC apparently linearly increase with the increase of Vf, as shown in Figure 17. The relations between various peak strengths and Vf were treated by the normalization of the peak stress to eliminate the influence of matrix strength. Then, the prediction models were established by linear regression.

4.1. Bending Peak Strength

From the experimental results shown in Figure 18, the value of σbp/fc of R-HDCC linearly increases with the increase in Vf, thus the relationship between σbp/fc and Vf can be modelled by linear fitting and expressed as Equation (5). The solid line of Equation (5) in Figure 18 shows good agreement with the test results with R2 = 0.948.
σbp/fc= 0.036 Vf + 0.069

4.2. Tensile Peak Strength

The value of σtp/fc of R-HDCC also linearly increases with the increase of Vf as shown in Figure 19. The relationship between σtp/fc and Vf is modelled by linear fitting and expressed as Equation (6). The solid line of Equation (6) in Figure 19 shows good agreement with the test results with R2 = 0.967.
σtp/fc = 0.025 Vf + 0.026
In addition, the values of σbp/fc also show a good linear relationship with σtp/fc, as shown in Figure 20 and modelled as Equation (7). The solid line of Equation (7) in Figure 20 shows good agreement with the test results with R2 = 0.966.
σtp/fc = 0.668 σbp/fc ‒ 0.02

5. Conclusions

RFA with original particle size distribution was used to fully replace NFA to prepare HDCC in this study. The features of RFA and NFA were tested in detail. The mechanical properties and interface microstructure of HDCC prepared with RFA and NFA were investigated and compared, and the following conclusions can be drawn:
(1)
RFA with original particle size distribution contains 4.86 times as much concrete crush dust as natural fine aggregate. The dust supplies a certain activity and a good filling effect in matrix. Coupled with the higher water absorption rate of RFA, HDCC with RFA forms a denser matrix. Thus, HDCC with RFA exhibits a higher compressive strength than HDCC with NFA.
(2)
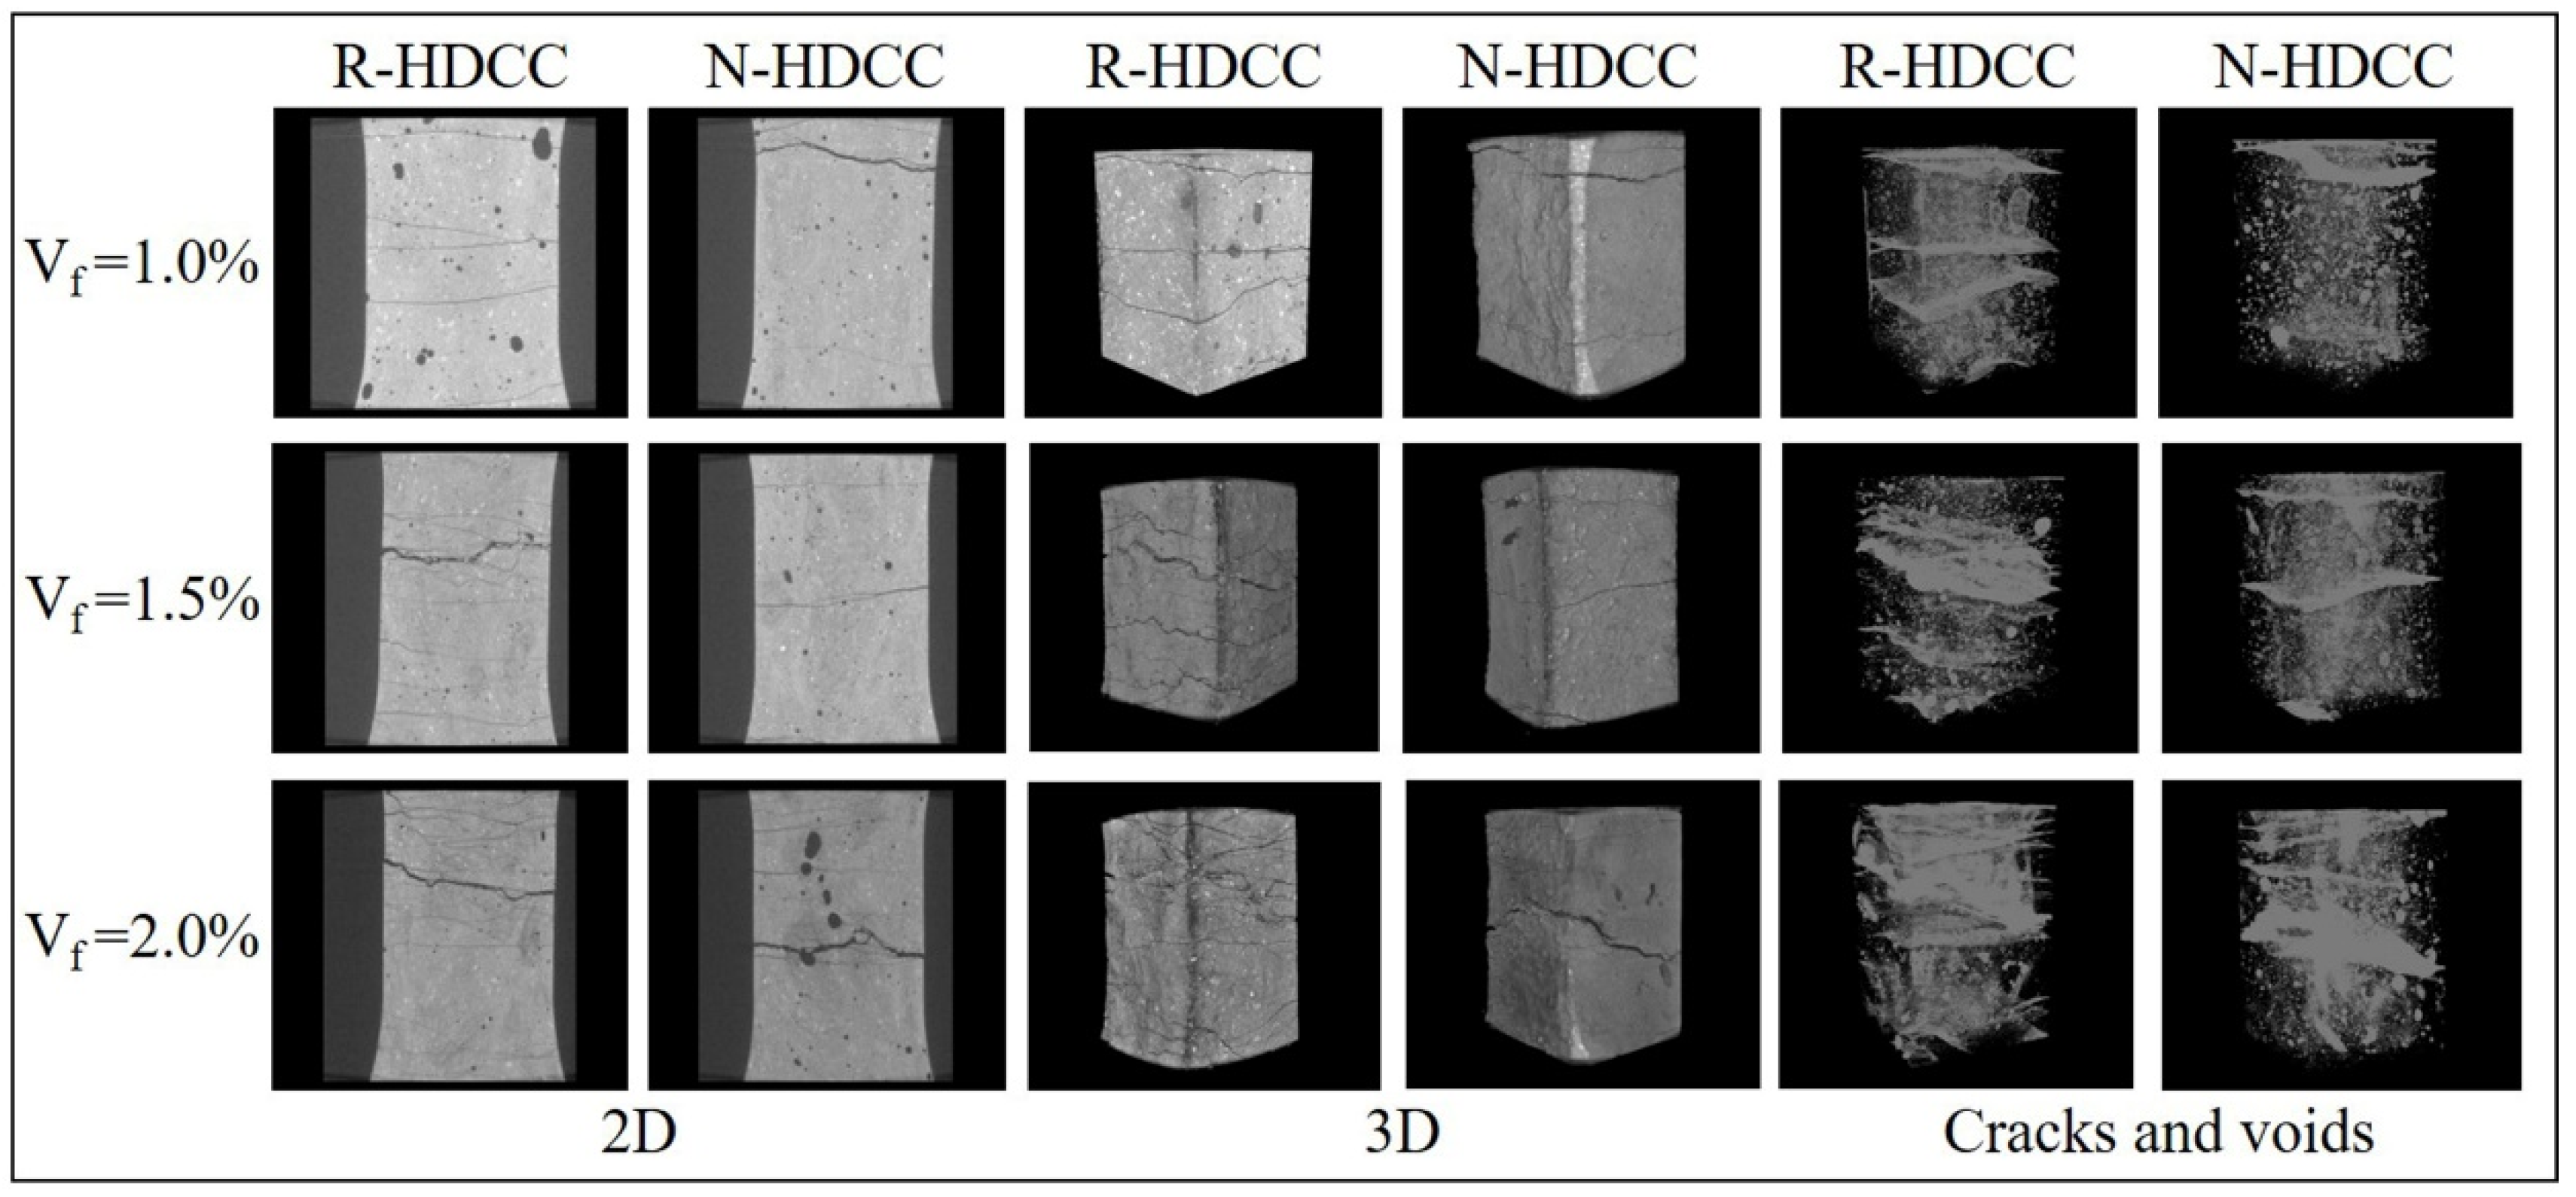
Because of the denser matrix, HDCC with RFA has a higher bond between fiber and matrix than HDCC with NFA. This can be proved by the scanning electron microscope observations that fibers pulled out from HDCC with RFA were seriously damaged while fibers pulled out from HDCC with NFA were only slightly abraded. As a result, HDCC with RFA exhibits higher bending and tensile strength than HDCC with NFA.
(3)
The higher bond between fiber and matrix of HDCC with RFA and the finer particle sizes of RFA can greatly promote the development of multiple cracking. Thus, HDCC with RFA presents more remarkable stain hardening and exhibits 182.73% higher peak deflection in the bending and 183.33% higher peak strain in tension than HDCC with NFA.
(4)
The values of σbp/fc and σtp/fc of HDCC with RFA linearly increase with the increase of Vf, and the relationships are modelled by a linear equation, respectively. Additionally, there is also a good linear relationship between the values of σbp/fc and σtp/fc of HDCC with RFA.
(5)
HDCC with RFA exhibits better mechanical properties than HDCC with NFA. Therefore, the application of RFA in the preparation of HDCC can obtain significant social and economic benefits.

Author Contributions

Conceptualization, D.Y.G. and M.L.; methodology, M.L.; validation, D.Y.G.; formal analysis, M.L.; investigation, M.L. and Y.M.; data curation, M.L.; writing—original draft preparation, M.L.; writing—review and editing, D.Y.G., L.Y., G.C., J.T.; project administration, M.L.; funding acquisition, D.Y.G. All authors have read and agreed to the published version of the manuscript.

Funding

The authors gratefully acknowledge the financial support of National Natural Science Foundation of China (No. U1704254).

Conflicts of Interest

The authors declare no conflict of interest.

Abbreviation

RFArecycled fine aggregate;
NFAnatural fine aggregate;
HDCChigh ductility cementitious composite;
R-HDCChigh ductility cementitious composite prepared with recycled fine aggregate;
N-HDCChigh ductility cementitious composite prepared with natural fine aggregate.

References

  1. USEPA. Advancing Sustainable Materials Management: 2015 Fact Sheet; U.S. Environmental Protection Agency: Washington, DC, USA, 2018.
  2. Bostanci, S.C.; Limbachiya, M.; Kew, H. Use of recycled aggregates for low carbon and cost effective concrete construction. J. Clean. Prod. 2018, 189, 176–196. [Google Scholar] [CrossRef] [Green Version]
  3. Da Silva, S.R.; Andrade, J.J.D.O. Investigation of mechanical properties and carbonation of concretes with construction and demolition waste and fly ash. Constr. Build. Mater. 2017, 153, 704–715. [Google Scholar] [CrossRef]
  4. Tam, V.W.Y.; Soomro, M.; Evangelista, A.C.J. A review of recycled aggregate in concrete applications (2000–2017). Constr. Build. Mater. 2018, 172, 272–292. [Google Scholar] [CrossRef]
  5. Yue, P. Environmental Pollution Hazards of Urban Construction Wastes and Related Resource Recycling Measures: A Case Study in Central China. Nat. Envir. Pollut. Technol. 2018, 17, 777–782. [Google Scholar]
  6. Taylor, P.C.; Kosmatka, S.H.; Voigt, G.F. Integrated Materials and Construction Practices for Concrete Pavement: A State of the Practice Manual; Federal Highway Administration: Washington, DC, USA, 2007.
  7. Freedonia. World Construction Aggregates to 2015—Industry Study 2838; The Freedonia Group: Cleveland, OH, USA, 2012. [Google Scholar]
  8. Verian, K.P.; Ashraf, W.; Cao, Y. Properties of recycled concrete aggregate and their influence in new concrete production. Resour. Conservat. Recycl. 2018, 133, 30–49. [Google Scholar] [CrossRef]
  9. Wijayasundara, M.; Mendis, P.; Crawford, R.H. Net incremental indirect external benefit of manufacturing recycled aggregate concrete. Waste Manag. 2018, 78, 279–291. [Google Scholar] [CrossRef]
  10. Xie, T.; Gholampour, A.; Ozbakkaloglu, T. Toward the Development of Sustainable Concretes with Recycled Concrete Aggregates: Comprehensive Review of Studies on Mechanical Properties. J. Mater. Civ. Eng. 2018, 30, 04018211. [Google Scholar] [CrossRef]
  11. Arel, H.Ş.; Shaikh, F.U.A. Semi-green cementitious materials from waste granite by considering the environmental, economic, and health impacts: A review. Struct. Concr. 2019, 20, 455–470. [Google Scholar] [CrossRef]
  12. Li, W.; Luo, Z.; Long, C.; Wu, C.; Duan, W.H.; Shah, S.P. Effects of nanoparticle on the dynamic behaviors of recycled aggregate concrete under impact loading. Mater. Des. 2016, 112, 58–66. [Google Scholar] [CrossRef]
  13. Gao, D.; Zhang, L.; Nokken, M. Mechanical behavior of recycled coarse aggregate concrete reinforced with steel fibers under direct shear. Cem. Concr. Compos. 2017, 79, 1–8. [Google Scholar] [CrossRef] [Green Version]
  14. González-Fonteboa, B.; Seara-Paz, S.; De Brito, J.; González-Taboada, I.; Martínez-Abella, F.; Vasco-Silva, R. Recycled concrete with coarse recycled aggregate. An overview and analysis. Materiales Construcción 2018, 68, 151. [Google Scholar] [CrossRef] [Green Version]
  15. Guo, H.; Shi, C.; Guan, X.; Zhu, J.; Ding, Y.; Ling, T.-C.; Zhang, H.; Wang, Y. Durability of recycled aggregate concrete – A review. Cem. Concr. Compos. 2018, 89, 251–259. [Google Scholar] [CrossRef]
  16. Wu, J.; Zhang, Y.; Zhu, P.; Feng, J.; Hu, K. Mechanical Properties and ITZ Microstructure of Recycled Aggregate Concrete Using Carbonated Recycled Coarse Aggregate. J. Wuhan Univ. Technol. Sci. Ed. 2018, 33, 648–653. [Google Scholar] [CrossRef]
  17. Florea, M.V.A.; Brouwers, H.J.H. In Recycled concrete fines and aggregates: the composition of various size fractions related to crushing history. In Proceedings of the international conference on building materials (IBAUSIL), Weimar, Germany, 12–15 September 2012; pp. 1034–1041. [Google Scholar]
  18. Yang, Y.; Zilin, Z.; Wenying, G.; Haoxuan, L. Research on production of recycled total-fine aggregate and its influence on concrete performance. J. Funct. Mater. 2016, 4, 4157–4163. [Google Scholar]
  19. Lederer, C.; Altstadt, S.; Andriamonje, S.; Andrzejewski, J.; Audouin, L.; Barbagallo, M.; Bécares, V.; Becvár, F.; Belloni, F.; Berthier, B.; et al. Effect of powder in recycled fine aggregate on compressive strength of recycled mortar. In Proceedings of the 6th American Nuclear Society International Topical Meeting on Nuclear Plant Instrumentation, Control, and Human-Machine Interface Technologies 2009, Knoxville, TN, USA, 5–9 April 2009. [Google Scholar]
  20. Nili, M.; Sasanipour, H.; Aslani, F. The Effect of Fine and Coarse Recycled Aggregates on Fresh and Mechanical Properties of Self-Compacting Concrete. Materials 2019, 12, 1120. [Google Scholar] [CrossRef] [Green Version]
  21. Liang, J.-F.; Wang, E.; Zhou, X.; Le, Q.-L. Influence of high temperature on mechanical properties of concrete containing recycled fine aggregate. Comput. Concr. 2018, 21, 87–94. [Google Scholar]
  22. Evangelista, L.; De Brito, J. Mechanical behaviour of concrete made with fine recycled concrete aggregates. Cem. Concr. Compos. 2007, 29, 397–401. [Google Scholar] [CrossRef]
  23. Li, V.C. A simplified micromechanical model of compressive strength of fiber-reinforced cementitious composites. Cem. Concr. Compos. 1992, 14, 131–141. [Google Scholar] [CrossRef] [Green Version]
  24. Li, V.C.; Wu, C.; Wang, S.; Ogawa, A.; Saito, T. Interface tailoring for strain-hardening polyvinyl alcohol-engineered cementitious composite (PVA-ECC). Mater. J. 2002, 99, 463–472. [Google Scholar]
  25. Manvi, N.G.; Kumar, A.A. Evaluation of Mechanical Properties of Hybrid Engineered Cementitious Composite (HECC). Mater. Today Proc. 2017, 4, 9856–9859. [Google Scholar] [CrossRef]
  26. Wang, Q.; Yi, Y.; Ma, G.; Luo, H. Hybrid effects of steel fibers, basalt fibers and calcium sulfate on mechanical performance of PVA-ECC containing high-volume fly ash. Cem. Concr. Compos. 2019, 97, 357–368. [Google Scholar] [CrossRef]
  27. Li, H.; Xu, S. Experimental Research on Ultra High Toughness Cementitious Composites; Dalian University of Technology: Dalian, China, 2008. [Google Scholar]
  28. Said, S.H.; Razak, H.A.; Othman, I. Flexural behavior of engineered cementitious composite (ECC) slabs with polyvinyl alcohol fibers. Constr. Build. Mater. 2015, 75, 176–188. [Google Scholar] [CrossRef] [Green Version]
  29. Ali, M.; Soliman, A.; Nehdi, M. Hybrid-fiber reinforced engineered cementitious composite under tensile and impact loading. Mater. Des. 2017, 117, 139–149. [Google Scholar] [CrossRef]
  30. Ahmed, S.F.U.; Mihashi, H.; Shaikh, F. A review on durability properties of strain hardening fibre reinforced cementitious composites (SHFRCC). Cem. Concr. Compos. 2007, 29, 365–376. [Google Scholar] [CrossRef] [Green Version]
  31. Şahmaran, M.; Li, V.C. De-icing salt scaling resistance of mechanically loaded engineered cementitious composites. Cem. Concr. Res. 2007, 37, 1035–1046. [Google Scholar] [CrossRef]
  32. Wang, K.; Jansen, D.C.; Shah, S.P.; Karr, A.F. Permeability study of cracked concrete. Cem. Concr. Res. 1997, 27, 381–393. [Google Scholar] [CrossRef] [Green Version]
  33. Lepech, M.; Li, V.C. Water Permeability of Cracked Cementitious Composites; Advanced Civil Engineering Materials Research Laboratory, University of Michigan: Ann Arbor, MI, USA, 2005. [Google Scholar]
  34. Li, J.; Yang, E.-H. Macroscopic and microstructural properties of engineered cementitious composites incorporating recycled concrete fines. Cem. Concr. Compos. 2017, 78, 33–42. [Google Scholar] [CrossRef]
  35. Zhang, H.; Ji, T.; Zeng, X.; Yang, Z.; Lin, X.; Liang, Y. Mechanical behavior of ultra-high performance concrete (UHPC) using recycled fine aggregate cured under different conditions and the mechanism based on integrated microstructural parameters. Constr. Build. Mater. 2018, 192, 489–507. [Google Scholar] [CrossRef]
  36. Yu, K.-Q.; Zhu, W.-J.; Ding, Y.; Lu, Z.-D.; Yu, J.-T.; Xiao, J.-Z. Micro-structural and mechanical properties of ultra-high performance engineered cementitious composites (UHP-ECC) incorporation of recycled fine powder (RFP). Cem. Concr. Res. 2019, 124, 105813. [Google Scholar] [CrossRef]
  37. Standard, A. C1018. Standard Test Method for Flexural Toughness and First-Crack Strength of Fiber-Reinforced Concrete (Using Beam with Third-Point Loading); American Society of Testing Materials: West Conshohocken, PA, USA, 1997. [Google Scholar]
  38. Standard, A. C78. Standard Test Method for Flexural Strength of Concrete (Using Simple Beam with Third Point Loading); American Society of Testing Materials: West Conshohocken, PA, USA, 2002. [Google Scholar]
  39. Li, V.C.; Wang, S.; Wu, C. Tensile strain-hardening behavior of polyvinyl alcohol engineered cementitious composite (PVA-ECC). ACI Mater. J. Am. Concr. Inst. 2001, 98, 483–492. [Google Scholar]
Figure 1. The specific dimension of dog bone specimen (dimension in mm).
Materials 13 00679 g001
Figure 2. Test photos: (a) flexural test and (b) compressive test.
Materials 13 00679 g002
Figure 3. Four-point bending test: (a) Schematic representation (dimension in mm) and (b) Photo of test.
Materials 13 00679 g003
Figure 4. Axial tensile test: (a) Schematic representation and (b) Photo of test.
Materials 13 00679 g004
Figure 5. Photos of (a) RFA and (b) natural fine aggregate (NFA).
Materials 13 00679 g005
Figure 6. Particle size distribution of RFA and NFA.
Materials 13 00679 g006
Figure 7. Computed tomography (CT) images of fine aggregate: (a) RFA and (b) NFA.
Materials 13 00679 g007
Figure 8. X-ray diffraction (XRD) patterns of NFA and RFA.
Materials 13 00679 g008
Figure 9. Comparison of strength between R-HDCC and N-HDCC: (a) Compressive and (b) Flexural.
Materials 13 00679 g009
Figure 10. Bending stress versus deflection of R-HDCC and N-HDCC: (a) Vf = 0, (b) Vf = 0.5%, (c) Vf = 1.0%, (d) Vf = 1.5% and (e) Vf = 2.0%.
Materials 13 00679 g010
Figure 11. Bottom surface of specimens after bending failure.
Materials 13 00679 g011
Figure 12. Stress versus strain of R-HDCC and N-HDCC: (a) Vf = 0, (b) Vf = 0.5%, (c) Vf = 1.0%, (d) Vf = 1.5% and (e) Vf = 2.0%.
Materials 13 00679 g012
Figure 13. Dog-bone specimens after axial tensile test.
Materials 13 00679 g013
Figure 14. CT images on specimens after axial tensile test.
Materials 13 00679 g014
Figure 15. Scanning electron microscopy (SEM) images of interfacial transition zone between aggregate and cement paste: (a) RFA and (b) NFA.
Materials 13 00679 g015
Figure 16. SEM images of fiber/matrix interface after tensile test.
Materials 13 00679 g016
Figure 17. Effect of fiber volume fraction: (a) bending peak stress and (b) tensile peak stress.
Materials 13 00679 g017
Figure 18. Relationship between σbp/fc and Vf.
Materials 13 00679 g018
Figure 19. Relationship between σtp/fc and Vf.
Materials 13 00679 g019
Figure 20. Relationship between σbp/fc and σtp/fc.
Materials 13 00679 g020
Table 1. Chemical composition of cement and fly ash (wt%).
Chemical CompositionCement (%)Fly Ash (%)
CaO63.424.2
SiO218.7754.45
Al2O34.8528.37
MgO4.170.85
SO33.530.85
Fe2O33.156.03
K2O1.22.29
TiO20.2551.25
Na2O0.2430.94
loss of ignition3.083.17
Table 2. Properties of polyvinyl alcohol (PVA) fiber.
Tensile Strength (MPa)Modulus of Elasticity (GPa)Elongation (%)Length (mm)Diameter (μm)Density (g/m3)
≥1250>30≥612401.3
Table 3. Mix proportions of raw materials.
GroupParametersMix Proportion (kg/m3)
W/BVf (%)R/BVFA (%)Aggregate TypeCementFly AshFine AggregateFiberWaterWater Reducer
25R000.2500.430RFA831.6356.4475.2029712.1
25R050.250.50.430RFA831.6356.4475.26.529712.1
25R100.2510.430RFA831.6356.4475.21329712.1
25R150.251.50.430RFA831.6356.4475.219.529712.1
25R200.2520.430RFA831.6356.4475.22629712.1
25N000.2500.430NFA831.6356.4475.2029712.1
25N050.250.50.430NFA831.6356.4475.26.529712.1
25N100.2510.430NFA831.6356.4475.21329712.1
25N150.251.50.430NFA831.6356.4475.219.529712.1
25N200.2520.430NFA831.6356.4475.22629712.1
45R000.4500.430RFA626.9268.6358.204030
45R050.450.50.430RFA626.9268.6358.26.54030
45R100.4510.430RFA626.9268.6358.2134030
45R150.451.50.430RFA626.9268.6358.219.54030
45R200.4520.430RFA626.9268.6358.2264030
45N000.4500.430NFA626.9268.6358.204030
45N050.450.50.430NFA626.9268.6358.26.54030
45N100.4510.430NFA626.9268.6358.2134030
45N150.451.50.430NFA626.9268.6358.219.54030
45N200.4520.430NFA626.9268.6358.2264030
Note: W/B is water-binder ratio, Vf is fiber volume fraction, R/B is RFA-binder ratio, VFA is the proportion of fly ash replacing cement.
Table 4. Physical properties of RFA and NFA.
Aggregate TypeApparent Density (kg/m3)Bulky Density (kg/m3)Water Absorption (%)Crushing Index (%)
RFA253613096.7218.3
NFA259314601.1812.8
Table 5. Bending properties.
Groupσbc (MPa)δbc (mm)σbp (MPa)δbp (mm)δbu (mm)Gb
25R006.190.09///35.20
25N004.870.10///35.01
25R056.250.116.470.121.76373.17
25N054.780.214.840.225.30720.10
25R106.570.209.336.228.174308.87
25N105.580.086.542.207.862562.66
25R156.780.2310.437.5810.536738.25
25N156.060.187.024.909.813451.62
25R208.110.4211.897.6717.2610090.39
25N207.970.219.415.1211.285403.01
Table 6. Tensile properties.
Groupσtc (MPa)εtc (%)σtp (MPa)εtp (%)εtu (%)Et (GPa)Gtνt
45R001.150.02\\\11.4912.540.18
45N000.980.03\\\6.4918.470.12
45R051.140.011.511.325.0812.822033.340.16
45N051.020.021.120.414.587.761634.000.30
45R101.750.012.161.699.1013.294796.380.10
45N101.630.011.691.545.8310.663872.030.14
45R151.820.022.612.4810.0216.0111002.040.21
45N151.700.041.991.647.6011.386263.500.13
45R202.380.022.844.7611.7320.3518805.060.13
45N201.570.052.751.6810.7212.9710143.700.15

