Effect of a Trace Addition of Sn on the Aging Behavior of Al–Mg–Si Alloy with a Different Mg/Si Ratio

 ,
,
Abstract
:1. Introduction
2. Experimental
3. Results
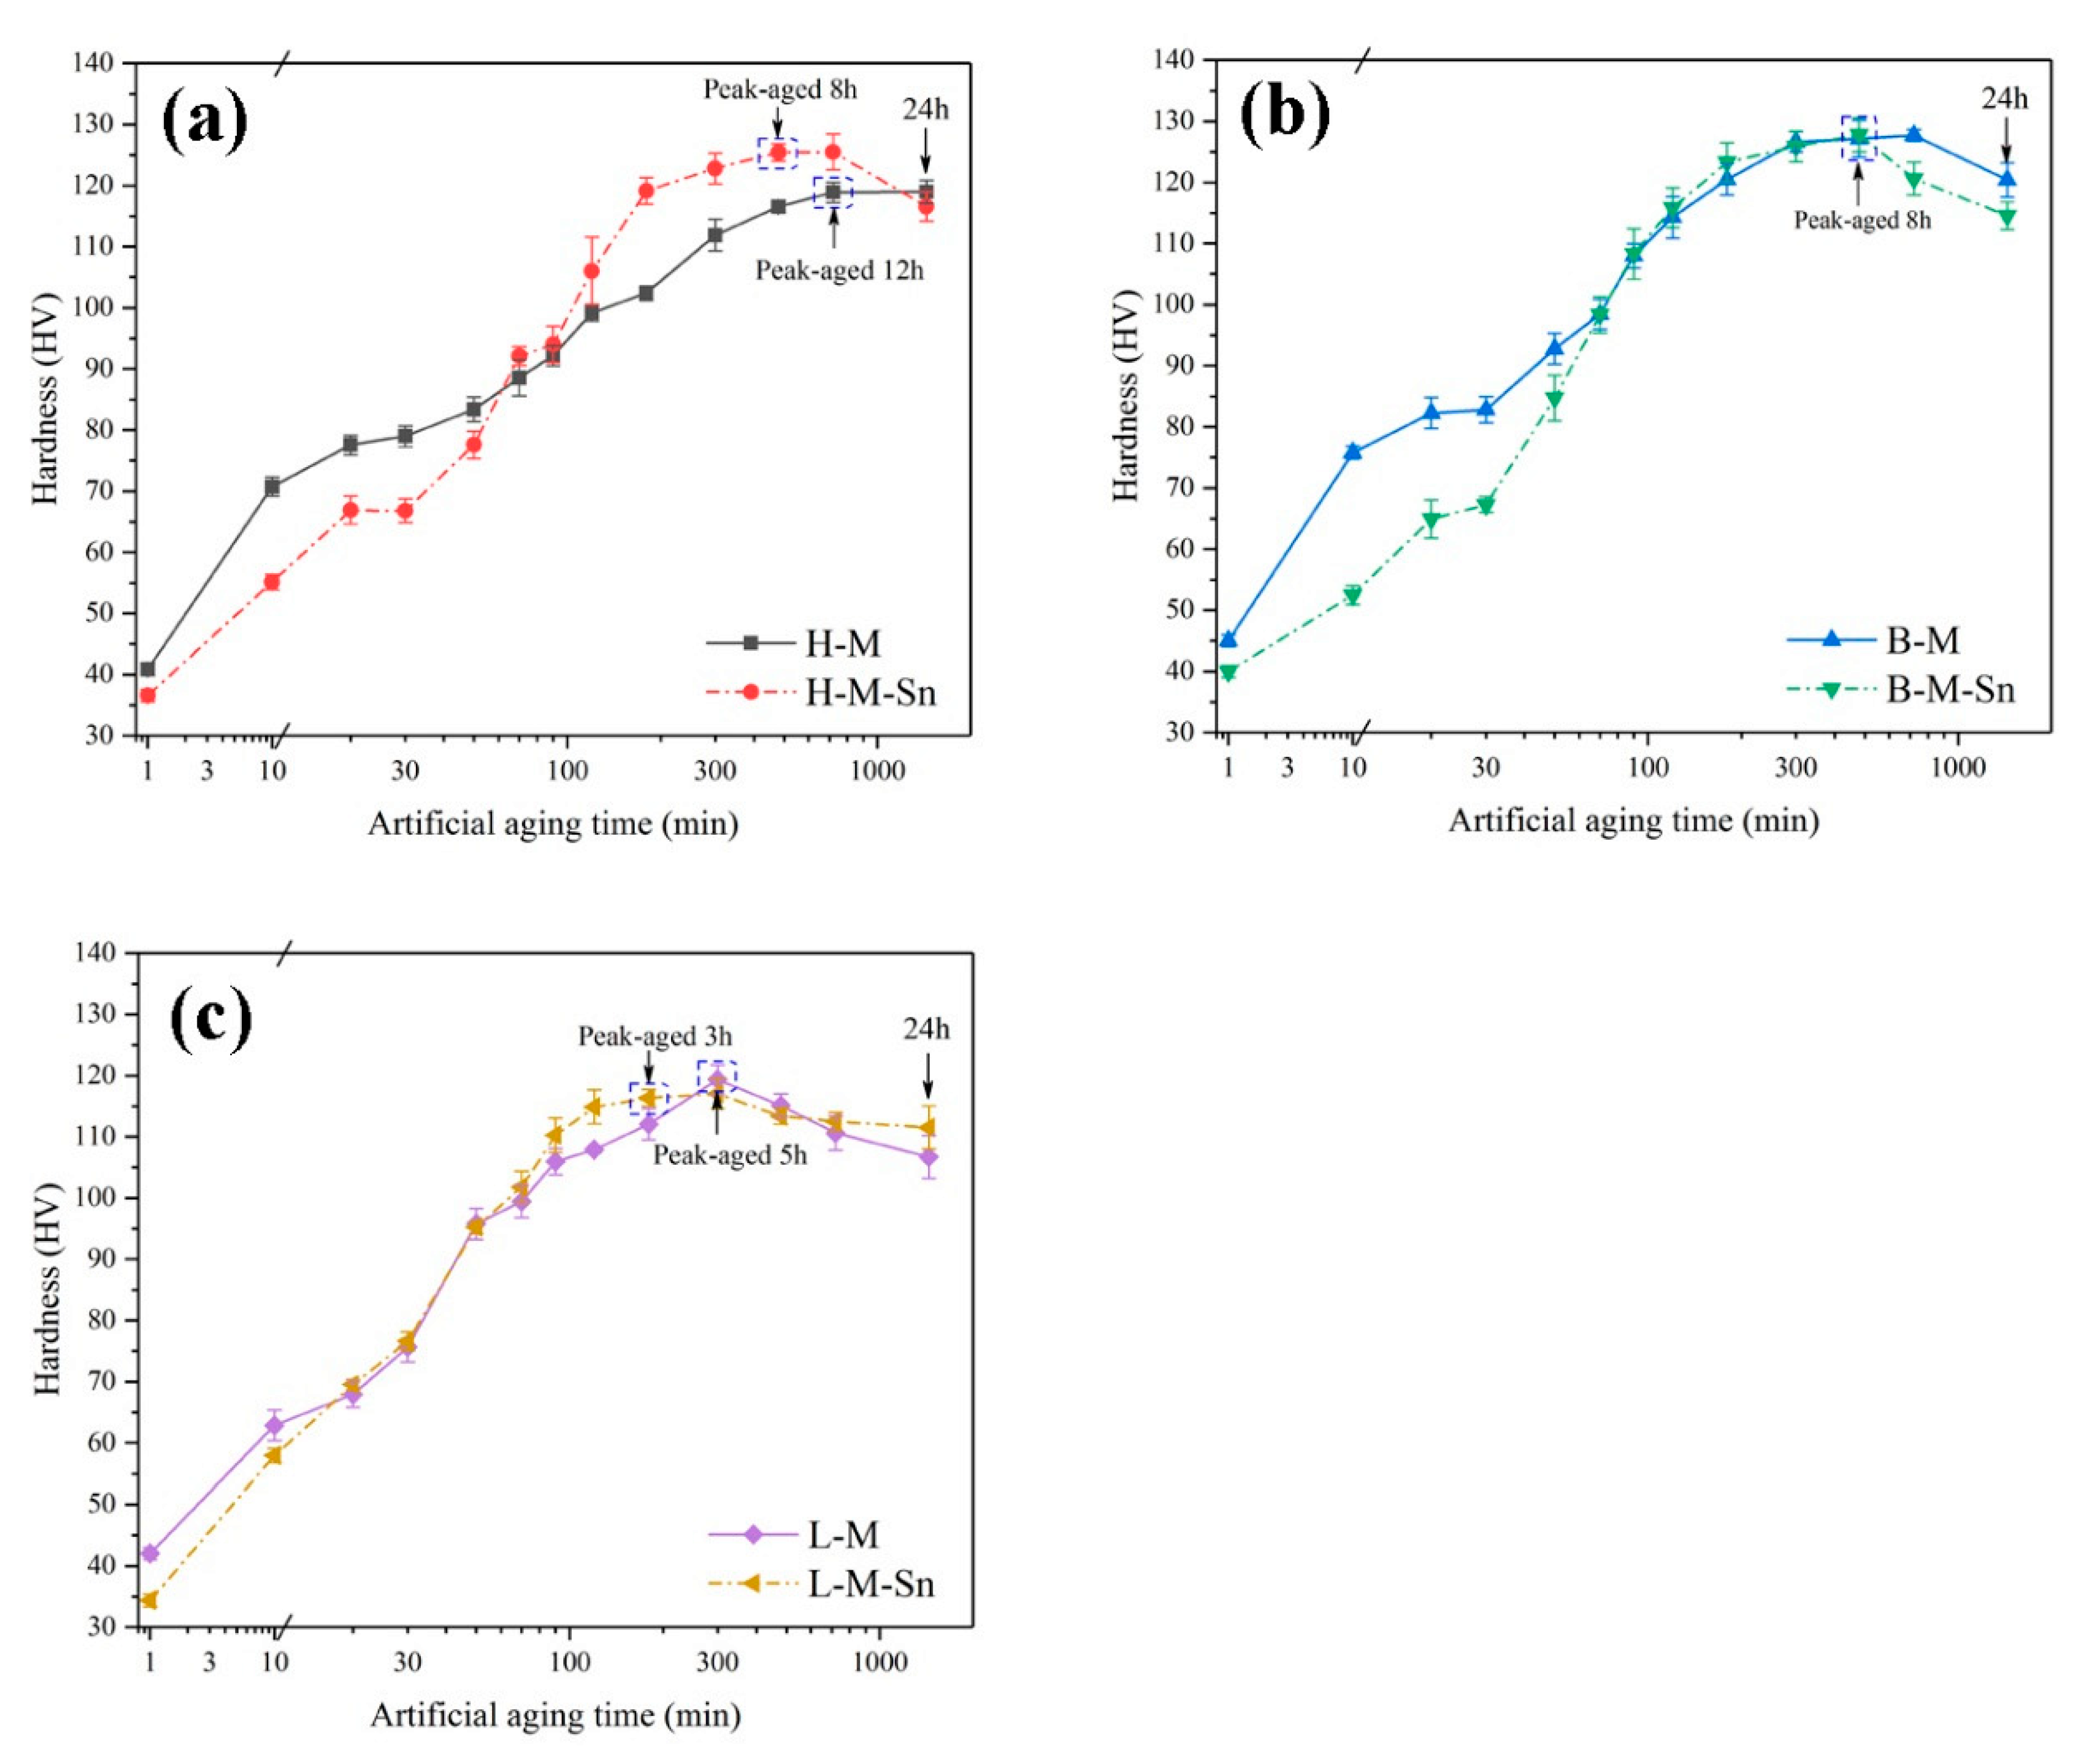
3.1. Evolution of Hardness during Artificial Aging
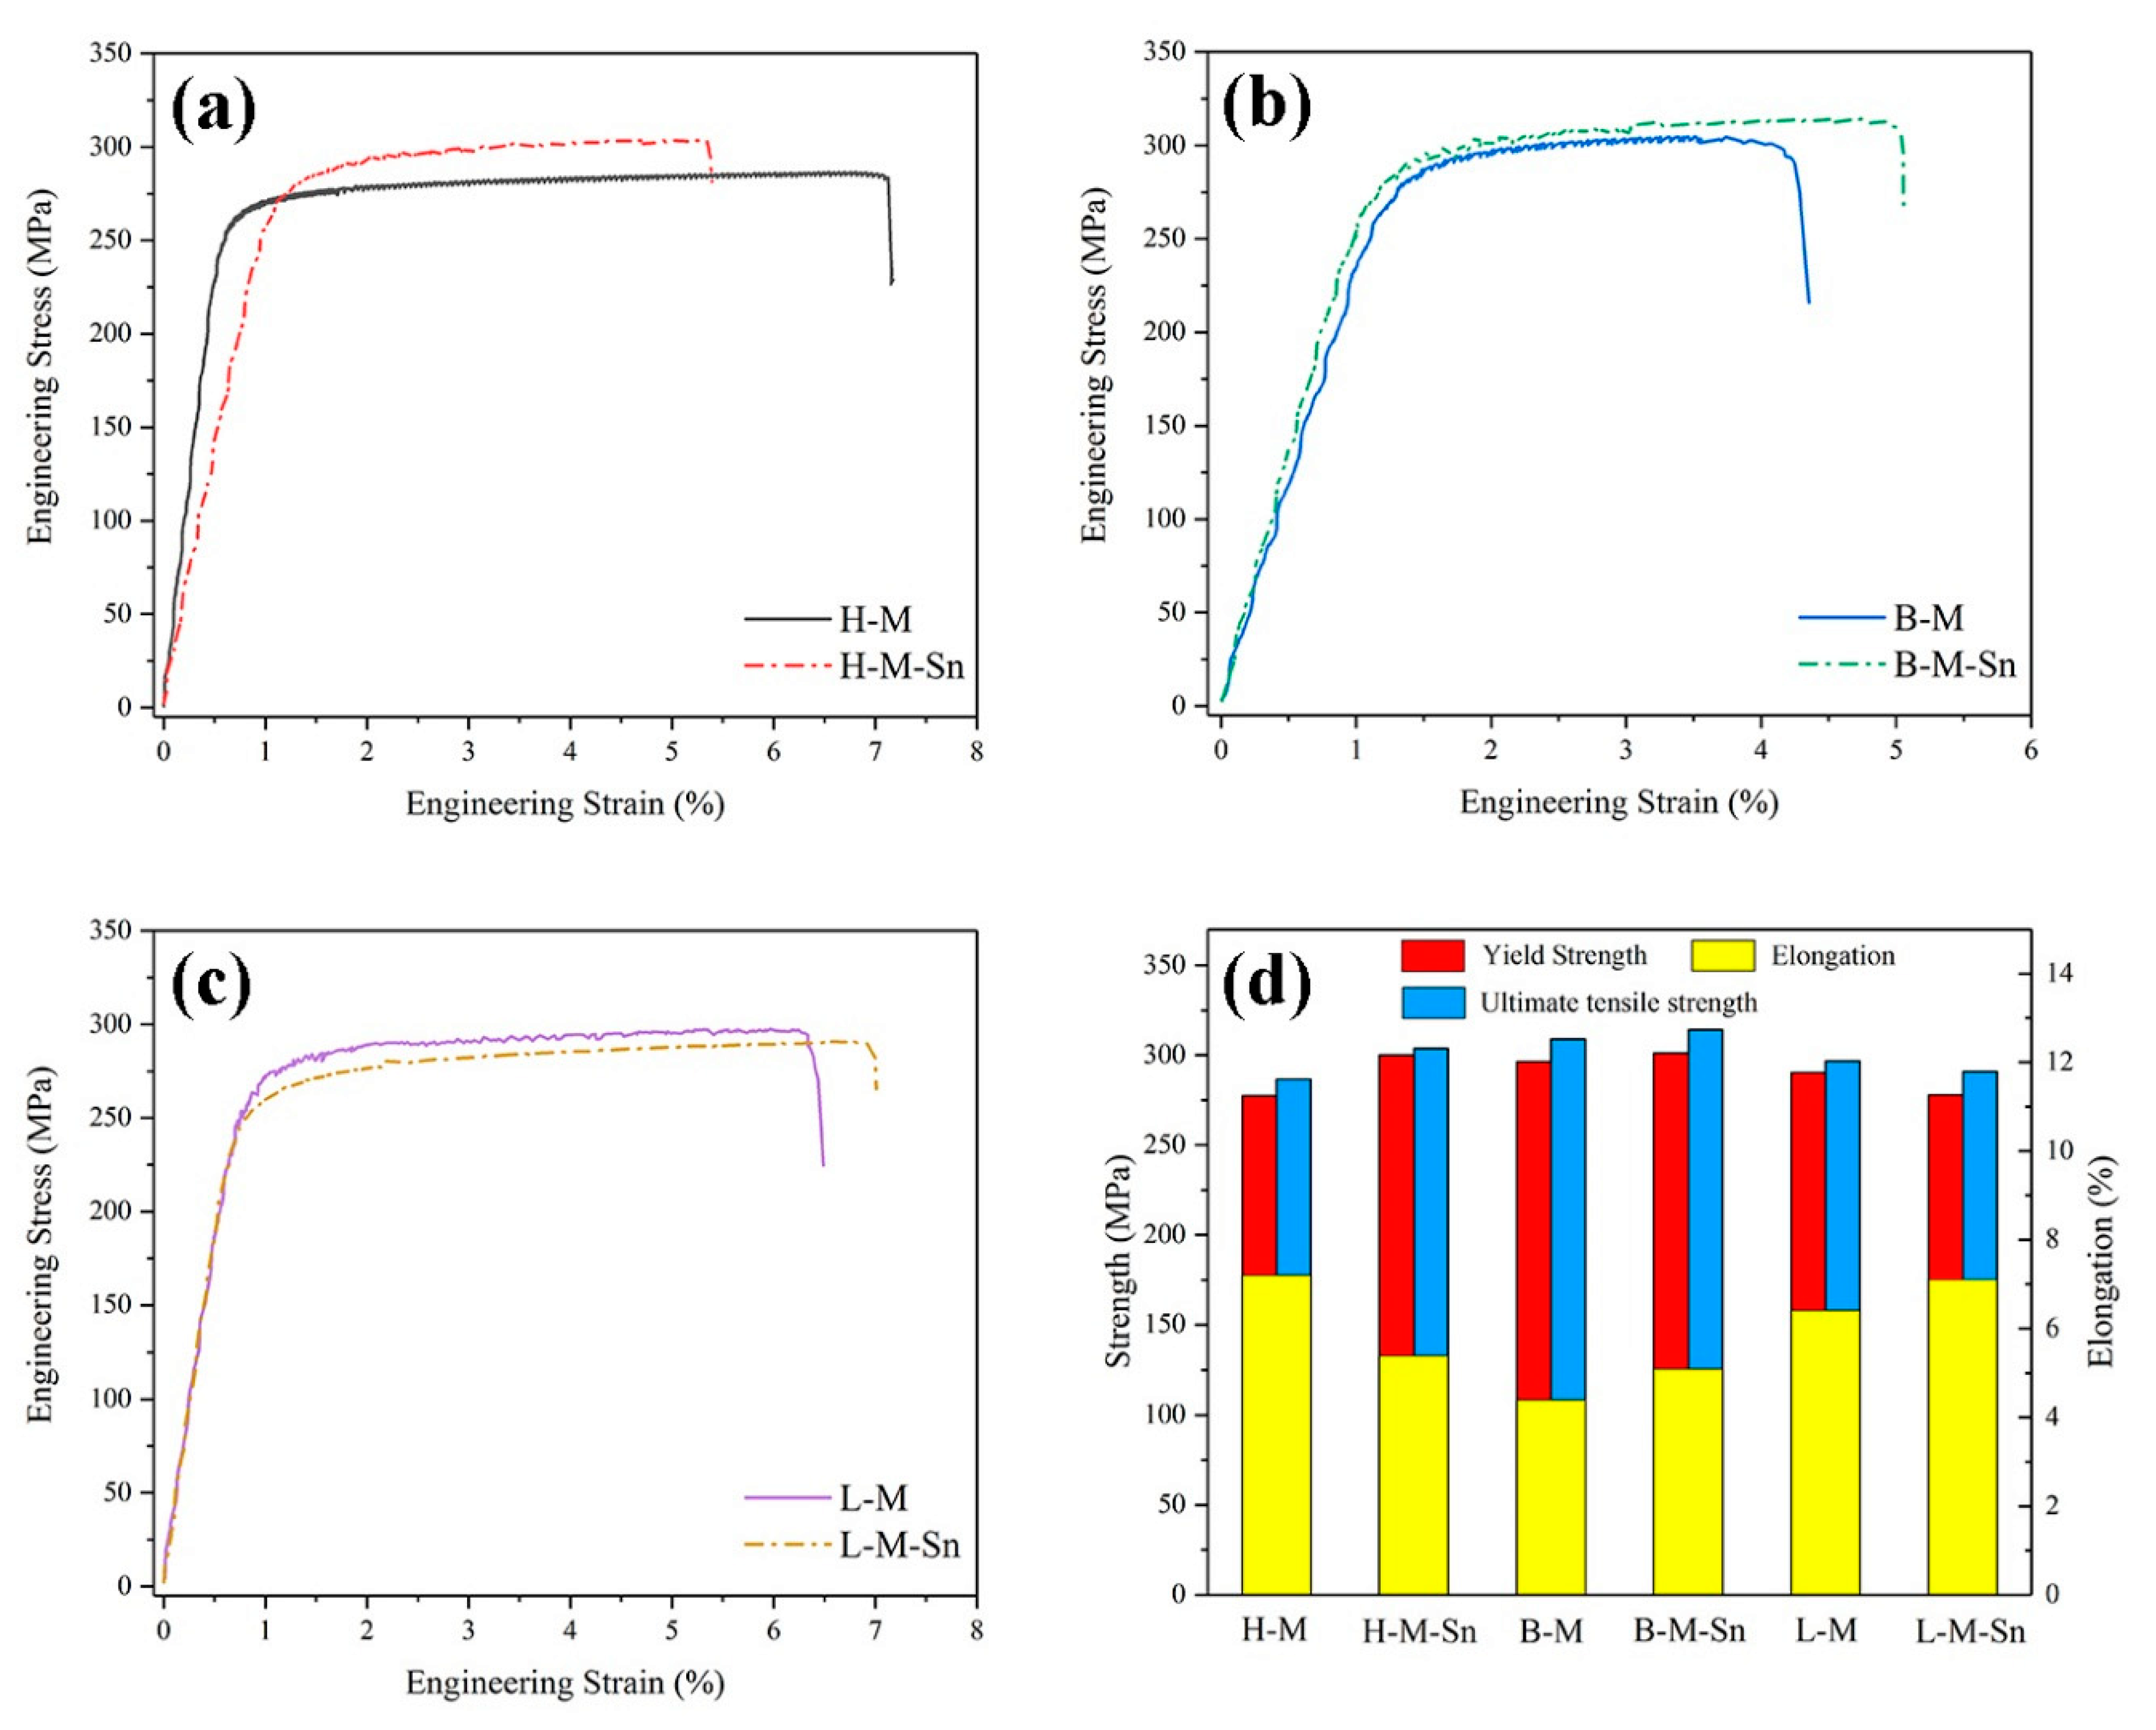
3.2. Tensile Results
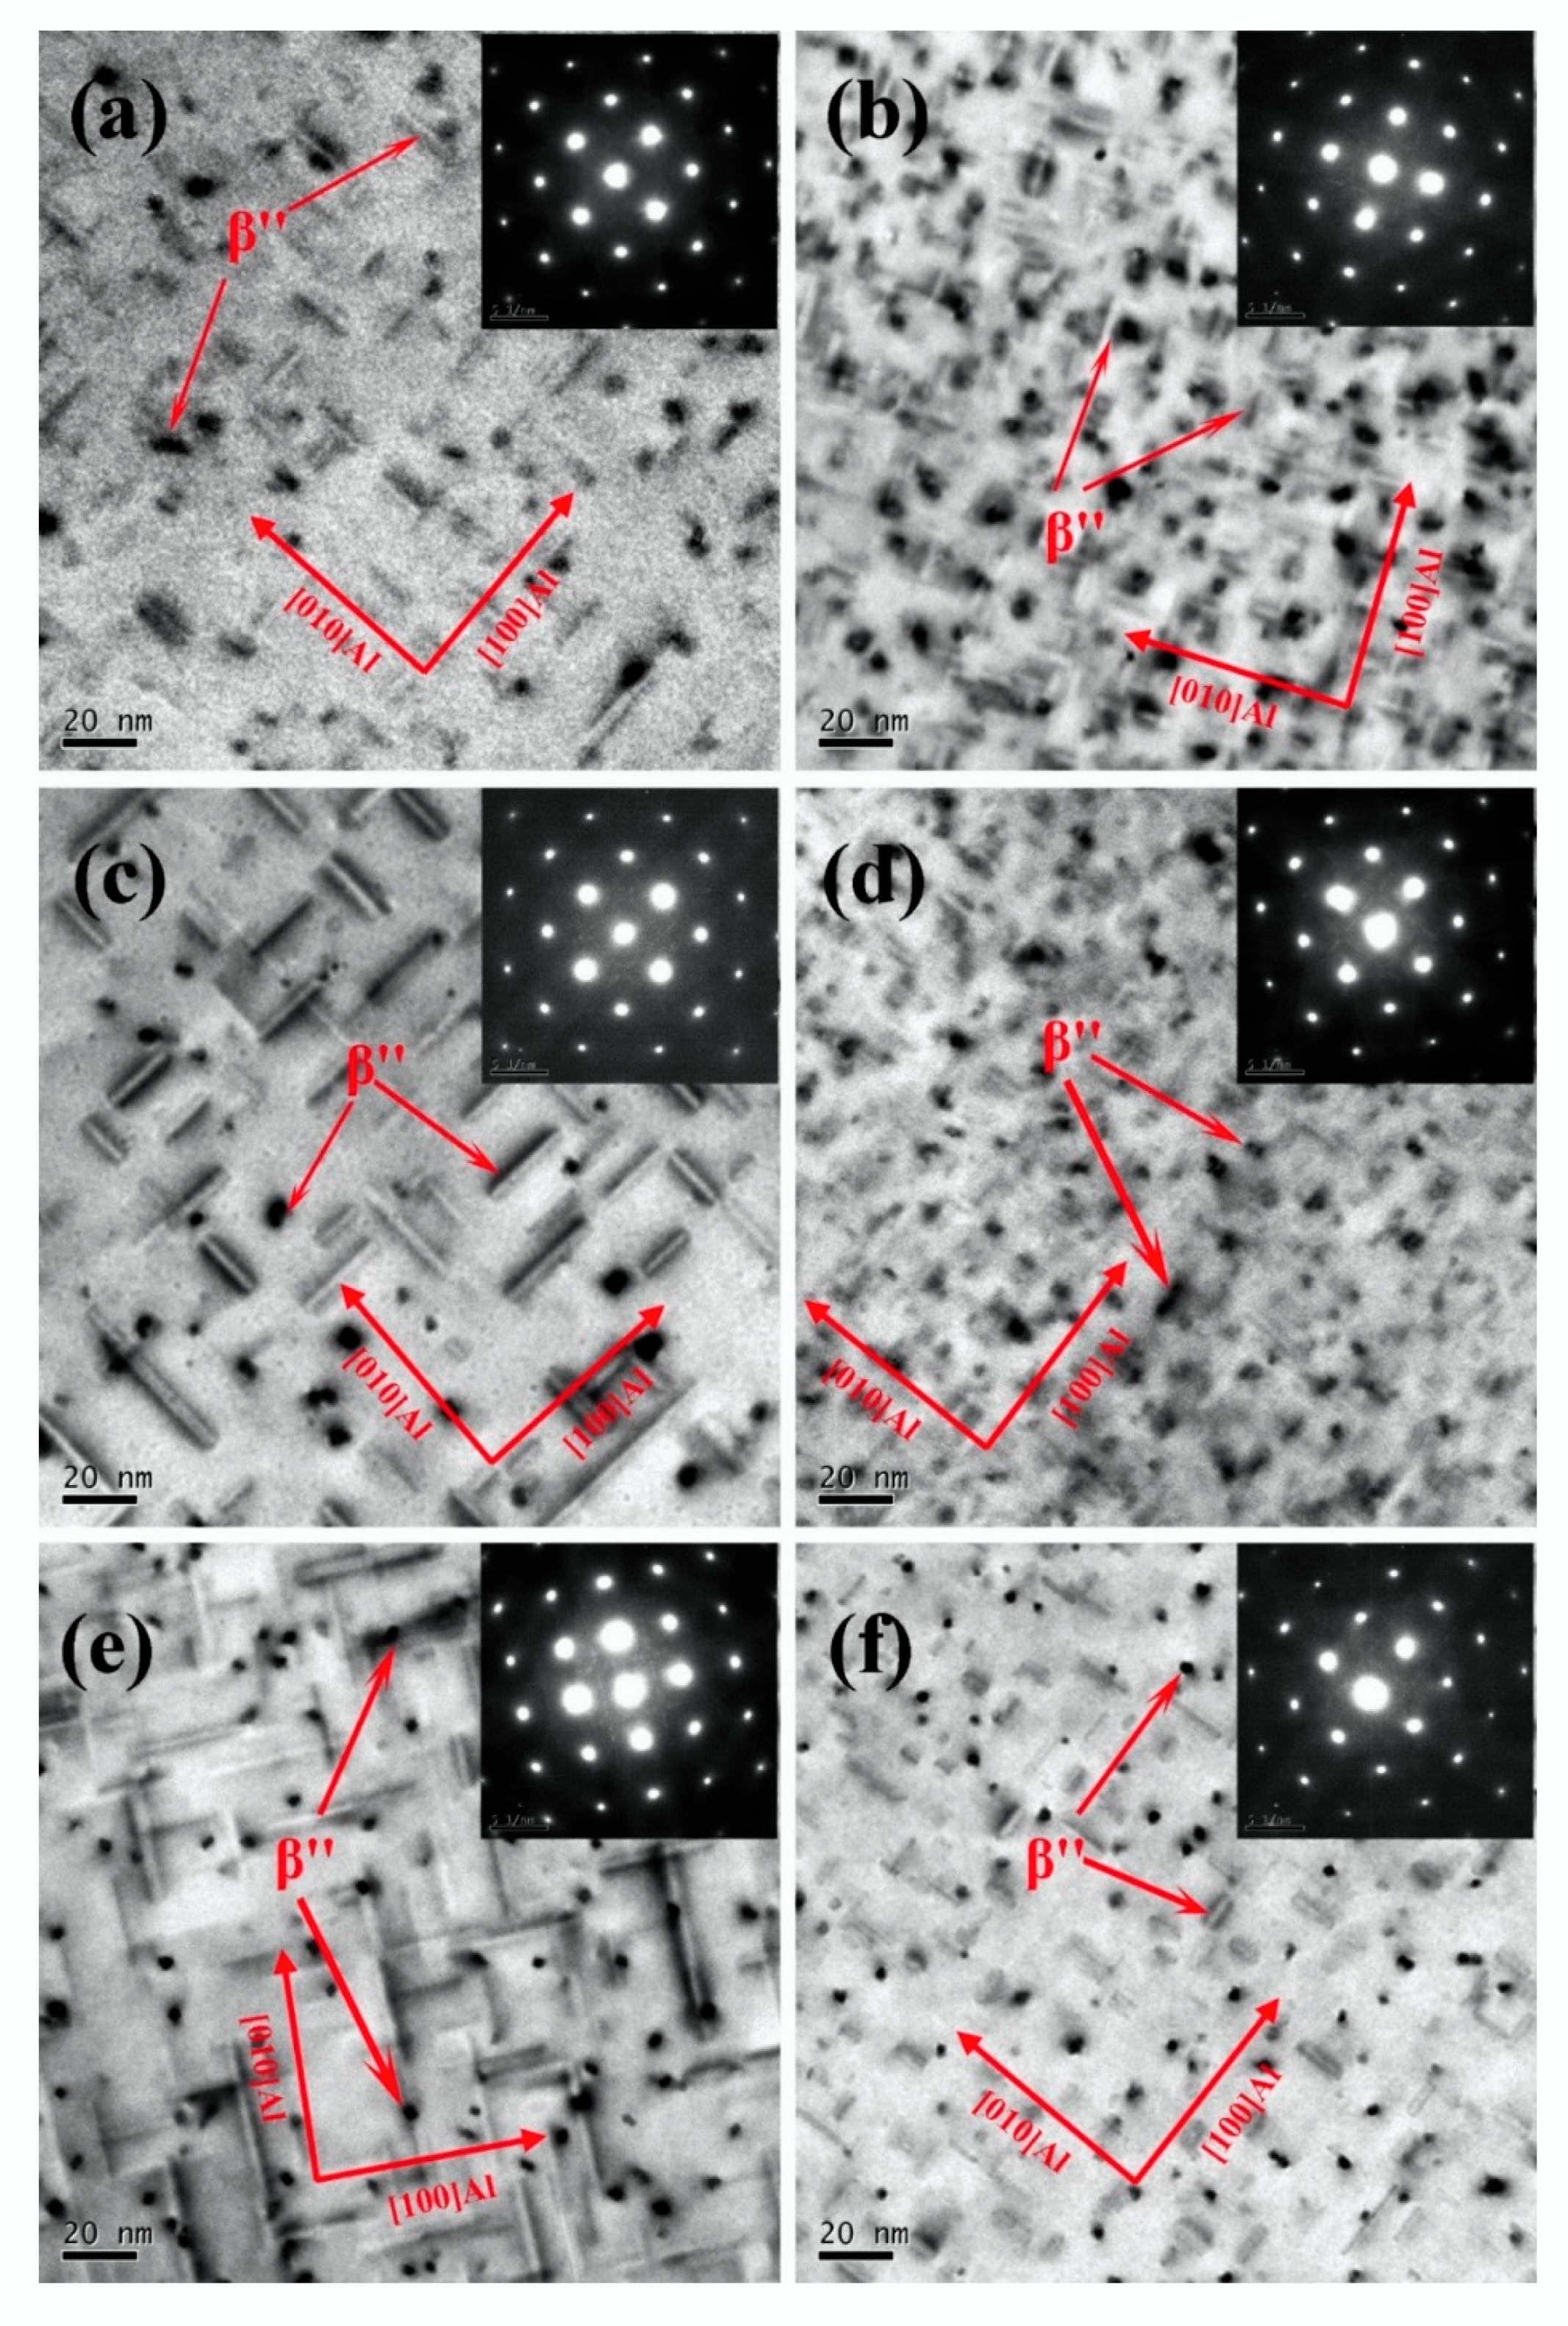
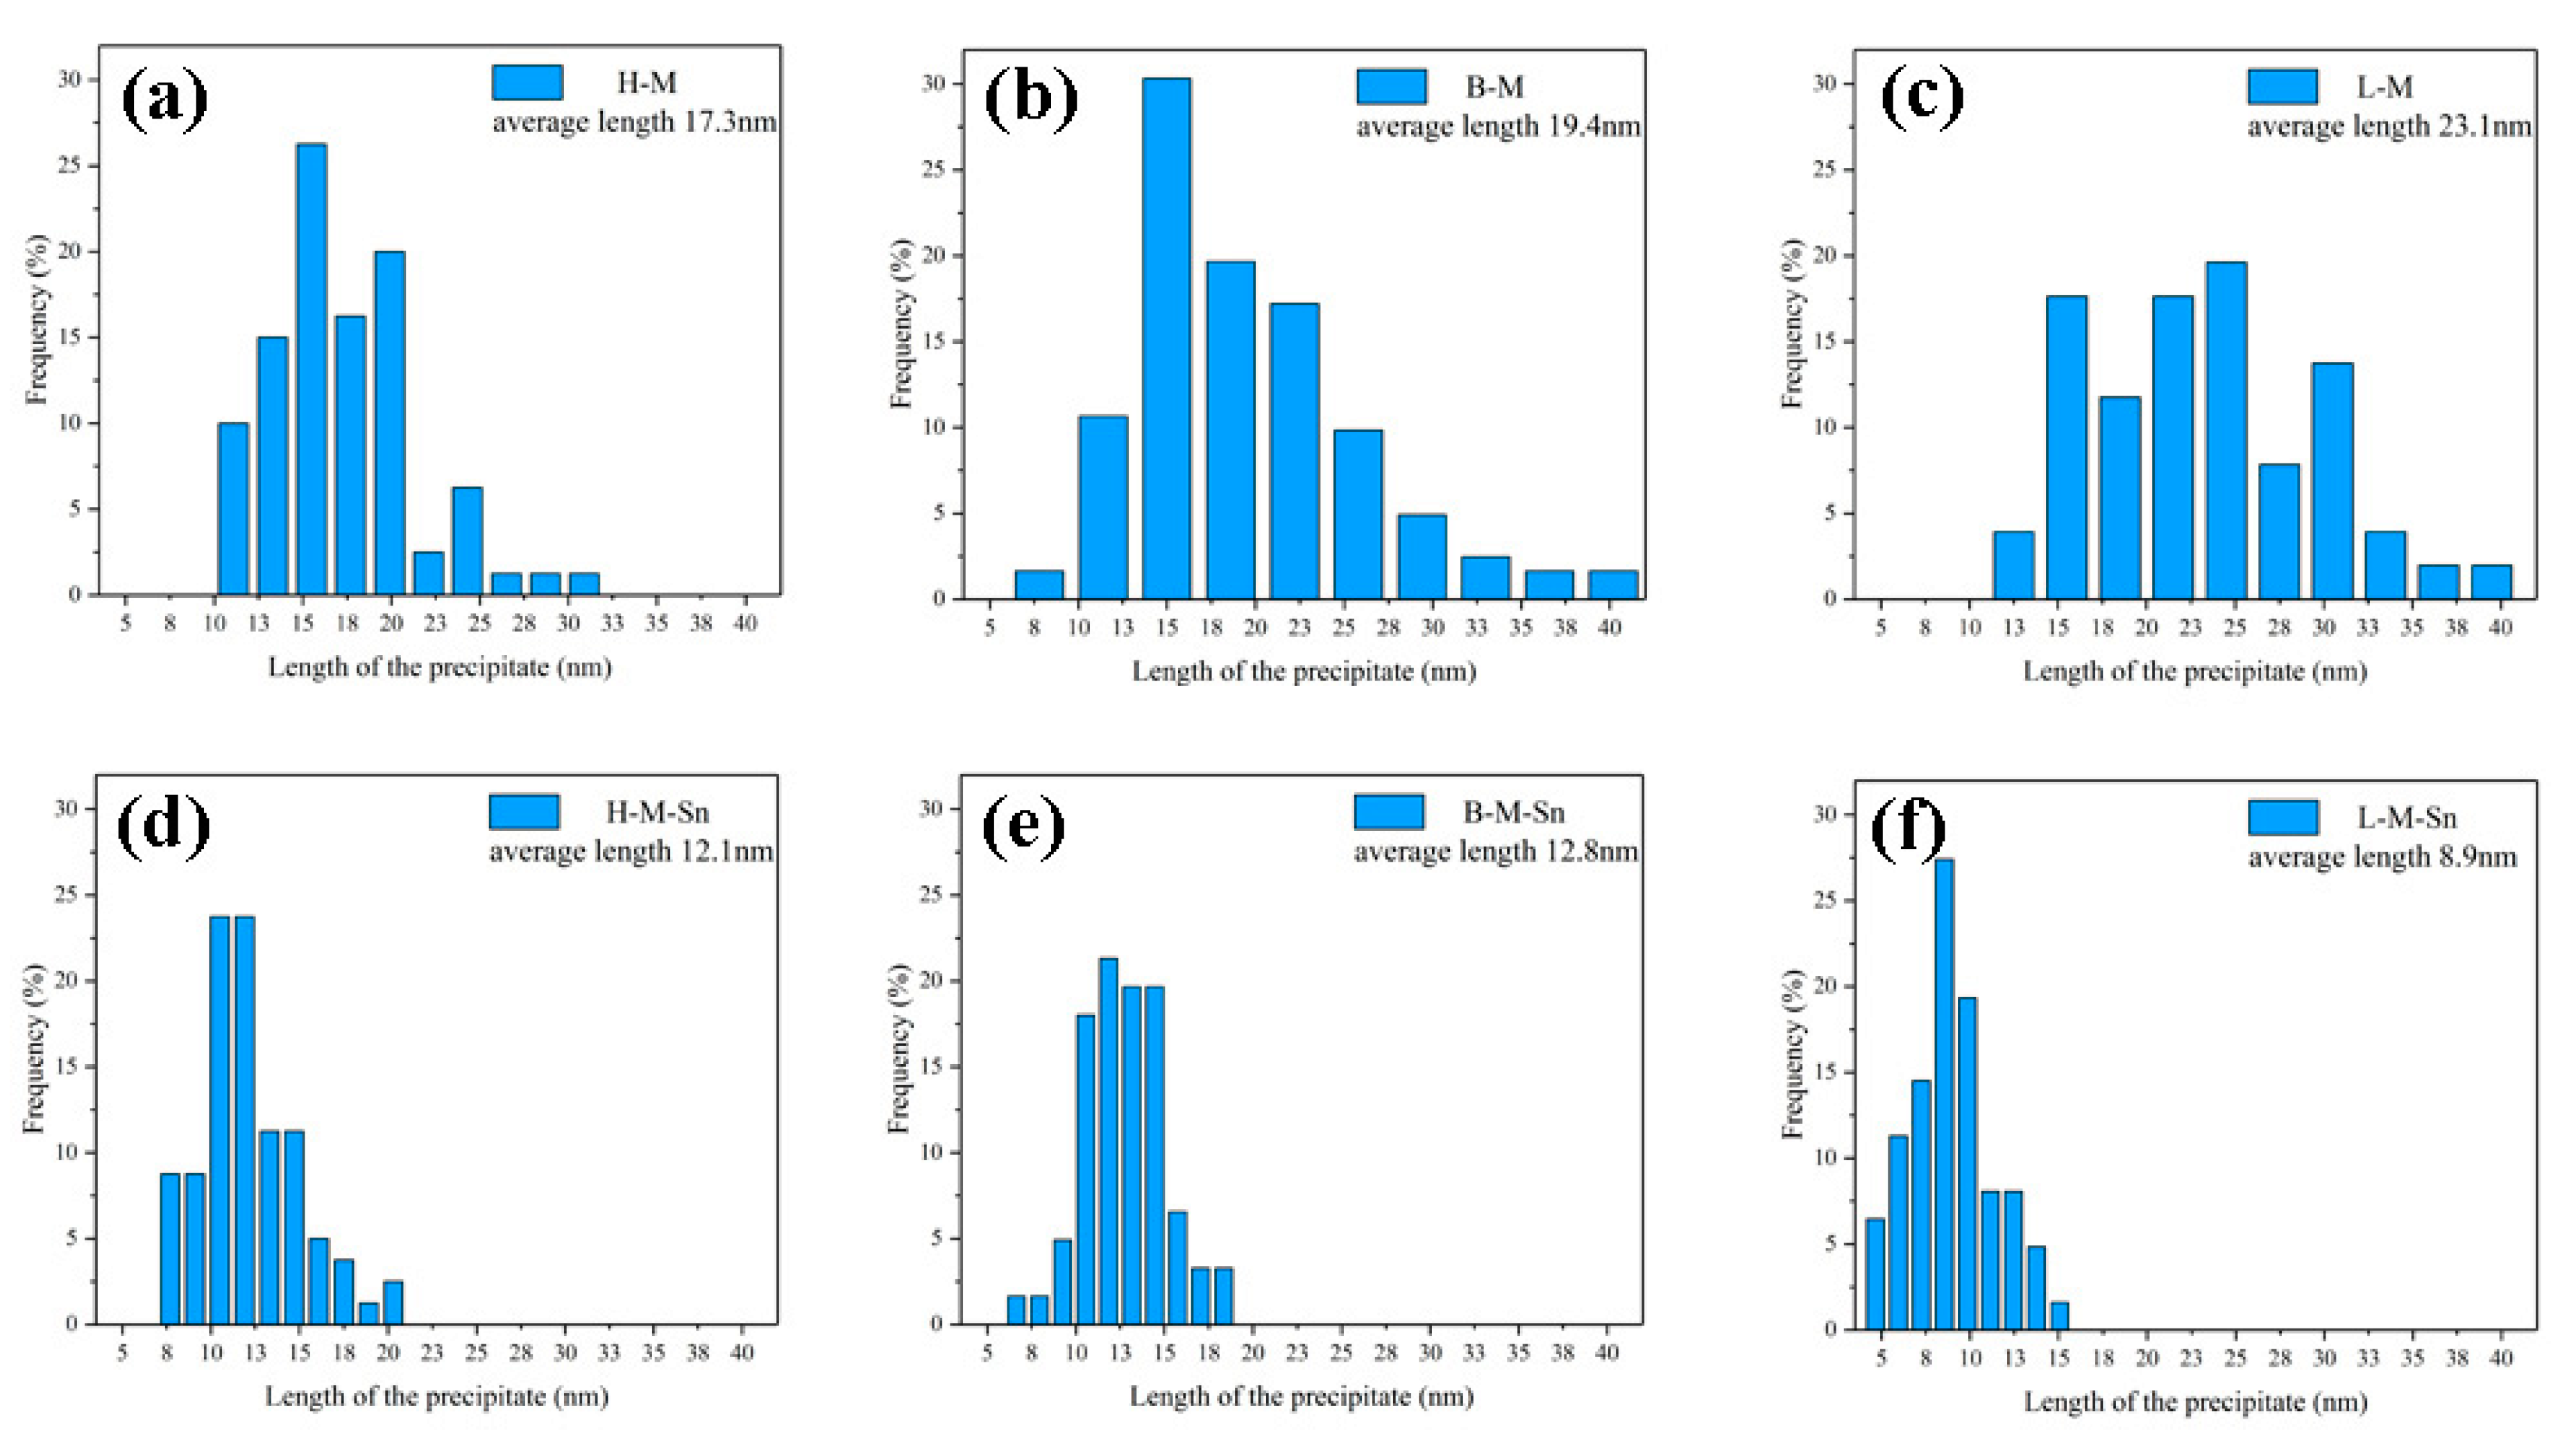
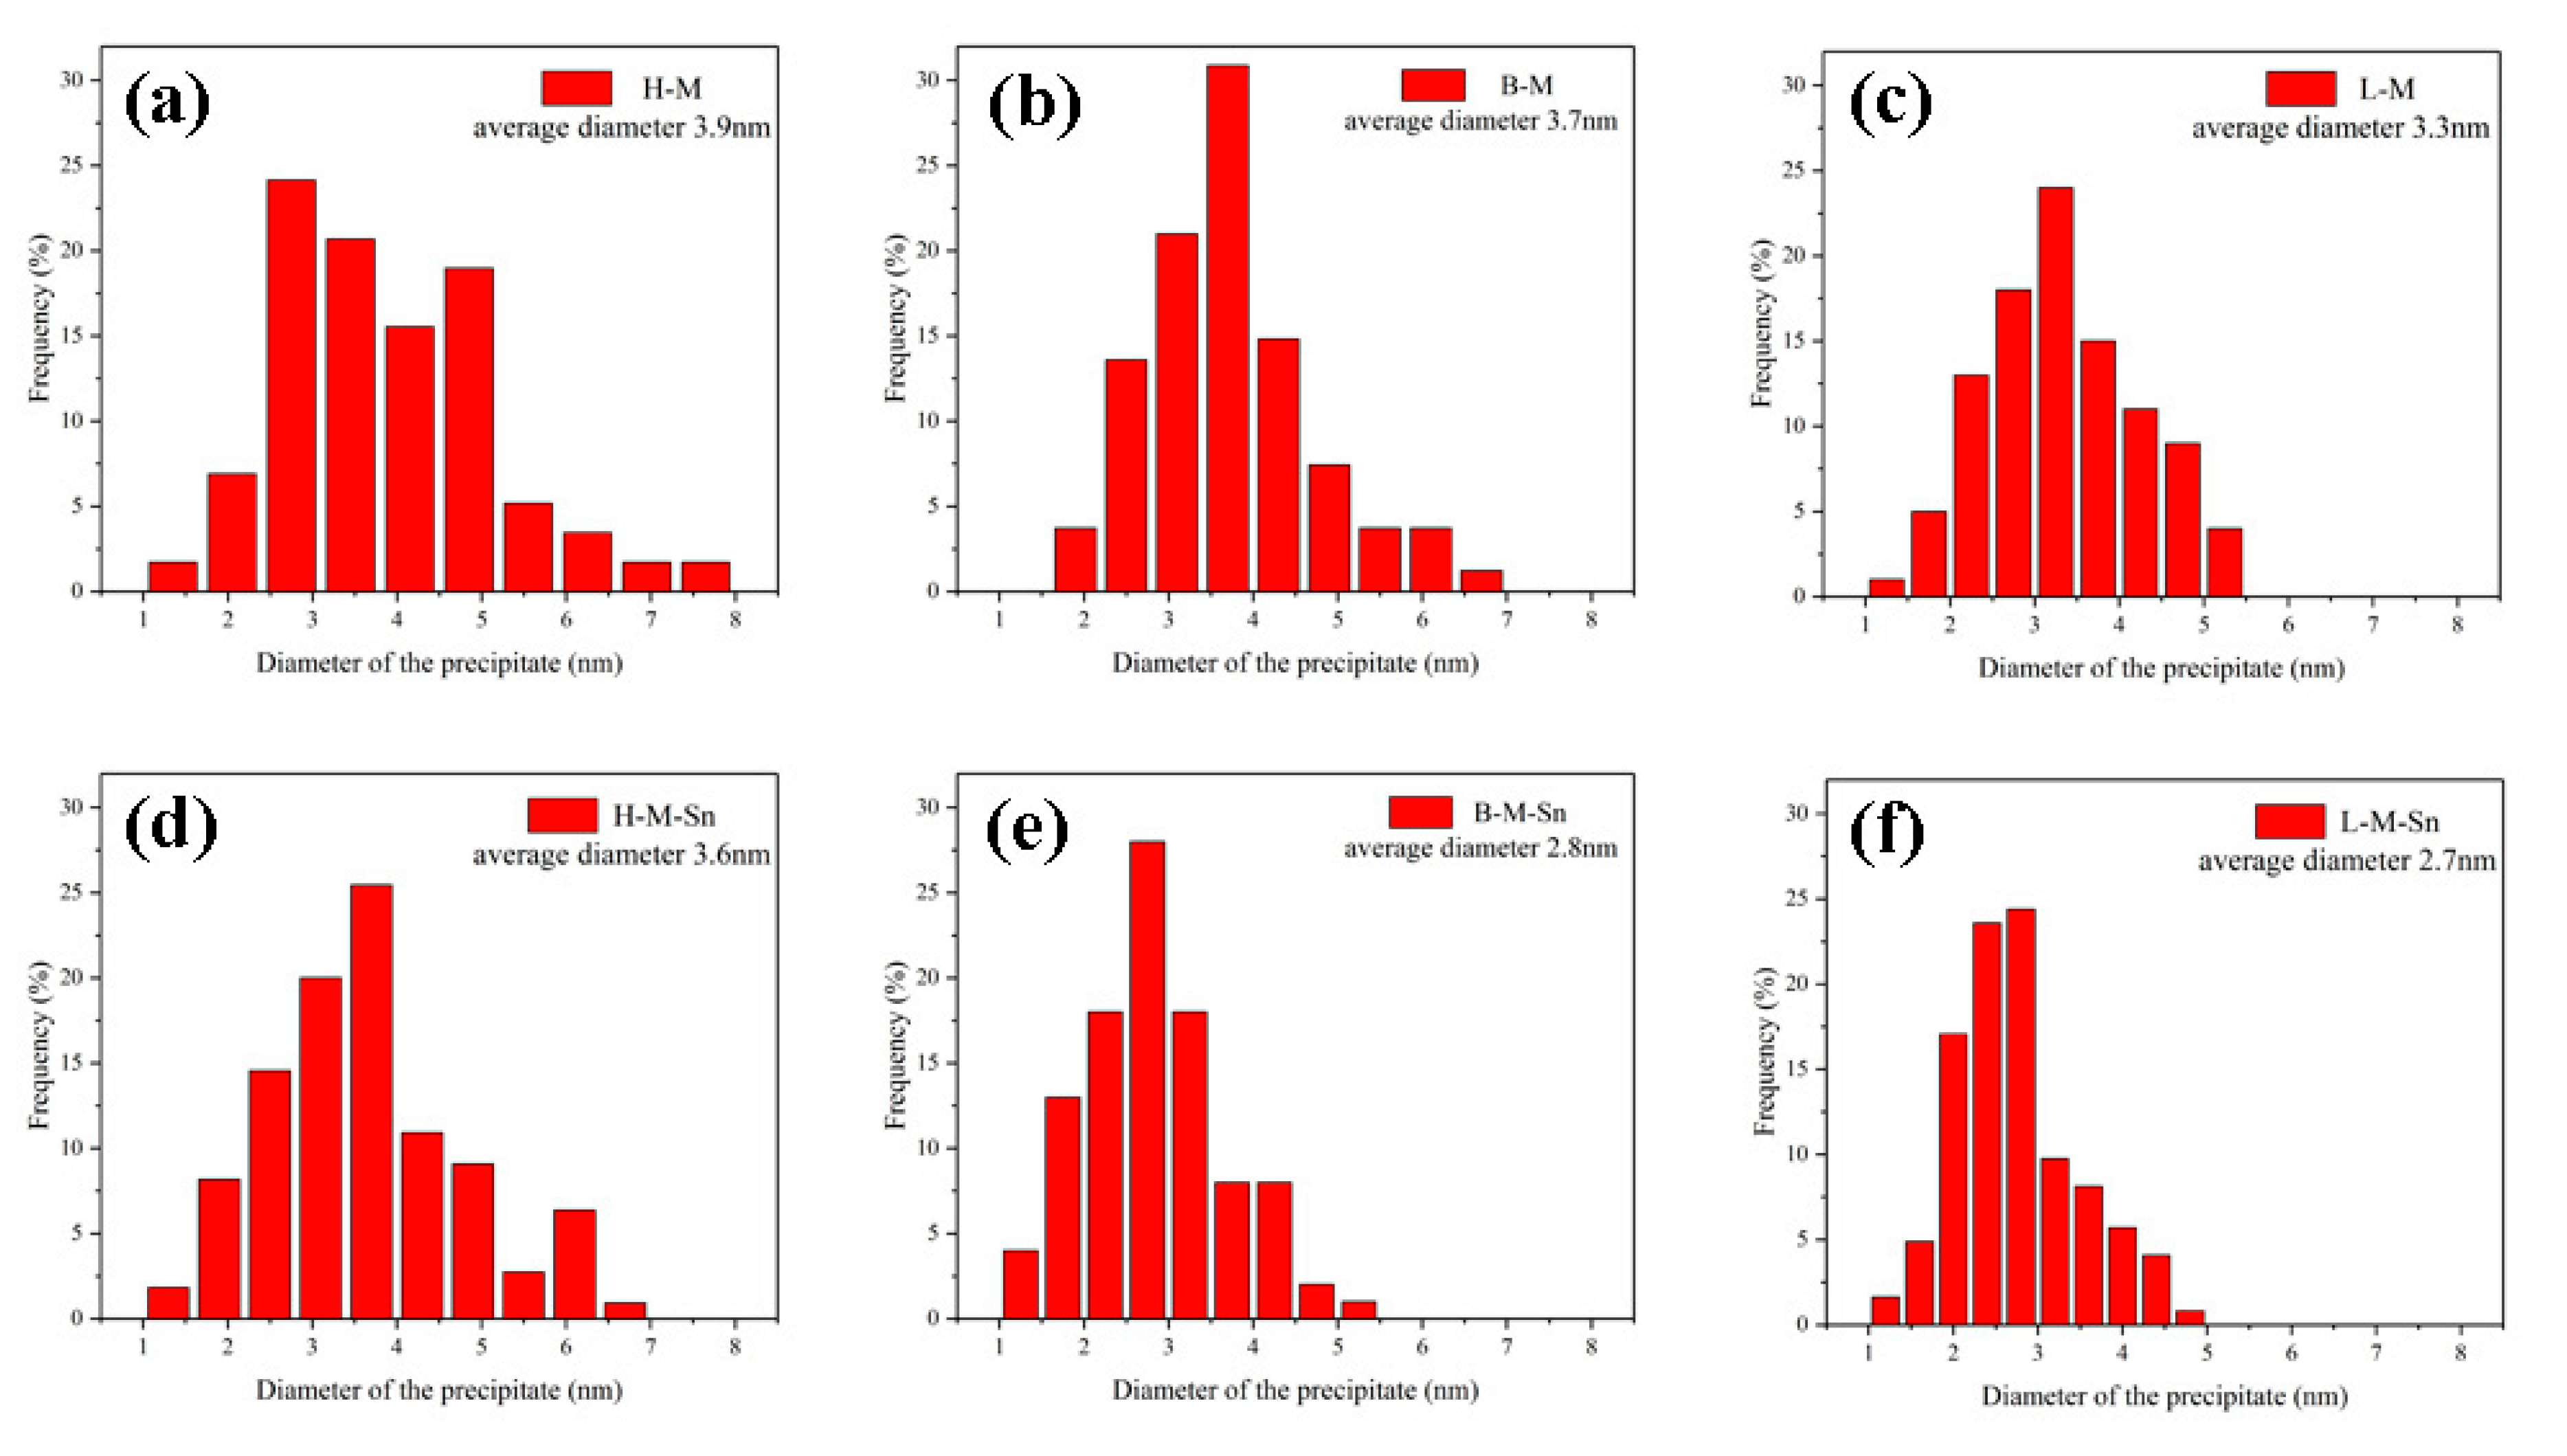
3.3. Microstructure Investigation
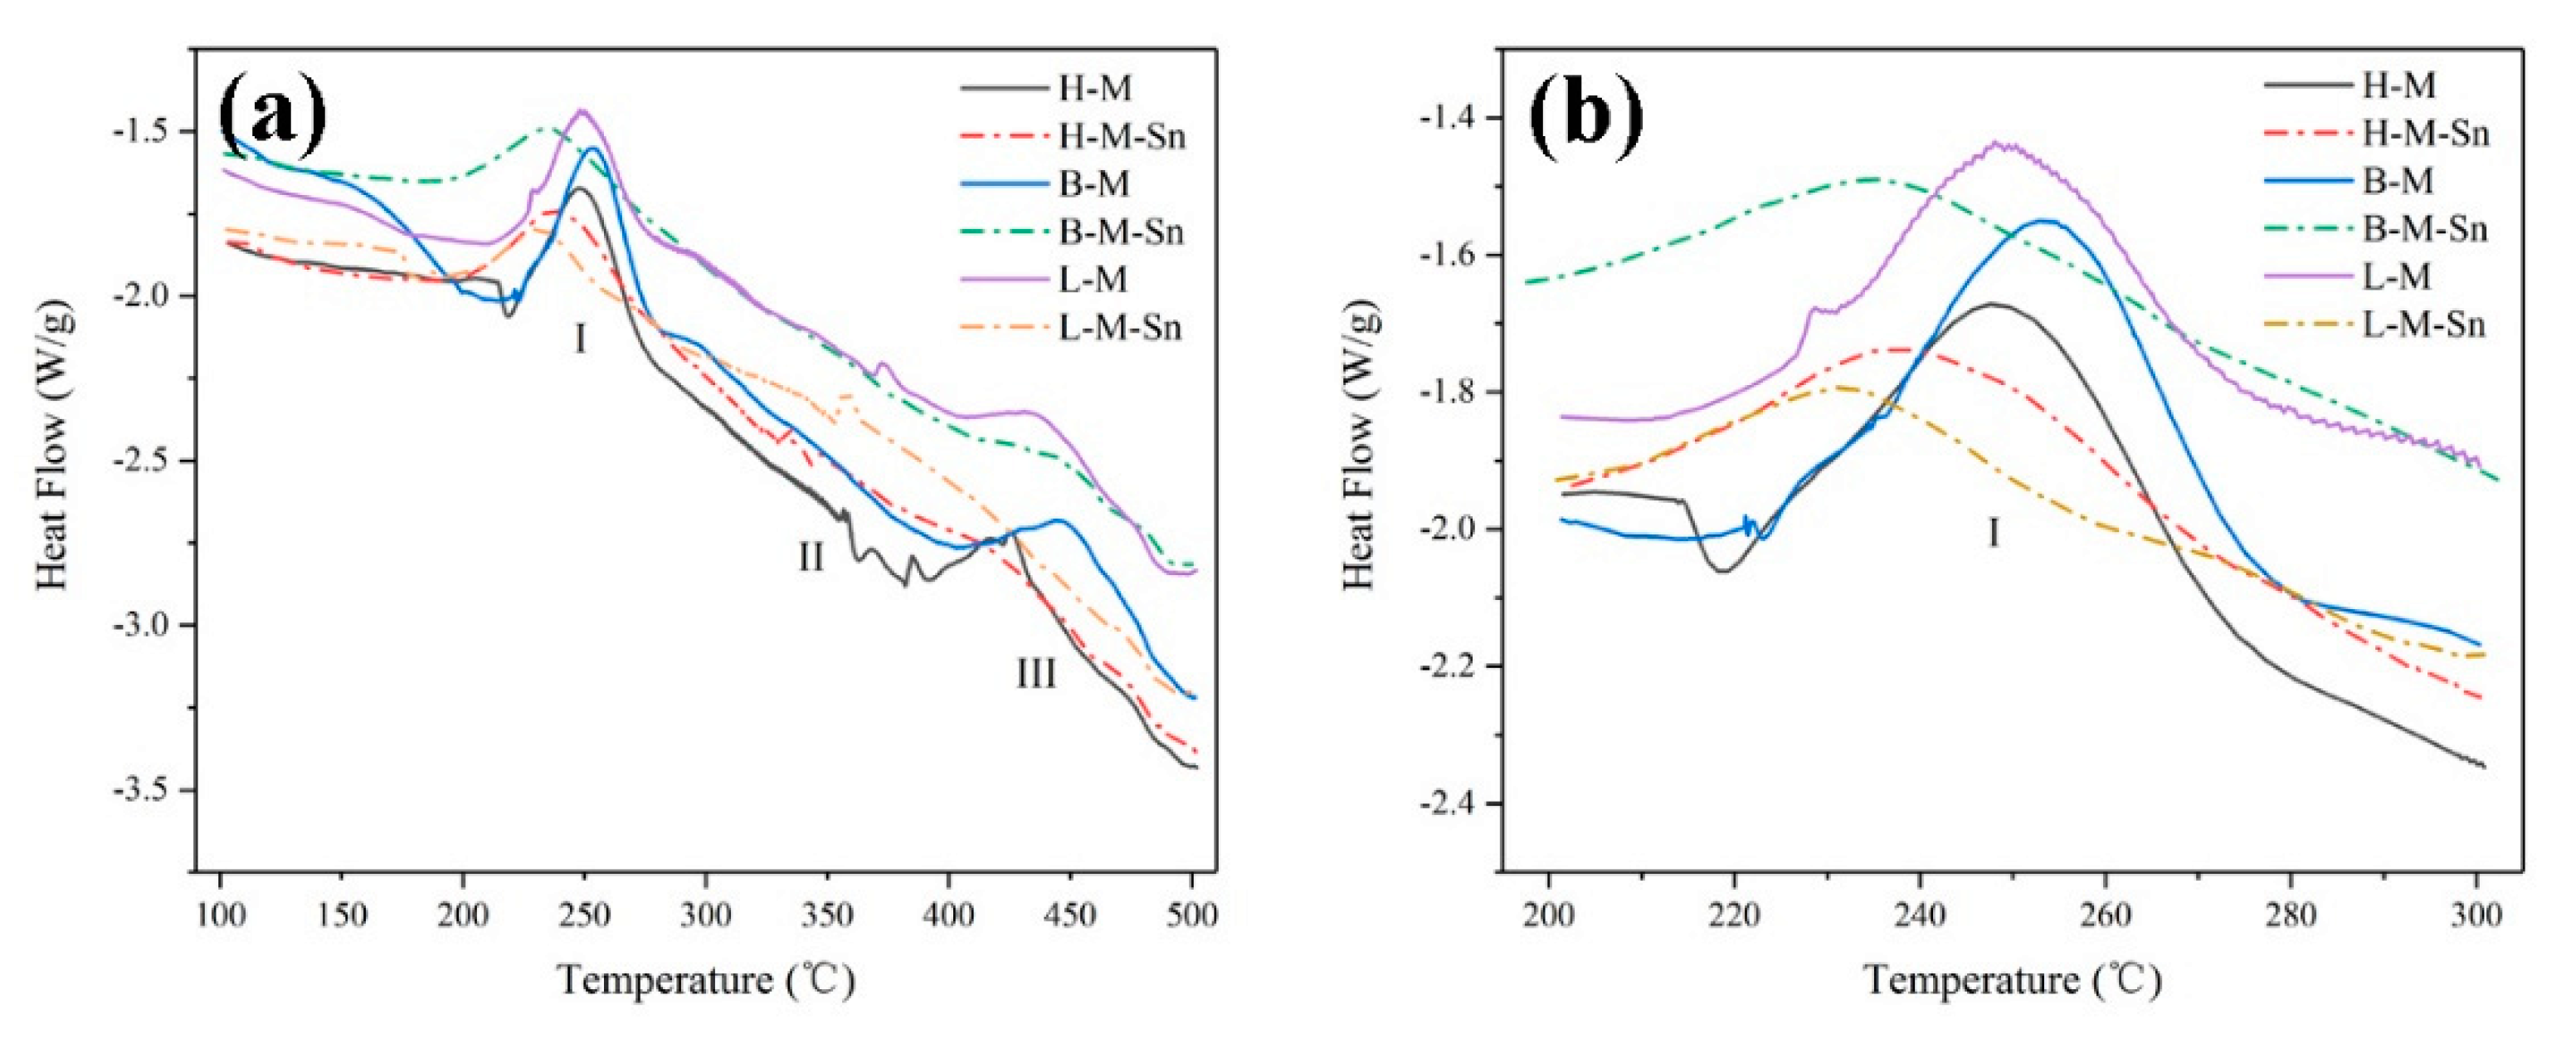
3.4. DSC Analysis
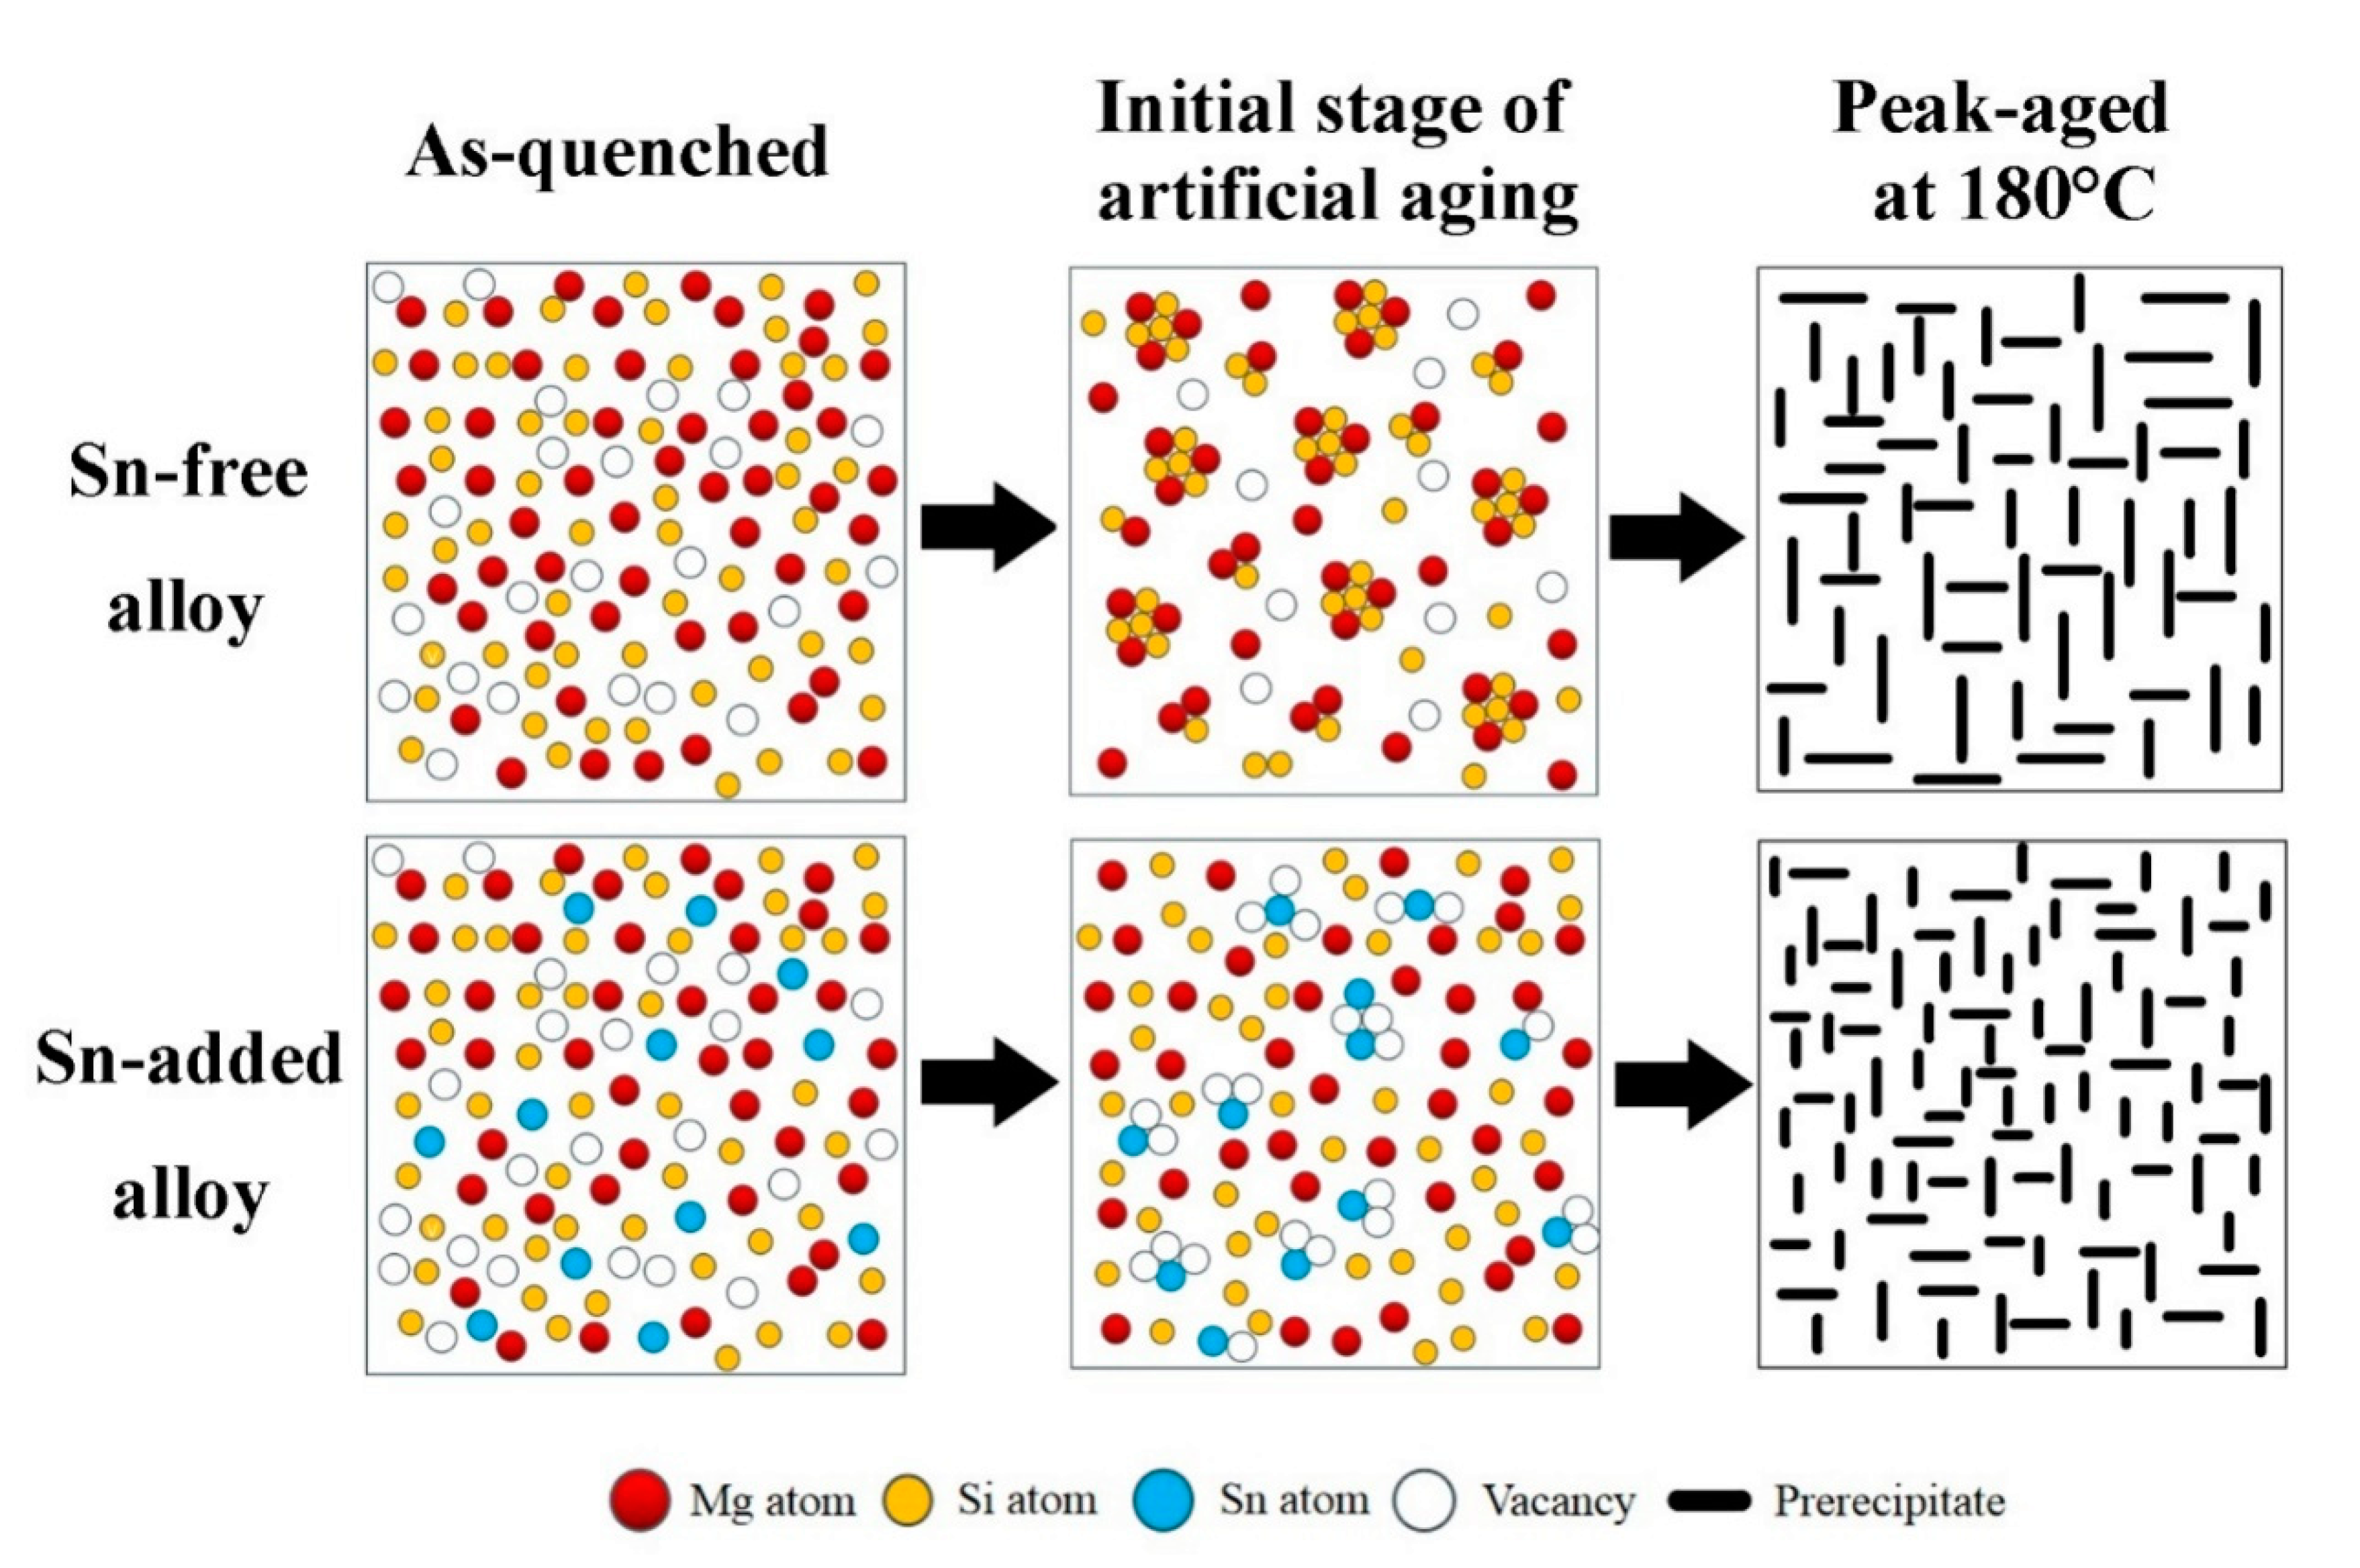
4. Discussion
5. Conclusions
- The addition of 0.10% wt. Sn to alloys with a 1.68 Mg/Si ratio can improve the age-hardening ability of the alloy during artificial aging at 180 °C. Sn reduces the activation energy of the β″ precipitates, increases the density of the β″ precipitates, and significantly increases the yield and tensile strength of the peak aged alloy by 22.7 and 17.2 MPa, respectively.
- The addition of 0.11% wt. Sn to alloys with 1.00 Mg/Si ratio can reduce the aging hardenability of the alloy during artificial aging at 180 °C, but no significant effect on the hardness of the alloy after peak aging can be found. Sn reduces the activation energy of the β″ precipitates, increases the density of the β″ precipitates, and increases the yield and tensile strength of the peak aged alloys by 4.8 and 5.1 MPa, respectively.
- The addition of 0.11% wt. Sn to alloys with the 0.58 Mg/Si ratio can improve the age-hardening ability of the alloy during artificial aging at 180 °C, but can reduce the peak hardness of the alloy. In alloys with 0.58 Mg/Si ratio, although Sn can reduce the activation energy of the β″ precipitates and increase the density of the β″ precipitate, it also prevents the growth of the β″ precipitate, reducing the length and diameter of the β″ precipitate. Therefore, Sn weakened the strengthening effect of β″ precipitates in the alloy with 0.58 Mg/Si ratio, and decreased the yield and tensile strength of the peak aged alloy by 12.5 and 5.8 MPa, respectively.
Author Contributions
Funding
Conflicts of Interest
References
- Moons, T.; Ratchev, P.; De Smet, P.; Verlinden, B.; Van Houtte, P. A comparative study of two Al–Mg–Si alloys for automotive applications. Scr. Mater. 1996, 35, 939–945. [Google Scholar] [CrossRef]
- Miller, W.; Zhuang, L.; Bottema, J.; Wittebrood, A.; De Smet, P.; Haszler, A.; Vieregge, A. Recent development in aluminium alloys for the automotive industry. Mater. Sci. Eng. A 2000, 280, 37–49. [Google Scholar] [CrossRef]
- Hirsch, J.; Al-Samman, T. Superior light metals by texture engineering: Optimized aluminum and magnesium alloys for automotive applications. Acta Mater. 2013, 61, 818–843. [Google Scholar] [CrossRef]
- Buha, J.; Lumley, R.N.; Crosky, A.G.; Hono, K. Secondary precipitation in an Al-Mg-Si-Cu alloy. Acta Mater. 2007, 55, 3015–3024. [Google Scholar] [CrossRef]
- Tsao, C.-S.; Chen, C.-Y.; Jeng, U.-S.; Kuo, T.-Y. Precipitation kinetics and transformation of metastable phases in Al–Mg–Si alloys. Acta Mater. 2006, 54, 4621–4631. [Google Scholar] [CrossRef]
- Li, K.; Idrissi, H.; Sha, G.; Song, M.; Lu, J.; Shi, H.; Wang, W.; Ringer, S.; Du, Y.; Schryvers, D. Quantitative measurement for the microstructural parameters of nano-precipitates in Al-Mg-Si-Cu alloys. Mater. Charact. 2016, 118, 352–362. [Google Scholar] [CrossRef]
- Chen, J.; Costan, E.; Van Huis, M.; Xu, Q.; Zandbergen, H.W. Atomic Pillar-Based Nanoprecipitates Strengthen AlMgSi Alloys. Science 2006, 312, 416–419. [Google Scholar] [CrossRef] [Green Version]
- Vissers, R.; Van Huis, M.; Jansen, J.; Zandbergen, H.; Marioara, C.; Andersen, S. The crystal structure of the β′ phase in Al–Mg–Si alloys. Acta Mater. 2007, 55, 3815–3823. [Google Scholar] [CrossRef]
- Ravi, C. First-principles study of crystal structure and stability of Al-Mg-Si-(Cu) precipitates. Acta Mater. 2004, 52, 4213–4227. [Google Scholar] [CrossRef]
- Ding, L.; Jia, Z.; Nie, J.-F.; Weng, Y.; Cao, L.; Chen, H.; Wu, X.; Liu, Q. The structural and compositional evolution of precipitates in Al-Mg-Si-Cu alloy. Acta Mater. 2018, 145, 437–450. [Google Scholar] [CrossRef]
- Ninive, P.H.; Strandlie, A.; Gulbrandsen-Dahl, S.; Lefebvre, W.; Marioara, C.D.; Andersen, S.J.; Friis, J.; Holmestad, R.; Løvvik, O.M. Detailed atomistic insight into the β″ phase in Al–Mg–Si alloys. Acta Mater. 2014, 69, 126–134. [Google Scholar] [CrossRef] [Green Version]
- Marioara, C.D.; Andersen, S.J.; Jansen, J.; Zandbergen, H.W. The influence of temperature and storage time at RT on nucleation of the β″ phase in a 6082 Al–Mg–Si alloy. Acta Mater. 2003, 51, 789–796. [Google Scholar] [CrossRef]
- Pogatscher, S.; Antrekowitsch, H.; Leitner, H.; Ebner, T.; Uggowitzer, P. Mechanisms controlling the artificial aging of Al–Mg–Si Alloys. Acta Mater. 2011, 59, 3352–3363. [Google Scholar] [CrossRef]
- Martinsen, F.; Ehlers, F.; Torsæter, M.; Holmestad, R. Reversal of the negative natural aging effect in Al–Mg–Si alloys. Acta Mater. 2012, 60, 6091–6101. [Google Scholar] [CrossRef] [Green Version]
- Birol, Y. Pre-aging to improve bake hardening in a twin-roll cast Al–Mg–Si alloy. Mater. Sci. Eng. A 2005, 391, 175–180. [Google Scholar] [CrossRef]
- Birol, Y. Pre-straining to improve the bake hardening response of a twin-roll cast Al–Mg–Si alloy. Scr. Mater. 2005, 52, 169–173. [Google Scholar] [CrossRef]
- Pogatscher, S.; Antrekowitsch, H.; Leitner, H.; Pöschmann, D.; Zhang, Z.; Uggowitzer, P. Influence of interrupted quenching on artificial aging of Al–Mg–Si alloys. Acta Mater. 2012, 60, 4496–4505. [Google Scholar] [CrossRef]
- Pogatscher, S.; Antrekowitsch, H.; Leitner, H.; Sologubenko, A.; Uggowitzer, P. Influence of the thermal route on the peak-aged microstructures in an Al–Mg–Si aluminum alloy. Scr. Mater. 2013, 68, 158–161. [Google Scholar] [CrossRef]
- Shishido, H.; Takaki, Y.; Kozuka, M.; Matsumoto, K.; Aruga, Y. Effects of Sn Addition on Clustering and Age-Hardening Behavior in a Pre-Aged Al-Mg-Si Alloy. Mater. Sci. Forum 2016, 877, 455–460. [Google Scholar] [CrossRef]
- Cheng, T.; Jia, Z.; Weng, Y.; Hao, L.; Liu, Q. Effects of Sn/In additions on natural and artificial ageing of Al–Mg–Si alloys. Mater. Sci. Technol. 2018, 34, 2136–2144. [Google Scholar] [CrossRef]
- Tu, W.; Tang, J.; Zhang, Y.; Cao, L.; Ma, L.; Zhu, Q.; Ye, L.; Liu, S. Influence of Sn on the precipitation and hardening response of natural aged Al-0.4Mg-1.0Si alloy artificial aged at different temperatures. Mater. Sci. Eng. A 2019, 765, 138250. [Google Scholar]
- Tu, W.; Tang, J.; Zhang, Y.; Ye, L.; Liu, S.; Lu, J.; Zhan, X.; Li, C. Effect of Sn and Cu addition on the precipitation and hardening behavior of Al-1.0Mg-0.6Si alloy. Mater. Sci. Eng. A 2020, 770, 138515. [Google Scholar] [CrossRef]
- Liu, C.; Ma, P.; Zhan, L.; Huang, M.; Li, J. Solute Sn-induced formation of composite β′/β″ precipitates in Al–Mg–Si alloy. Scr. Mater. 2018, 155, 68–72. [Google Scholar] [CrossRef]
- Xiang, X.; Lai, Y.; Liu, C.; Chen, J. Sn-Induced Modification of the Precipitation Pathways upon High-Temperature Ageing in an Al–Mg–Si Alloy. Acta Metall. Sin. 2018, 54, 1273–1280. [Google Scholar]
- Zhang, X.; Liu, M.; Sun, H.; Banhart, J. Influence of Sn on the age hardening behavior of Al–Mg–Si alloys at different temperatures. Materialia 2019, 8, 100441. [Google Scholar] [CrossRef]
- Werinos, M.; Antrekowitsch, H.; Ebner, T.; Prillhofer, R.; Curtin, W.; Uggowitzer, P.; Pogatscher, S. Design strategy for controlled natural aging in Al–Mg–Si alloys. Acta Mater. 2016, 118, 296–305. [Google Scholar] [CrossRef]
- Liu, M.; Zhang, X.; Körner, B.; Elsayed, M.; Liang, Z.; Leyvraz, D.; Banhart, J. Effect of Sn and In on the natural ageing kinetics of Al–Mg–Si alloys. Materialia 2019, 6, 100261. [Google Scholar] [CrossRef]
- Luo, A.; Lloyd, D.; Gupta, A.; Youdelis, W. Precipitation and dissolution kinetics in Al-Li-Cu-Mg alloy 8090. Acta Met. Mater. 1993, 41, 769–776. [Google Scholar] [CrossRef]
- Guo, M.; Sha, G.; Cao, L.; Liu, W.; Zhang, J.; Zhuang, L. Enhanced bake-hardening response of an Al–Mg–Si–Cu alloy with Zn addition. Mater. Chem. Phys. 2015, 162, 15–19. [Google Scholar] [CrossRef]
- Guo, M.; Zhang, Y.; Zhang, X.; Zhang, J.; Zhuang, L. Non-isothermal precipitation behaviors of Al-Mg-Si-Cu alloys with different Zn contents. Mater. Sci. Eng. A 2016, 669, 20–32. [Google Scholar] [CrossRef]
- Li, H.; Yan, Z.; Cao, L.; Lia, H. Bake hardening behavior and precipitation kinetic of a novel Al-Mg-Si-Cu aluminum alloy for lightweight automotive body. Mater. Sci. Eng. A 2018, 728, 88–94. [Google Scholar] [CrossRef]
- Aruga, Y.; Kim, S.N.; Kozuka, M.; Kobayashi, E.; Sato, T. Effects of cluster characteristics on two-step aging behavior in Al-Mg-Si alloys with different Mg/Si ratios and natural aging periods. Mater. Sci. Eng. A 2018, 718, 371–376. [Google Scholar] [CrossRef]
- Murayama, M.; Hono, K. Pre-precipitate clusters and precipitation processes in Al–Mg–Si alloys. Acta Mater. 1999, 47, 1537–1548. [Google Scholar] [CrossRef]
- Serizawa, A.; Hirosawa, S.; Sato, T. Three-Dimensional Atom Probe Characterization of Nanoclusters Responsible for Multistep Aging Behavior of an Al-Mg-Si Alloy. Met. Mater. Trans. A 2008, 39, 243–251. [Google Scholar] [CrossRef]
- Meyruey, G.; Massardier, V.; Lefebvre, W.; Perez, M. Over-ageing of an Al-Mg-Si alloy with silicon excess. Mater. Sci. Eng. A 2018, 730, 92–105. [Google Scholar] [CrossRef]


| Alloys | Mg | Si | Sn | Fe | Ti | Mg/Si Ratio |
|---|---|---|---|---|---|---|
| H–M | 1.01 | 0.60 | 0.00 | 0.016 | 0.075 | 1.68 |
| H–M–Sn | 1.05 | 0.62 | 0.10 | 0.013 | 0.081 | 1.69 |
| B–M | 0.81 | 0.80 | 0.00 | 0.017 | 0.084 | 1.01 |
| B–M–Sn | 0.80 | 0.81 | 0.11 | 0.015 | 0.085 | 0.99 |
| L–M | 0.60 | 1.03 | 0.00 | 0.018 | 0.080 | 0.58 |
| L-M–Sn | 0.59 | 1.01 | 0.11 | 0.025 | 0.080 | 0.58 |
| Alloys | H–M | H–M–Sn | B–M | B–M–Sn | L–M | L-M–Sn |
|---|---|---|---|---|---|---|
| Yield Strength (MPa) | 277.4 | 300.1 | 296.3 | 301.1 | 290.3 | 277.8 |
| Ultimate Tensile Strength (MPa) | 286.6 | 303.8 | 309.1 | 314.2 | 296.7 | 290.9 |
| Elongation (%) | 7.2 | 5.4 | 4.4 | 5.1 | 6.4 | 7.1 |
| Alloys | H-M | H-M-Sn | B-M | B-M-Sn | L-M | L-M-Sn |
|---|---|---|---|---|---|---|
| Average length of the precipitated (nm) | 17.3 | 12.1 | 19.7 | 12.8 | 23.1 | 8.9 |
| Average diameter of the precipitated (nm) | 3.9 | 3.6 | 3.7 | 3.1 | 3.3 | 2.7 |
| Average density of the precipitate(×1015/m2) | 2.55 | 3.55 | 2.68 | 3.85 | 3.05 | 4.30 |
| Alloys | H–M | H–M–Sn | B–M | B–M–Sn | L–M | L-M–Sn |
|---|---|---|---|---|---|---|
| Temperature of the β″ precipitation peak (°C) | 249.6 | 243.9 | 252.8 | 242.3 | 244.7 | 236.7 |
| Activation energy of β″precipitates (kJ/mol) | 74.06 | 44.58 | 74.65 | 41.32 | 67.84 | 47.43 |
© 2020 by the authors. Licensee MDPI, Basel, Switzerland. This article is an open access article distributed under the terms and conditions of the Creative Commons Attribution (CC BY) license (http://creativecommons.org/licenses/by/4.0/).
Share and Cite
Ma, L.; Tang, J.; Tu, W.; Ye, L.; Jiang, H.; Zhan, X.; Zhao, J. Effect of a Trace Addition of Sn on the Aging Behavior of Al–Mg–Si Alloy with a Different Mg/Si Ratio. Materials 2020, 13, 913. https://doi.org/10.3390/ma13040913
Ma L, Tang J, Tu W, Ye L, Jiang H, Zhan X, Zhao J. Effect of a Trace Addition of Sn on the Aging Behavior of Al–Mg–Si Alloy with a Different Mg/Si Ratio. Materials. 2020; 13(4):913. https://doi.org/10.3390/ma13040913
Chicago/Turabian StyleMa, Lehang, Jianguo Tang, Wenbin Tu, Lingying Ye, Haichun Jiang, Xin Zhan, and Jiuhui Zhao. 2020. "Effect of a Trace Addition of Sn on the Aging Behavior of Al–Mg–Si Alloy with a Different Mg/Si Ratio" Materials 13, no. 4: 913. https://doi.org/10.3390/ma13040913
APA StyleMa, L., Tang, J., Tu, W., Ye, L., Jiang, H., Zhan, X., & Zhao, J. (2020). Effect of a Trace Addition of Sn on the Aging Behavior of Al–Mg–Si Alloy with a Different Mg/Si Ratio. Materials, 13(4), 913. https://doi.org/10.3390/ma13040913