Article

Discrete Element Method Modelling of the Diametral Compression of Starch Agglomerates

Institute of Agrophysics, Polish Academy of Sciences, Doświadczalna 4, 20-290 Lublin, Poland
*
Author to whom correspondence should be addressed.
Materials 2020, 13(4), 932; https://doi.org/10.3390/ma13040932
Submission received: 27 January 2020 / Revised: 14 February 2020 / Accepted: 15 February 2020 / Published: 20 February 2020
(This article belongs to the Section Materials Simulation and Design)

Abstract

:
Starch agglomerates are widely applied in the pharmaceutical, agricultural, and food industries. The formation of potato starch tablets and their diametral compression were simulated numerically and verified in a laboratory experiment to analyse the microscopic mechanisms of the compaction and the origins of their breakage strength. Discrete element method (DEM) simulations were performed using EDEM software. Samples comprised of 120,000 spherical particles with radii normally distributed in the range of 5–36 μm were compacted in a cylindrical die with a diameter of 2.5 cm. The linear elastic–plastic constitutive contact model with a parallel bonded-particle model (BPM) was used to model the diametral compression. DEM simulations indicated that the BPM, together with the linear elastic–plastic contact model, could describe the brittle, semi-brittle, or ductile breakage mode, depending on the ratio of the strength to Young’s modulus of the bond and the bond-to-contact elasticity ratio. Experiments confirmed the findings of the DEM simulations and indicated that potato starch (PS) agglomerates can behave as a brittle, semi-brittle, or ductile material, depending on the applied binder. The PS agglomerates without any additives behaved as a semi-brittle material. The addition of 5% of ground sugar resulted in the brittle breakage mode. The addition of 5% gluten resulted in the ductile breakage mode.

Graphical Abstract

1. Introduction

Agglomeration of powders is one of the unit operations for improving the characteristics and functionality of the final product. It is widely applied in the pharmaceutical, agricultural, food, mineral, metallurgy, and fuel biomass industries [1]. The quality of compacts is influenced by the powder and binder properties, as well as the compaction pressure [2]. The strength of the agglomerates is one of the most important properties affecting the final product [3]. Two of the most frequently applied tests for assessing the tensile strength of compacts are the diametral compression test and the uniaxial, unconfined compression test.
During mechanical tests, agglomerates are subjected to external loads, resulting in elastic and plastic deformation and ultimate failure. After the peak value of the stress is reached, fracture of the agglomerate occurs, and the stress decreases to a residual stress state [4]. Depending on the amount of plastic deformation needed to cause failure and shape of the force–displacement response, agglomerates can be classified as brittle, semi-brittle, or ductile. Strongly brittle materials, such as rock, glass, and monolithic ceramics, exhibit no detectable plastic strain prior to failure and a sharp peak of the force–displacement response [5,6]. Brittle mechanical behaviour involves localised cracks [7]. Materials with intermediate compacted structures and an intermediate bond stiffness characterised by a round force–displacement response are considered semi-brittle. Semi-brittle materials include polymers [8,9], inorganic materials connected by a soft binder [10], and pharmaceutical granules [11]. Materials with loose structures and a low bond stiffness that exhibit a significant amount of fully plastic deformation prior to failure are considered ductile [5]. These include sand–asphalt mixtures [12]; soft, high-porosity materials, such as aerogel composites [13]; pellets of biomass [14]; and lightweight food products of the extrusion process [15]. Food and pharmaceutical granules (and tablets) can exhibit brittle [16], semi-brittle, or ductile [17] behaviour, depending on the material composition, applied binder, and porosity of the agglomerates. Dhanalakshmi and Bhattacharya [18] demonstrated that pressure-agglomerated corn starch exhibited brittle, semi-brittle, and ductile behaviour when glued by pre-gelatinised starch, sugar, and vegetable oil, respectively. This is consistent with findings indicating that the properties of adhesives (ductile or brittle) significantly affect the strength behaviour of joints [19].
Theories regarding failure mechanisms have been developed, but the behaviour of some agglomerates remains unclear [7]. The formation mechanisms of adhesion bonds during agglomeration, the fracture process of compacts during mechanical tests, and the conditions of the transition among localised brittle, semi-brittle, and ductile deformation with the change of the material parameters require deeper understanding [2,20,21].
The diametral compression test (also known as the Brazilian disk test) is widely used for determining the tensile strength of circular objects, owing to its simplicity (Figure 1b). The stress component σy is compressive, while the stress component σx (in the direction perpendicular to the load) is tensile in locations close to the disc centre and compressive at the upper most locations close to the loading plates. For x = 0 and y = 0, the stresses σx and σy are the principal stresses σ1 and σ2, respectively [22]. The tensile strength σf of the agglomerates is identified by the maximum tensile stress σ1,max in the direction perpendicular to the load in the centre of the disc (x = 0, y = 0) [23]:
σ f = σ 1 , max = P f π R t ,
where P f is the failure load, R is the radius of the agglomerate, and t is its thickness.
The mechanical properties of compacts can be related to the properties of single granules using the micromechanical approach. The discrete element method (DEM) proposed by Cundall and Strack [24] is a very promising tool for obtaining insight into the problem of powder compaction at the particle level. To simulate the internal structure of the agglomerate and its breakage, the method has been extended with the bonded-particle model (BPM), as proposed by Potyondy and Cundall [25]. The brittle and semi-brittle breakage processes can be approximated well using the BPM. Three regions of the proportion of the elastic modulus of bond Eb to the elastic modulus of particle E can be distinguished: Eb = E [25,26,27], Eb > E [28], and Eb < E [3,29]. For EbE, the DEM models provide typical brittle behaviour, characterised by a rapid decrease of the force–displacement response [27]. As the Eb/E ratio decreases, the breakage mode evolves from brittle to semi-brittle, with a round force–displacement response [30,31,32].
The objective of this study was to investigate the possibility of numerically reproducing the brittle, semi-brittle, and ductile breakage modes of agglomerates by using the DEM together with a parallel BPM.

2. Materials and Methods

2.1. Materials

Potato starch (PS) produced by Melvit S.A., Warsaw, Poland and ground sugar (GS) were purchased from a local supermarket. Wheat gluten (WG) was obtained from Sigma–Aldrich Ltd., Poznań, Poland.

2.2. Methods

The initial moisture content of the PS was 10%. The PS without any additives or with the addition of 5% gluten or sugar was moistened for 48 h in a humidifier in a closed space at a relative humidity of 70% and a temperature of 21 °C, in order to increase the moisture content to 17%. Steam conditioning was applied for 60 s prior to agglomeration to increase the solubility of the additives, i.e., sugar or gluten. To minimise the PS gelatinisation, the temperature of the steam was 60 °C [33]. The steaming increased the moisture content by no more than 0.2%. The moisture content (wet basis) was measured gravimetrically by weighting a 10 g sample in the wet state and after drying at 105 °C for 24 h.
Samples of 0.5 g of PS were compacted in a stainless-steel cylindrical die with a diameter of 10 mm, at a displacement rate of 0.02 mm s−1 up to compaction pressures of σz = 38, 76, 114, and 153 MPa (Figure 1a). The height of the tablet after unloading and relaxation, determined by a caliper with an accuracy of 0.01 mm, was 4.8 ± 0.1 mm. The tensile strength was determined via a diametral compression test with a displacement rate of 0.033 mm s−1. The compression tests were performed immediately after the compaction process to avoid the effect of storage time on the strength. The reference material was PS with a moisture content of 17%, without additives. All variants of the experiments were repeated 10 times.

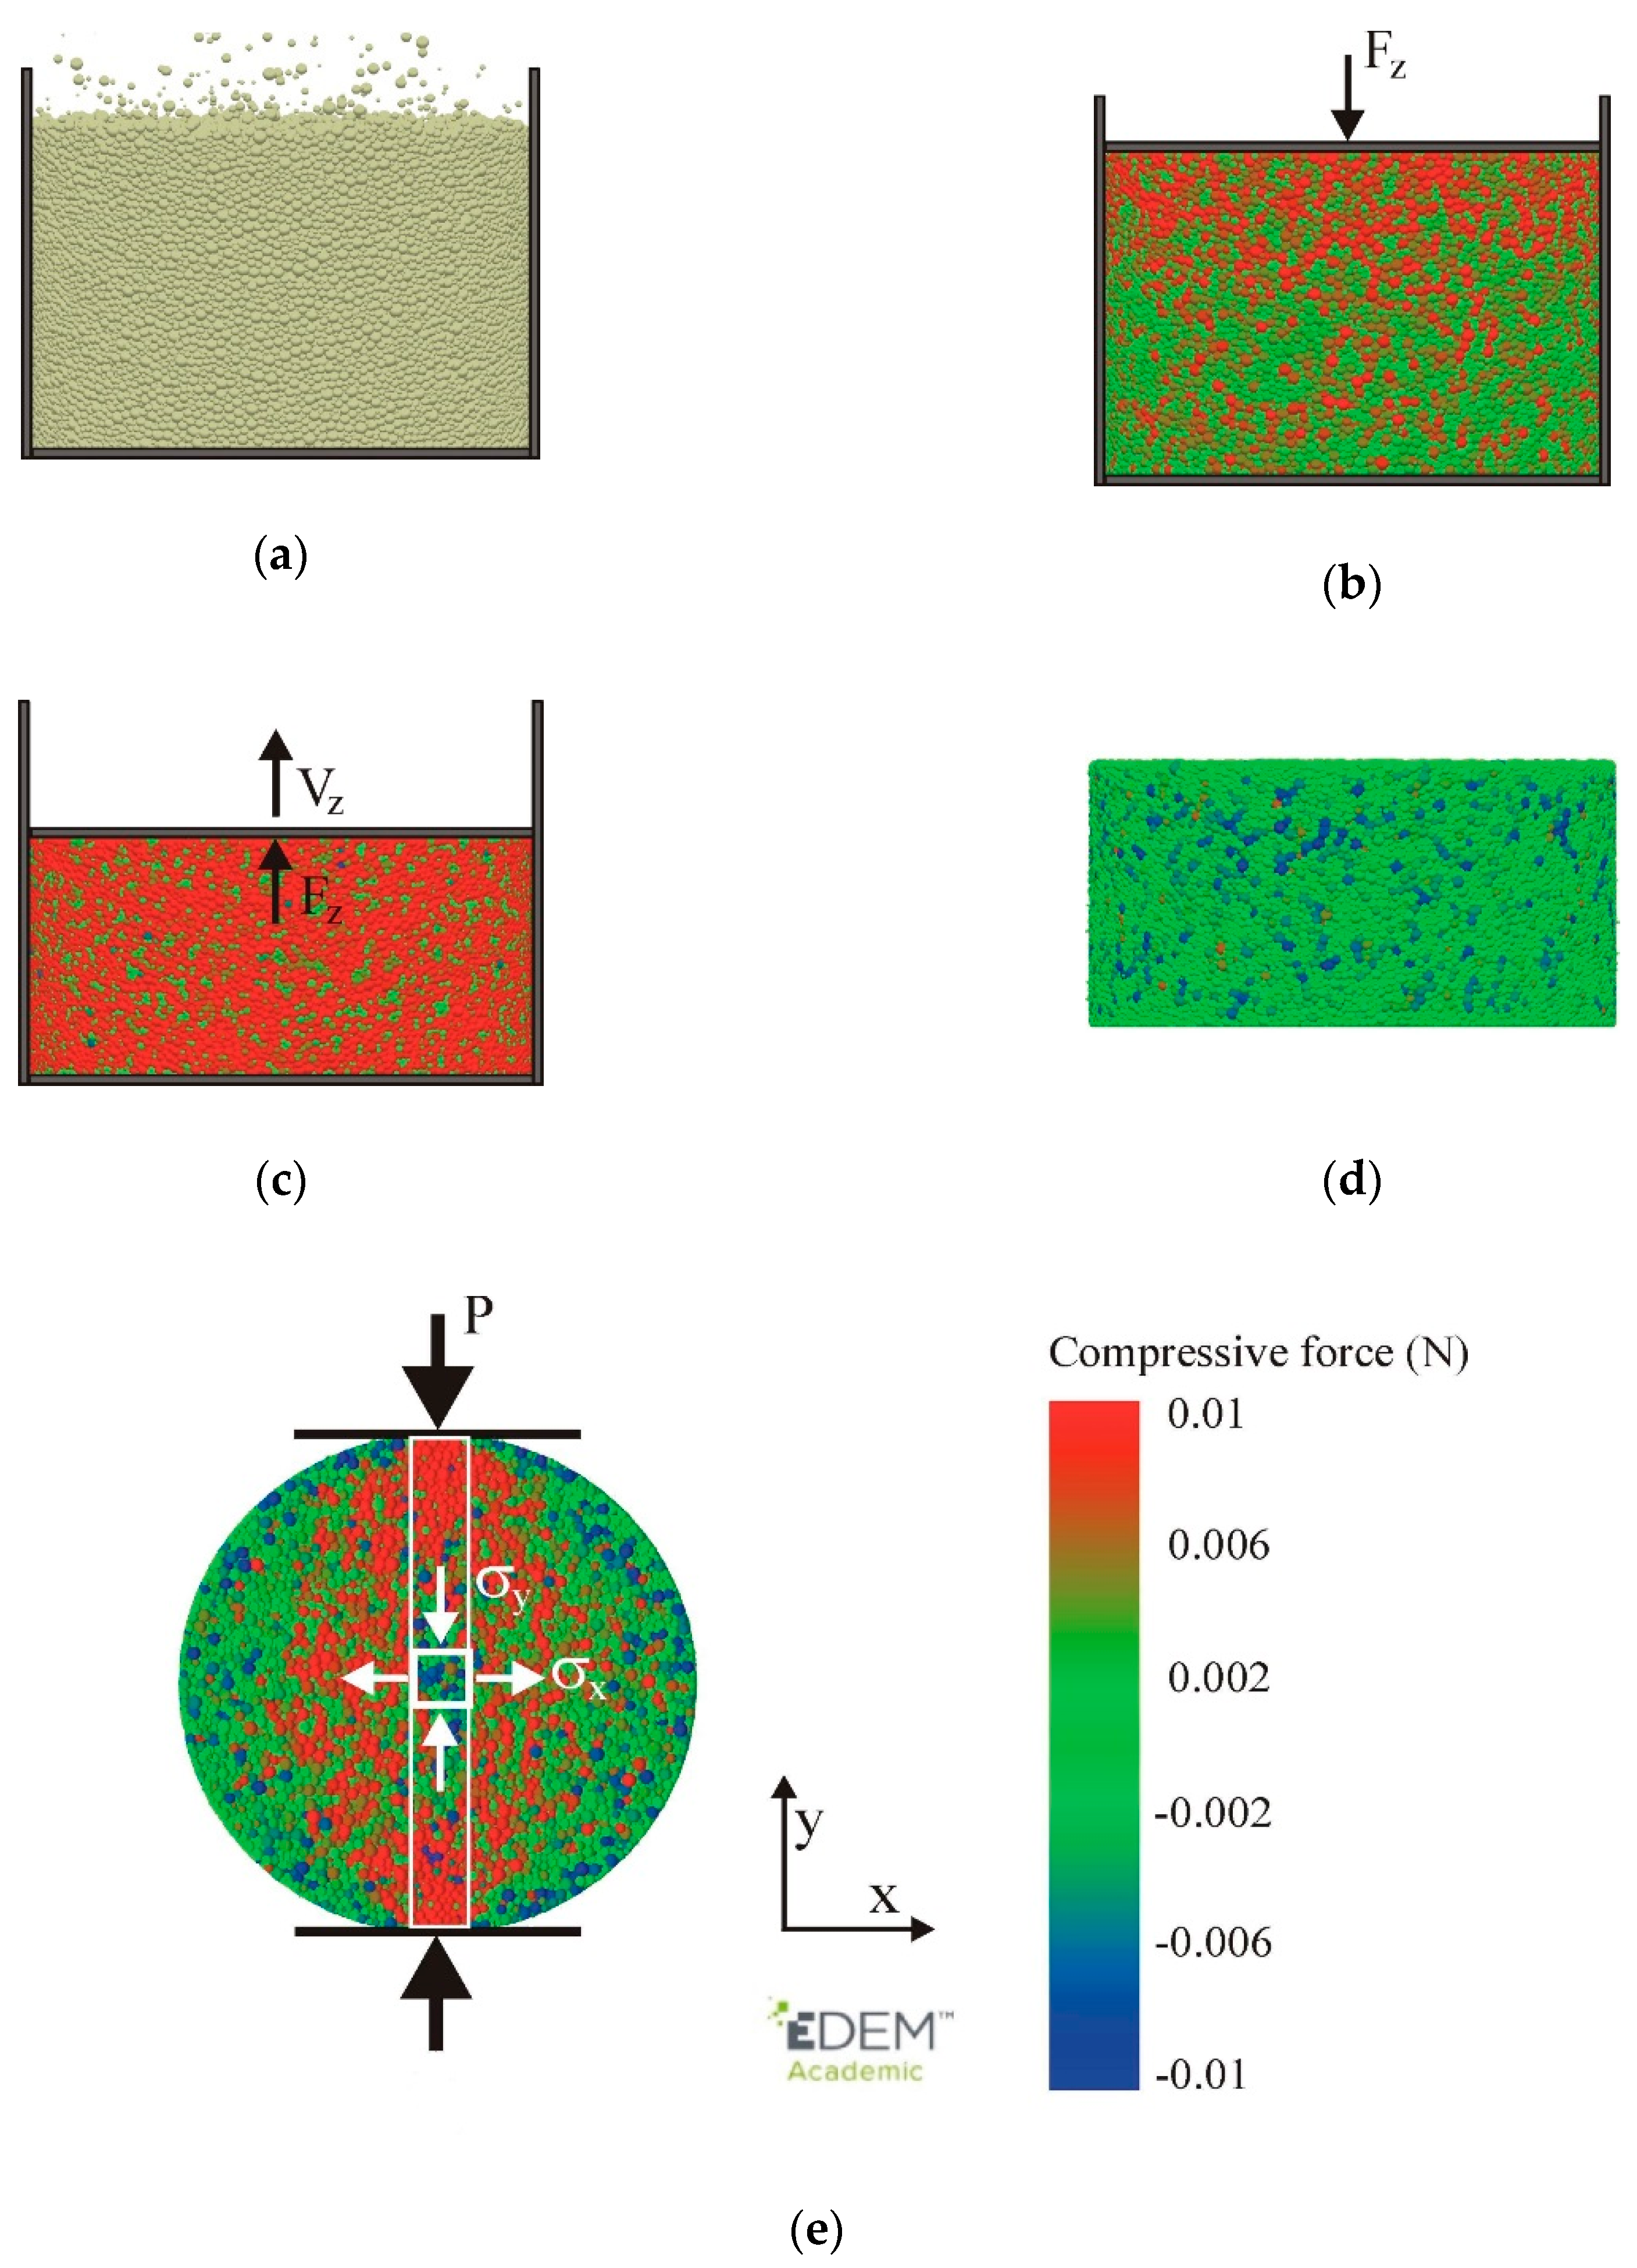
3. Discrete Element Method Setup

The linear hysteretic spring contact model introduced by Walton and Brown [34] was used for simulations. The model was equipped with linear adhesion according to concept of Luding [35]. The contact force–displacement scheme in the normal direction considered the plastic contact deformation, elastic unloading and reloading, and attractive adhesion forces:
f n = { k 1 δ n l o a d i n g k 2 ( δ n δ n , 0 ) k 1 δ n k 2 ( δ n δ n , 0 ) u n l o a d i n g / r e l o a d i n g k 1 δ n > k 2 ( δ n δ n , 0 ) > k c δ n k c δ n u n l o a d i n g k c δ n k 2 ( δ n δ n , 0 ) ,
where fn is the contact force, k1 is the loading (plastic) stiffness, k2 is the unloading (elastic) stiffness, kc is the adhesive stiffness, and δn is the overlap in the normal direction (Figure 2a). During unloading, the force fn decreased to zero at the overlap δn,0. The plastic stiffness k1 was related to the yield strength py of a particle as follows [36,37]:
p y = 2 E π δ n , y r ,
k 1 = 5 r * min ( p y , i , p y , j ) ,
where E is Young’s modulus, r is the radius of a particle, δn,y is the yielding overlap, r * = r i r j / ( r i + r j ) is the equivalent radius of the contacting particles, and py,i and py,j are the yield strengths of particles i and j, respectively. The energy dissipation in the normal direction was due to the difference between the loading and unloading stiffness and the elastic stiffness k2. For unloading and reloading, k2 was related to k1 through the restitution coefficient e [37], as follows:
e = k 1 k 2 .
The particle–particle force in the tangential direction ft was updated incrementally as follows:
f t = { ( f t ) 0 + k t Δ δ t + f t d , i f | f t | < μ p p f n Δ δ t | Δ δ t | μ p p f n , i f | f t | μ p p f n ,
where (ft)0 is the tangential force at the end of the previous timestep; kt and δt are the stiffness and overlap in the tangential direction, respectively; and μp-p is the particle–particle friction coefficient. The stiffness in the tangential direction kt was assumed to be equal to the stiffness in the normal direction. The velocity-dependent dissipative component f t d of the tangential force ft is defined as follows [37,38]:
f d t = 4 m * k t 1 + ( π ln e ) 2 v t ,
where m * = m i m j / ( m i + m j ) is the equivalent mass of the contacting particles, and vt is the relative velocity in the tangential direction.
The adhesion model relates the force to the contact area as follows: f n = k π r * δ n , where k is the adhesion energy density [37]. Hence, the adhesive stiffness kc has a linear relationship with the adhesion energy density k and the equivalent radius of the contacting particles r*:
k c = π k r * .
The BPM model proposed by Potyondy and Cundall [25] was introduced to describe the interparticle bonding forces and moments (Figure 2b). The forces and moments of the bond connections between two particles were calculated incrementally [37]:
Δ f n b = v n k n b A Δ t Δ f t b = v t k t b A Δ t Δ M n b = ω n k t b J Δ t Δ M t b = ω t k n b J 2 Δ t
where vn and vt are the relative velocities in the normal and tangential directions, respectively; k n b and k t b are the stiffnesses in the normal and tangential directions, respectively; A = π r b 2 and J = π r b 4 2 are the area and moment of inertia of the bond cross section, respectively; rb is the radius of the bond; and Δt is the time increment.
The Young’s modulus of the bond Eb is:
E b = k n b ( r i + r j ) ,
where k n b is the stiffness in the normal direction, ri and rj are radii of the contacting particles i and j, respectively.
The bond is broken when the maximum normal stress σ max b exceeds the tension strength σc or the maximum tangent stress τ max b exceeds the shear strength τc:
σ max b = f n b A + 2 M t b J r b > σ c τ max b = f t b A + M n b J r b > τ c .
The DEM simulation was separated into five stages: filling, compaction, unloading, relaxation, and diametral compression, as shown in Figure 3. The cylindrical die had a diameter of 2.5 mm and a height of 6 mm, yielding a DEM/experiment scale ratio of 1:4 for the agglomerate. Spherical particles simulating PS [39] with radii normally distributed (mean value of 20 μm, standard deviation of 7.5 μm, range of 5–36 μm) (Table 1) were generated randomly in the die (Figure 3a). The assembly consisted of 120,000 particles. After settlement, the particles were compacted with a piston axial velocity of 10−3 m s−1 to the assumed value of the agglomeration pressure σ z c (Figure 3b). After the desired agglomeration pressure was reached, the sample was unloaded with the same velocity (Figure 3c). After complete unloading, the mould was removed, and relaxation of the agglomerate was performed (Figure 3d). Simulations of the diametral compression were performed, with the displacement velocity in the range from 10−5 to 10−3 m s−1.
For filling and compaction, the linear hysteretic model was applied. In accordance with the findings of He et al. [40], the plastic stiffness k1 of 3 × 10⁴ N m−1 was adjusted to provide an in-die agglomerate porosity of ε < 0.1 under the compaction pressure of 153 MPa. For the assumed Young’s modulus of the PS (2.5 × 10³ MPa) [41], the corresponding value of the yielding overlap δy (Equation (3)) was 0.0354r. The adopted value of the restitution coefficient (e = 0.5), which is typical for biological materials [42], provided an elastic stiffness coefficient of k2 = 1.2 × 10⁵ N m−1.
The linear hysteretic model was extended to account for linear adhesion, in order to minimize changes in the structure of the agglomerate during unloading and relaxation. The adhesive stiffness kc was set as 300 N m−1 [43] to match the experimental tensile strength of the agglomerate. For the diametral compression test, the adhesion model was replaced with the parallel BPM to prevent simulations from appearing on secondary adhesive contacts, which might affect the resultant tensile strength of the agglomerates.
The Poisson ratio ν = 0.25 and the coefficient of restitution e = 0.5 were adopted for the DEM simulations, as is typical for materials of biological origin [42]. The particle–wall friction coefficient μp-w of 0.1 was taken as half of the coefficient of the sliding friction of PS against stainless steel [44], in order to account for lubrication with magnesium stearate [45]. The coefficient of particle–particle friction μp-p was set to 0.5 to reproduce the typical values of 30°−35° for the angle of internal friction of PS [46]. The coefficient of rolling friction mr was set as 0.01, in accordance with the best-fit values from similar studies on spherical particles [47].
To reduce the computational time, the particle density was increased by a factor of 106. To keep the gravitational force unchanged, the gravitational acceleration was reduced by a factor of 106. As shown in [43], scaling the density by a factor of 106 did not change the shape of the σ1L/D) characteristics, and reduced the tensile strength σf by 1.2% of the strength of the sample without density scaling. Time integration was performed with steps of 3 × 10⁻⁶ s, i.e., 14% of the Rayleigh timestep [48]. The EDEM software package [37] was used for the numerical simulations.
The components of the macroscopic “quasi-static” stress tensor σij in the system of particles averaged over all the contacts in volume V were determined as the dyadic product of the contact force f j c vector at contact c and the branch vector l i c connecting two contacting particles a and b, according to the concept presented by Christoffersen et al. [49]:
σ i j = 1 V c = 1 N c l i c f j c ( i , j = x , y , z ) .
The representative volume element (RVE) of the particle contacts used for the calculation of the stress components was a cuboid (0.25 × 0.25 × 1.2 mm) moved along the vertical direction to obtain the stress profile along the loading direction (Figure 3e) [43]. The average number of contacts in the RVE was 19,000.

4. Results

4.1. Tensile Strength of Agglomerates

To adjust the bond and the particle parameters to the best-fit experimental data of the compaction process and the strength test of the agglomerates, preliminary simulations and analyses of the effects of different parameters on the relationship between the tension stress σ1 and the diametral deformation ΔL/D, the tensile strength of the agglomerates σf during diametral compression, and the breakage mode were performed. These simulations and analyses included the shear strength of the bond τc, the tensile strength of the bond σc, the Young’s modulus of the bond Eb, and the residual overlap at the instant of bond initiation δn,0.

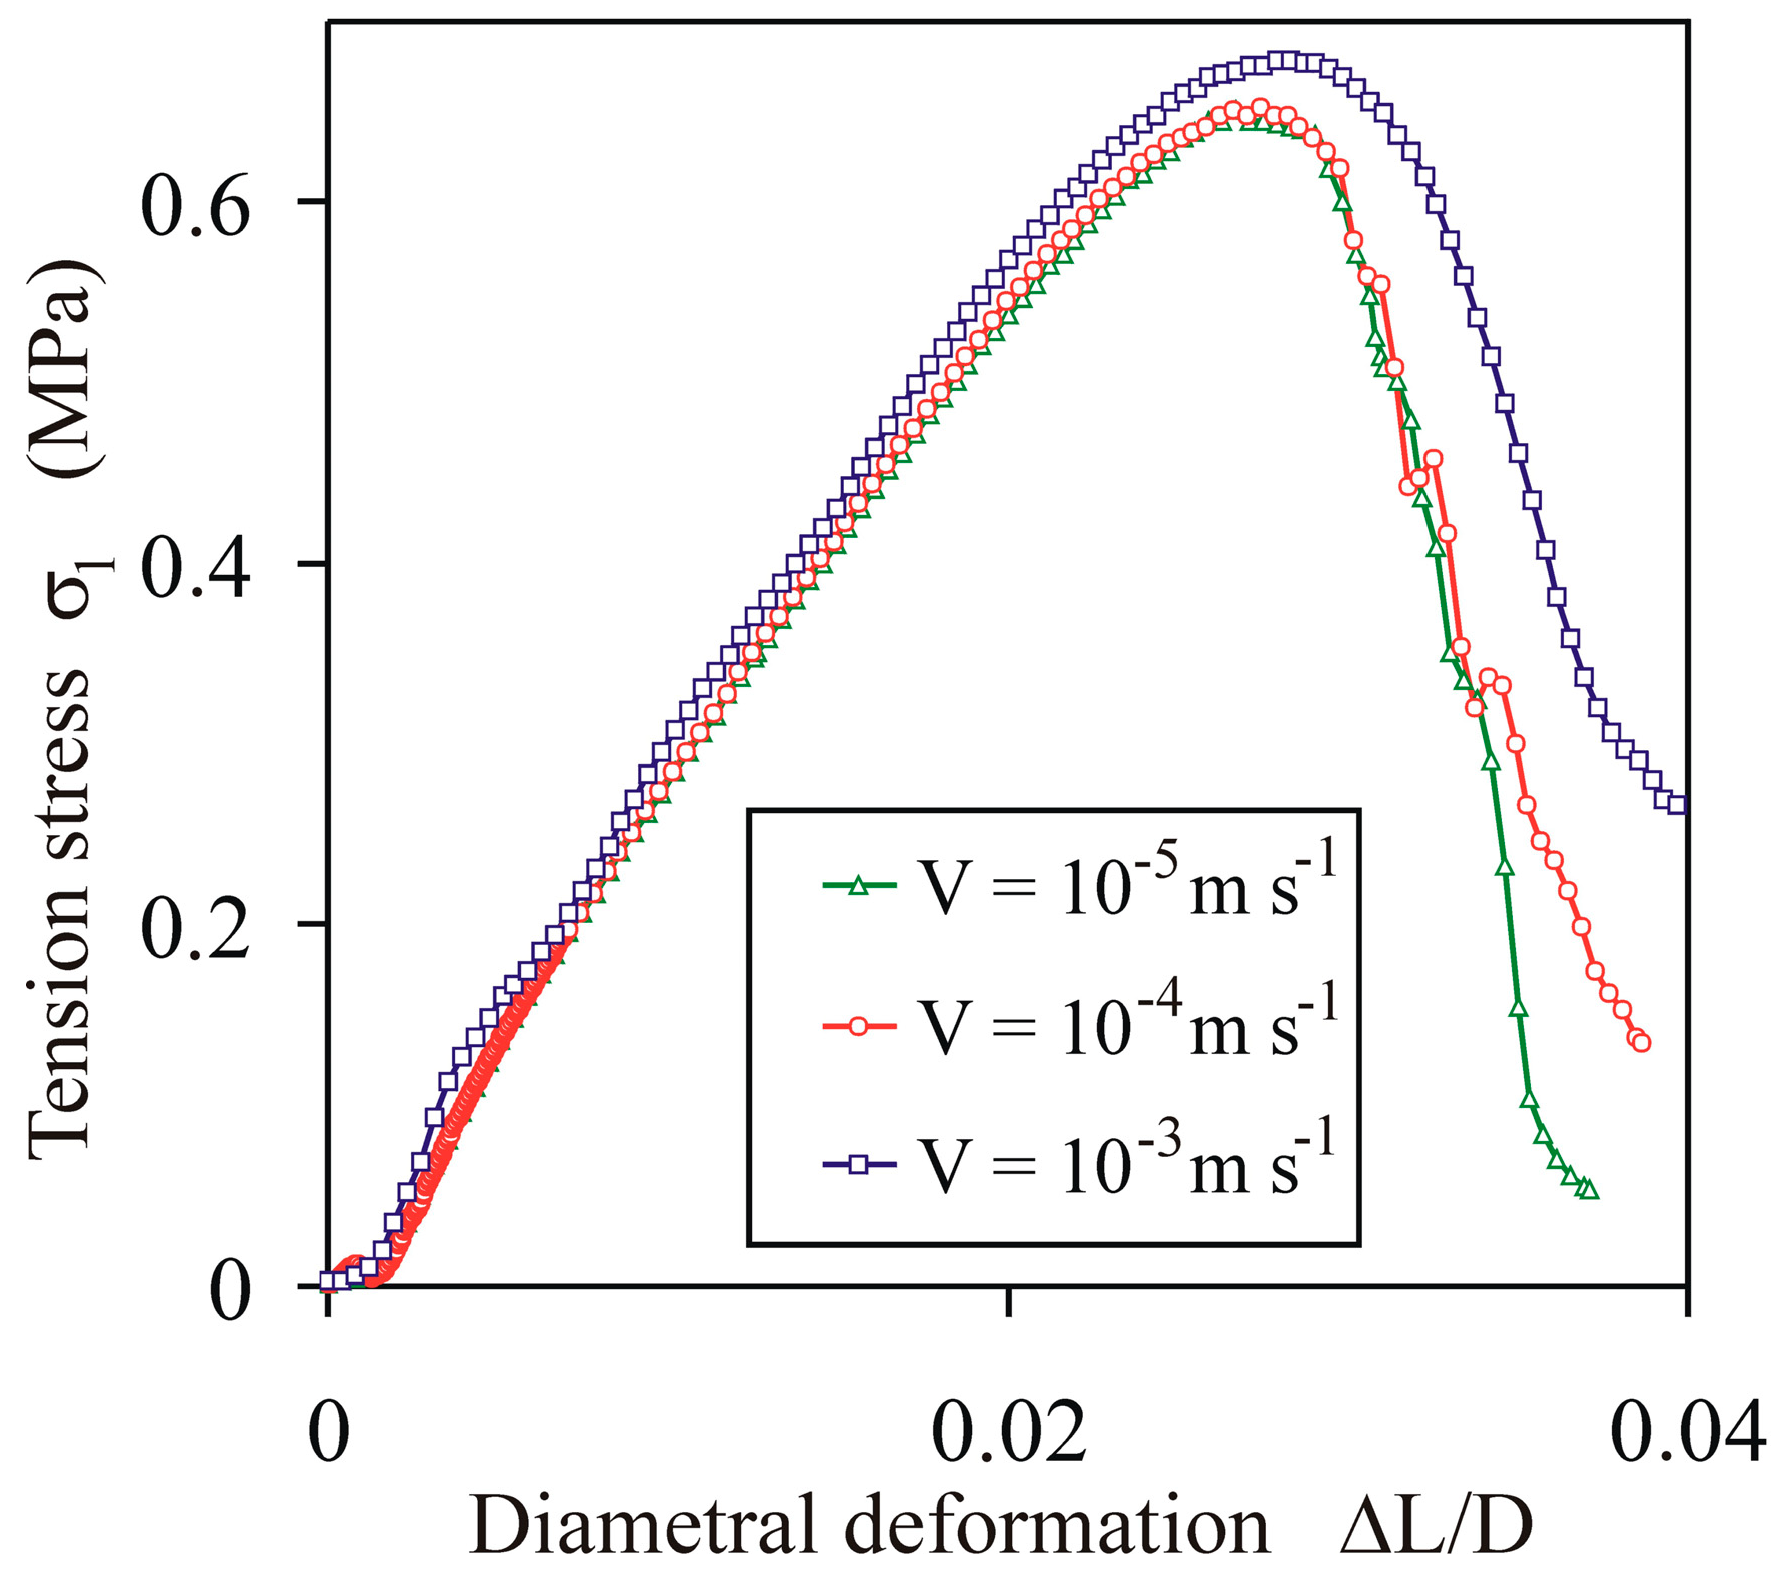
4.1.1. Impact of Deformation Velocity

To verify the impact of the deformation velocity on the tensile strength of the agglomerates, preliminary simulations of the diametral compression were performed for σc = 10 MPa and Eb = 200 MPa, as well as the deformation velocity in the range from 10−5 to 10−3 m s−1. The increase of the velocity from 10−5 to 10−4 m s−1 did not change considerably the shape of the σ1L/D) characteristic or the tensile strength σf. An increase of the velocity to 10−3 m s−1 increased the σf by an amount of 4%, as compared with the lowest velocity case (Figure 4). Taking into account the computing time for the simulations, this level of error was considered as acceptable for the purpose of this study.

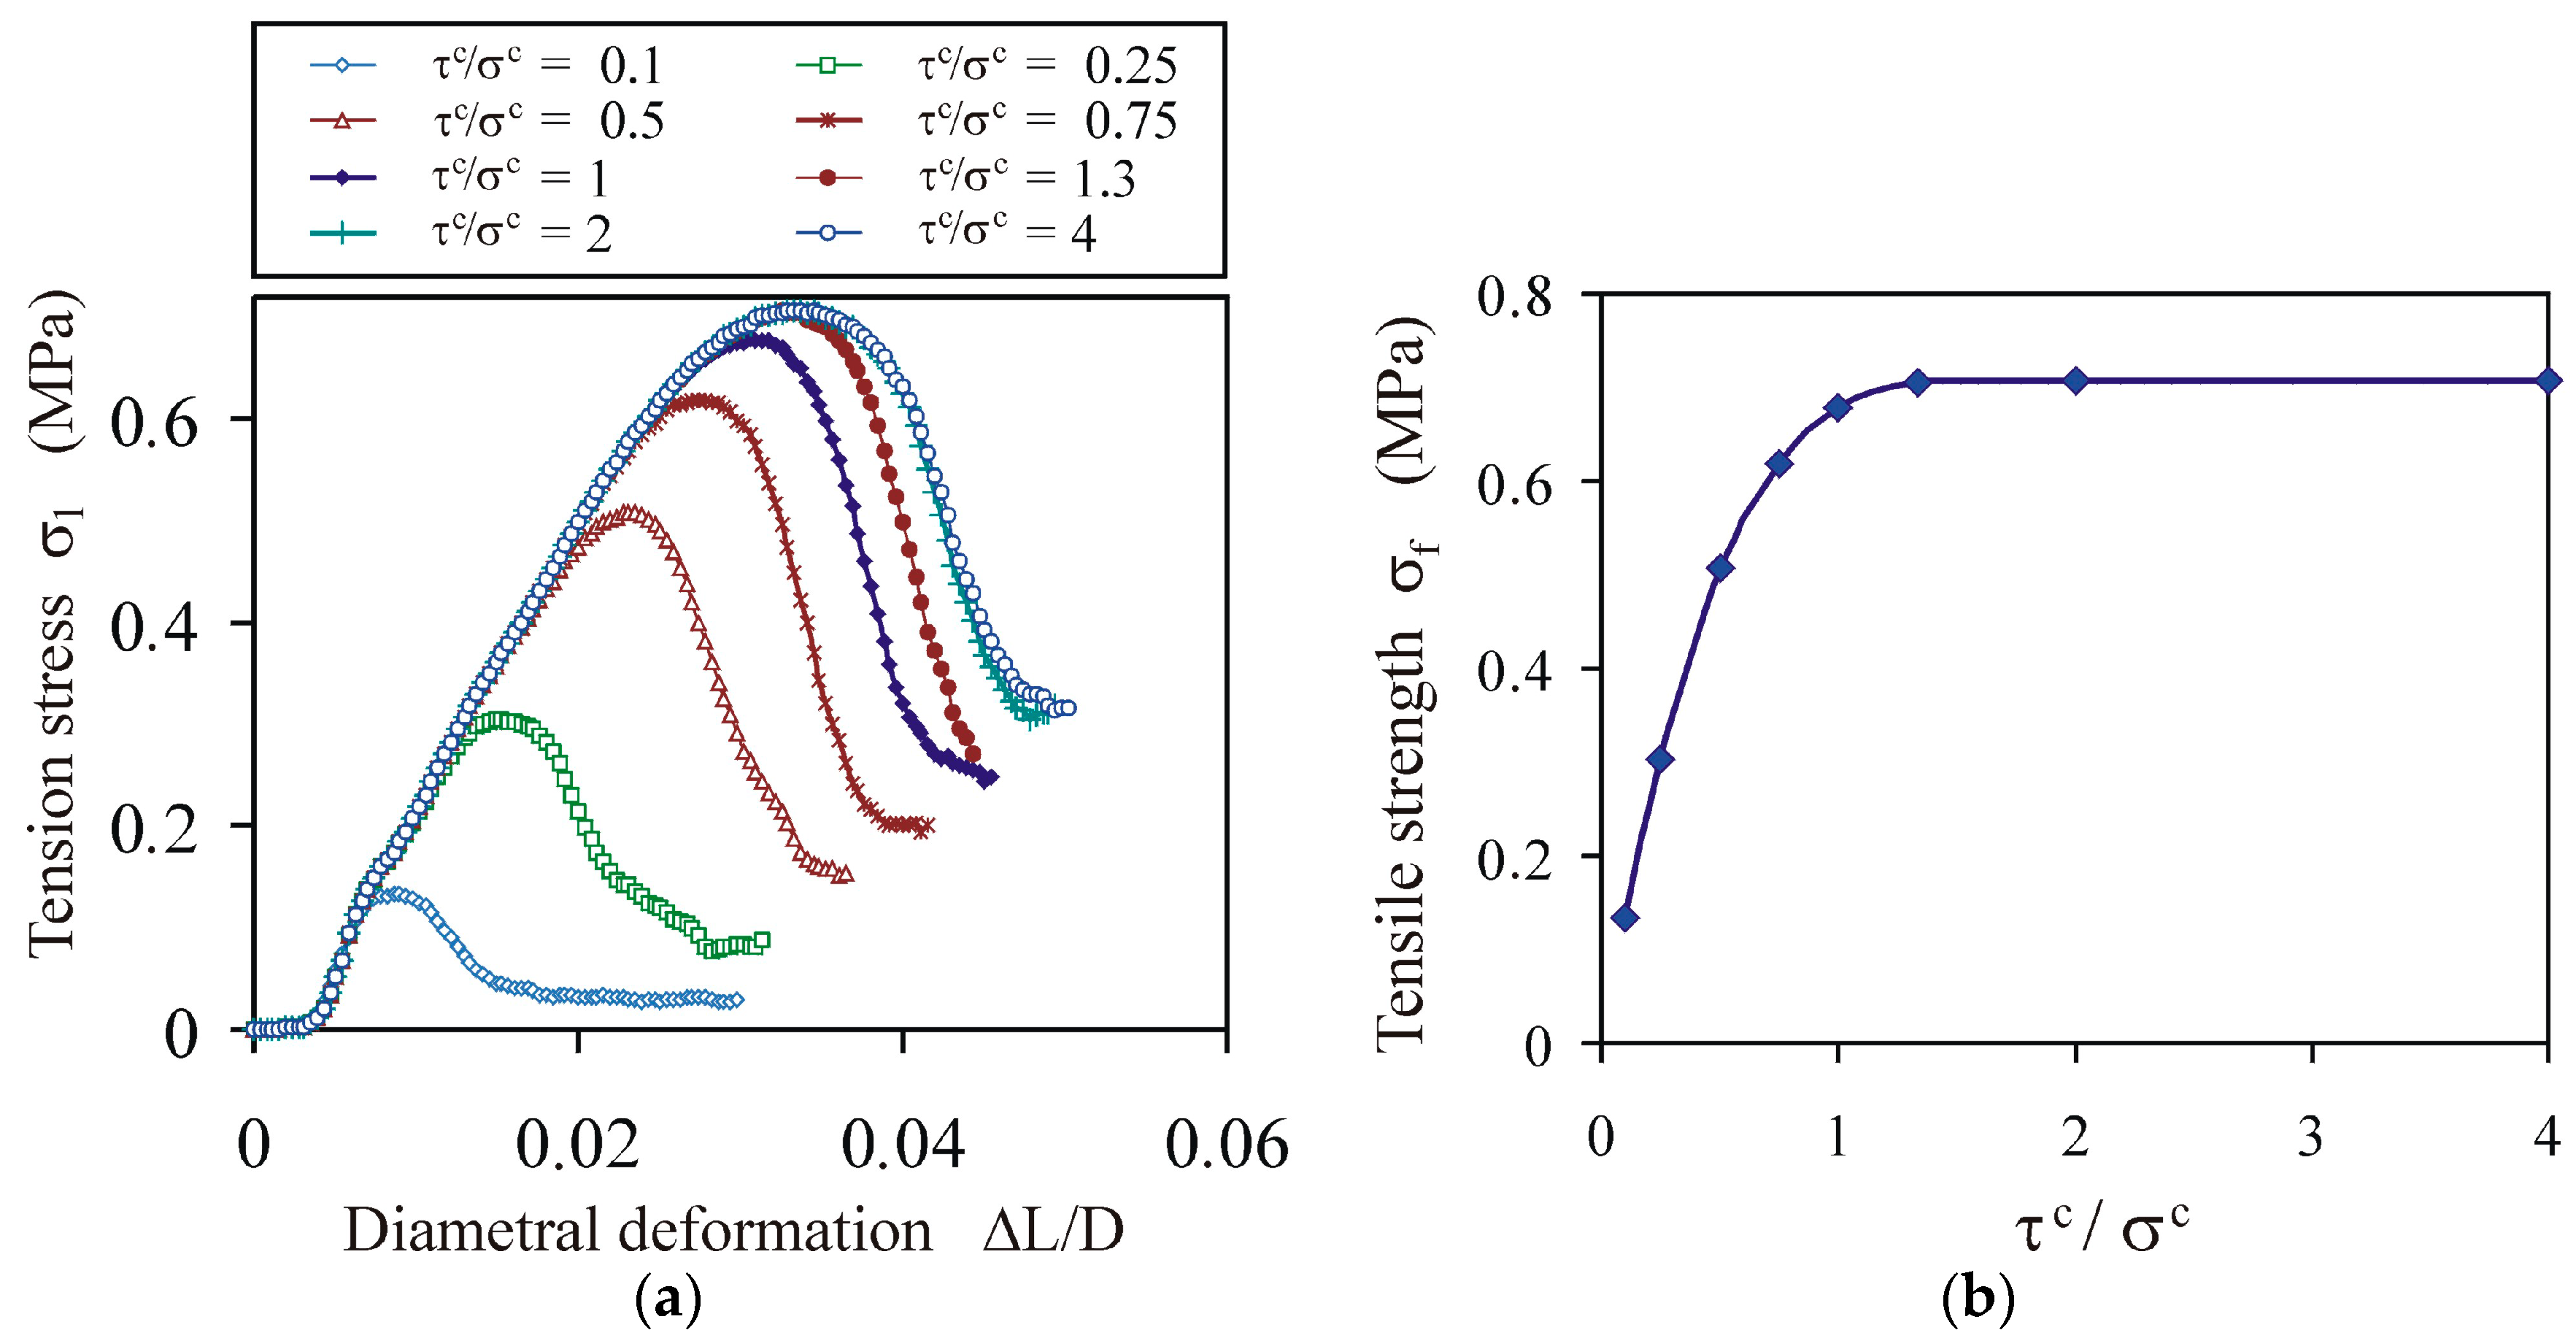
4.1.2. Impact of the Ratio of Shear to Tensile Strength of the Bond

The relationship between the tension stress σ1 and the diametral deformation ΔL/D was not significantly influenced by the change in the τc/σc ratio (Figure 5a), while the tensile strength of the agglomerates σf increased to a saturation value, stabilising for a τc/σc ratio slightly higher than 1 (Figure 5b). Analysis of the distribution of the bond normal and tangent forces performed for the τc/σc ratio of 1 indicated that the mean bond tangent force f ¯ t b at σ 1 , max ranged from 0.35 to 0.47 of the mean bond normal tension force f ¯ n b for the ductile and brittle breakage modes, respectively. This is consistent with the experimental findings of Jonsén et al. [23], that tension is the primary failure mode in the diametral compression test and is opposite to the shear primary failure mode in the uniaxial compression test, as reported by He et al. [4].

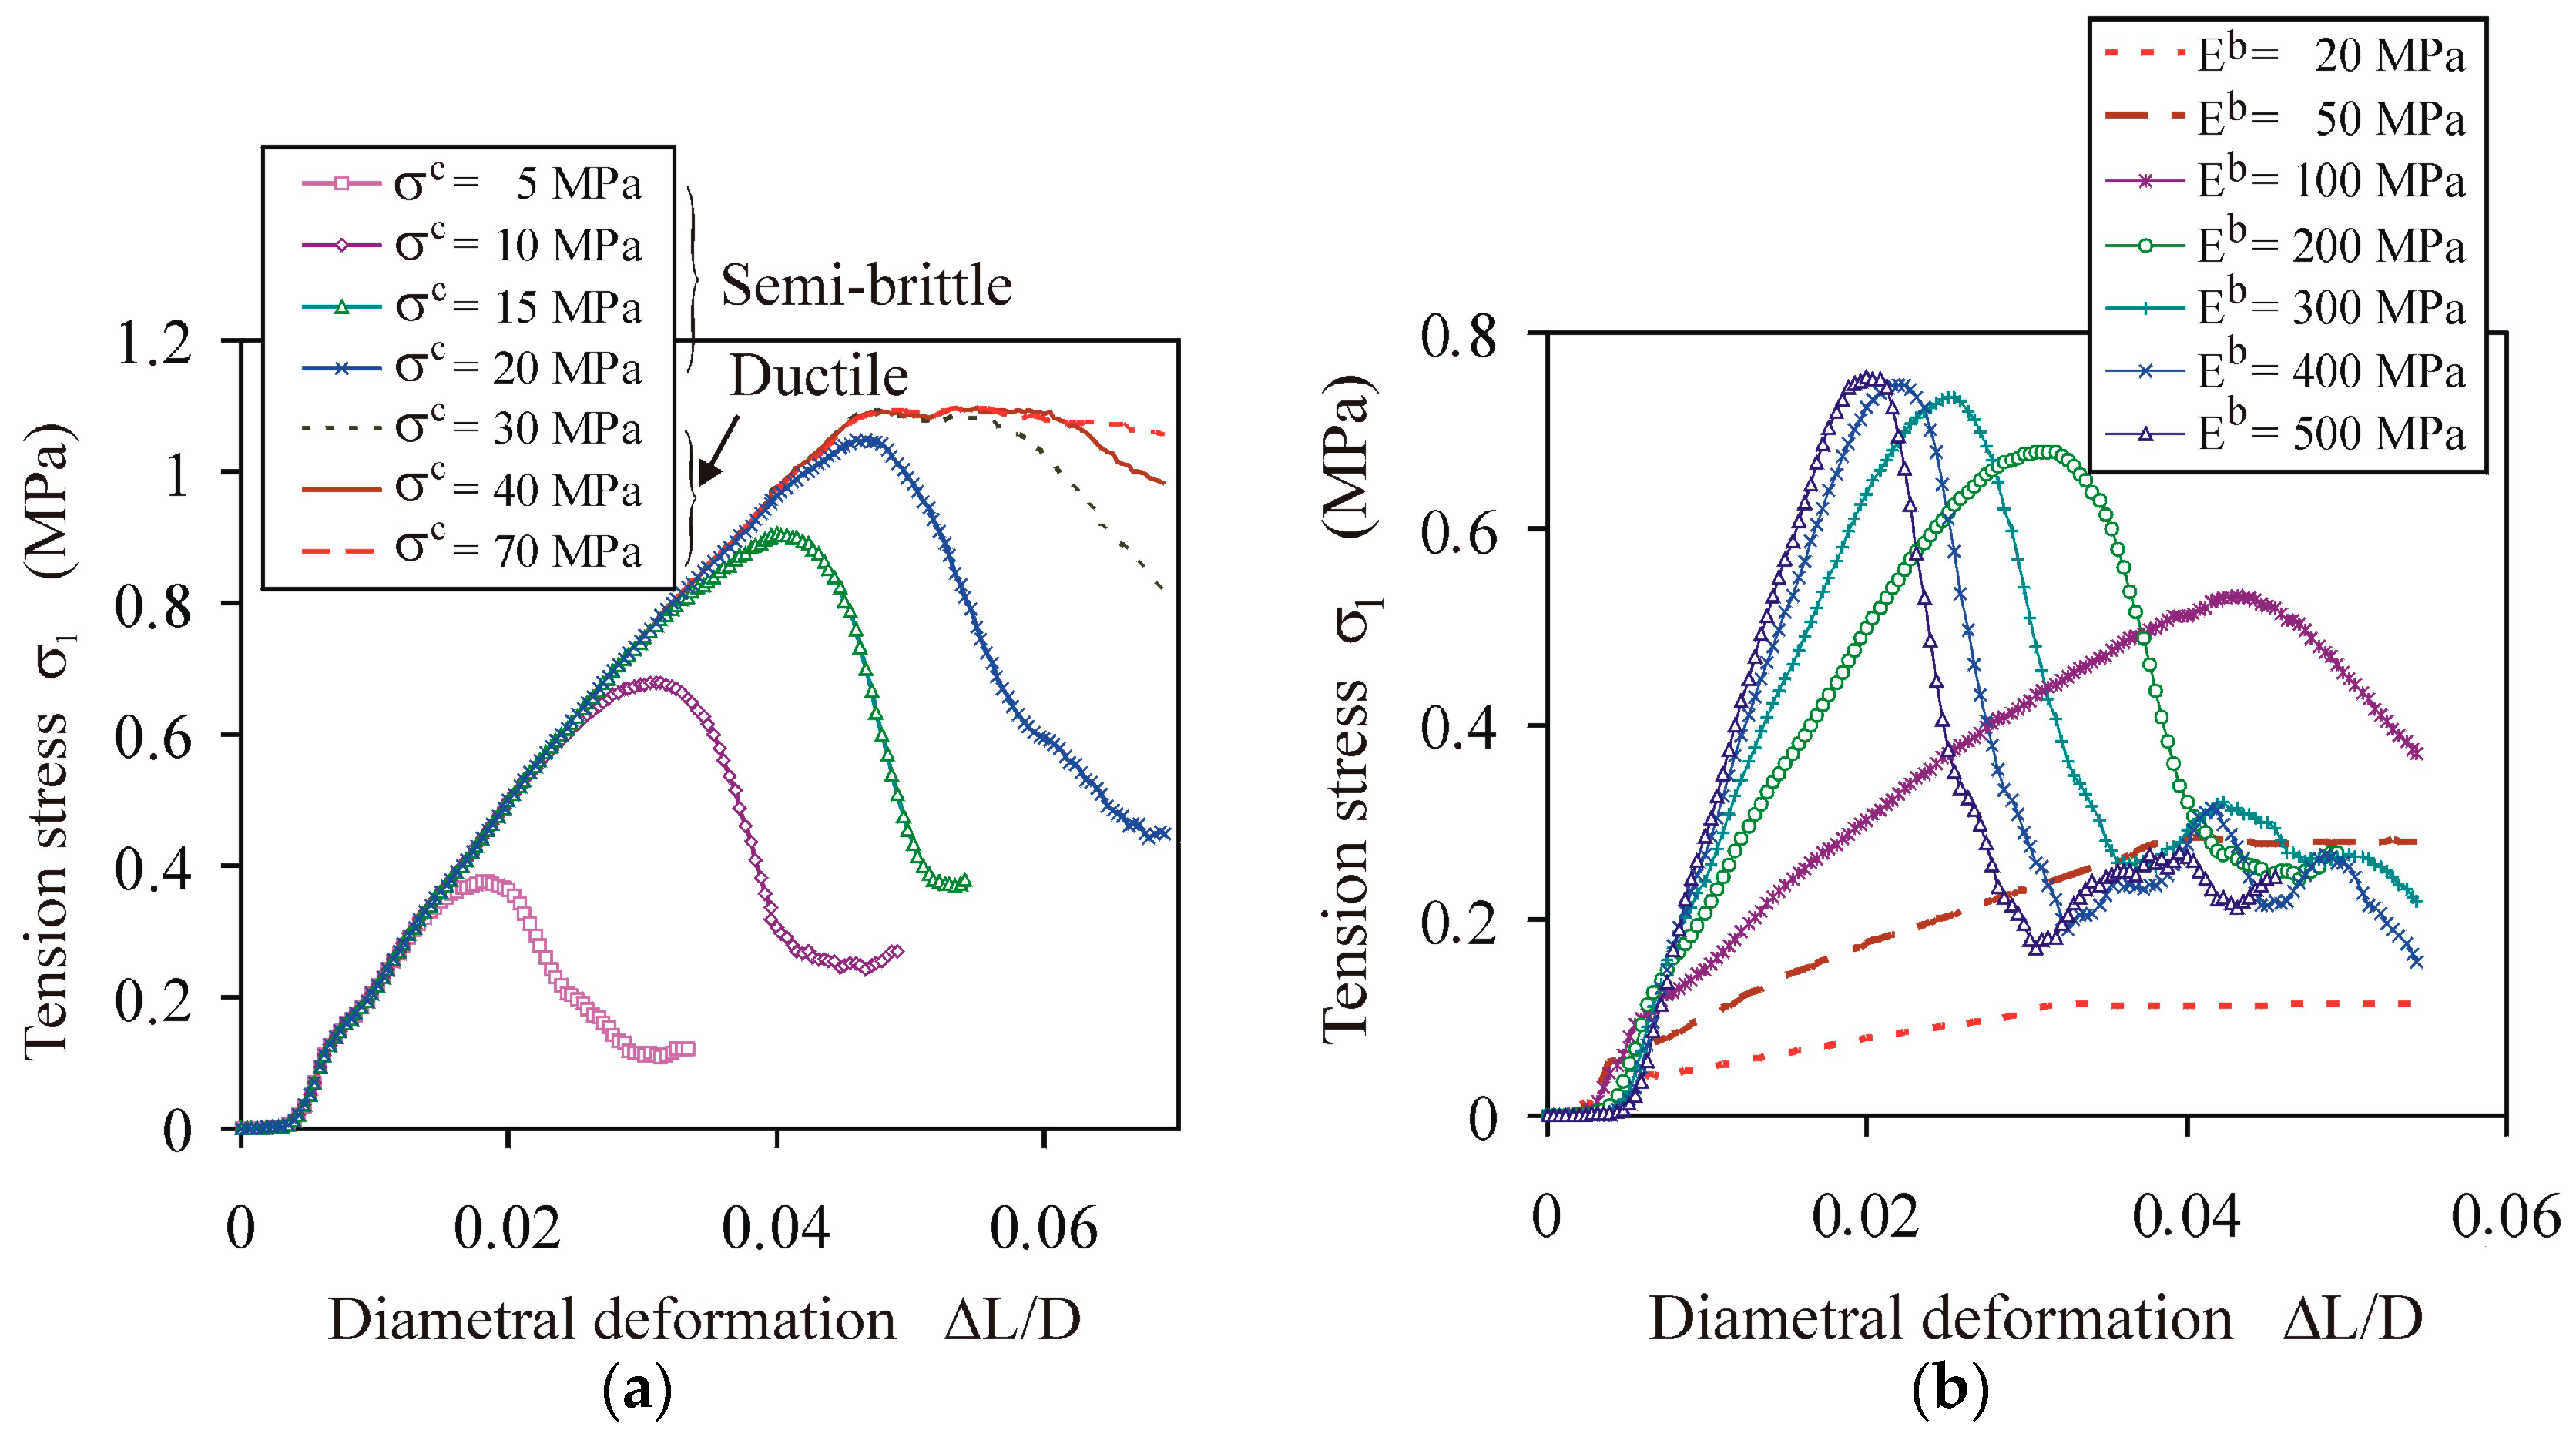
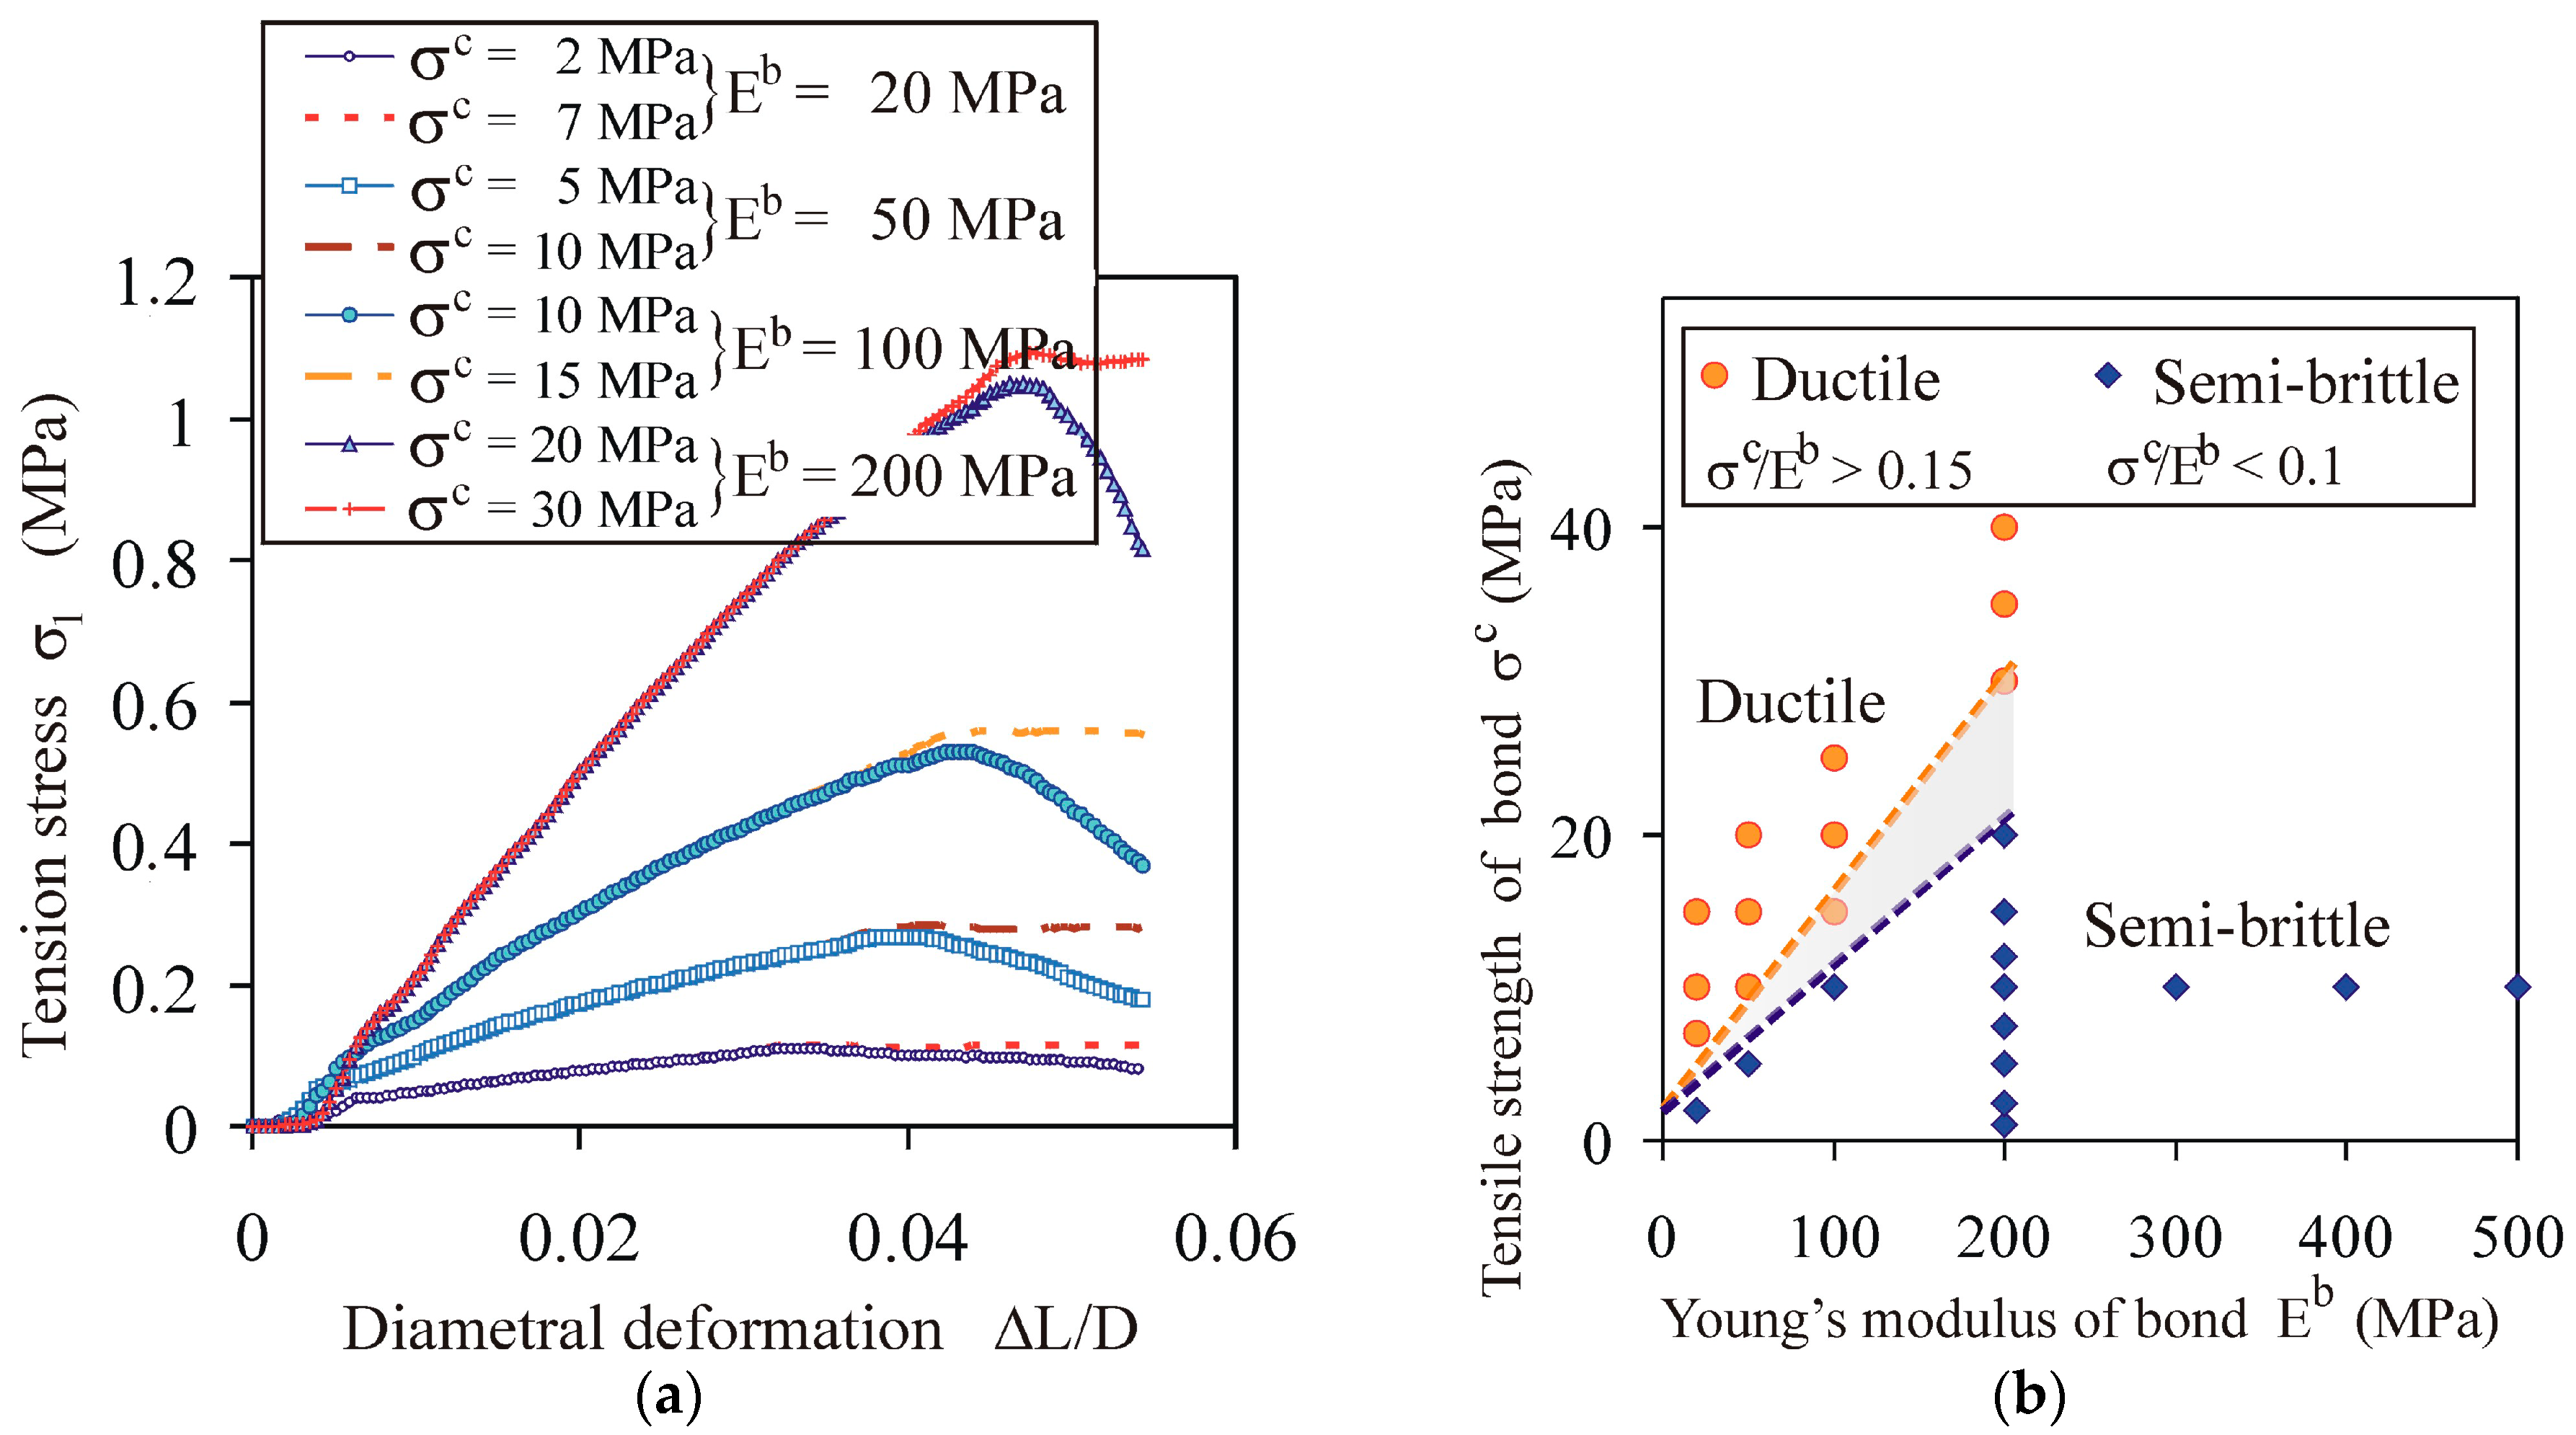
4.1.3. Impact of Strength and Young’s Modulus of Bond

For a constant value of the bond of Young’s modulus, the tensile strength of the agglomerate σf increased nonlinearly to a limiting value, indicating a qualitative change in the behaviour of the agglomerates with an increase in the tensile (and shear σc = τc) strength of the bond (Figure 6a). In the entire range of change of the σ1 and σf with the σc change, the following two regions were distinguished: (1) an almost linear increase of the σf, with an accompanying round and a slowly flattening σ1L/D) relationship with a clear maximum (typical for semi-brittle breakage); and (2) the saturation of σf with a further increase in σc, with an accompanying growing range of the deformation ΔL/D with a constant value of σ1 (typical for ductile breakage).
The change of Young’s modulus of the bond had an opposite effect on the qualitative change of the breakage behaviour of the agglomerates than did the bond strength (Figure 6b). With an increase in Young’s modulus of the bond, the breakage mode changed from ductile to semi-brittle at Eb = 100 MPa. With a further increase in Young’s modulus, the σ1L/L) characteristics (typical for the semi-brittle breakage mode) evolved towards the brittle mode, i.e., exhibited a sudden drop of σ1 after approaching the peak stress. There was no clear threshold for the transition from semi-brittle to brittle behaviour.

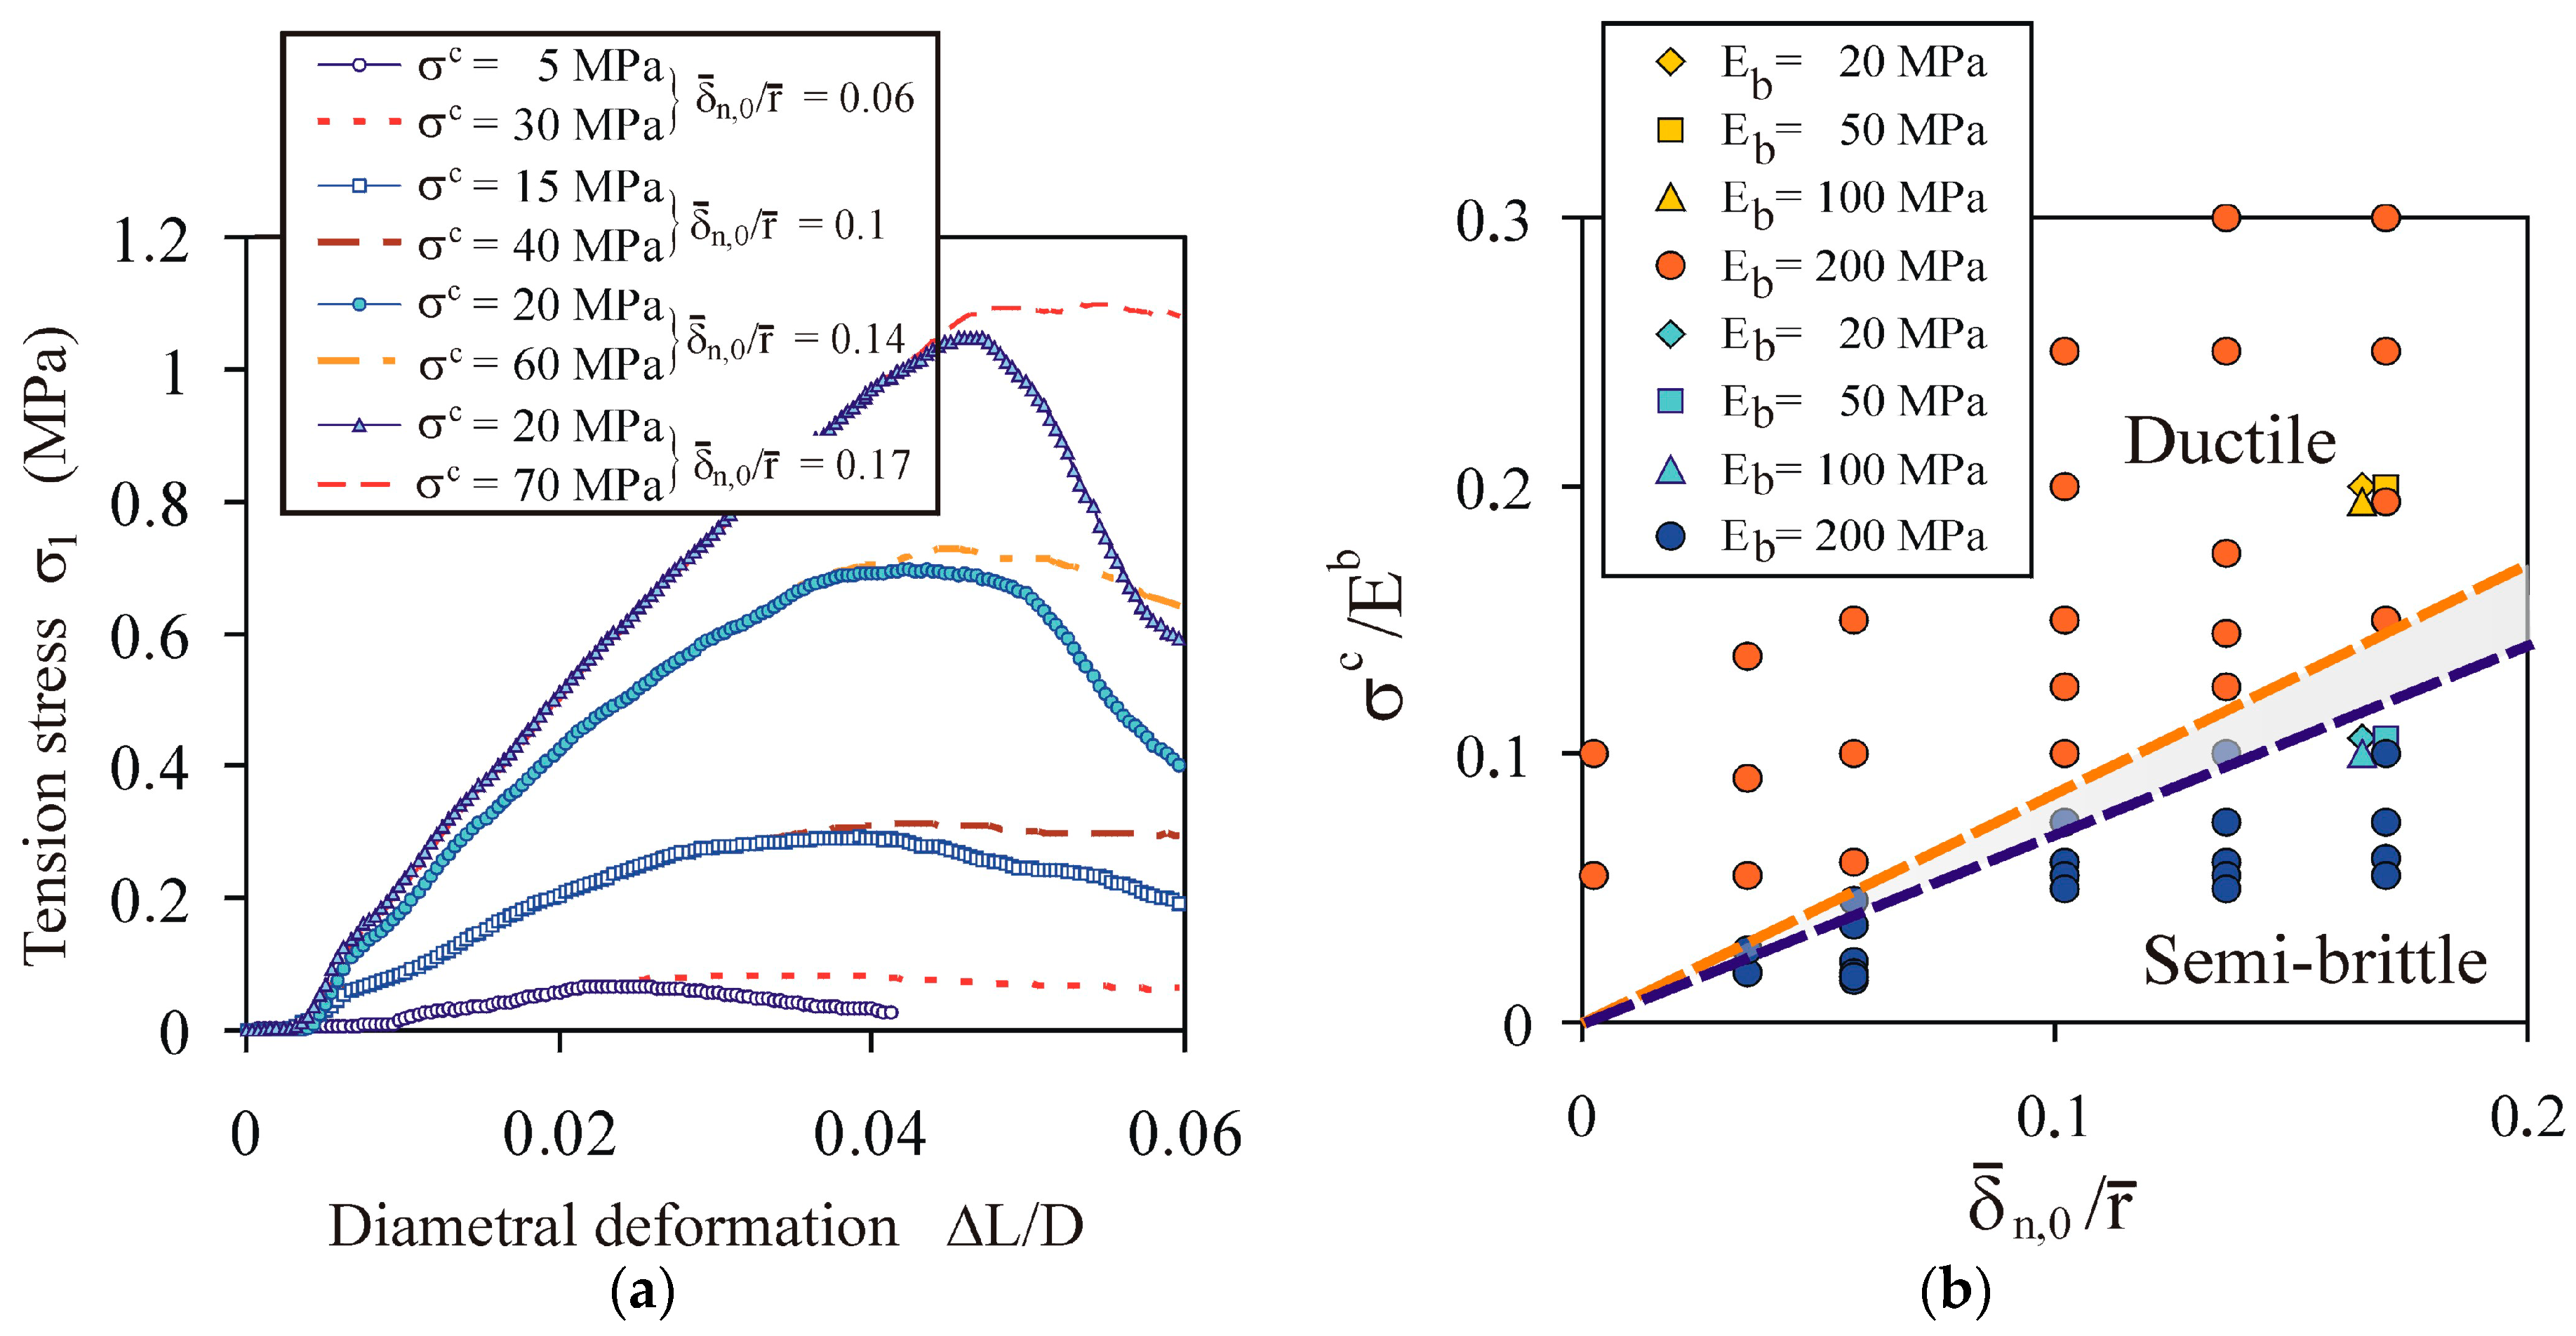
4.1.4. Impact of Ratio of Bond Strength to Young’s Modulus

Combining the effects of the Young’s modulus and the bond strength on the mechanical characteristics σ1L/L), the transition from ductile to semi-brittle breakage can be attributed to the σc/Eb ratio (Figure 7a). For σz = 153 MPa, a ratio of σc/Eb < 0.1 provided semi-brittle breakage, whereas a ratio of σc/Eb > 0.15 provided ductile breakage (Figure 7b).

4.1.5. Impact of Bond Cross-Sectional Area

A very clear transition between the semi-brittle and ductile behaviour was observed over the entire range of the compaction pressure. Figure 8a presents the σ1L/L) characteristics for selected values of the ratio of the mean overlap at the instant of bond initiation to the mean particle radius δ ¯ n , 0 / r ¯ . The mean overlap at the instant of bond initiation ( δ ¯ n , 0 ) did not increase linearly with the increase of the compaction pressure σz; rather, the increase was slower. Thus, the bond cross-sectional area also exhibited a slower-than-linear increase with the increasing compaction pressure. The consequence of this is discussed in Section 4.2.1. The threshold value of the σc/Eb ratio for the semi-brittle and ductile transitions increased with the δ ¯ n , 0 / r ¯ ratio (Figure 8b).

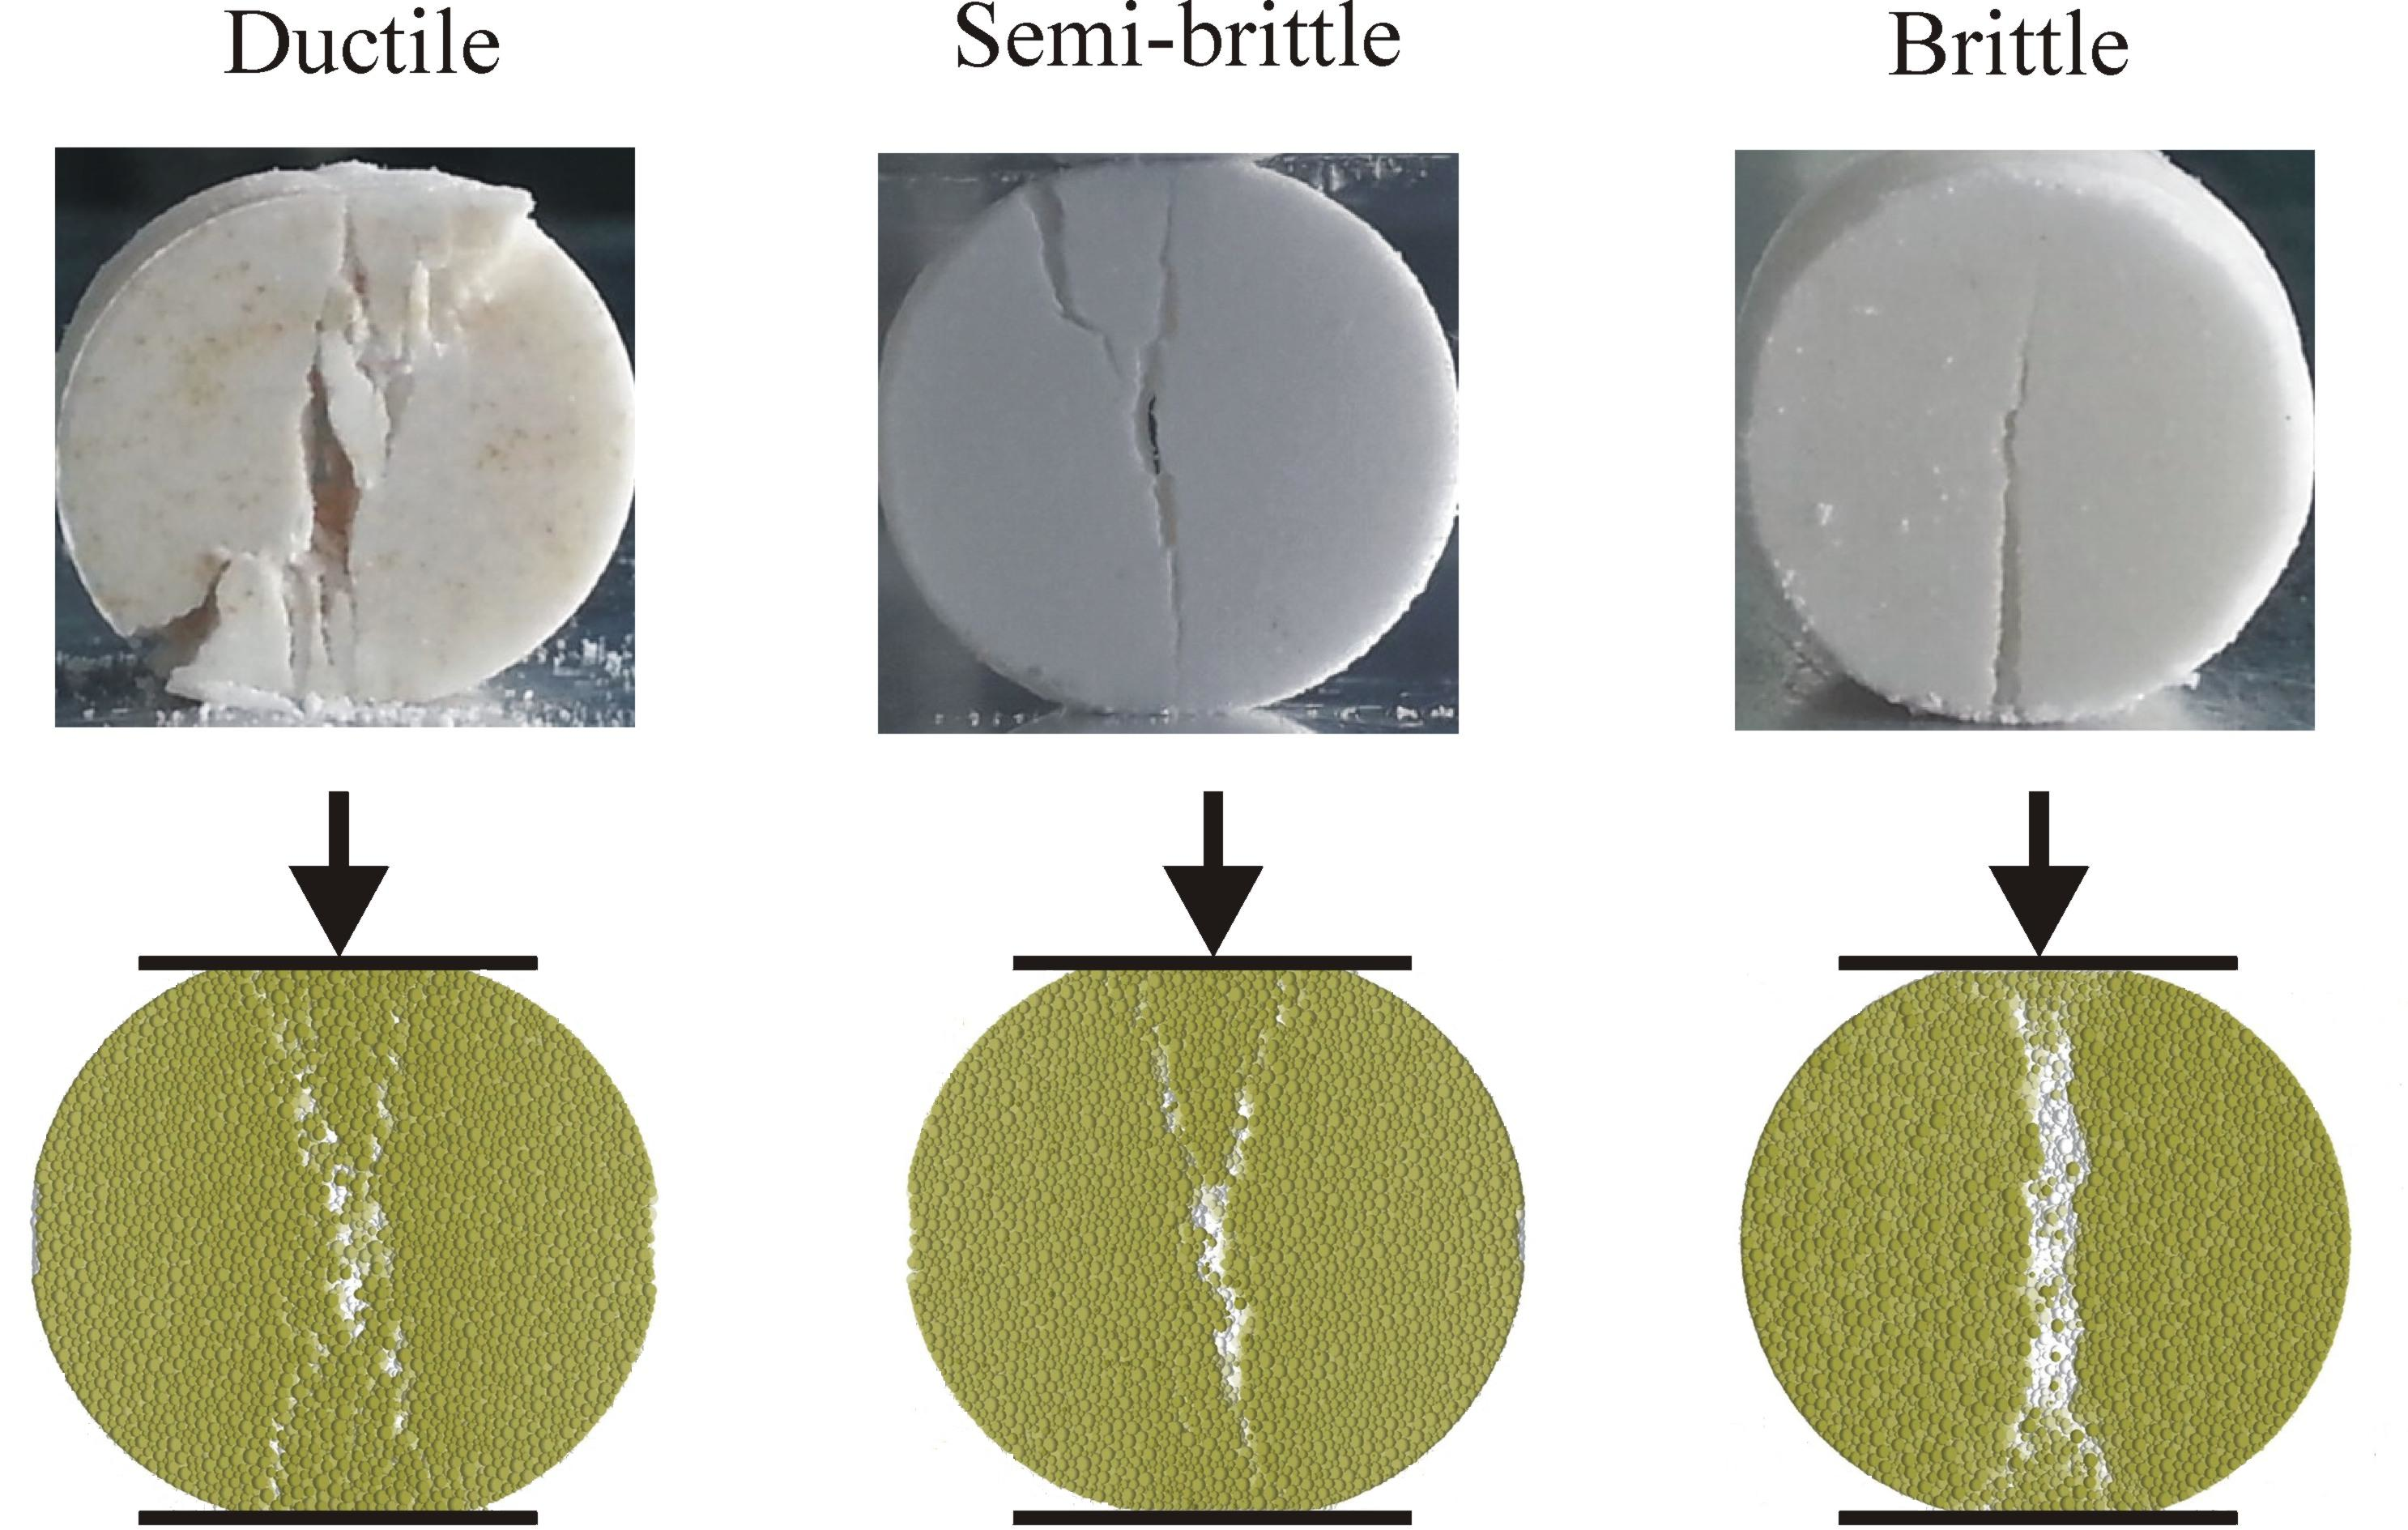
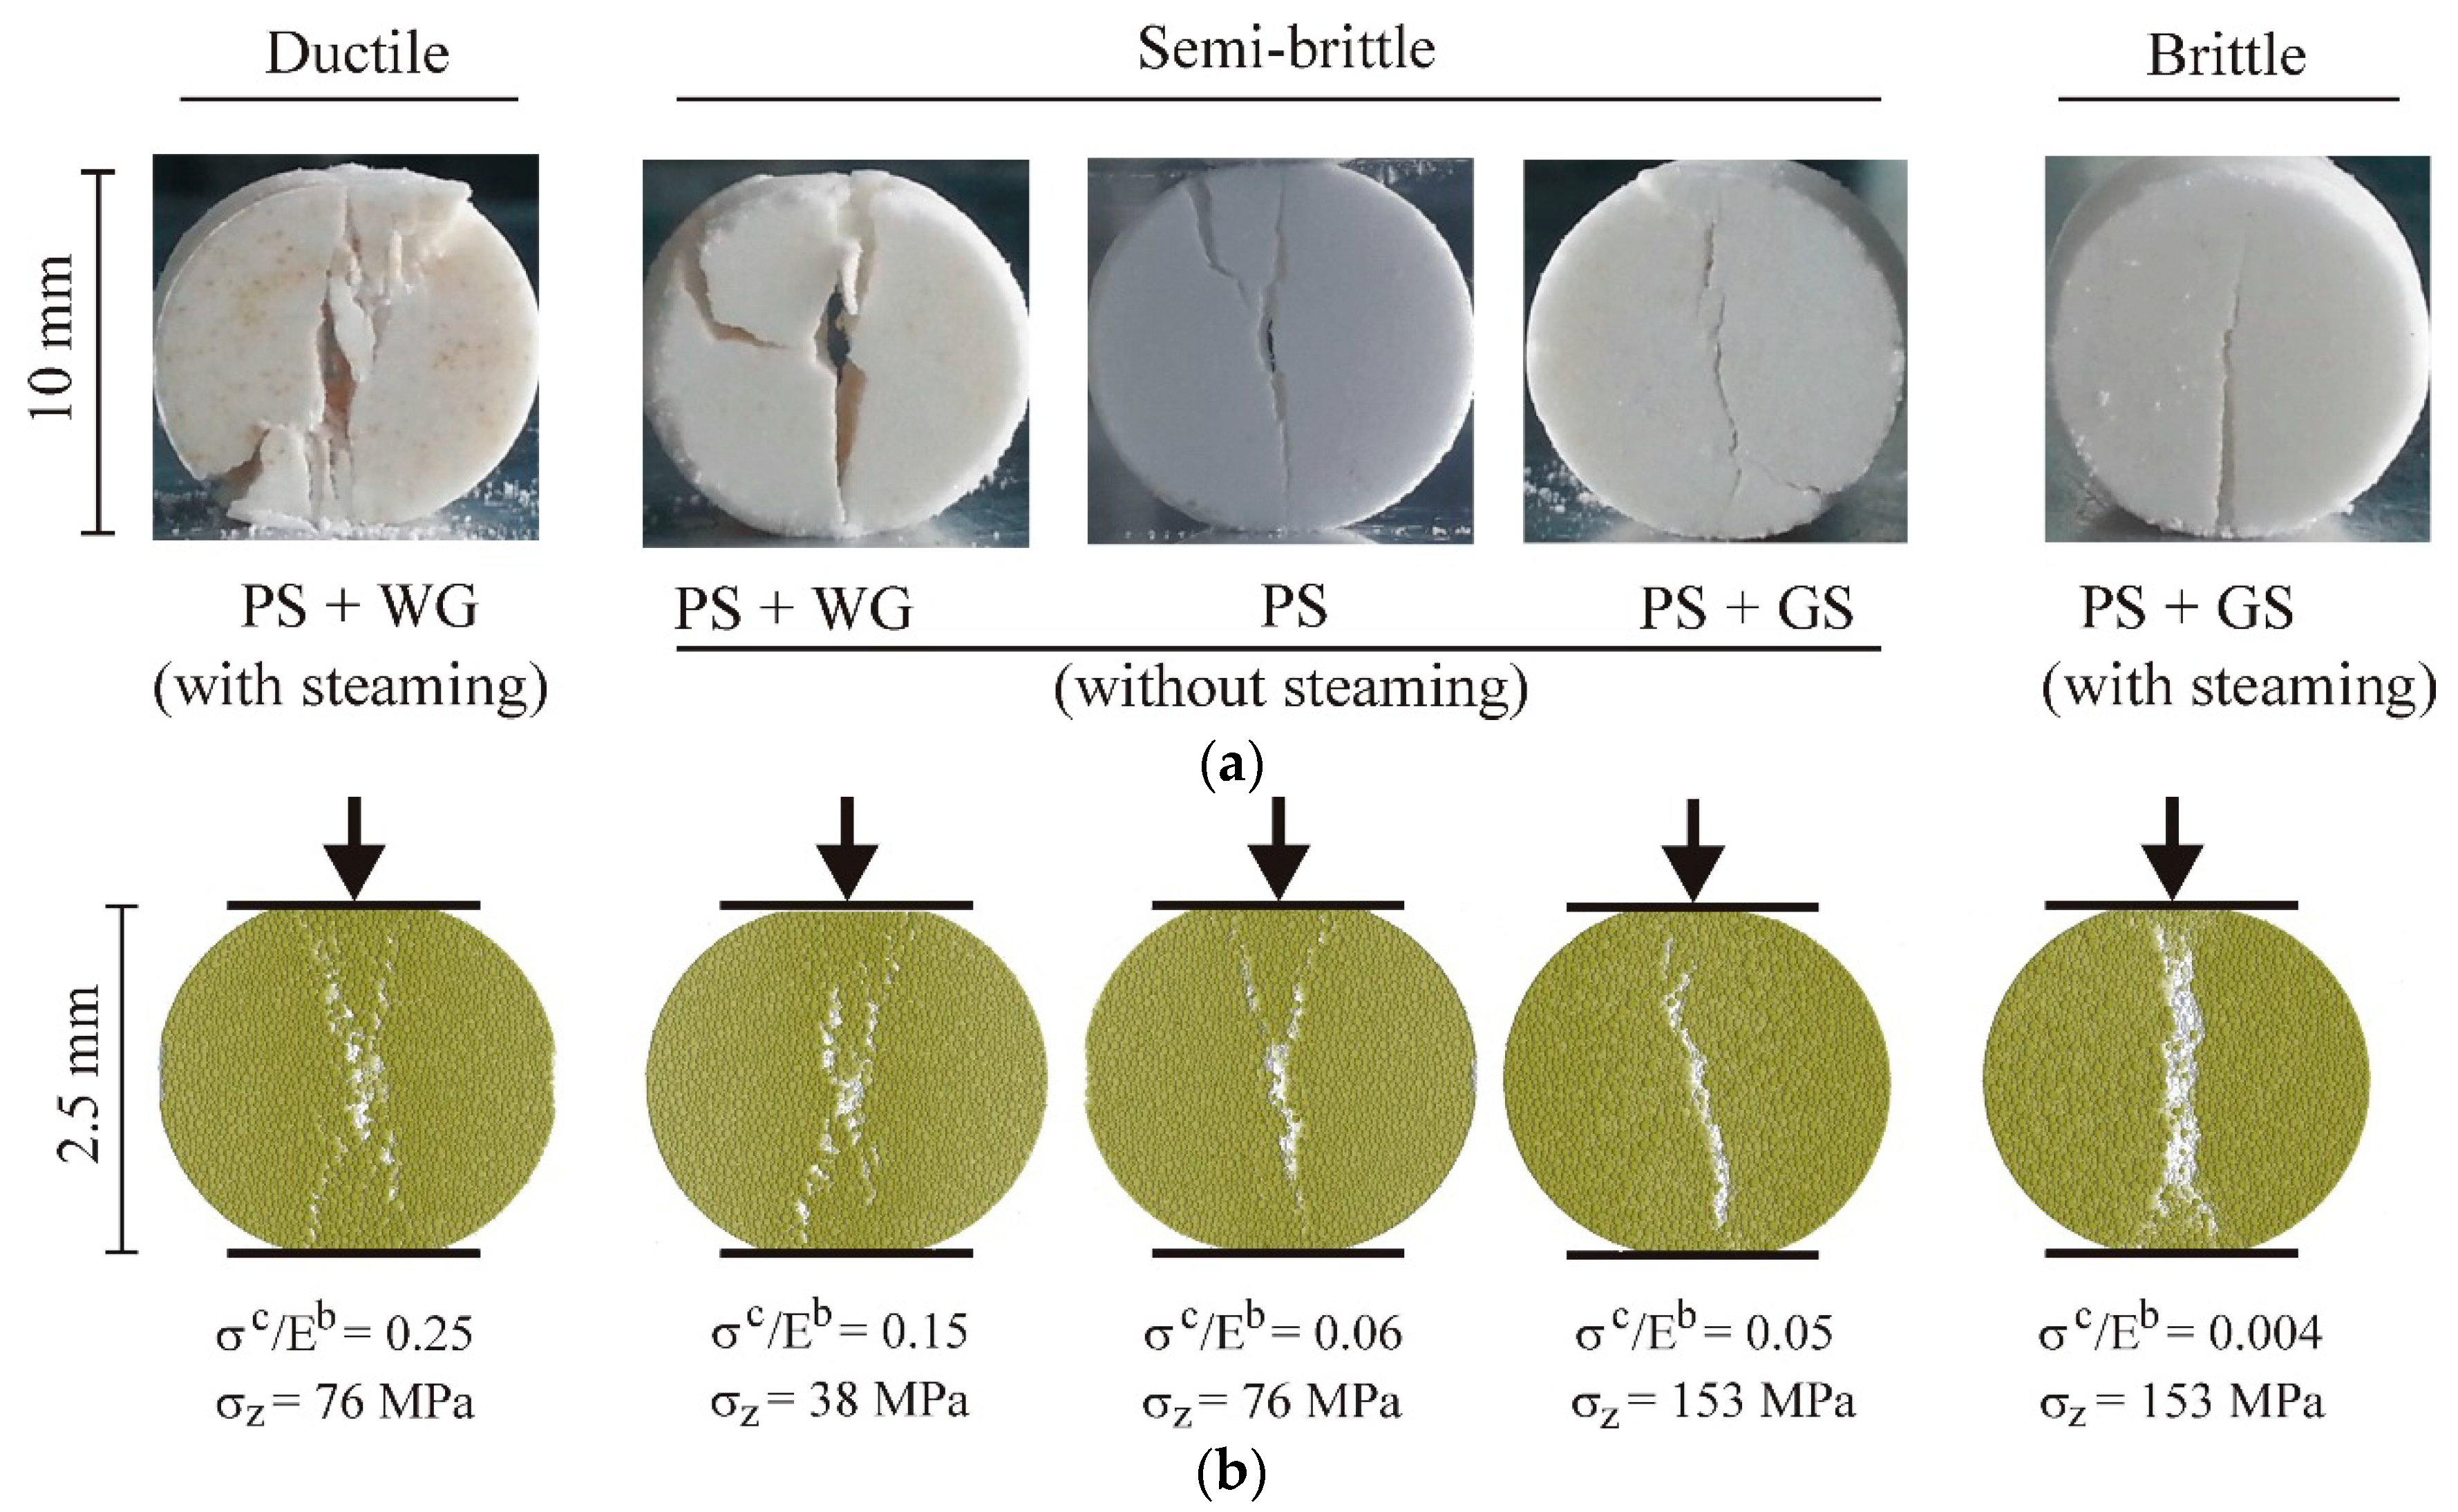
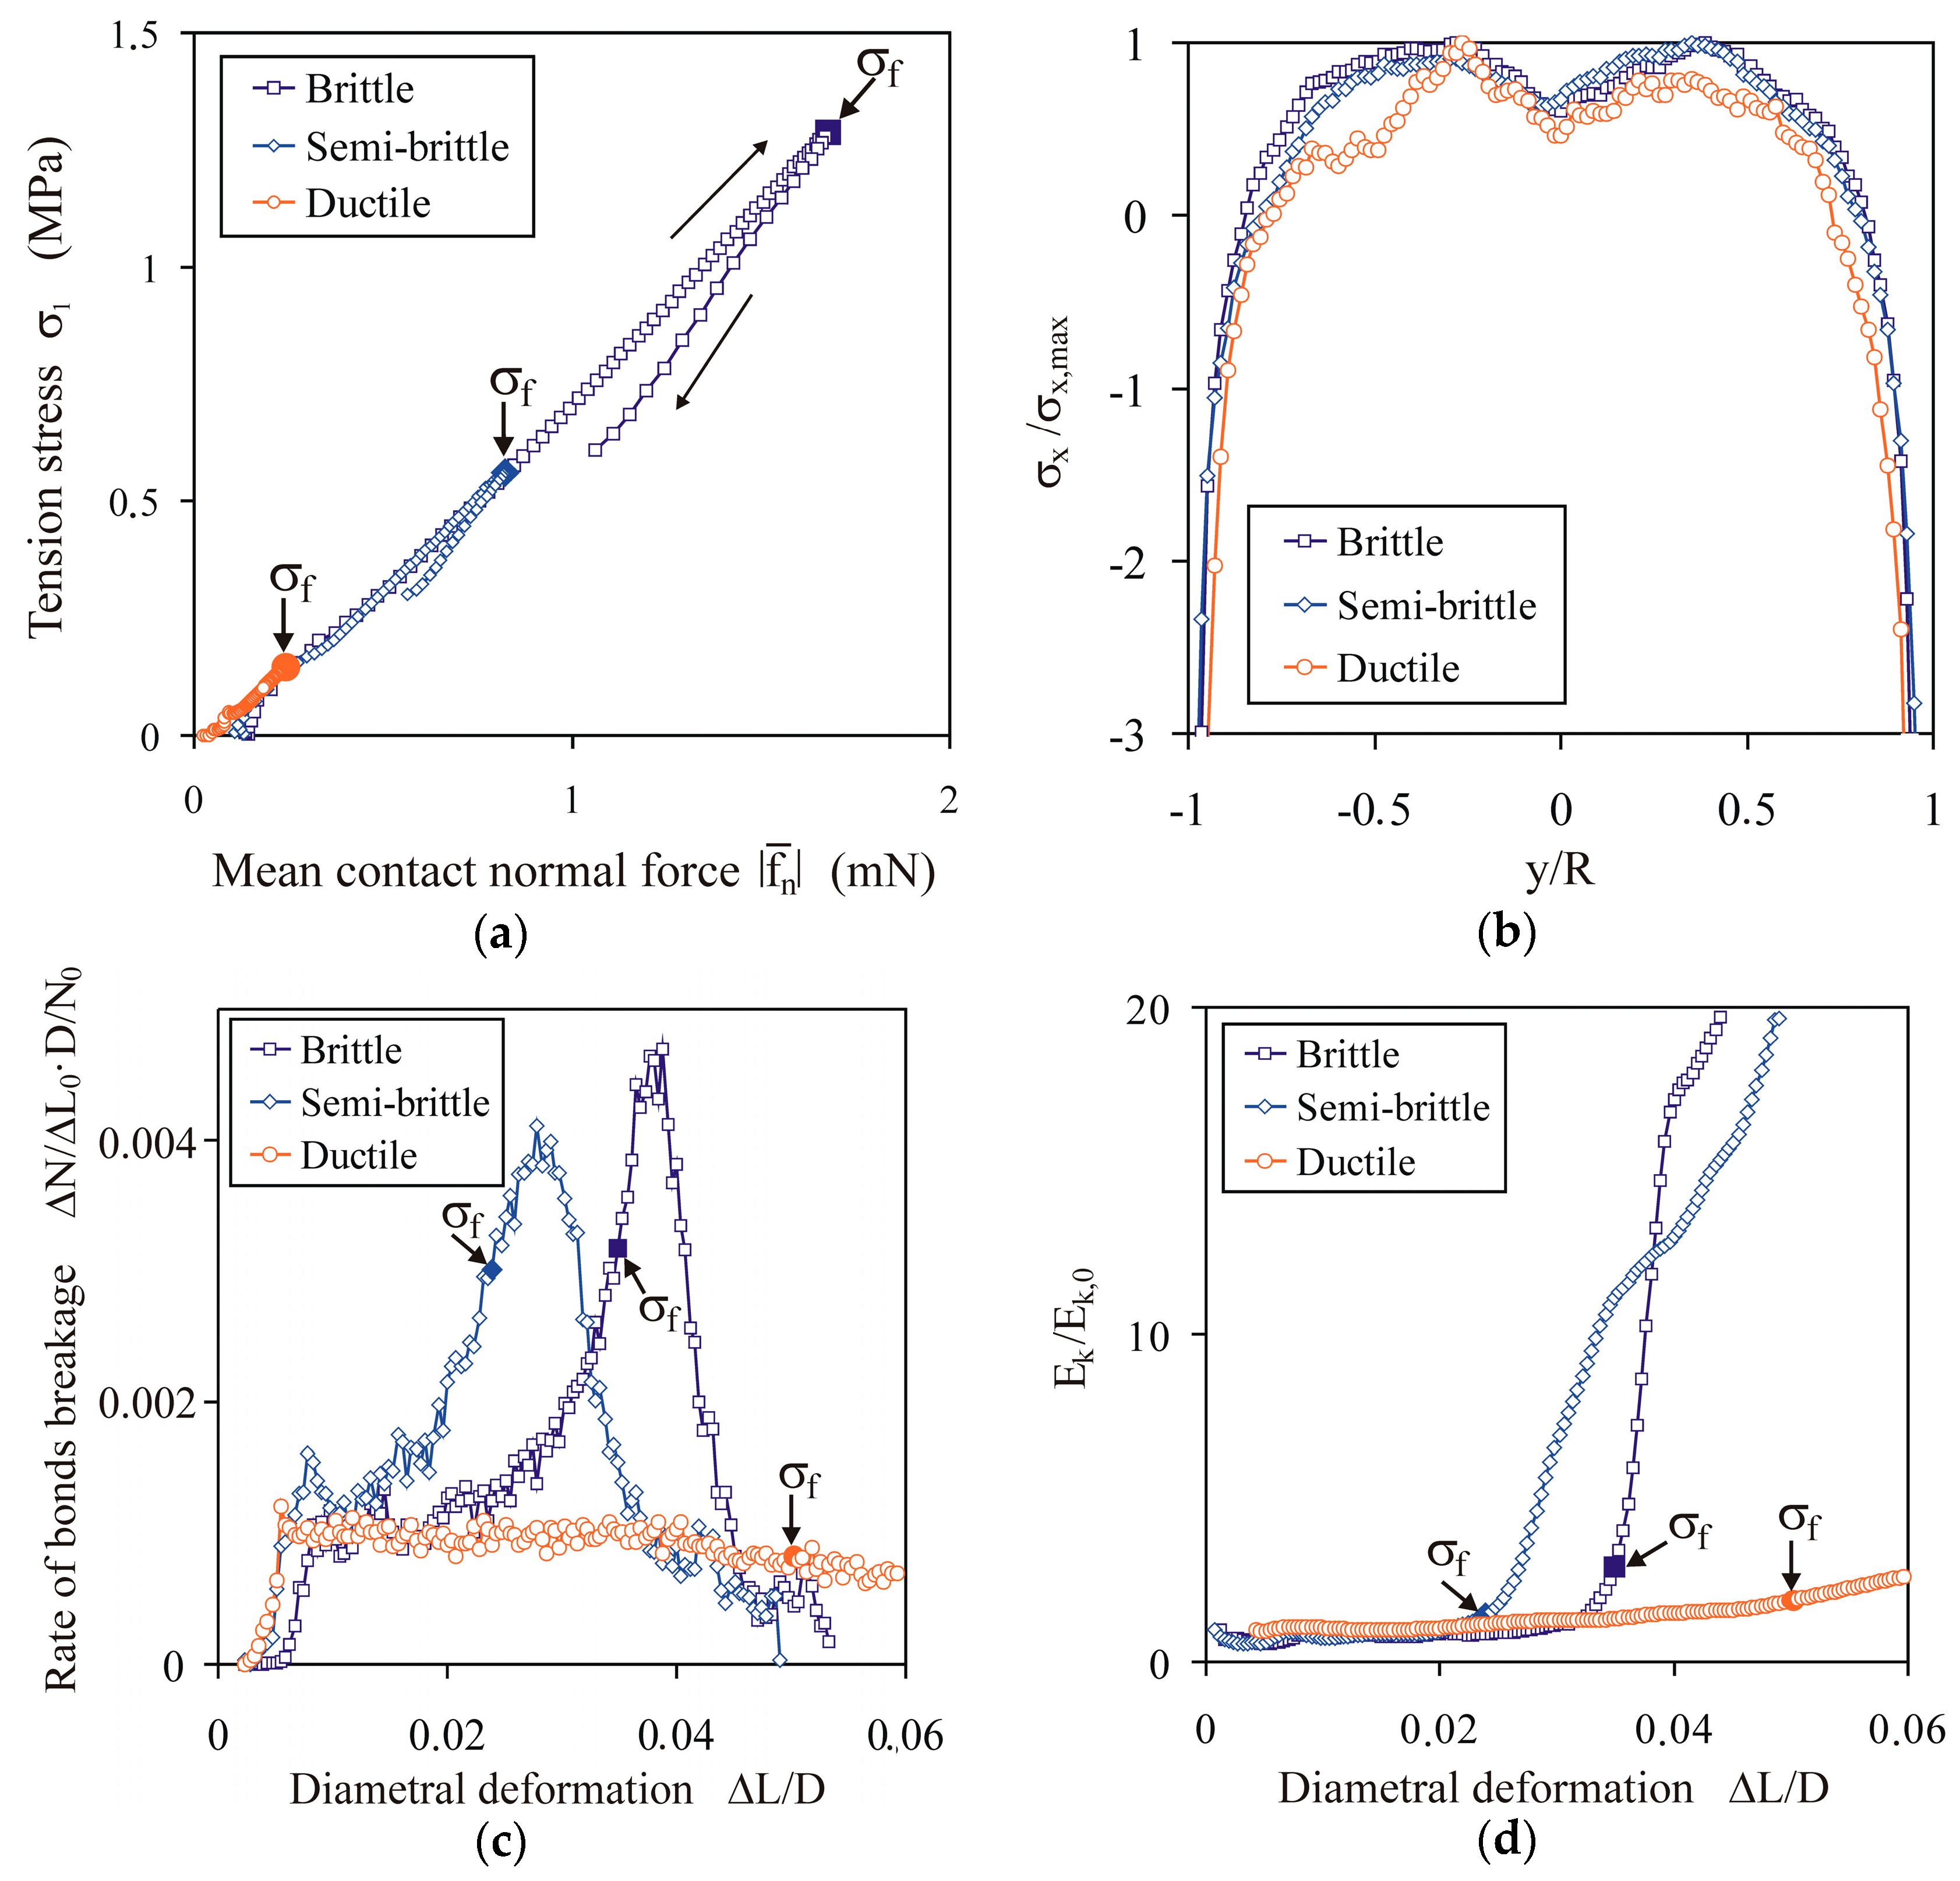
4.1.6. Breakage Modes

Figure 9 presents examples of typical mechanical characteristics of the tension stress vs. the diametral deformation of PS tablets, as well as fitted DEM approximations illustrating brittle, semi-brittle, and ductile breakage modes. Individual PS tablets without any additives behaved as semi-brittle or brittle materials (Figure 9a). For a compaction pressure of 153 MPa, the tensile strength was 0.84 ± 0.1 MPa. The addition of sugar or gluten resulted in the semi-brittle breakage mode and reduced the breakage strength to 0.62 ± 0.03 and 0.47 ± 0.06 MPa for tablets with sugar and gluten, respectively. Steaming of the PS with the addition of sugar increased the tensile strength of the agglomerates to 1.1 ± 0.15 MPa and changed the breakage mode to brittle (Figure 9b). Steaming of the PS with the addition of gluten resulted in a two-fold decrease of the tensile strength (0.26 ± 0.06 MPa) and changed the breakage mode from semi-brittle to ductile. Steaming of the PS without any additives reduced the tensile strength of the agglomerates to 0.51 ± 0.06 MPa, and did not change the breakage mode.
The best-fitted DEM models approximating the analysed mechanical characteristics indicated considerable differences in the bond parameters between particular cases. For PS with no additives or steaming, the Young’s modulus of the bond was in the range of 200–300 MPa, and the tensile strength of the bond was in the range of 10–12 MPa. Steaming of the PS reduced the tensile strength of the bond to 7.5 MPa. Addition of sugar or gluten without steaming increased the Young’s modulus of the bond stiffness to 500 MPa and reduced the tensile strength of the bond to 8 MPa. The effect of steaming was opposite for PS with the addition of sugar and gluten. In the case of the addition of sugar, steaming slightly reduced the Young’s modulus of the bond (400 MPa) and increased the tensile strength from 8 to 18 MPa, owing to the crystallisation of the solubilised sugar after cooling. In the case of the addition of gluten, steaming resulted in a 20-fold reduction of the Young’s modulus of the bond (from 500 to 25 MPa), and did not change the tensile strength. This effect is attributed to the action of protein fibrils, which create elastic binding sites between PS particles [50].
The breakage mode influenced the structural changes of the tablets during diametral compression. For the PS tablets without any additives and the tablets with the addition of sugar or gluten without steaming, there was a single crack, almost aligned with the loading direction, or a Y-shaped crack, indicating the partition of the tension and shear interaction in the failure (PS, PS + WG, and PS + GS in Figure 10a). A single crack along the loading direction appeared for the steamed PS with the addition of sugar, i.e., the brittle breakage mode and tension crack. Steaming of the PS with the addition of gluten (ductile breakage) resulted in diffuse X-shaped cracks in locations close the tablet centre, as well as crushing in locations close to the loading platens.
The shapes of the breakage patterns of the tablets in the DEM simulations reproduced, to some degree, the shapes of the experimentally obtained patterns. The parameters with the largest influence were the compaction pressure σz and the σc/Eb ratio (Figure 10b). With the increase of the agglomeration pressure and the decrease of the σc/Eb ratio, the X-shaped conjugate cracks changed to Y-shaped cracks for moderately compacted agglomerates (σz = 76 MPa). A single crack aligned with the direction of the loading occurred for the highest level of the agglomeration pressure and the lowest value of the σc/Eb ratio. The gradual change of shape of the crack pattern with the changes of the compaction pressure and the σc/Eb ratio obtained in the DEM simulations are consistent with the results of the experimental study of the breakage of three-dimensional (3D)-printed agglomerates performed by Ge et al. [51]. Their study indicates that brittle breakage is typical for dense structures with a high bond stiffness, and that ductile breakage is typical for loose structures with a low bond stiffness.
There are some similarities and differences in particle–particle interactions and the bond interactions between the three indicated breakage modes. For all three breakage modes, the tension stress σ1 during loading was related almost linearly to the mean value of the magnitude of the contact normal force | f ¯ n | (Figure 11a), as the result of the same value of the contact stiffness k1 and k2 applied for all simulations. Figure 11b presents profiles of the normalized average stress component σx/σx,max along the y direction. Negative values correspond to the compressive stress, and positive values correspond to the tension stress. Stress profiles in the y direction were very similar for all three breakage modes: the stress was tensile in the central part of the disc and compressive in locations close to the loading platens. The shape of this stress profile was consistent with the findings of experimental [23], theoretical [22], finite element [52], and DEM [43] studies. These studies have indicated the domination of the tension stress in locations close to centre of the disc, which results in cracking, and domination of the compressive stress in locations close to the loading platens, which results in crushing.
The differences in the σ1L/D) relationships between the ductile, semi-brittle, and brittle breakage modes can be attributed to the difference in the dynamics of bond breakage when approaching the peak of σ1. Figure 11c illustrates the normalized rate of the breakage of bonds for three breakage modes. For the ductile breakage mode, the rate was almost constant during the entire process of deformation. For the brittle and semi-brittle breakage modes, the maximum of the rate was observed. The brittle and semi-brittle breakage modes were initiated at the instance of the highest increase in the rate of bond breakage. This indicates a very rapid change in the rate of bond breakage in the case of the brittle and semi-brittle breakage modes, and an almost constant rate in the case of the ductile breakage mode. Therefore, it seems that the course of change of the rate of breakage of bonds during deformation can be used to distinguish ductile and semi-brittle behaviour. The difference in the dynamic of breakage of bonds resulted in a difference in the rate of change of the kinetic energy of particles during deformation (Figure 11d). Kinetic energy started to increase rapidly at the instance of the σ1 peak, in the case of the brittle and semi-brittle breakage modes, and increased much more slowly but slightly faster than linearly during the entire process of deformation in the case of the ductile breakage mode.
There was no clear threshold for the transition from semi-brittle to brittle behaviour, but the transition was diffuse, owing to the gradual change in the partition of the intact bond force and the contact force in the total resistance to loading with the change in the bond-to-contact elasticity ratio (Eb/E). In the bond-to-contact elasticity-ratio range of 0.12 to 0.2, the brittle and semi-brittle modes were observed alternately, owing to the effects of other materials and process parameters, such as the compaction pressure, additives, and steaming, which modified the elasticity, strength, and compaction of the tablets (Figure 10). For EbE, i.e., when the dominating interaction was the elastic deformation of the bonds limited by their relatively low strength (σc < 0.01Eb), the breakage appeared as clearly brittle (the case of σc/Eb = 0.004 in Figure 10b). Therefore, brittle behaviour appears for high bond stiffness and low strength.

4.2. Effect of Compaction Pressure

This section of the study concerned the impact of compaction pressure on the tensile strength of the agglomerates. The dependences of the bond cross-sectional area Ab and the bond coordination number BCN on the compaction pressure σz were considered as the relationships explaining the effect of the compaction pressure on the tensile strength.

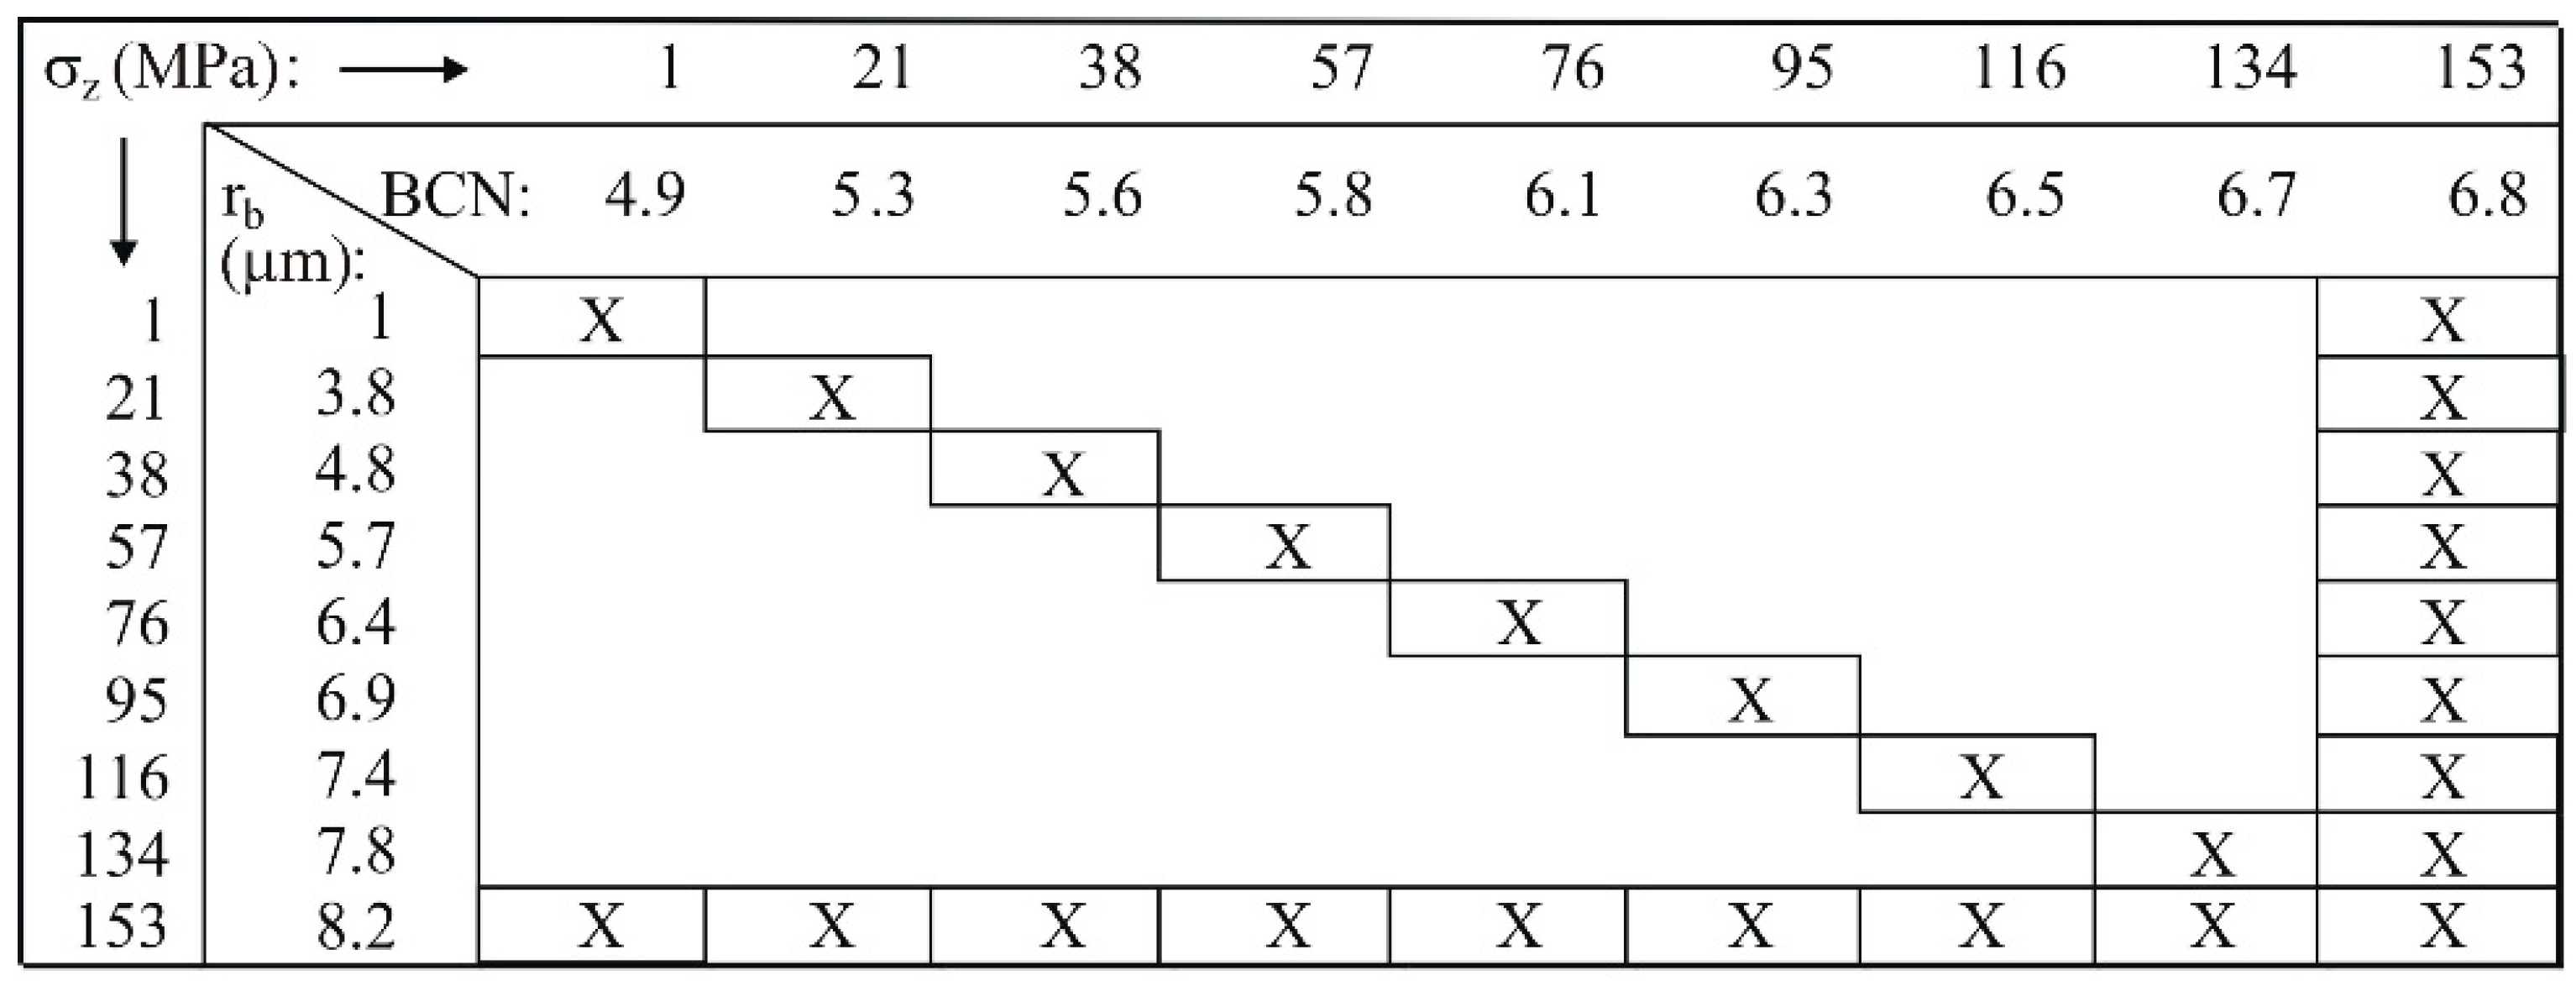
4.2.1. Bond Cross-Sectional Area and Bond Coordination Number

The cross-sectional area of the bond (Ab) was assumed to be equal to the average contact area of the particles, and was approximated as
A b = π r ¯ δ ¯ n , 0 ,
where r ¯ is the mean radius of the particles and δ ¯ n , 0 is the mean residual overlap, i.e., the mean overlap at the instant of bond initiation. The bond coordination number was determined as the ratio of the doubled intact bonds to the number of particles.
Both the cross-sectional area of the bond, Ab (Figure 12a), and the coordination number of the bond, BCN (Figure 12b), exhibited a slower-than-linear increase with the increase of the compaction pressure. The dependences were approximated by the power functions:
Δ A b Δ σ z α ,   α = 0.794 ± 0.012 ( R 2 = 0.999 ) ,
Δ B C N Δ σ z β ,   β = 0.725 ± 0.005 ( R 2 = 0.999 ) .
The BCN was considerably lower than the coordination number during compaction and unloading, and slightly lower than the coordination number for the agglomerates that were removed from the mould and relaxed.

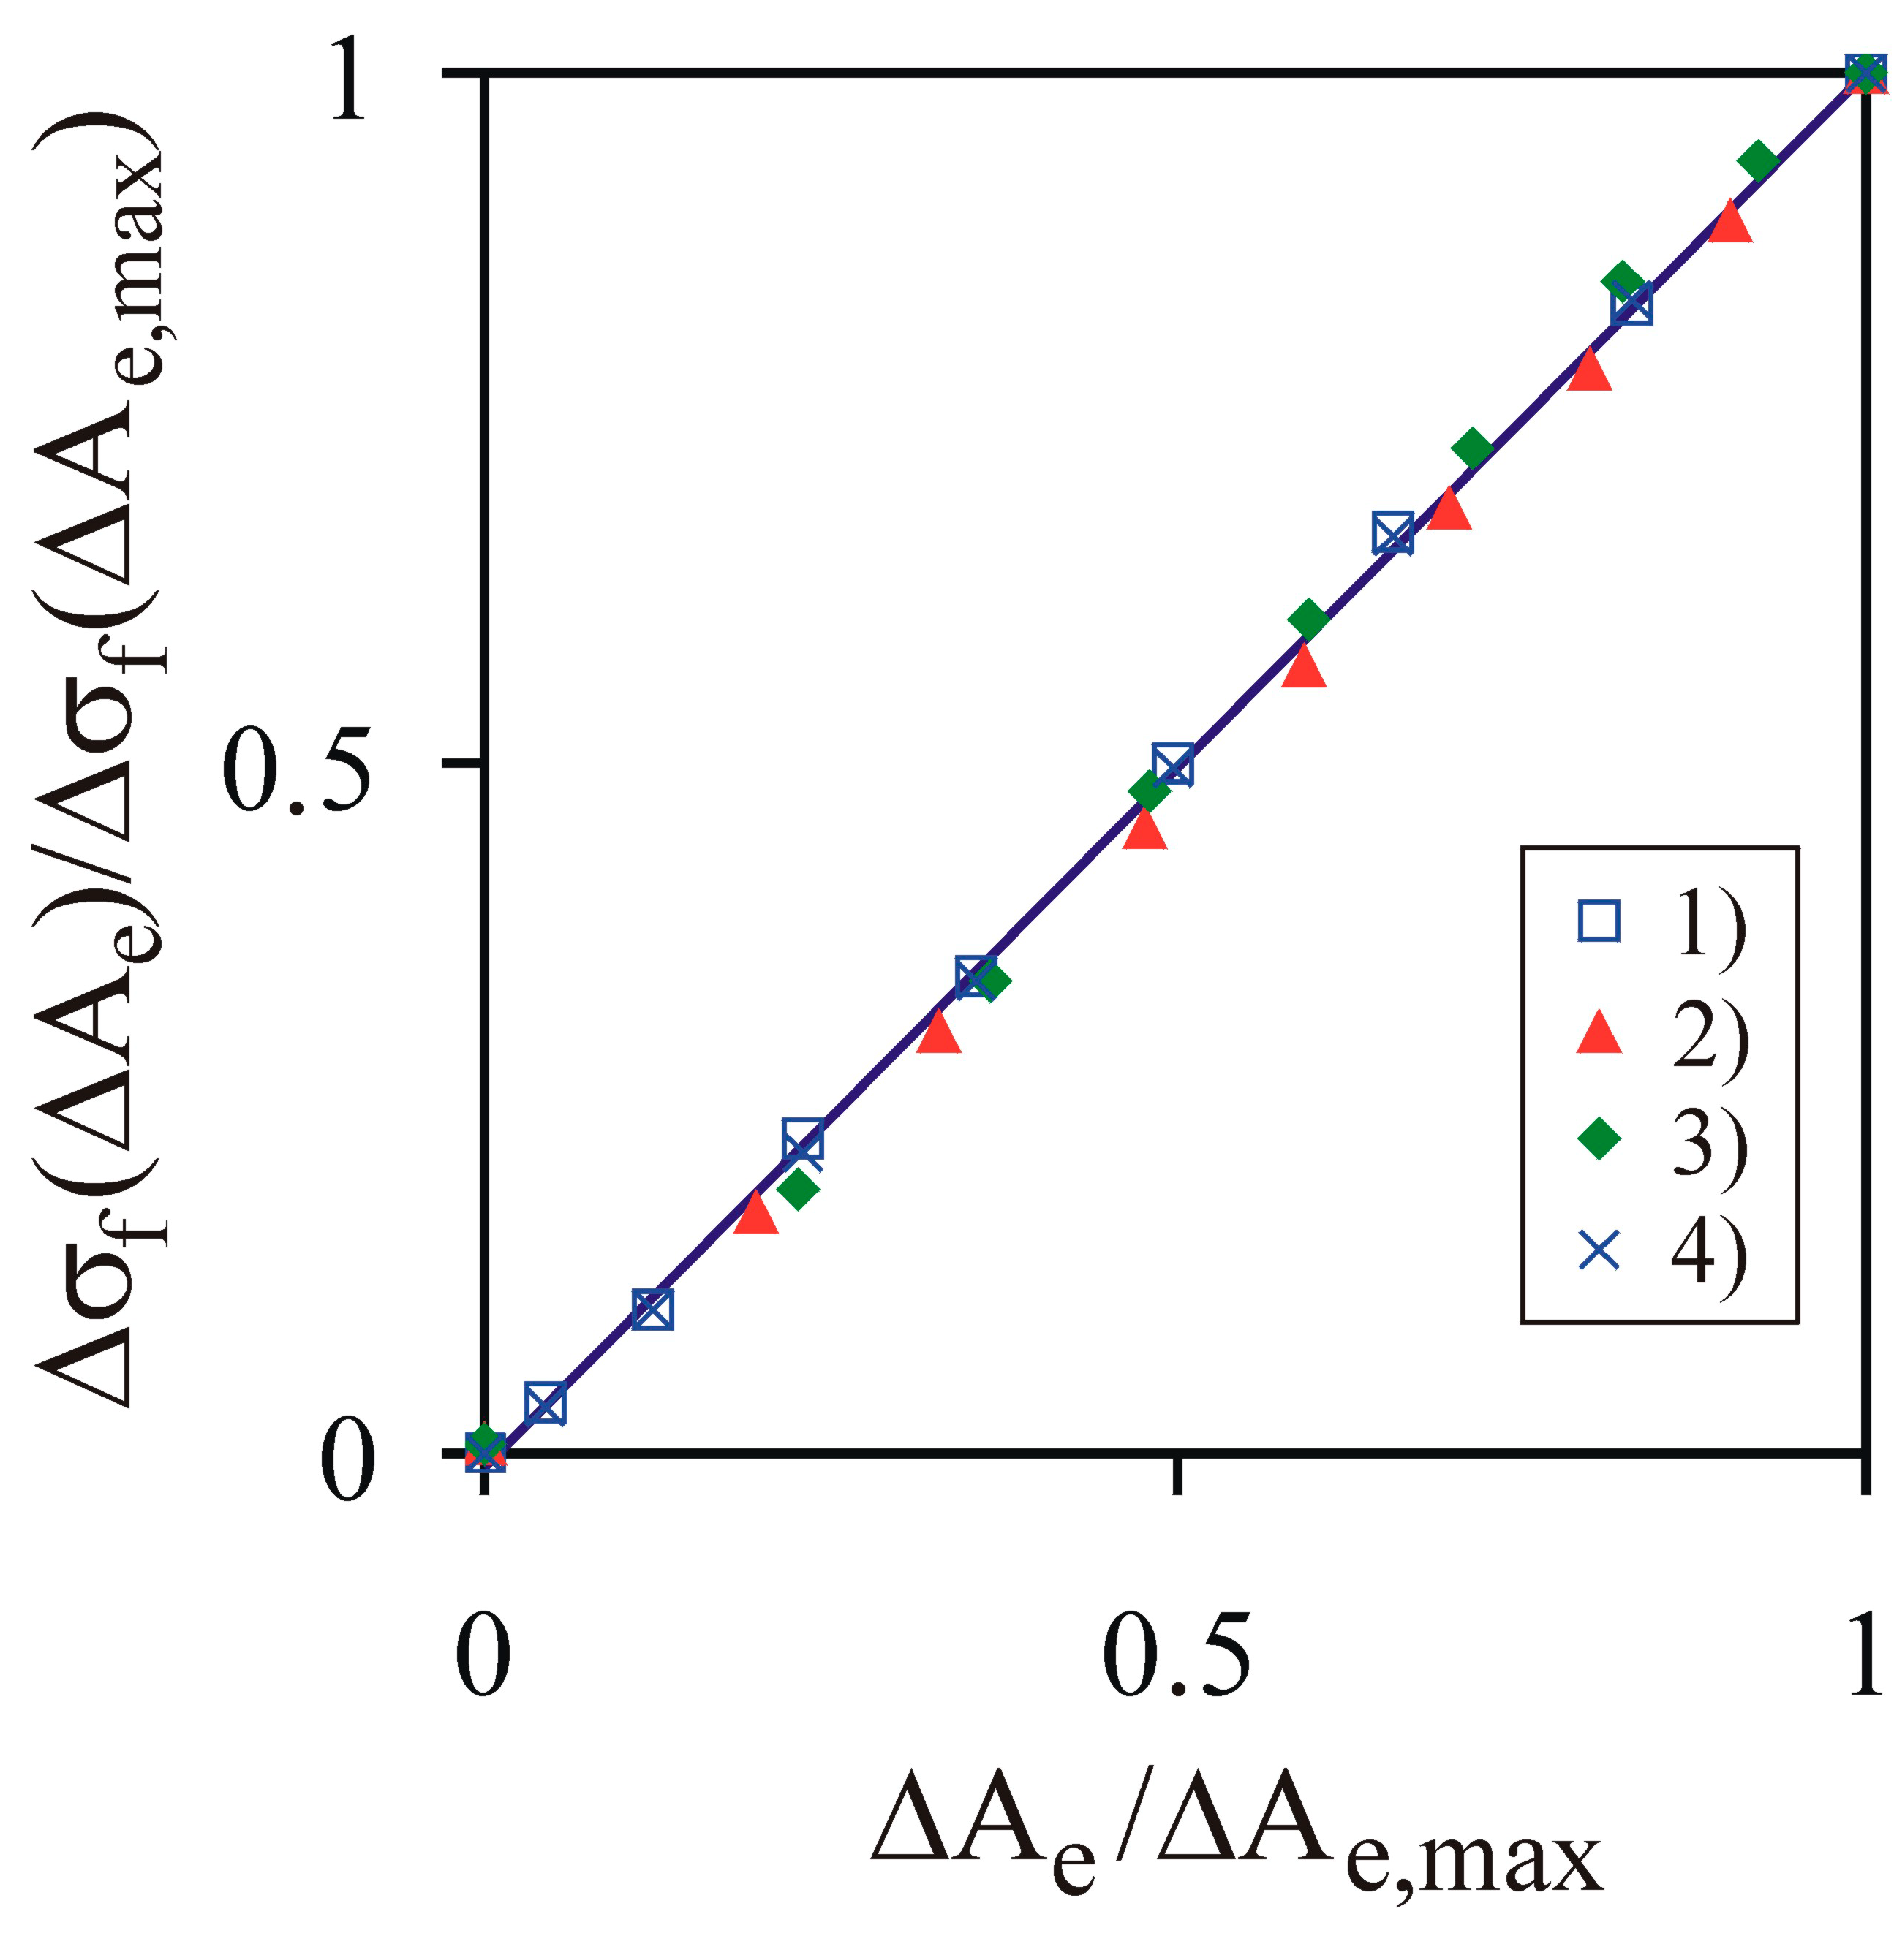
4.2.2. Impact of the Effective Bond Cross-Sectional Area

The simulated relationships fitted the experimental data of σ1L/D) well for the diametral compression of PS agglomerates in the agglomeration-pressure (σz) range of 76–153 MPa, for constant values of the bond parameters: Eb = 220 MPa and σc = 12 MPa (Figure 13a). In the case of σz = 36 MPa, the tensile strength of the bond had to be reduced to 3.6 MPa to fit the experimental data well. A less than three-fold change in the tensile strength of the bond indicates a qualitative change in the binding mechanisms in low and intermediate regions of the strength–pressure relationship, as described by Alderborn [53].
Taking into account the range of the variability of the parameter-fitting characteristics of individual tablets (Figure 9a) for σz = 153 MPa (Eb ∈ 200–300 MPa, σc ∈ 10–12 MPa), resulting from the variability of their mechanical characteristics, the applied model provided a decent approximation. To analyse the nonlinear dependence of the tensile strength of the agglomerates on the compaction pressure σf(σz), according to a uniform formula, σc was assumed to be 12 MPa for the entire range of σz (Figure 13b). The tensile strength σf exhibited a faster-than-linear increase with the increase of the compaction pressure σz. The rate of this increase followed the faster-than-linear increase of the effective cross-sectional area of the elastic bonds (ΔAe) with the increase of the compaction pressure:
Δ A e = Δ A b Δ B C N = Δ σ z α + β ,
where α + β > 1.
To verify the separate contributions of Ab and BCN to the mechanical strength over the entire range of applied values of the compaction pressure, DEM simulations were performed for a series of values of rb and BCN related to σz or σ z , max , according to the following scheme (Figure 14):
c a s e   1 ) :   σ f ( r b ( σ z ) , B C N ( σ z ) ) ,
c a s e   2 ) :   σ f ( r b ( σ z , max ) , B C N ( σ z ) ) ,
c a s e   3 ) :   σ f ( r b ( σ z ) , B C N ( σ z , max ) ) .
Change in the normalized tensile strength Δ σ f ( Δ A e ) / Δ σ f ( Δ A e , max ) exhibited a linear relationship with change in the normalized effective bond cross-sectional area Δ A e / Δ A e , max (R2 = 0.998) for all three cases over the entire range of σz (Figure 15). The product obtained from cases 2 and 3, which is denoted in Figure 15 as case 4, is as follows:
c a s e   4 ) :   c a s e   2 ) c a s e   3 ) / ( σ f ( r b ( σ z , max ) , B C N ( σ z , max ) ) 2 ,
It produced almost the same values of the tensile strength as case 1. This agreement illustrates the separate contributions of Ab and BCN to the mechanical strength of the bulk materials simulated by the BPM. The faster-than-linear increase of the tensile strength σf with the increase of the compaction pressure σz reflects the increase of the inter-particle contact area to a critical point, as described by Alderborn [53].

5. Discussion

The mechanical breakage behaviour of compacts is determined by micro-bonding mechanisms [3]. Experiments have indicated that brittle breakage is typical for dense structures with a high bond stiffness [23,54]. Ductile breakage has been observed for loose structures with a low bond stiffness [14,15]. Semi-brittle breakage is typical for intermediate compacted structures with an intermediate bond stiffness [11,17]. This classification was clearly reflected by the results of the experimental study of Ge et al. [51], involving the breakage of 3D-printed agglomerates of dense and loose structures with rigid and soft bonds, which elucidated the effects of the packing density, inter-particle bond strength, and elasticity. The results of our study agree with these findings, as well as the findings of Dhanalakshmi and Bhattacharya [18], and indicate that PS particles bonded together in the presence of different binders can exhibit a brittle, semi-brittle, or ductile breakage mode. This highlights the significant effect of binder properties on the tensile strength [55]. Water acts as both a binding agent (in the case of water-soluble compounds) and as a lubricant. The addition of sugar resulted in a less than two-fold increase of the agglomerate strength, owing to the recrystallisation of the solubilised sugar after cooling and the formation of solid bridges. Similarly, protein fibrils may have created binding sites between particles [50]. Gluten proteins—a group of proteins stored with starch in the endosperm of various cereal grains—have unique viscoelastic properties [56]. The addition of gluten with the steaming of the sample reduced the bond stiffness. This manifested as a four-fold decrease of the breakage strength of the agglomerates, as well as the change of the breakage mode from semi-brittle to ductile.
Originally, the BPM was developed to describe the brittle breakage of rocks [25]. Further study allowed the application of the BPM to be extended to other breakage modes. Kozhar et al. [28] proposed the elastic–plastic model and Maxwell viscoelastic model for solid bonds to reproduce the inelastic deformations in titania. The recent study of Ma and Huang [27] showed that application of the displacement-softening model to the bonds allows for modelling of all three modes of agglomerate breakage—brittle, semi-brittle, and ductile—depending on the softening parameter.
The main novelty of our study is the finding that a similar effect to described by Ma and Huang [27] can be obtained using the linear elastic–plastic contact model coupled with the BPM, with a broadened range of the elasticity and the tensile strength of the bonds. A high elasticity and low strength of the bonds, accompanied by a dense structure, resulted in brittle breakage. Low elasticity and high strength of the bonds, together with a loose structure, resulted in ductile breakage. The criterion Eb = E separates semi-brittle and brittle breakage. The rate of breakage of the bonds during deformation can be used to distinguish ductile and semi-brittle behaviour. The similar shapes of the experimental and modelled force–displacement relationships, as well as the outlined mechanisms of breakage at the microscale, confirm the applicability of the BPM for simulating the behaviour of agglomerates under compression in a wide range of breakage modes, ranging from brittle to ductile.
The strength of agglomerates increases with the compaction pressure, up to a limiting value [57,58]. The strength limit is related to exhaustion of the increase of the binding mechanisms and the contact area of the plastic deformation of particles when a very high pressure is reached [59]. Alderborn [53] identified three regions of the strength–pressure relationship of powders’ σf(σz) low-, intermediate-, and high-pressure regions. In the low-pressure region, the pressure is too low for the particles to cohere into a compact. In the intermediate-pressure region, the inter-particle contact area increases up to a critical point. In the high-pressure region, the maximal tablet tensile strength is reached. The results of our study correspond to the low- and intermediate-pressure regions. The experimental results indicated that at the compaction-pressure (σz) range of 38–153 MPa, the tensile strength increased linearly with the increase of σz. Below this σz range, obtainment of a stable agglomerate with adequate strength was impossible. The DEM simulations indicated a faster-than-linear increase of σf with the increase of σz in both the low- and intermediate-pressure regions, owing to the dependence of two micro-variables—the bond cross-section and bond coordination number—on σz.
A comparison of the results of this study with the ones obtained previously by authors from DEM simulations, using the adhesive contact model and the same parameters (with the exception of the contact model) [43], indicates that the source of the largest difference between the outputs was the lack of shear strength in the case of the adhesive contacts. This resulted in a more round force–displacement relationship for the adhesive model compared with the BPM. Disadvantages of the adhesive model include the appearance of secondary contacts during the deformation of the agglomerates. In the case of long-path particle–particle shear displacements, the secondary contacts may slightly increase the effective tensile strength of the agglomerates. The BPM, in which the bonds are formed once, overcomes this inconvenience of the adhesive model. Moreover, the bond stiffness, which is independent of the particle stiffness, considerably broadens the range of applicability for modelling processes in real solids.

6. Conclusions

Experiments and DEM simulations of the diametral compression of PS agglomerates were performed. The study provided deep insight into the interactions in an agglomerate at the microscale, elucidating the breakage mechanisms. According to the results, the following conclusions are drawn.
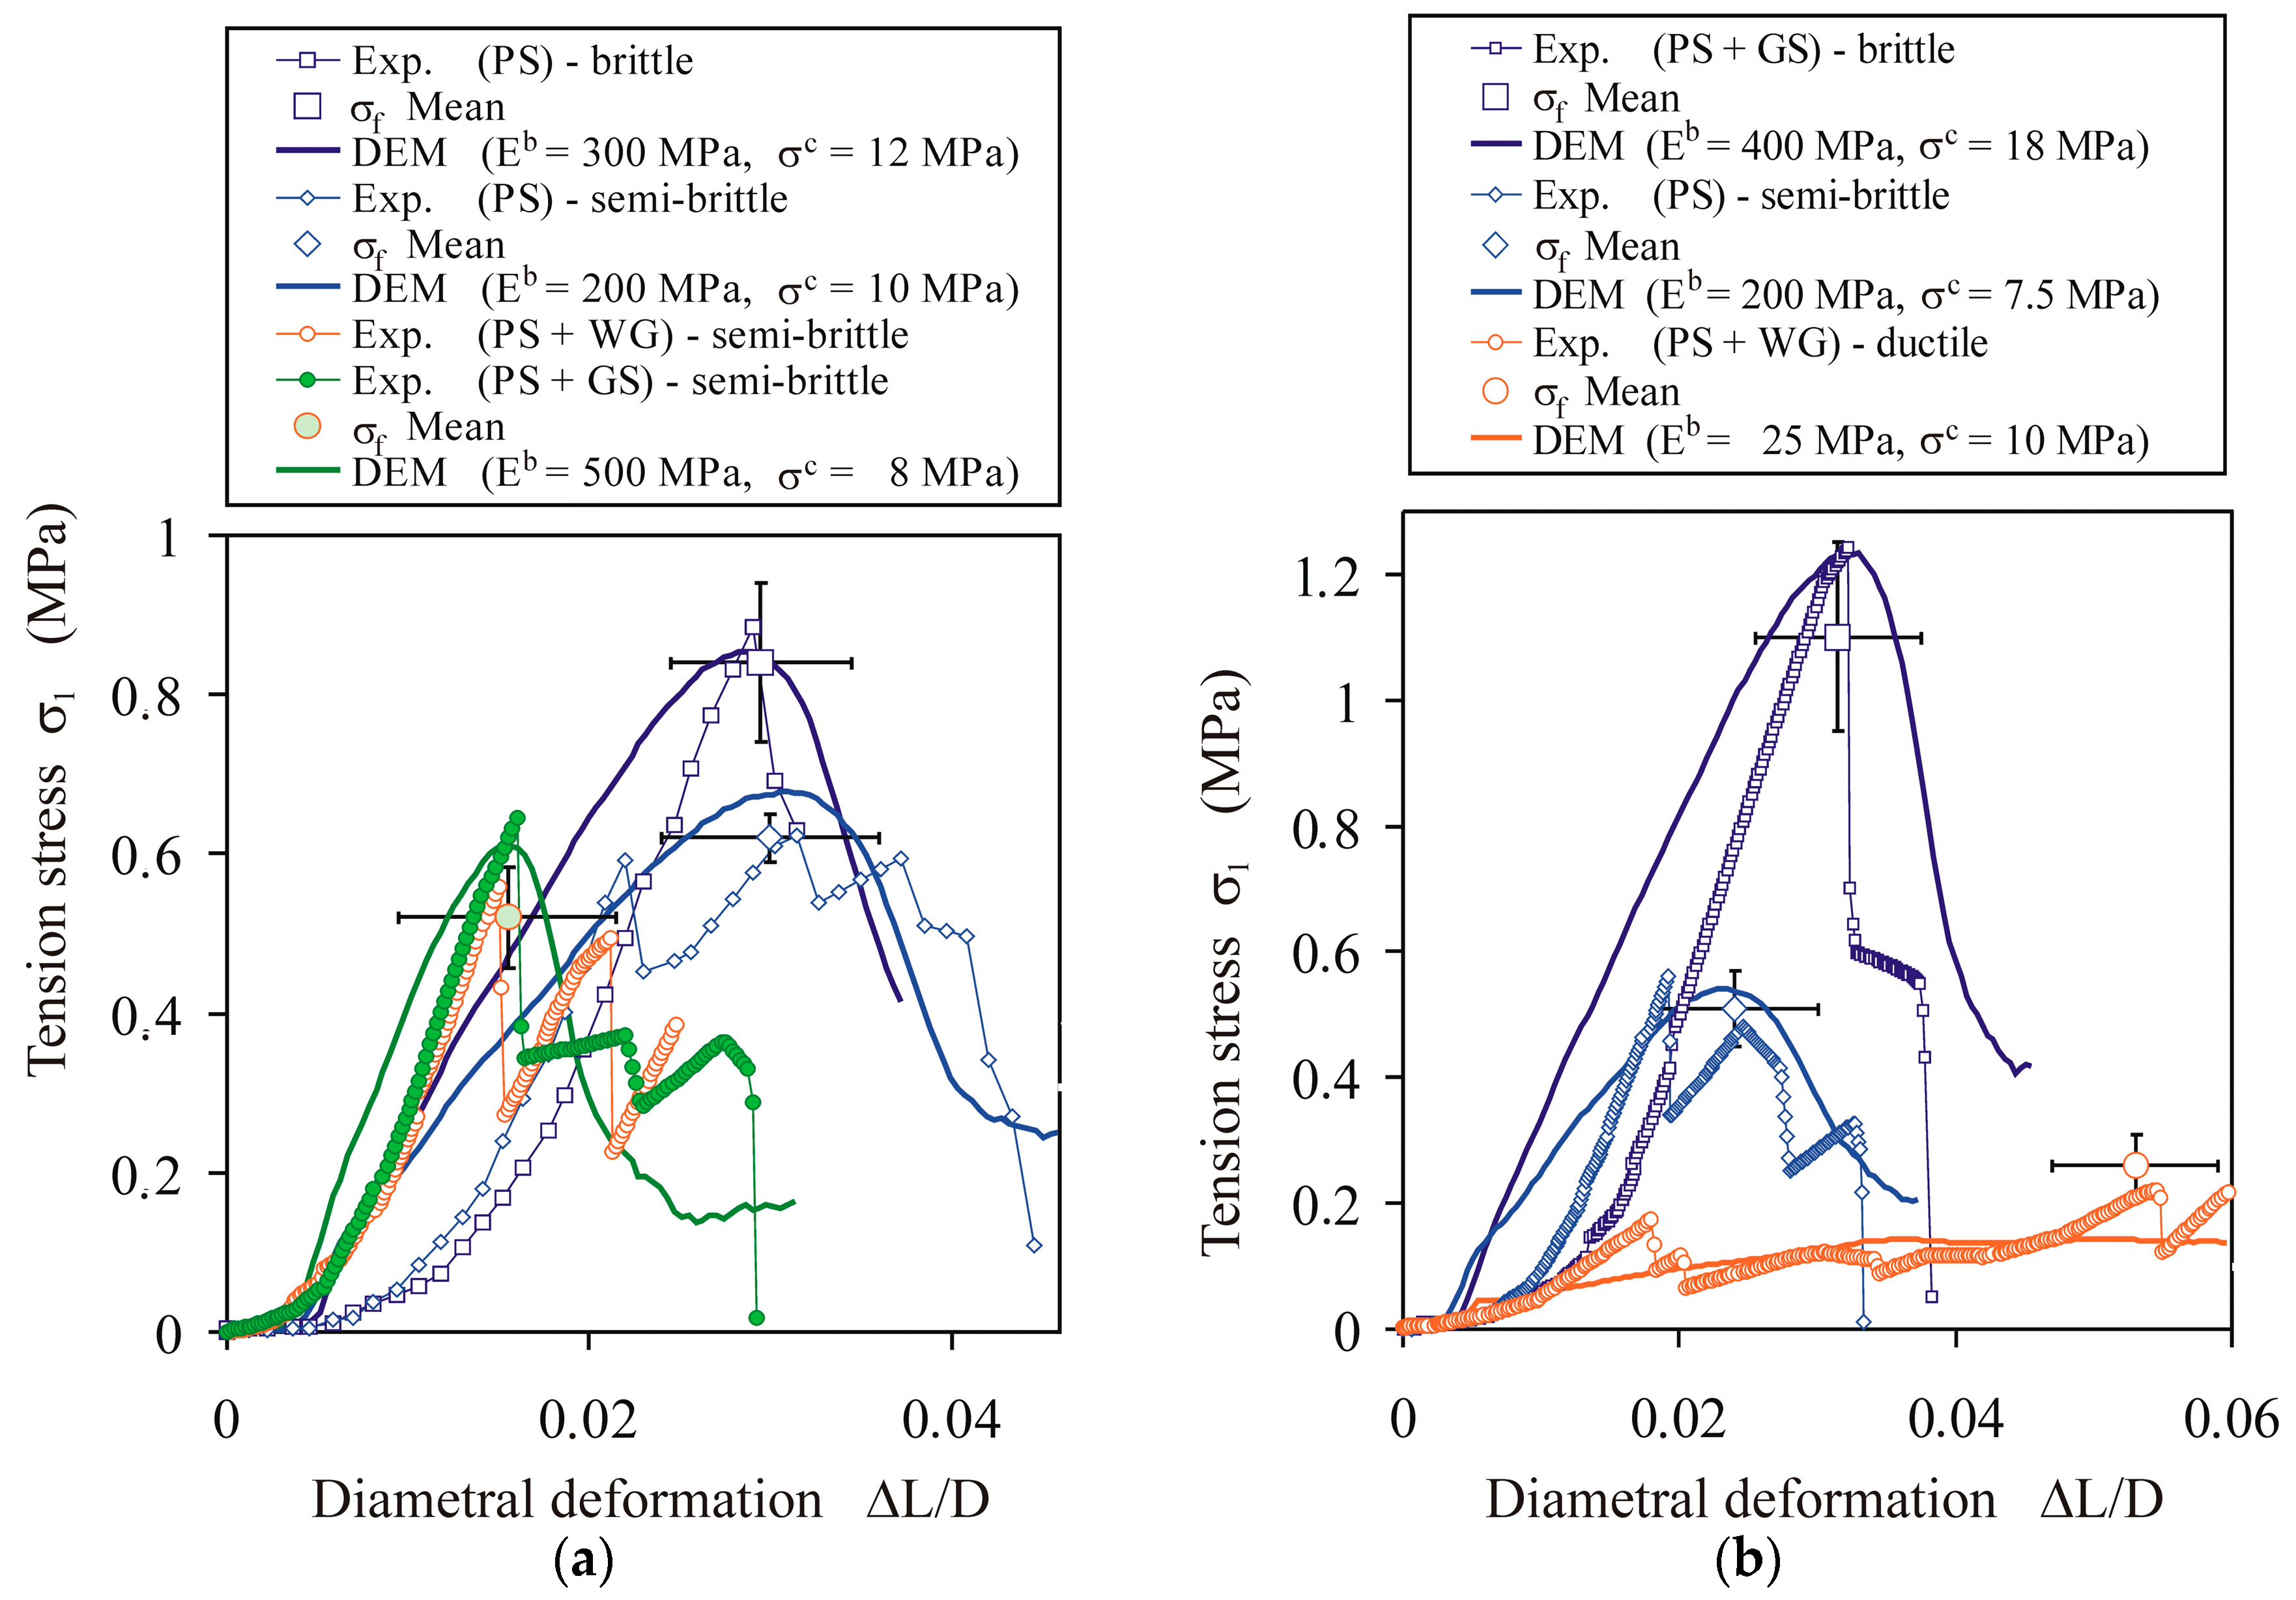
  • Potato starch agglomerates may exhibit a brittle, semi-brittle, or ductile breakage mode, depending on the applied binder. Starch agglomerates with a moisture content of 17% behaved as semi-brittle materials. The addition of sugar increased the tensile strength of the agglomerates and resulted in the brittle breakage mode. The addition of gluten significantly reduced the tensile strength and resulted in the ductile breakage mode.
  • The BPM, applied together with the linear elastic–plastic contact model, described the brittle, semi-brittle, or ductile breakage mode, depending on the ratio of the strength to the Young’s modulus of the bond σc/Eb and the bond-to-contact elasticity ratio Eb/E. A low Young’s modulus and high strength of the bond resulted in the ductile breakage mode. A high Young’s modulus of the bond and high compaction resulted in the brittle breakage mode. Intermediate conditions resulted in the semi-brittle breakage mode.
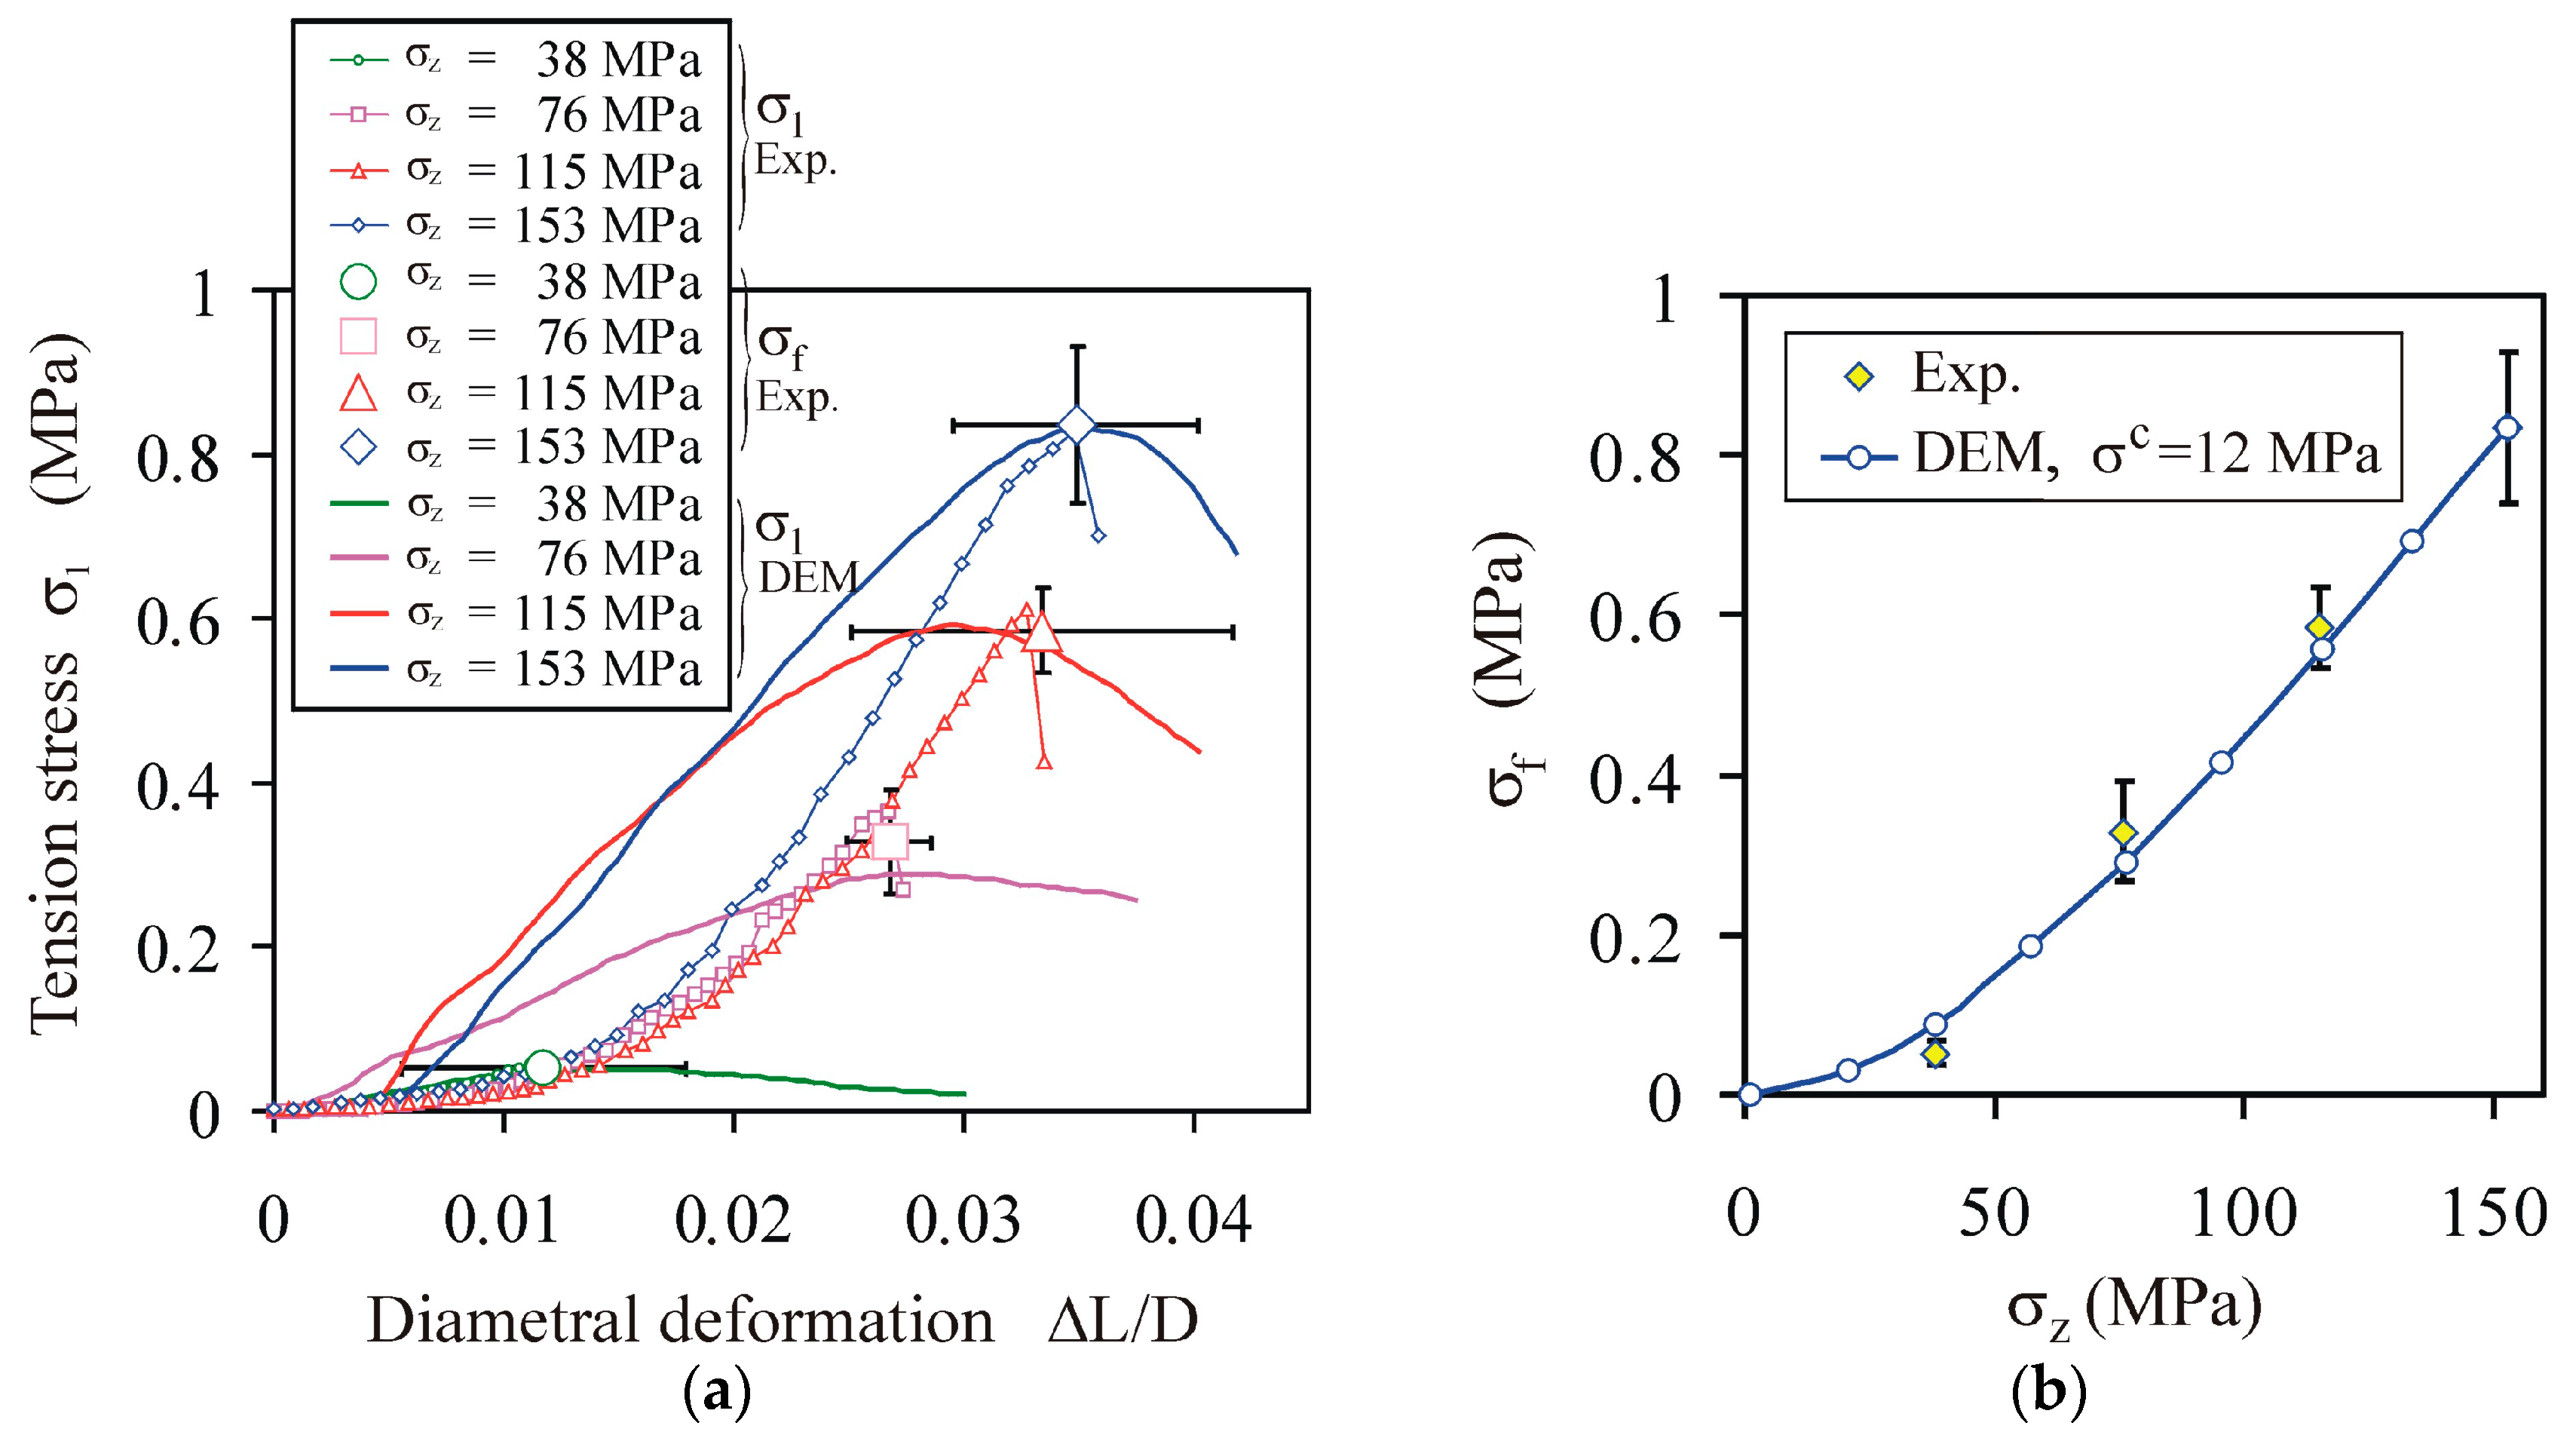
  • The tensile strength of agglomerates determined experimentally increased linearly with the increase of the compaction pressure. The tensile strength determined via DEM modelling exhibited a faster-than-linear increase with the increase of the compaction pressure, which resulted from the faster-than-linear increase of the product of two micro-variables—the bond cross-sectional area Ab and the bond coordination number BCN—with the increase of the compaction pressure.
  • The bonded-particle model is promising for DEM simulations of the diametral compression tests of agglomerates.

Author Contributions

Conceptualization, J.H.; methodology, J.H., J.W., and P.P.; software, P.P.; validation, R.K.; formal analysis, M.M.; investigation, M.B. and M.S.; resources, J.H.; data curation, J.W.; writing—original draft preparation, J.H.; writing—review and editing, M.M.; visualization, R.K.; supervision, J.H. All authors have read and agreed to the published version of the manuscript.

Funding

This research received no external funding.

Conflicts of Interest

The authors declare no conflict of interest.

References

  1. He, Y.; Guo, F. Micromechanical analysis on the compaction of tetrahedral particles. Chem. Eng. Res. Des. 2018, 136, 610–619. [Google Scholar] [CrossRef]
  2. Mitchell, W.R.; Forny, L.; Althaus, T.; Dopfer, D.; Niederreiter, G.; Palzer, S. Compaction of food powders: The influence of material properties and process parameters on product structure, strength, and dissolution. Chem. Eng. Sci. 2017, 167, 29–41. [Google Scholar] [CrossRef]
  3. Dosta, M.; Dale, S.; Antonyuk, S.; Wassgren, C.; Heinrich, S.; Litster, J.D. Numerical and experimental analysis of influence of granule microstructure on its compression breakage. Powder Technol. 2016, 299, 87–97. [Google Scholar] [CrossRef]
  4. He, Y.; Evans, T.J.; Yu, A.B.; Yang, R.Y. Numerical modelling of die and unconfined compactions of wet particles. Procedia Eng. 2015, 102, 1390–1398. [Google Scholar] [CrossRef] [Green Version]
  5. Lipetzky, P.; Wanner, A. On the problem of interpreting flexure experiments on semi-brittle materials. Mater. Sci. Eng. A 1996, 211, 87–94. [Google Scholar] [CrossRef]
  6. Li, X.; Wang, S.; Malekian, R.; Hao, S.; Li, Z. Numerical simulation of rock breakage modes under confining pressures in deep mining: An experimental investigation. IEEE Access 2016, 4, 5710–5720. [Google Scholar] [CrossRef]
  7. Christensen, R.; Li, Z.; Gao, H. An evaluation of the failure modes transition and the Christensen ductile/brittle failure theory using molecular dynamics. Proc. R. Soc. A 2018, 474, 1–21. [Google Scholar] [CrossRef] [Green Version]
  8. Chaudhri, M.M. Impact breakage of semi-brittle spheres. Powder Technol. 2004, 143–144, 31–40. [Google Scholar] [CrossRef]
  9. Létoffé, A.; García-Rodríguez, S.M.; Hoppe, S.; Canilho, N.; Godard, O.; Pasc, A.; Royaud, I.; Ponçot, M. Switching from brittle to ductile isotactic polypropylene-g-maleic anhydride by crosslinking with capped-end polyether diamine. Polymer 2019, 164, 67–78. [Google Scholar] [CrossRef]
  10. Adams, M.J.; McKeown, R. Micromechanical analyses of the pressure-volume relationships for powders under confined uniaxial compression. Powder Technol. 1996, 88, 155–163. [Google Scholar] [CrossRef]
  11. Persson, A.-S.; Nordström, J.; Frenning, G.; Alderborn, G. Compression analysis for assessment of pellet plasticity: Identification of reactant pores and comparison between Heckel, Kawakita, and Adams equations. Chem. Eng. Res. Des. 2016, 110, 183–191. [Google Scholar] [CrossRef]
  12. Taherkhani, H. Experimental Characterisation of the Compressive Permanent Deformation Behaviour in Asphaltic Mixtures. Ph.D. Thesis, University of Nottingham, Nottingham, UK, 2006. [Google Scholar]
  13. Zhu, J.; Hu, J.; Jiang, C.; Liu, S.; Li, Y. Ultralight, hydrophobic, monolithic konjac glucomannan-silica composite aerogel with thermal insulation and mechanical properties. Carbohydr. Polym. 2019, 207, 246–255. [Google Scholar] [CrossRef] [PubMed]
  14. Pampuro, N.; Bagagiolo, G.; Priarone, P.C.; Cavallo, E. Effects of pelletizing pressure and the addition of woody bulking agents on the physical and mechanical properties of pellets made from composted pig solid fraction. Powder Technol. 2017, 311, 112–119. [Google Scholar] [CrossRef]
  15. Butt, S.S.; Mohammed, I.K.; Raghavan, V.; Osborne, J.; Powell, H.; Charalambides, M.N. Quantifying the differences in structure and mechanical response of confectionery products resulting from the baking and extrusion processes. J. Food Eng. 2018, 238, 112–121. [Google Scholar] [CrossRef] [PubMed]
  16. García-Armenta, E.; Gutiérrez-López, G.F.; Hernández-Sánchez, H.; Alamilla-Beltrán, L. Characterisation of the global breakage pattern of maltodextrin agglomerates. Powder Technol. 2019, 343, 362–365. [Google Scholar] [CrossRef]
  17. Nordström, J.; Welch, K.; Frenning, G.; Alderborn, G. On the physical interpretation of the Kawakita and Adams parameters derived from confined compression of granular solids. Powder Technol. 2008, 182, 424–435. [Google Scholar] [CrossRef]
  18. Dhanalakshmi, K.; Bhattacharya, S. Compaction agglomeration of corn starch in presence of different binders. J. Food Eng. 2011, 104, 348–355. [Google Scholar] [CrossRef]
  19. Zhang, J.; Wang, J.; Yuan, Z.; Jia, H. Effect of the cohesive law shape on the modelling of adhesive joints bonded with brittle and ductile adhesives. Int. J. Adhes. Adhes. 2018, 85, 37–43. [Google Scholar] [CrossRef]
  20. Pec, M.; Stünitz, H.; Heilbronner, R. Semi-brittle deformation of granitoid gouges in shear experiments at elevated pressures and temperatures. J. Struct. Geol. 2012, 38, 200–221. [Google Scholar] [CrossRef]
  21. Tang, C.A.; Liu, H.Y.; Zhu, W.C.; Yang, T.H.; Li, W.H.; Song, L.; Lin, P. Numerical approach to particle breakage under different loading conditions. Powder Technol. 2004, 143–144, 130–143. [Google Scholar] [CrossRef]
  22. Timoshenko, S.P.; Goodier, J.N. Theory of Elasticity; McGraw-Hill: New York, NY, USA, 1970. [Google Scholar]
  23. Jonsén, P.; Häggblad, H.-Å.; Sommer, K. Tensile strength and fracture energy of pressed metal powder by diametral compression test. Powder Technol. 2007, 176, 148–155. [Google Scholar] [CrossRef]
  24. Cundall, P.A.; Strack, O.D. A discrete element model for granular assemblies. Géotechnique 1979, 29, 47–65. [Google Scholar] [CrossRef]
  25. Potyondy, D.O.; Cundall, P.A. A bonded-particle model for rock. Int. J. Rock Mech. Min. Sci. 2004, 41, 1329–1364. [Google Scholar] [CrossRef]
  26. Zheng, K.; Du, C.; Li, J.; Qiu, B.; Fu, L.; Dong, J. Numerical simulation of the impact-breakage behavior of non-spherical agglomerates. Powder Technol. 2015, 286, 582–591. [Google Scholar] [CrossRef]
  27. Ma, Y.; Huang, H. A displacement-softening contact model for discrete element modeling of quasi-brittle materials. Int. J. Rock Mech. Min. Sci. 2018, 104, 9–19. [Google Scholar] [CrossRef]
  28. Kozhar, S.; Dosta, M.; Antonyuk, S.; Heinrich, S.; Bröckel, U. DEM simulations of amorphous irregular shaped micrometer-sized titania agglomerates at compression. Adv. Powder Technol. 2015, 26, 767–777. [Google Scholar] [CrossRef]
  29. Spettl, A.; Dosta, M.; Antonyuk, S.; Heinrich, S.; Schmidt, V. Statistical investigation of agglomerate breakage based on combined stochastic microstructure modeling and DEM simulations. Adv. Powder Technol. 2015, 26, 1021–1030. [Google Scholar] [CrossRef]
  30. He, Y.; Wang, Z.; Evans, T.J.; Yu, A.B.; Yang, R.Y. DEM study of the mechanical strength of iron ore compacts. Int. J. Miner. Process. 2015, 142, 73–81. [Google Scholar] [CrossRef]
  31. He, Y.; Evans, T.J.; Shen, Y.S.; Yu, A.B.; Yang, R.Y. Discrete modelling of the compaction of non-spherical particles using a multi-sphere approach. Miner. Eng. 2018, 117, 108–116. [Google Scholar] [CrossRef]
  32. Brown, N.J.; Chen, J.-F.; Ooi, J.Y. A bond model for DEM simulation of cementitious materials and deformable structures. Granul. Matter 2014, 16, 299–311. [Google Scholar] [CrossRef]
  33. Shiotsubo, T. Gelatinization temperature of potato starch at the equilibrium state. Agric. Biol. Chem. 1984, 48, 1–7. [Google Scholar] [CrossRef]
  34. Walton, O.R.; Braun, R.L. Viscosity, granular temperature, and stress calculations for shearing assemblies of inelastic, frictional disks. J. Rheol. 1986, 30, 949–980. [Google Scholar] [CrossRef]
  35. Luding, S. Shear flow modelling of cohesive and frictional fine powder. Powder Technol. 2005, 158, 45–50. [Google Scholar] [CrossRef]
  36. Thornton, C.; Ning, Z. A theoretical model for the stick/bounce behaviour of adhesive, elastic–plastic spheres. Powder Technol. 1998, 99, 154–162. [Google Scholar] [CrossRef]
  37. DEM Solutions Ltd. EDEM 2018.2 Documentation; Copyright© DEM Solutions Ltd.: Edinburgh, UK, 2018; Available online: www.dem-solutions.com/software/edem-software (accessed on 20 January 2020).
  38. Tsuji, Y.; Tanaka, T.; Ishida, T. Lagrangian numerical simulation of plug flow of cohesionless particles in a horizontal pipe. Powder Technol. 1992, 71, 239–250. [Google Scholar] [CrossRef]
  39. Molenda, M.; Stasiak, M.; Horabik, J.; Fornal, J.; Błaszczak, W.; Ornowski, A. Microstructure and mechanical parameters of five types of starch. Pol. J. Food Nutr. Sci. 2006, 15/56, 161–168. [Google Scholar]
  40. He, Y.; Li, Y.Y.; Evans, T.J.; Yu, A.B.; Yang, R.Y. Effects of particle characteristics and consolidation pressure on the compaction of non-spherical particles. Miner. Eng. 2019, 137, 241–249. [Google Scholar] [CrossRef]
  41. Salerno, M.; Żukowska, A.; Thorat, S.; Ruffilli, R.; Stasiak, M.; Molenda, M. High resolution imaging of native wheat and potato starch granules based on local mechanical contrast. J. Food Eng. 2014, 128, 96–102. [Google Scholar] [CrossRef]
  42. Horabik, J.; Molenda, M. Parameters and contact models for DEM simulations of agricultural granular materials: A review. Biosyst. Eng. 2016, 147, 206–225. [Google Scholar] [CrossRef]
  43. Horabik, J.; Wiącek, J.; Parafiniuk, P.; Stasiak, M.; Bańda, M.; Molenda, M. Tensile strength of pressure-agglomerated potato starch determined via diametral compression test: Discrete element method simulations and experiments. Biosyst. Eng. 2019, 183, 95–109. [Google Scholar] [CrossRef]
  44. Stasiak, M.; Molenda, M.; Horabik, J.; Mueller, P.; Opaliński, I. Mechanical properties of potato starch modified by moisture content and addition of lubricant. Int. Agrophys. 2014, 28, 501–509. [Google Scholar] [CrossRef] [Green Version]
  45. Wang, J.; Wen, H.; Desai, D. Lubrication in tablet formulations. Eur. J. Pharm. Biopharm. 2010, 75, 1–15. [Google Scholar] [CrossRef] [PubMed]
  46. Stasiak, M.; Rusinek, R.; Molenda, M.; Fornal, J.; Błaszczak, W. Effect of potato starch modification on mechanical parameters and granules morphology. J. Food Eng. 2011, 102, 154–162. [Google Scholar] [CrossRef]
  47. Balevičius, R.; Sielamowicz, I.; Mróz, Z.; Kačianauskas, R. Effect of rolling friction on wall pressure, discharge velocity and outflow of granular material from a flat-bottomed bin. Particuology 2012, 10, 672–682. [Google Scholar] [CrossRef]
  48. Huang, Y.J.; Nydal, O.J.; Yao, B. Time step criterions for nonlinear dense packed granular materials in time-driven method simulations. Powder Technol. 2014, 253, 80–88. [Google Scholar] [CrossRef]
  49. Christoffersen, J.; Mehrabadi, M.M.; Nemat-Naser, S. A micromechanical description of granular material behavior. J. Appl. Mech. 1981, 48, 339–344. [Google Scholar] [CrossRef]
  50. Thomas, M.; van Vliet, T.; van der Poel, A.F.B. Physical quality of pelleted animal feed. 3. Contribution of feedstuff components. Anim. Feed Sci. Tech. 1998, 76, 59–78. [Google Scholar] [CrossRef]
  51. Ge, R.; Ghadiri, M.; Bonakdar, T.; Zhou, Z.; Larson, I.; Hapgood, K. Experimental study of the deformation and breakage of 3D printed agglomerates: Effects of packing density and inter-particle bond strength. Powder Technol. 2018, 340, 299–310. [Google Scholar] [CrossRef]
  52. Indriyantho, B.R. Nuroji, Finite element modeling of concrete fracture in tension with the Brazilian splitting test on the case of plane-stress and plane-strain. Procedia Eng. 2014, 95, 252–259. [Google Scholar] [CrossRef] [Green Version]
  53. Alderborn, G. A novel approach to derive a compression parameter indicating effective particle deformability. Pharm. Dev. Technol. 2003, 8, 367–377. [Google Scholar] [CrossRef]
  54. Russell, A.; Schmelzer, J.; Müller, P.; Krüger, M.; Tomas, J. Mechanical properties and failure probability of compact agglomerates. Powder Technol. 2015, 286, 546–556. [Google Scholar] [CrossRef]
  55. Arndt, O.-R.; Kleinebudde, P. Influence of binder properties on dry granules and tablets. Powder Technol. 2018, 337, 68–77. [Google Scholar] [CrossRef]
  56. Nawrocka, A.; Szymańska-Chargot, M.; Miś, A.; Kowalski, R.; Gruszecki, W.I. Raman studies of gluten proteins aggregation induced by dietary fibres. Food Chem. 2016, 194, 86–94. [Google Scholar] [CrossRef]
  57. Nguyen, T.H.; Morton, D.A.V.; Hapgood, K.P. Application of the unified compaction curve to link wet granulation and tablet compaction behaviour. Powder Technol. 2013, 240, 103–115. [Google Scholar] [CrossRef]
  58. Grote, S.; Osthues, H.; Schaeffer, F.; Kleinebudde, P. The influence of isomalt particle morphology on tabletability after roll compaction/dry granulation. Powder Technol. 2019, 341, 59–65. [Google Scholar] [CrossRef]
  59. Persson, A.-S.; Alderborn, G. A hybrid approach to predict the relationship between tablet tensile strength and compaction pressure using analytical powder compression. Eur. J. Pharm. Biopharm. 2018, 125, 28–37. [Google Scholar] [CrossRef] [PubMed]
Figure 1. Schematics of the experimental setup: (a) compaction, (b) diametral compression test.
Materials 13 00932 g001
Figure 2. Constitutive linear elastic–plastic contact models: (a) linear adhesion model following concept of Luding [35], (b) parallel BPM.
Materials 13 00932 g002
Figure 3. Stages of the simulation: (a) filling, (b) compaction, (c) unloading, (d) relaxation, and (e) diametral compression modelled with use of EDEM software.
Materials 13 00932 g003
Figure 4. Effect of the displacement velocity V on the σ1L/D) characteristic of agglomerates for σc = 10 MPa and Eb = 200 MPa.
Materials 13 00932 g004
Figure 5. Effect of the τc/σc ratio on the tensile strength of agglomerates for σc = 10 MPa and Eb = 200 MPa: (a) tension stress vs. diametral deformation relationships σ1L/D), and (b) tensile strength vs. bond shear strength-to-tensile strength relationship σf(τc/σc).
Materials 13 00932 g005
Figure 6. Tension stress vs. diametral deformation relationships σ1L/D): (a) effect of the bond strength σc = τc for Eb = 200 MPa; (b) effect of the bond’s Young’s modulus for σc = τc = 10 MPa.
Materials 13 00932 g006
Figure 7. Effect of the σc/Eb ratio on the breakage behaviour of the agglomerates for σz = 153 MPa: (a) comparison of the tension stress vs. diametral deformation σ1L/D) for ductile and semi-brittle breakage of the agglomerates; (b) (Eb, σc) map of the ductile and semi-brittle behaviour of the agglomerates.
Materials 13 00932 g007
Figure 8. Effect of the σc/Eb ratio on the breakage behaviour of the agglomerates during diametral compression: (a) comparison of the tension stress vs. diametral deformation σ1L/D) for the ductile and semi-brittle breakage modes at Eb = 200 MPa; (b) (σc/Eb, δ ¯ n , 0 / r ¯ ) map of the ductile and semi-brittle behaviour of the agglomerates.
Materials 13 00932 g008
Figure 9. Effects of additives and pretreatment on the σ1L/L) relationships during the diametral compression of the PS agglomerates: (a) without steaming and (b) with steaming. The bars indicate the standard deviation.
Materials 13 00932 g009
Figure 10. Profiles of the ductile, semi-brittle, and brittle breakage modes: (a) experimental and (b) simulated for σc = 10 MPa.
Materials 13 00932 g010
Figure 11. Relationships between micro- and macro-variables for brittle (σc = 18 MPa, Eb = 400 MPa), semi-brittle (σc = 7.5 MPa, Eb = 200 MPa), and ductile (σc = 10 MPa, Eb = 25 MPa) breakage modes: (a) dependence of σ1 on the mean value of the magnitude of the contact normal force | f ¯ n | ; (b) profiles of the normalized averaged stress component σx/σx,max along the y direction; (c) the normalized rate of bond breakages Δ N / Δ L 0 D / N 0 vs. diametral deformation, where ΔN is the number of bonds broken during the diametral deformation increment ΔL0/D of 3.92 × 10⁻⁵, and N0 is the initial number of bonds; (d) normalized kinetic energy of particles Ek/Ek,0 vs. diametral deformation.
Materials 13 00932 g011
Figure 12. Effects of the compaction pressure on (a) the bond cross-sectional area Ab, as well as (b) the coordination number CN and the bond coordination number BCN.
Materials 13 00932 g012
Figure 13. Experimental and DEM-simulated relationships: (a) tension stress σ1 vs. deformation ΔL/D; (b) tensile strength σf vs. compaction pressure. The bars indicate the standard deviation.
Materials 13 00932 g013
Figure 14. Scheme of simulation variants.
Materials 13 00932 g014
Figure 15. Change of normalized tensile strength Δ σ f ( Δ A e ) / Δ σ f ( Δ A e , max ) vs. change of the normalized effective bond cross-sectional area Δ A e / Δ A e , max .
Materials 13 00932 g015
Table 1. Discrete element method (DEM) simulations parameters.
ParameterSymbolValue
Container
Radius (mm)R1.25
Height (mm)H12
Solid density (kg m−3)ρ7800
Young’s modulus (MPa)E1.561 × 106
Poisson’s ratioν0.3
Particles
Particles number 120,000
Mean particle radius (μm)r20
Standard deviatio of particle radius (μm)rsd7.5
Particle radius range (μm) 5–36
Particle solid density (kg m−3)ρ1540
Young’s modulus (MPa)E2.5 × 103
Poisson’s ratioν0.25
Yield strength (MPa)py3 × 102
Mean loading (plastic) stiffness (N m−1)k13 × 104
Mean unloading (elastic) stiffness (N m−1)k21.2 × 105
Mean adhesion stiffness (N m−1)kc300
Restitution coefficiente0.5
Particle–particle friction coefficientμp-p0.5
Particle–wall friction coefficientμp-w0.1
Rolling friction coefficientmr0.01
Bond radius (μm)rb1–8.2
Bond tension strength (MPa)σc2–70
Bond shear strength (MPa)τc1–40
Bond Young’s modulus (MPa)Eb20–2500

