1. Introduction
Acoustic emission (AE) monitoring is a very promising method for the evaluation of the condition of an existing structure. The advancements in electronics and the relatively easy application, combined with the sensitivity of the technique render it one of the most encouraging technologies for damage assessment. In the field of structural materials monitoring, elastic waves recorded after fracture propagation events are used among others for damage localization [
1,
2,
3], evaluation of structural integrity based on specific indices [
4,
5,
6], corrosion monitoring [
7,
8], as well as characterization of the fracture mode [
9,
10,
11,
12]. It has been well demonstrated that tensile and shear or mixed mode cracks can be differentiated by the wave frequency content and the duration (or other waveform parameters) [
13,
14,
15], see also
Figure 1a,b. In the field of composites for construction, which are the continuously advancing, more sustainable, lightweight alternative of concrete, and specifically for thin plate TRCs (textile-reinforced cements), acoustic monitoring is imperative, since the TRC is not transparent making visual inspection of the plate itself and the underlying substrate impossible. AE has recently shown the ability to characterize the fracture mode (cracking, debonding of successive textile layers from the cement or detachment from the concrete substrate) [
16,
17]. Furthermore, AE proved sensitive to the type of strains that will eventually lead to a specific damage process, allowing the prediction of the dominant fracture mode [
18,
19]. Therefore, in laboratory settings and mainly beam geometries, AE has demonstrated high capacity in characterization, which is extremely useful in material development studies. Fracture mode classification is attempted mainly based on two waveform parameters, average frequency (AF) and RA or rise time (RT). AF is the number of threshold crossings over the waveform duration (DUR), RT is the delay between the first threshold crossing and the peak amplitude, A, and RA is the ratio between RT and the amplitude. According to the recommendations [
6], the low frequency and higher RA or RT represent the mixed or shear mode events, while higher frequency and shorter signals (lower RT) represent tensile cracking (see
Figure 1b). It is always highlighted that the importance is in the relative difference or shift between the populations, not in the absolute separation that always depends on the experimental conditions, like sensor’s sensitivity, propagation distance, material properties, etc. This shift is present during the fracture evolution in a TRC beam, as has been demonstrated several times recently [
16,
17,
18,
19]. Practically, when the mode shifts from cement cracking to delaminations, the frequency decreases by approximately 50% and RT increases by an even more significant proportion [
18].
However, in larger scale, several shortcomings do not allow the accurate interpretation of AE results allowing only the utilization of the basic features, like the cumulative AE numbers and source localization. Frequency content and waveform shape are severely distorted especially in heterogeneous media because of scattering, damping, reflections, as well as wave dispersion (when dealing with plate geometries) [
20,
21]. In that case separation between the “symmetric” and “antisymmetric” wave modes occurs as the first (S0) propagates with higher speed than the latter (A0). Therefore, the shift illustrated in
Figure 1b, may be a result of the propagation conditions that mask the characteristics of the source. Indeed, the propagation distance has been shown to be a crucial factor influencing the classification [
14,
22,
23] because of the more effective attenuation of the higher frequencies as well as the “spreading” of the waveforms in the time domain. Apart from experimental AE studies, there are several numerical works on the subject of wave propagation in plates, some examples are shown in [
24,
25,
26]. The effect in the final signal acquisition, as acknowledged in these studies, is quite severe masking the initial characteristics of the AE source. In addition, a secondary effect, especially in plates, where the wave propagation is parallel to the plate and the sensor contact plane, comes from aperture effects or the interaction between the wavelength and the sensor’s diameter that starts to become important [
27,
28,
29,
30], since the concept of point receiver is no longer valid. Therefore, in general, the upgrade from laboratory coupons to realistic geometries needs further investigation as the same classification between AE signals from different fracture modes, as examined in small coupons, may not apply for larger scale.
However, it is not only the wave propagation distance relevant to the final application. Reinforcement can be applied in the form of narrow strips (typically carbon fibre composites, CFRP) as well as wider plates (TRC) [
17]. Therefore, the effect of the vertical dimension (width) of the plates is also important as highlighted in the past [
31,
32] for homogeneous specimens and evaluated for the first time for TRC materials herein. The present paper aims to examine the influence of the different dimensions (width and thickness) of the plate on the AE signals. When the width of the plate is small, the geometry is closer to a beam and the wave propagation is essentially one-dimensional leading to strong waveguide behavior without allowing spreading of the beam. For larger widths though, the propagation travels in a circular wave front, the energy is spread to a larger area of the plate, and wave travels longer until it is possibly reflected at the edges.
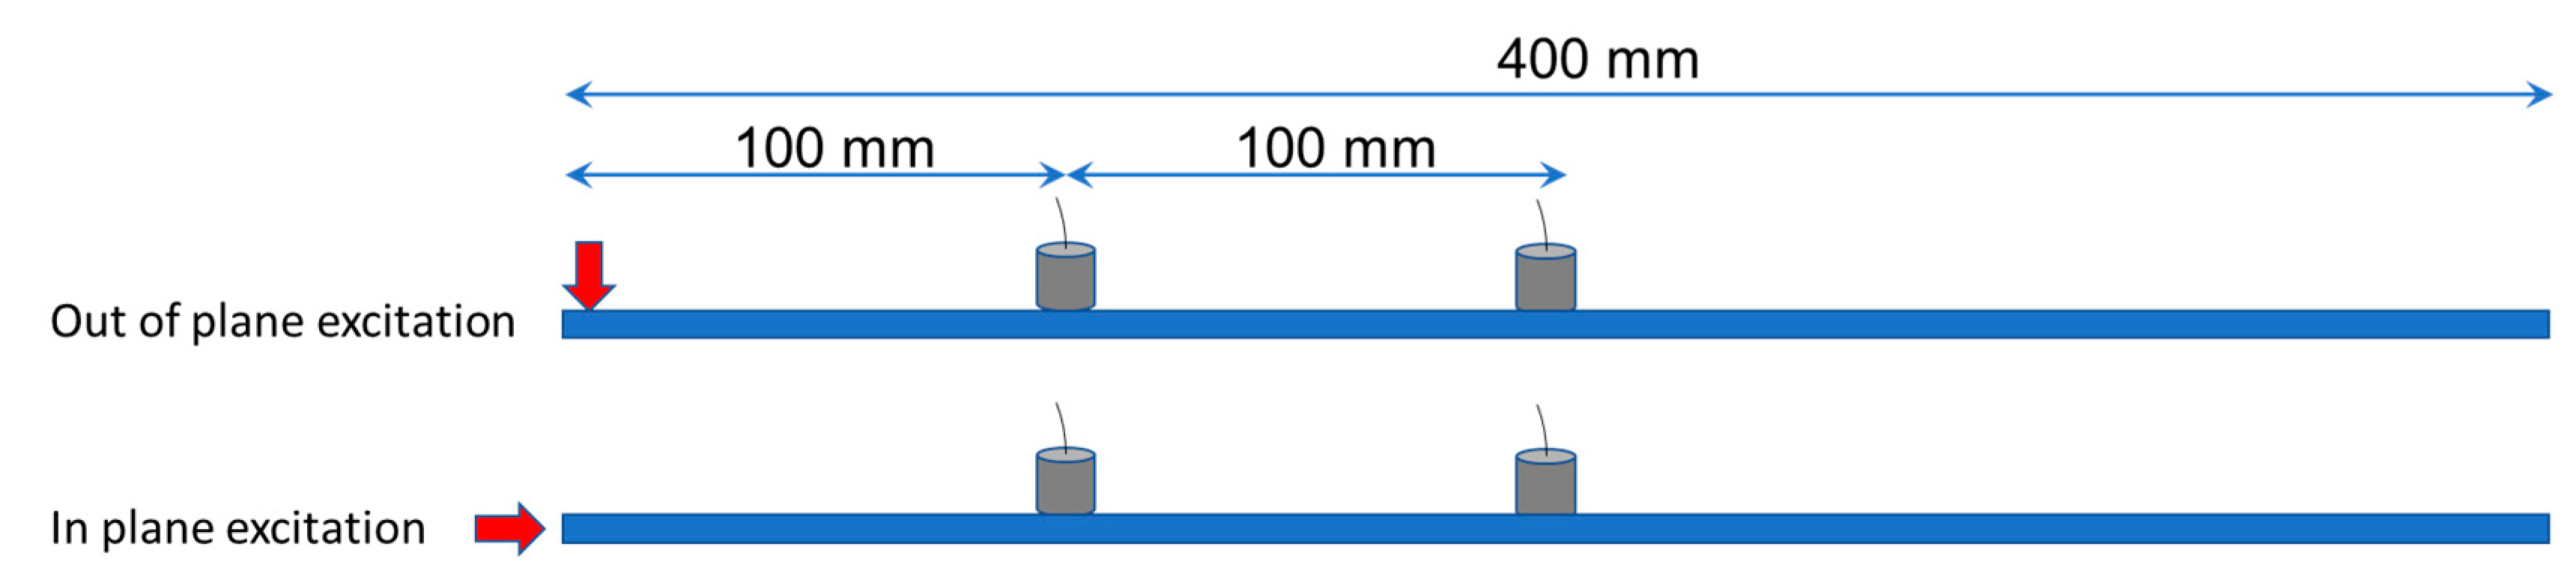
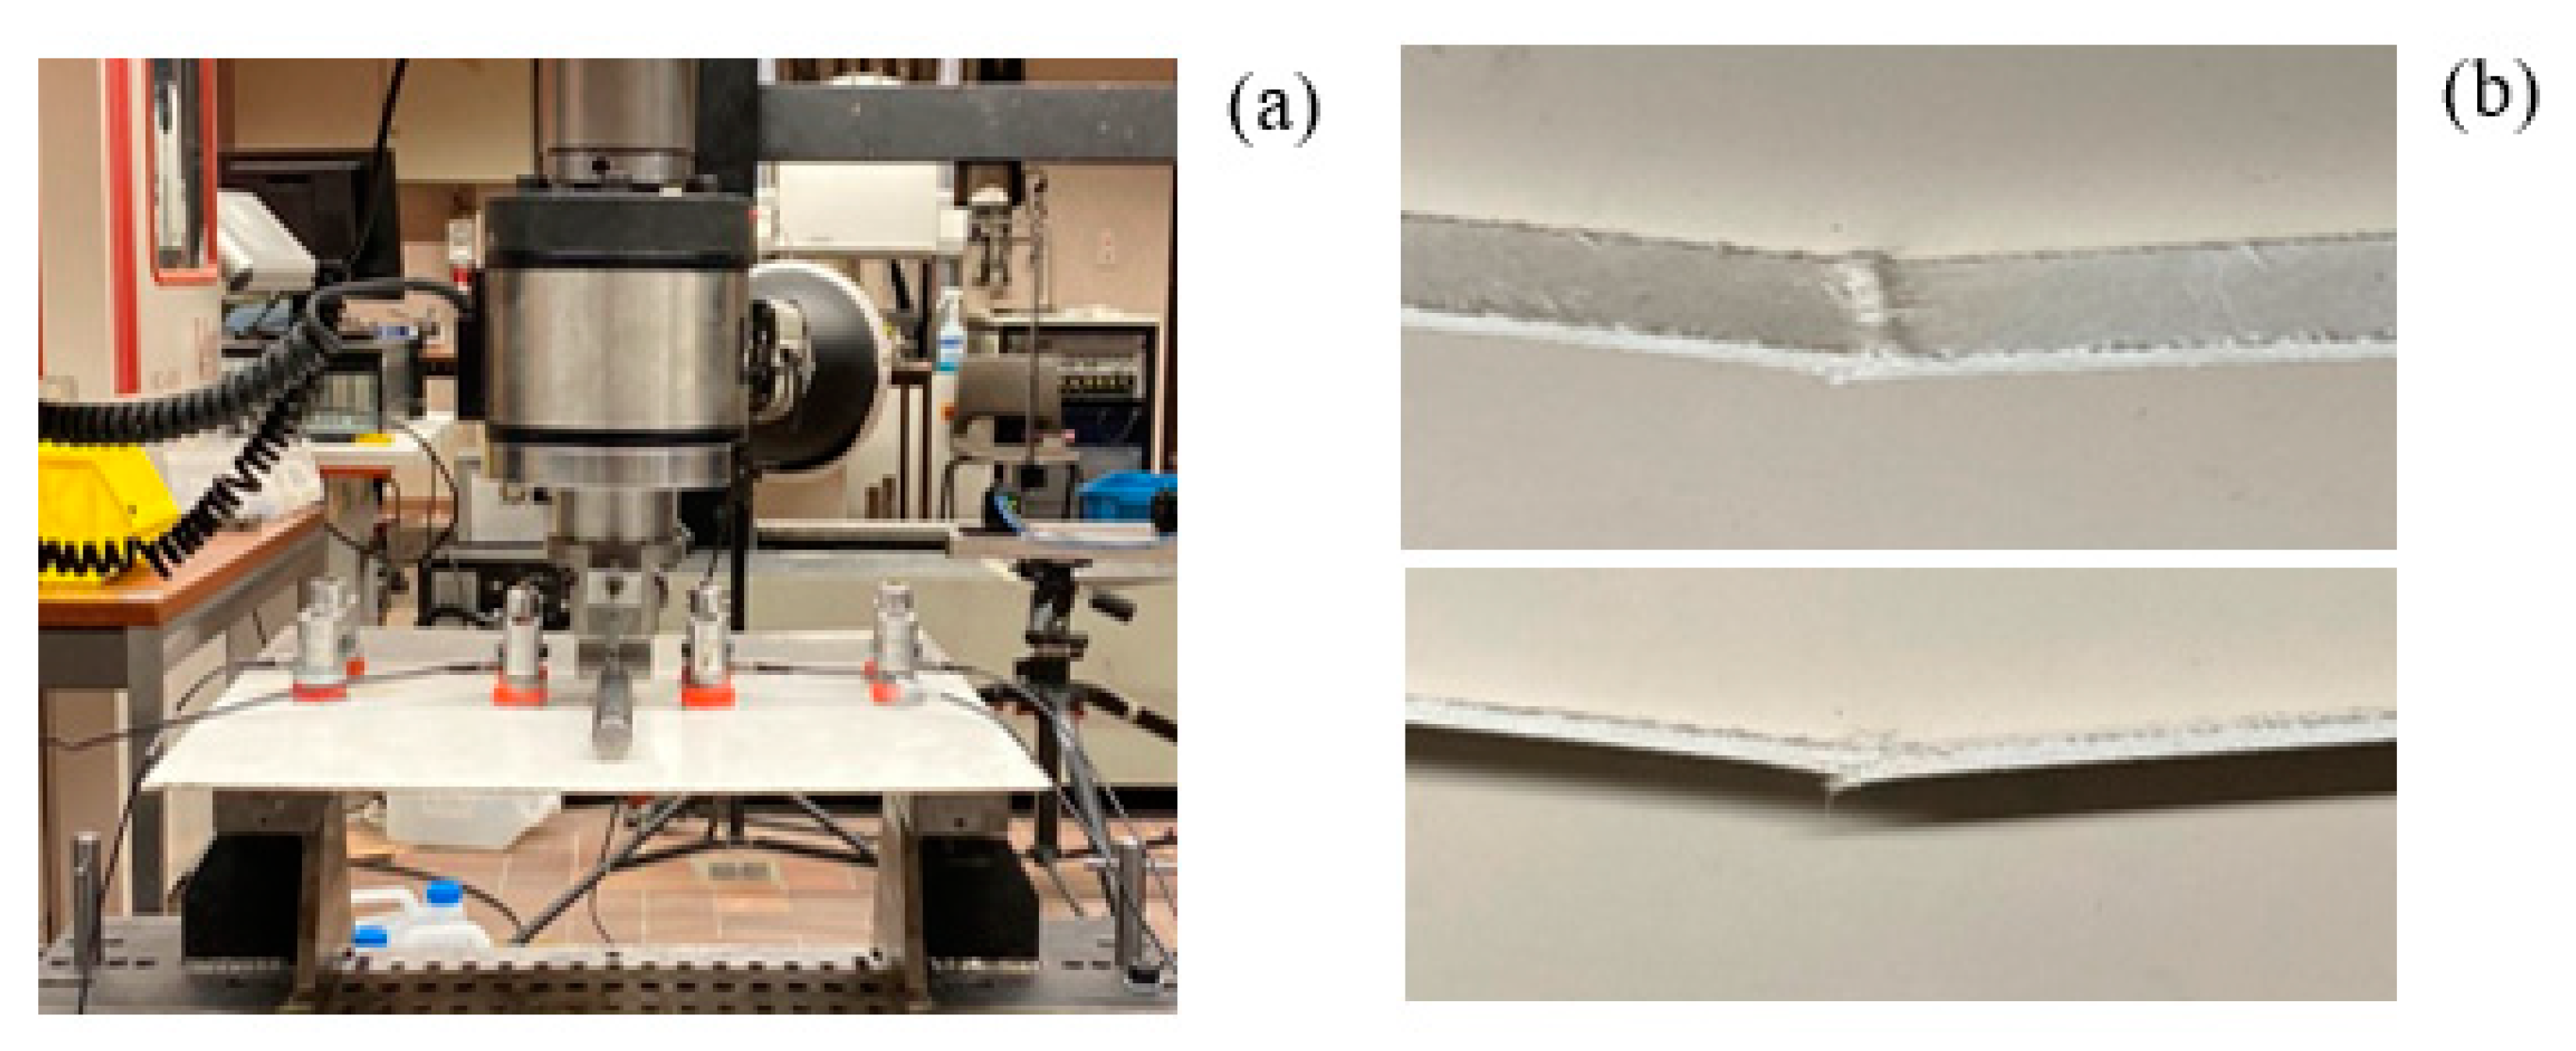
In order to study the effect of the geometry in a controlled way, first wave measurements were conducted in plate and beam geometries using artificial AE (pencil lead excitation). Despite that the excitations are applied on the external surface of the sample and are not “buried” as would be an actual internal crack, they offer a means of studying the general phenomenon of propagation and the influence of the geometry. Then, mechanical bending tests of the same specimens took place with concurrent AE monitoring. In this case the excitation was given by the actual fracture events from the start of loading until the failure of the composite. Results show that considerable differences arise between beams and plates, not allowing generalization of the outcome from laboratory specimens to realistic sizes without proper attention.
3. Results from Artificial Excitation
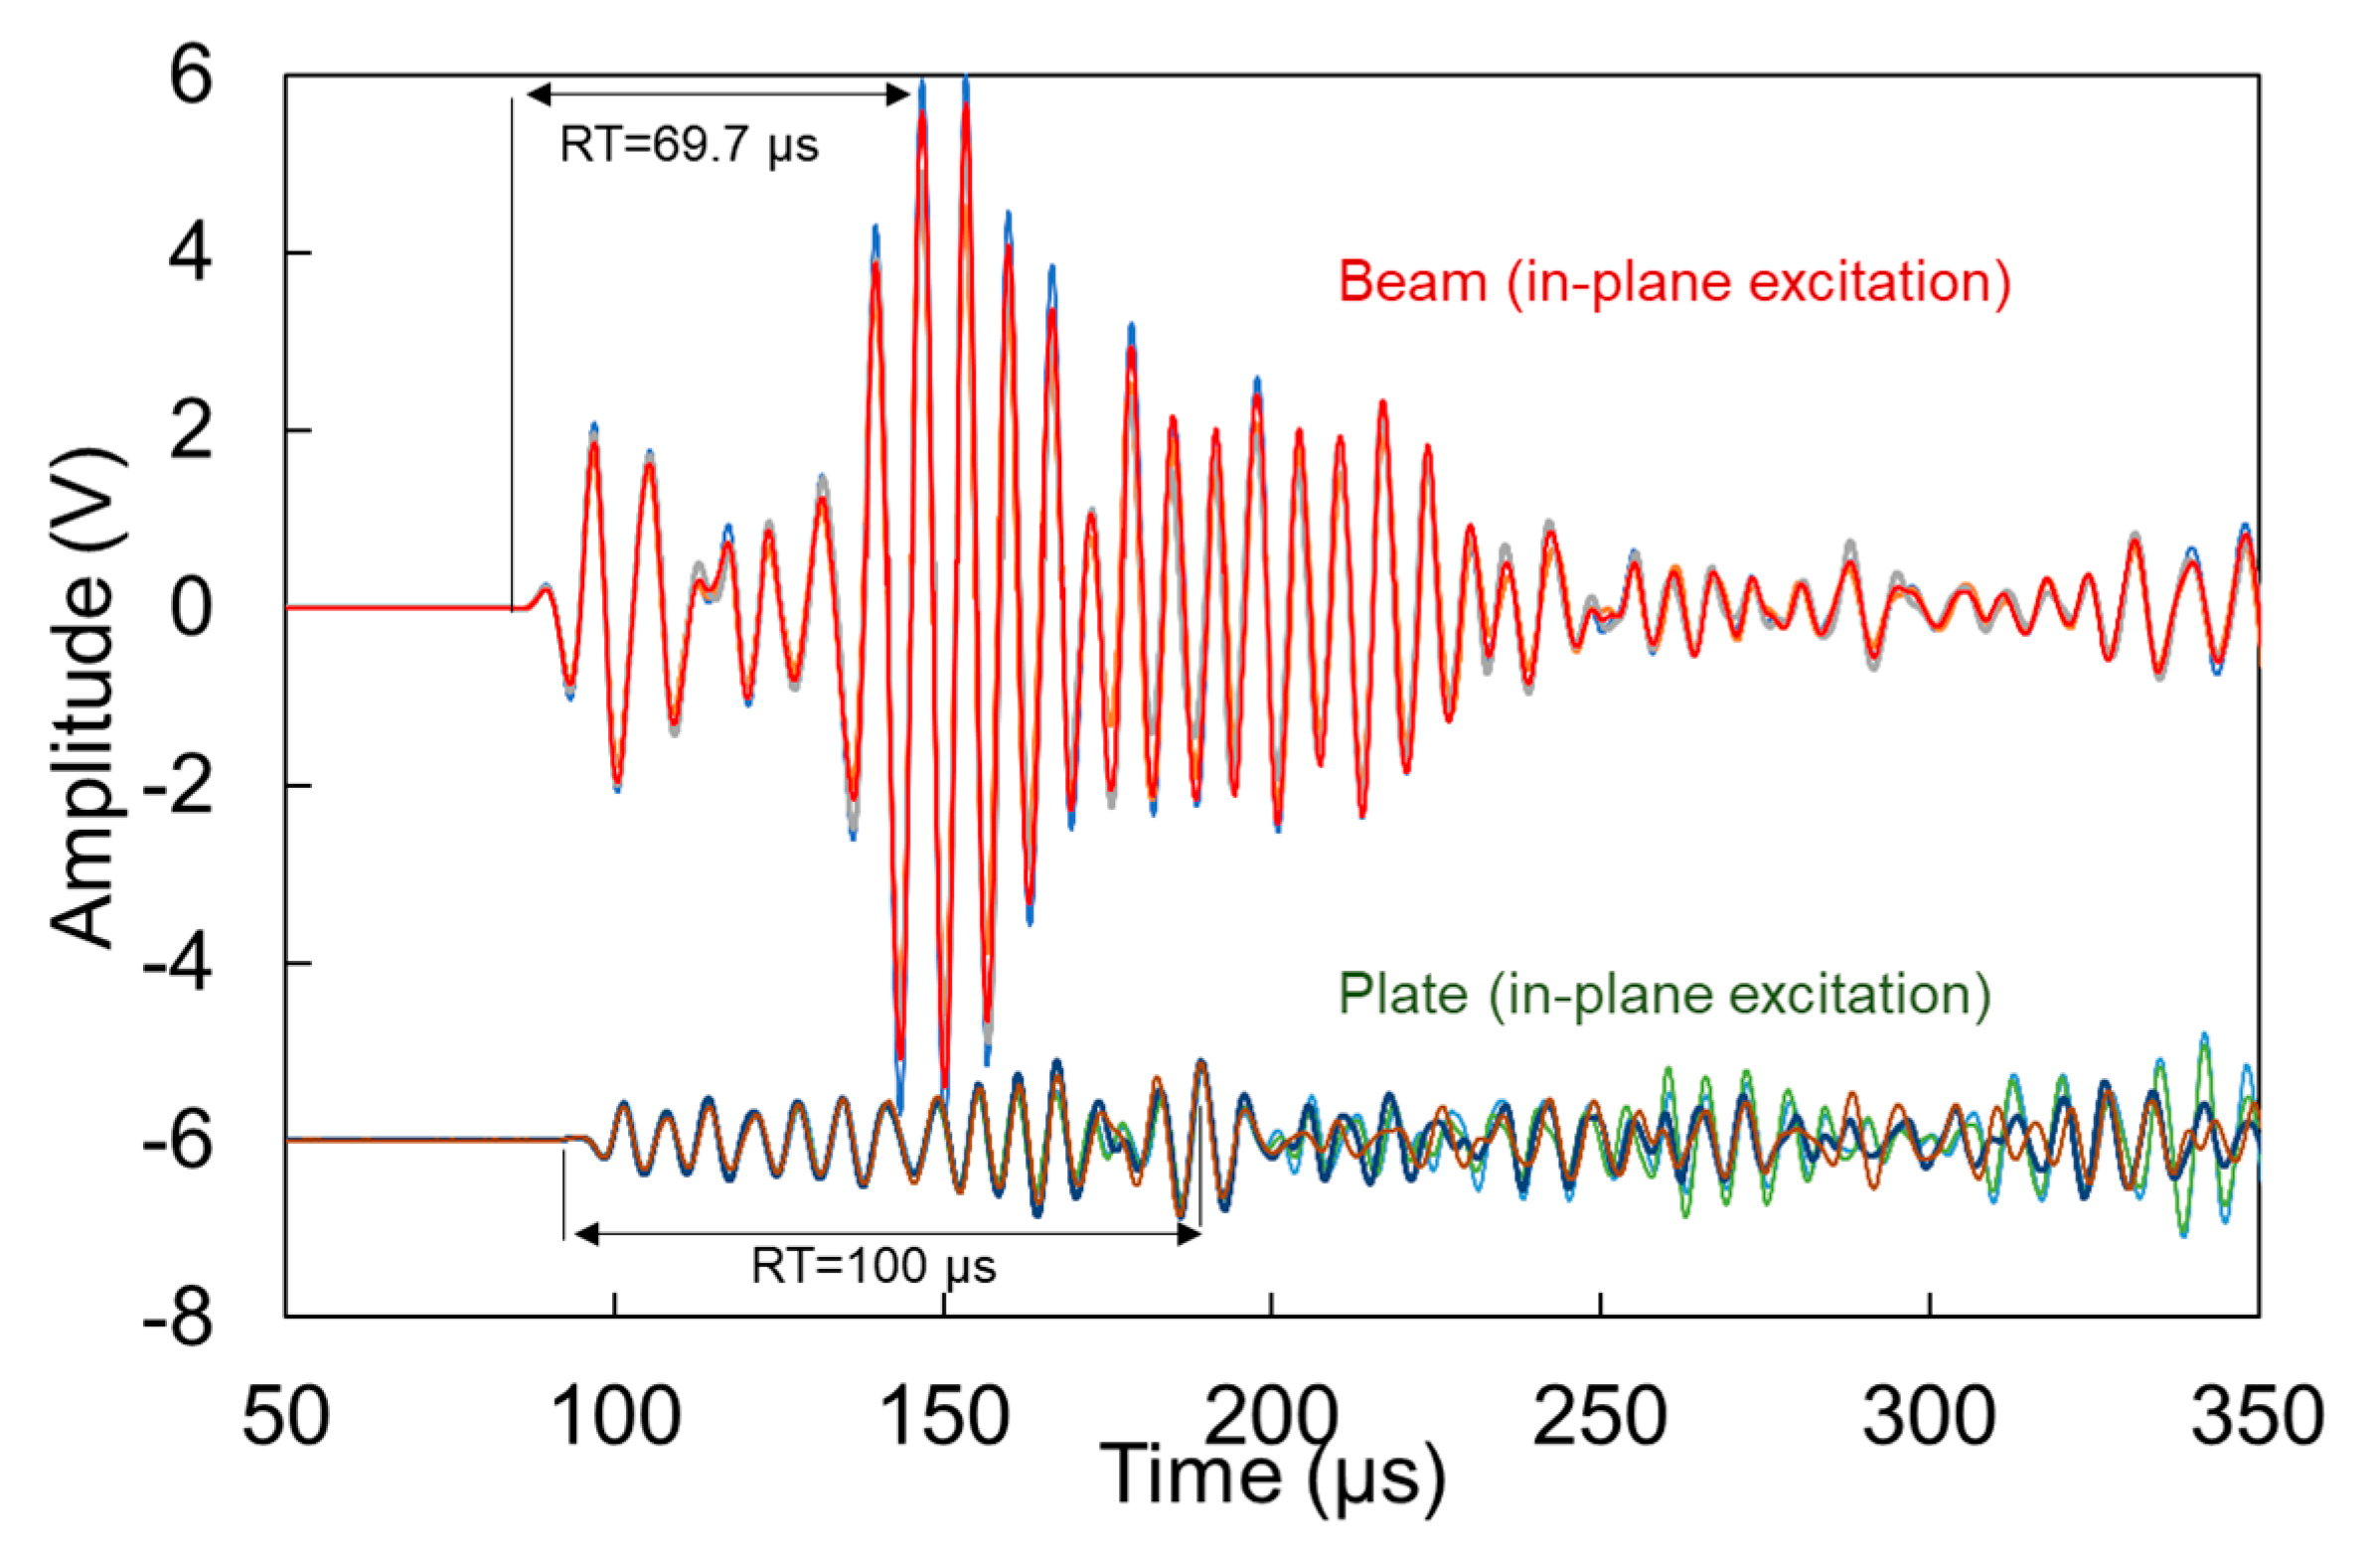
Figure 6 shows typical waveforms after pencil lead break on the side of the beam (or plate) simulating a matrix crack (in-plane excitation), as received by the furthest (2nd) sensor. Waveforms from four individual excitations are included to show the repeatability of the test. The energy is quite strong as evidenced by the relatively large amplitudes. Specifically, and despite the 200 mm long propagation, the amplitude on the beam reaches 6 V, corresponding to 95 dB in the system. For reference, it can be said that the 1st sensor at 100 mm recorded a saturated waveform at 10 V (not presented), which is the limit of the acquisition board. In the response of the 2nd sensor shown on top of
Figure 6, a weak separation of modes is formed, with the first burst at 100 μs and the second peaking at 150 μs. The corresponding sensor on the plate geometry shows a much lower amplitude (bottom of
Figure 6) because of the spreading of the wave front which is essentially restrained in the beam geometry. Additionally, its peak comes clearly later reaching a RT of 100 μs, longer compared to the RT of the corresponding signal on the beam (69.7 μs).
The waveforms for the out-of-plane excitation, are shown in
Figure 7. This excitation implies that the dominant mode is the “antisymmetric” A0, which is arguably slower than the symmetric (S0) [
10], as will also be demonstrated below. Therefore, reasonably the main content of the waveforms arrives later, resulting in longer RT values than the corresponding cases of
Figure 6. Again, as the wave in plates spreads in two dimensions, it is reasonable to expect lower amplitude for the plate than the beam. In addition, the strongest burst of energy arrives later in the plate geometry than the beam. This influences the RT of the waveforms with the plate RT being 40% longer, while the amplitude is approximately half. This is attributed to the aforementioned spreading of the energy on the plate geometry, as well as the possible absence of reflections from the edges, that are bound to influence the beam in a stronger way.
Figure 8 demonstrates the calculated indicative dispersion curves for both thicknesses and material with longitudinal and shear wave velocities 3000 m/s and 1550 m/s respectively. The results show that for the frequency of interest (sensors resonant at 150 kHz) the S0 mode for both cases is expected much faster than the A0, with phase velocities of approximately 2600 m/s and 1100 m/s respectively. This is also in accordance with the experimental observation that most of the content of the waveform from in-plane excitation arrives earlier than the out-of-plane, which can be seen by the shorter RT values in
Figure 6 than the RT values of
Figure 7. Differences related to the thickness are much smaller and specifically for the S0 the difference is less than 40 m/s and thus may not have a certain effect on the onset of the waveforms. The difference is a little higher for the A0 mode, where the thick laminate exhibits 170 m/s higher velocity than the thin one, something that could contribute to the shorter RT exhibited by the beams compared to the plates and seen in
Figure 6 and
Figure 7. It should be highlighted that these dispersion curves are theoretical and that in practice both wave modes are present; therefore, strong differences in the onset of the waveforms are not seen because of the S0 arrival in both cases with more or less the same velocity. Differences are more pronounced in the amplitude axis, where the in-place excitation results in much higher S0 burst than the out-of-plane one.
Table 1 summarizes some basic descriptors of the waveforms. Comparisons can be made between beam and plate geometries, as well as in- and out-of-plane excitations. For both types of excitation, the plate consistently exhibits longer RT by about 40 to 50% than the beam. In addition, it exhibits lower amplitude(Amp) by several dB, a difference that is more pronounced in the in-plane excitation. Frequency indicators are discussed in more detail in the next section along with Fast Fourier Transformation (FFT) analyses of the waveforms but in any case, the peak frequency (or the frequency with the higher magnitude, PF) is slightly higher for the beam.
Moving to the comparison between the different excitations for the same geometry, the in-plane one (simulating vertical crack) shows shorter RT, something reasonable as this orientation of excitation would excite mostly the S0 mode which is faster compared to the A0 excited by a delamination. This is also validated by several AE studies, characterizing cracks and delaminations on composites [
33,
34], and also mentioned in studies on TRCs [
16,
18].
The differences in the waveform shape and parameters are quite strong and would definitely influence any characterization approach. It is evident that a typical waveform after a matrix crack on a beam has little similarity to a corresponding waveform in a plate, something obvious even by visually comparing the top and bottom waveforms of
Figure 6 and
Figure 7.
It is interesting to discuss these results in the light of an older numerical study, which interprets the higher amplitude on an aluminum beam as an effect of the immediate reflections, which are not present in the case of a plate of the same material [
31]. These reflections, according to [
31], are responsible for the higher amplitude, duration, and energy for the narrow coupon relatively to the larger field-sized sample. In addition, it is also mentioned in this study that the frequency is “distorted” in the narrow sample because of the edge reflections, without however explicitly discussing a shift to higher or lower frequencies for one or the other case. The lower amplitude detected in plates may reduce the possibility to capture a fracture signal in a plate, or underestimate the importance of a weak signal, while in a beam, having this “magnification” effect due to the reflections, signals are more easily recorded. This interpretation is perfectly compatible with the one made above about the differences between higher energy in the beam because of the 1D propagation (waveguide effect in beam) and 2D propagation (plate) with more spreading and thus lower energy content. On the other hand, as also mentioned in [
30], the multiple reflections in beams, distorts the signal, possibly showing lack of consistency because of the multiple interferences.
Concerning the frequency content in the present study, a dramatic change in the bandwidth between beams and plates was not observed (
Figure 9). The waveform of the beam exhibits obviously higher magnitude for both excitations, something consistent with its higher time domain amplitude, but the content lies in the same band as in the plate (essentially 50 to 200 kHz). Still one difference can be seen, concerning the maximum peak (peak frequency, PF), which for the beam is in both cases higher than 150 kHz while for the plate is just below that value, as also seen in
Table 1. In any case, the specific sensors are resonant at 150 kHz and therefore, any difference is reasonably compressed around this value.
4. AE Results and Comparison
The same specimens were mechanically tested in order to assess their AE behavior, when the excitation comes from the actual cracking of the material and not from a simulated source. Apart from the width of the specimens, the three-point-bending experimental setup remained identical between the two specimens to allow comparisons and the evaluation of the width dimension influence.
Since the focus of the paper is not the load-bearing capacity of the materials, load histories are not presented for brevity.
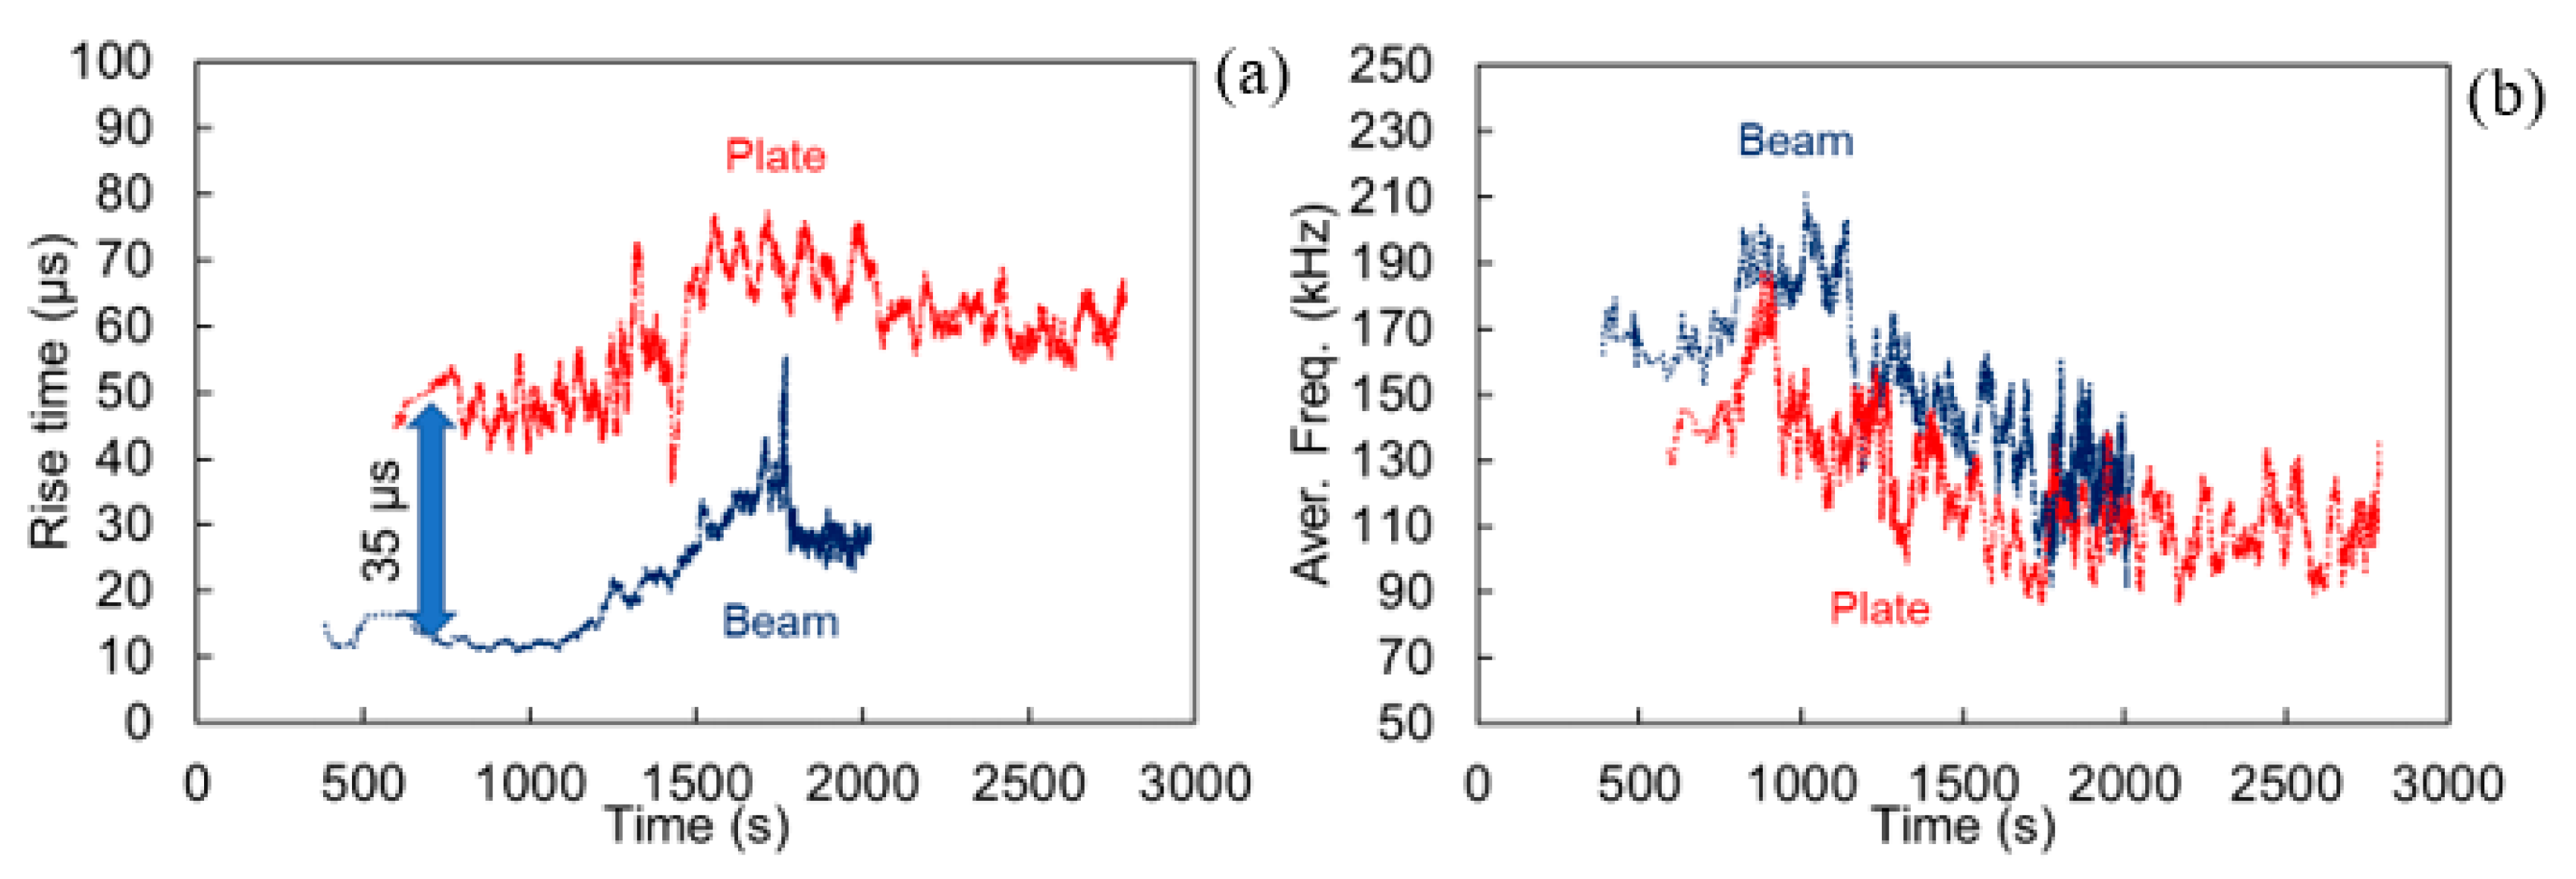
Figure 10a demonstrates the RT as received by the sensor S2 (50 mm from the center) for both the plate and the beam specimen. The data are presented in terms of their sliding average of 200 points. The sliding average is a suitable way to represent AE data in order to show the general trend, compressing the high experimental scatter which is inherent to fracture and therefore, the AE data [
6,
35]. For the beam, RT early values stand at approximately 15 μs, while the plate exhibits a much higher average at approximately 50 μs. These data recorded at the beginning of the test and at low load levels can be safely attributed to matrix cracking in both cases, showing how differently the same type of source is recorded in a beam and a plate specimen. Later, as is normal for this material, RT increases symbolizing the gradual shift to shear events like pull-out and delaminations. Concerning the frequency characteristics, still a difference can be observed in
Figure 10b, but it is much milder, something expected because of the resonant behavior of the sensors. Matrix cracking is exhibited with an average value of 170 kHz on the beam and with approximately 140 kHz on the plate.
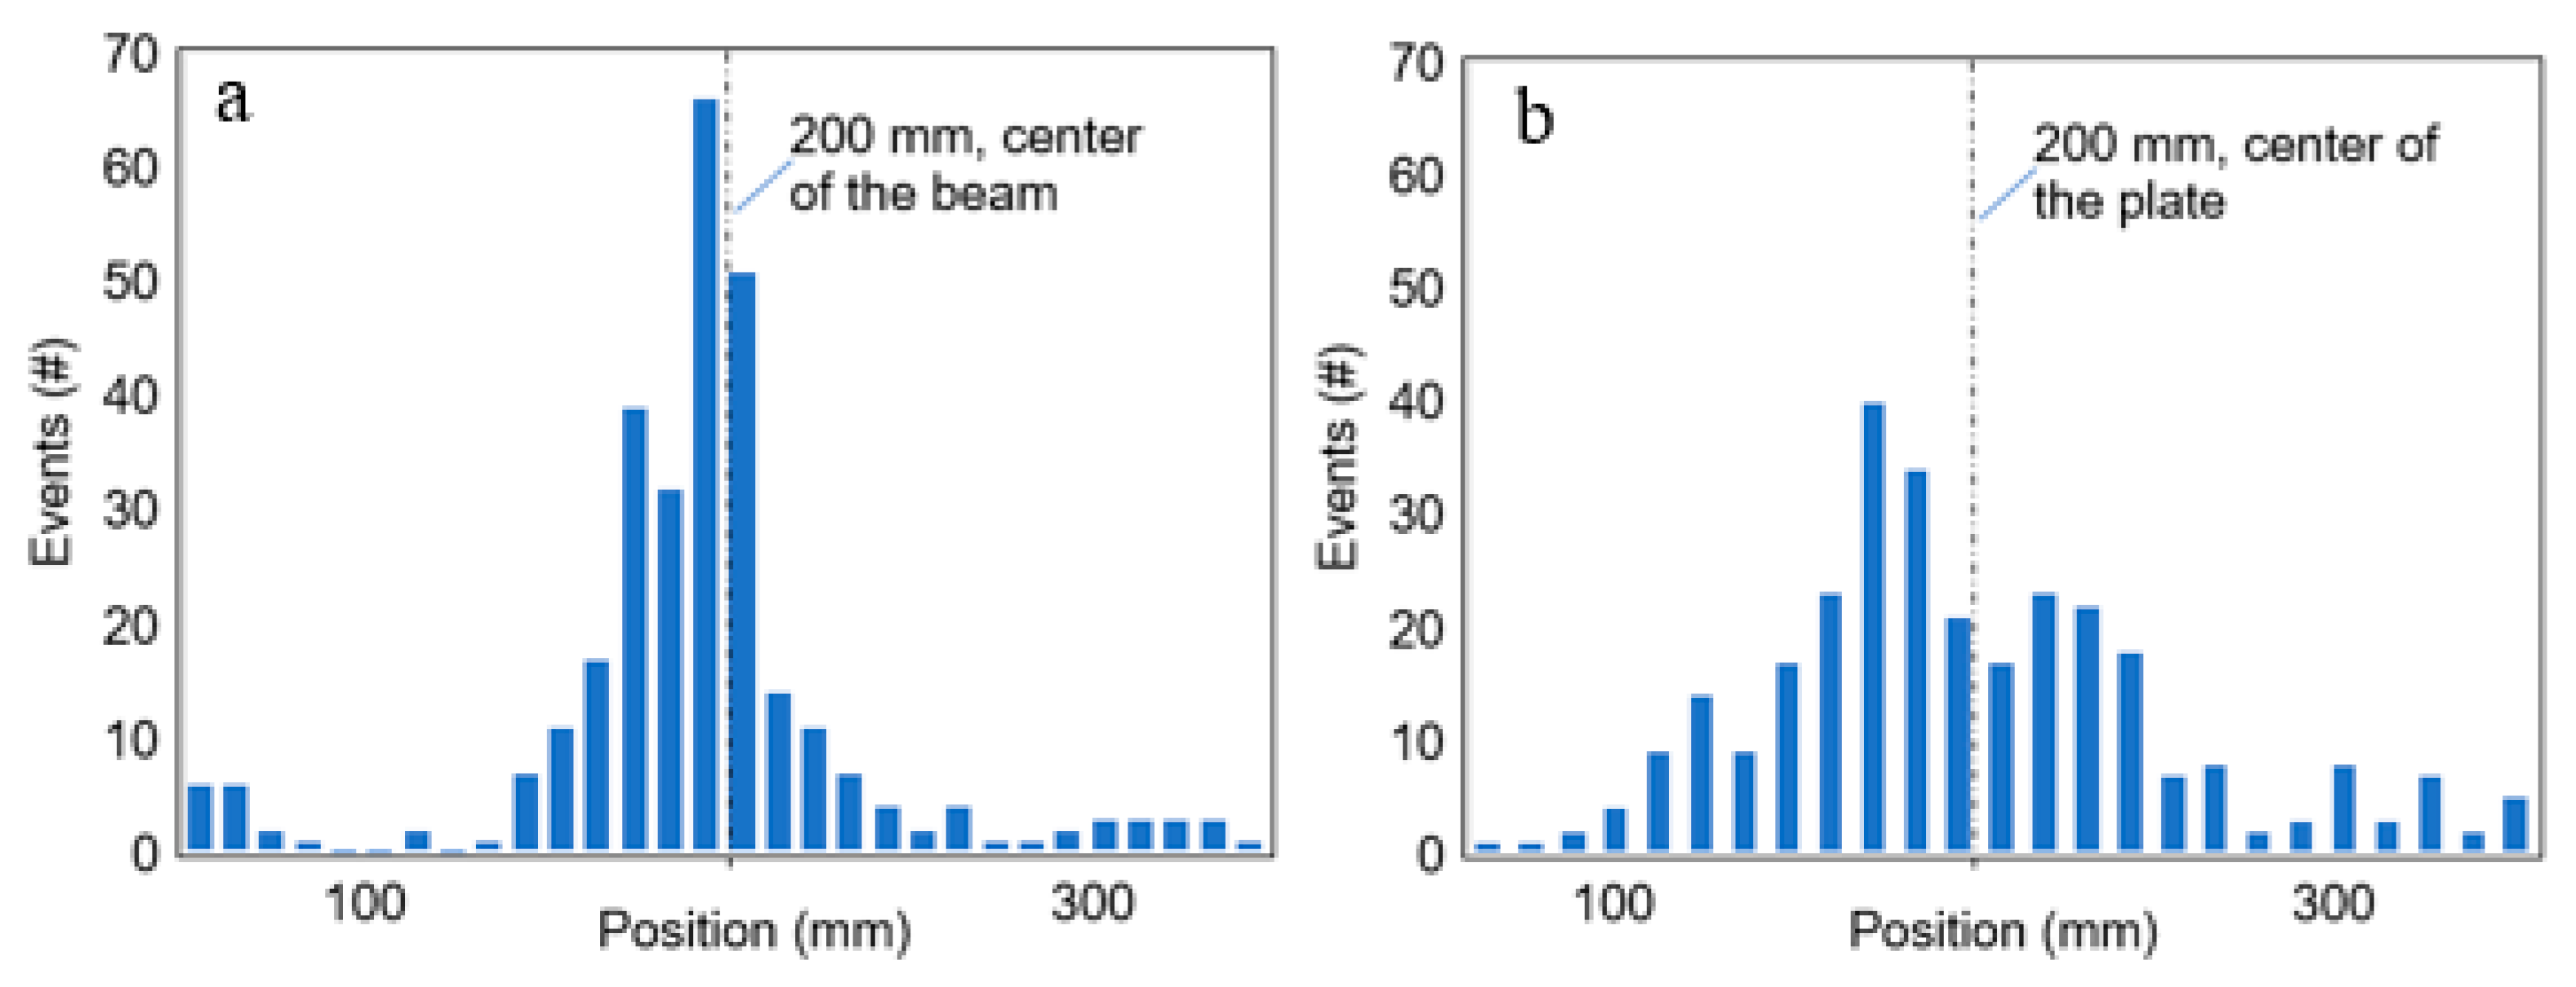
During the test several thousands of AE waveforms were recorded. Selecting and presenting “representative” ones is a challenge but it is always important to manifest the raw information, from which the parameters are calculated. Therefore, five waveforms were selected from the early loading stage of the beam and the plate (within the first 300 recorded events), attributed, therefore, to matrix cracking. They were chosen based on the similarity of their parameters to the average of the class, as shown in
Table 2. These waveforms are depicted in
Figure 11, while
Figure 12 shows the localization results for these 300 first events, confirming that the sources mostly stand at the middle zone of the span, where the bending moment is maximum and the material more prone to cracking.
As seen in the examples of
Figure 11 as well as the average results of
Table 2, most of the trends seen in the earlier section using pencil lead excitation are confirmed. In general, waveforms attributed to matrix cracking are shorter in beams as indicated by the lower RT and duration average values. In addition, they generally possess higher frequency characteristics, as measured by the AF equal to 170 kHz for beams and 143 kHz for plates. The values of initiation frequency (IF, essentially the average frequency of the first part of the waveform until the peak amplitude) show even stronger changes between the two geometries, specifically, 389 kHz for beam and 274 kHz for plate. In general, although usually, AF is used in analyses, it is shown that IF has very strong characterization power as it is calculated by the initial part of the signal, which is less influenced by reverberations of the piezo element, similarly like RT is more usually examined than the whole duration of the waveforms. Since, as aforementioned, shear events are escorted by higher RT, the higher values of RT for the plate compared to the beam could be wrongly interpreted as a manifestation of shear signals while the actual origin is just the difference in the geometry and wave propagation conditions.
Signals from shear are also present in the dataset at later times. However, they are normally overlapping with the cracking ones and therefore, the analysis herein considers only the early part of the data set (first 300 hits) that can safely be attributed to a single fracture type (cracking), while the load was up to 40% of the maximum.
The analysis of the energy-related parameters such as amplitude (dB) or absolute energy (attoJ) deserve a special mention. It is clear from
Table 2 that the plate geometry, exhibits much higher amplitude, posing the only discrepancy between the simulated pencil lead break tests and the actual AE tests. This may initially seem contradictive to the geometric attenuation effect, since it is known that propagation in the plate exhibits stronger spreading of the wave front, as already discussed above. Nevertheless, one should not neglect that in the previously mentioned artificial excitation measurements, the excitation came from exactly the same type and size of the source (pencil lead) and at the same distance. In the actual test however, the length and width during any crack propagation increment cannot be directly controlled. While in a beam the crack length is limited by the beam’s width, there is no such limitation for the case of plate, something that contributes to a stronger release of energy. Therefore, although geometric and recording parameters can be controlled in model tests being identical to a mechanical test, the actual excitation energy may still pose a difference.
The main aim of the paper is to demonstrate that there are significant discrepancies between AE monitoring behaviors depending on the shape of the elements. This is relevant because most of the laboratory tests take place in small coupons, whereas the actual application of the material is in the form of large plates. The deviations are quite large since for example, as shown in
Table 2, the duration of a typical cracking signal in plate (realistic engineering shape) is approximately eight times longer than in a laboratory specimen (beam). Relying only on the results of a laboratory sized sample, the cracking AE waveforms in a large plate would be certainly misinterpreted as delaminations because of their much longer duration, RT, and other characteristics.
The results will have application on TRC skins that are used either as strengthening/repair additional layers or as standalone load bearing members (i.e., façade sandwich panels). Although TRC materials have significant development in their design and mechanical response optimization, the characterization of the fracture behavior is much more complicated than other relatively homogeneous plate elements. Therefore, studies on the fracture and AE behavior of TRCs increase the confidence in the use of this lightweight and thus more sustainable material than traditional concrete.


