Influence of Process Parameters in Graphene Oxide Obtention on the Properties of Mechanically Strong Alginate Nanocomposites


 ,
, 
Abstract
1. Introduction
2. Experimental Section
2.1. Materials and Methods
2.1.1. Oxidation of Graphite
2.1.2. Exfoliation and Size Selection of Graphene Oxide
2.1.3. Preparation of Nanocomposites
2.2. Characterization Techniques
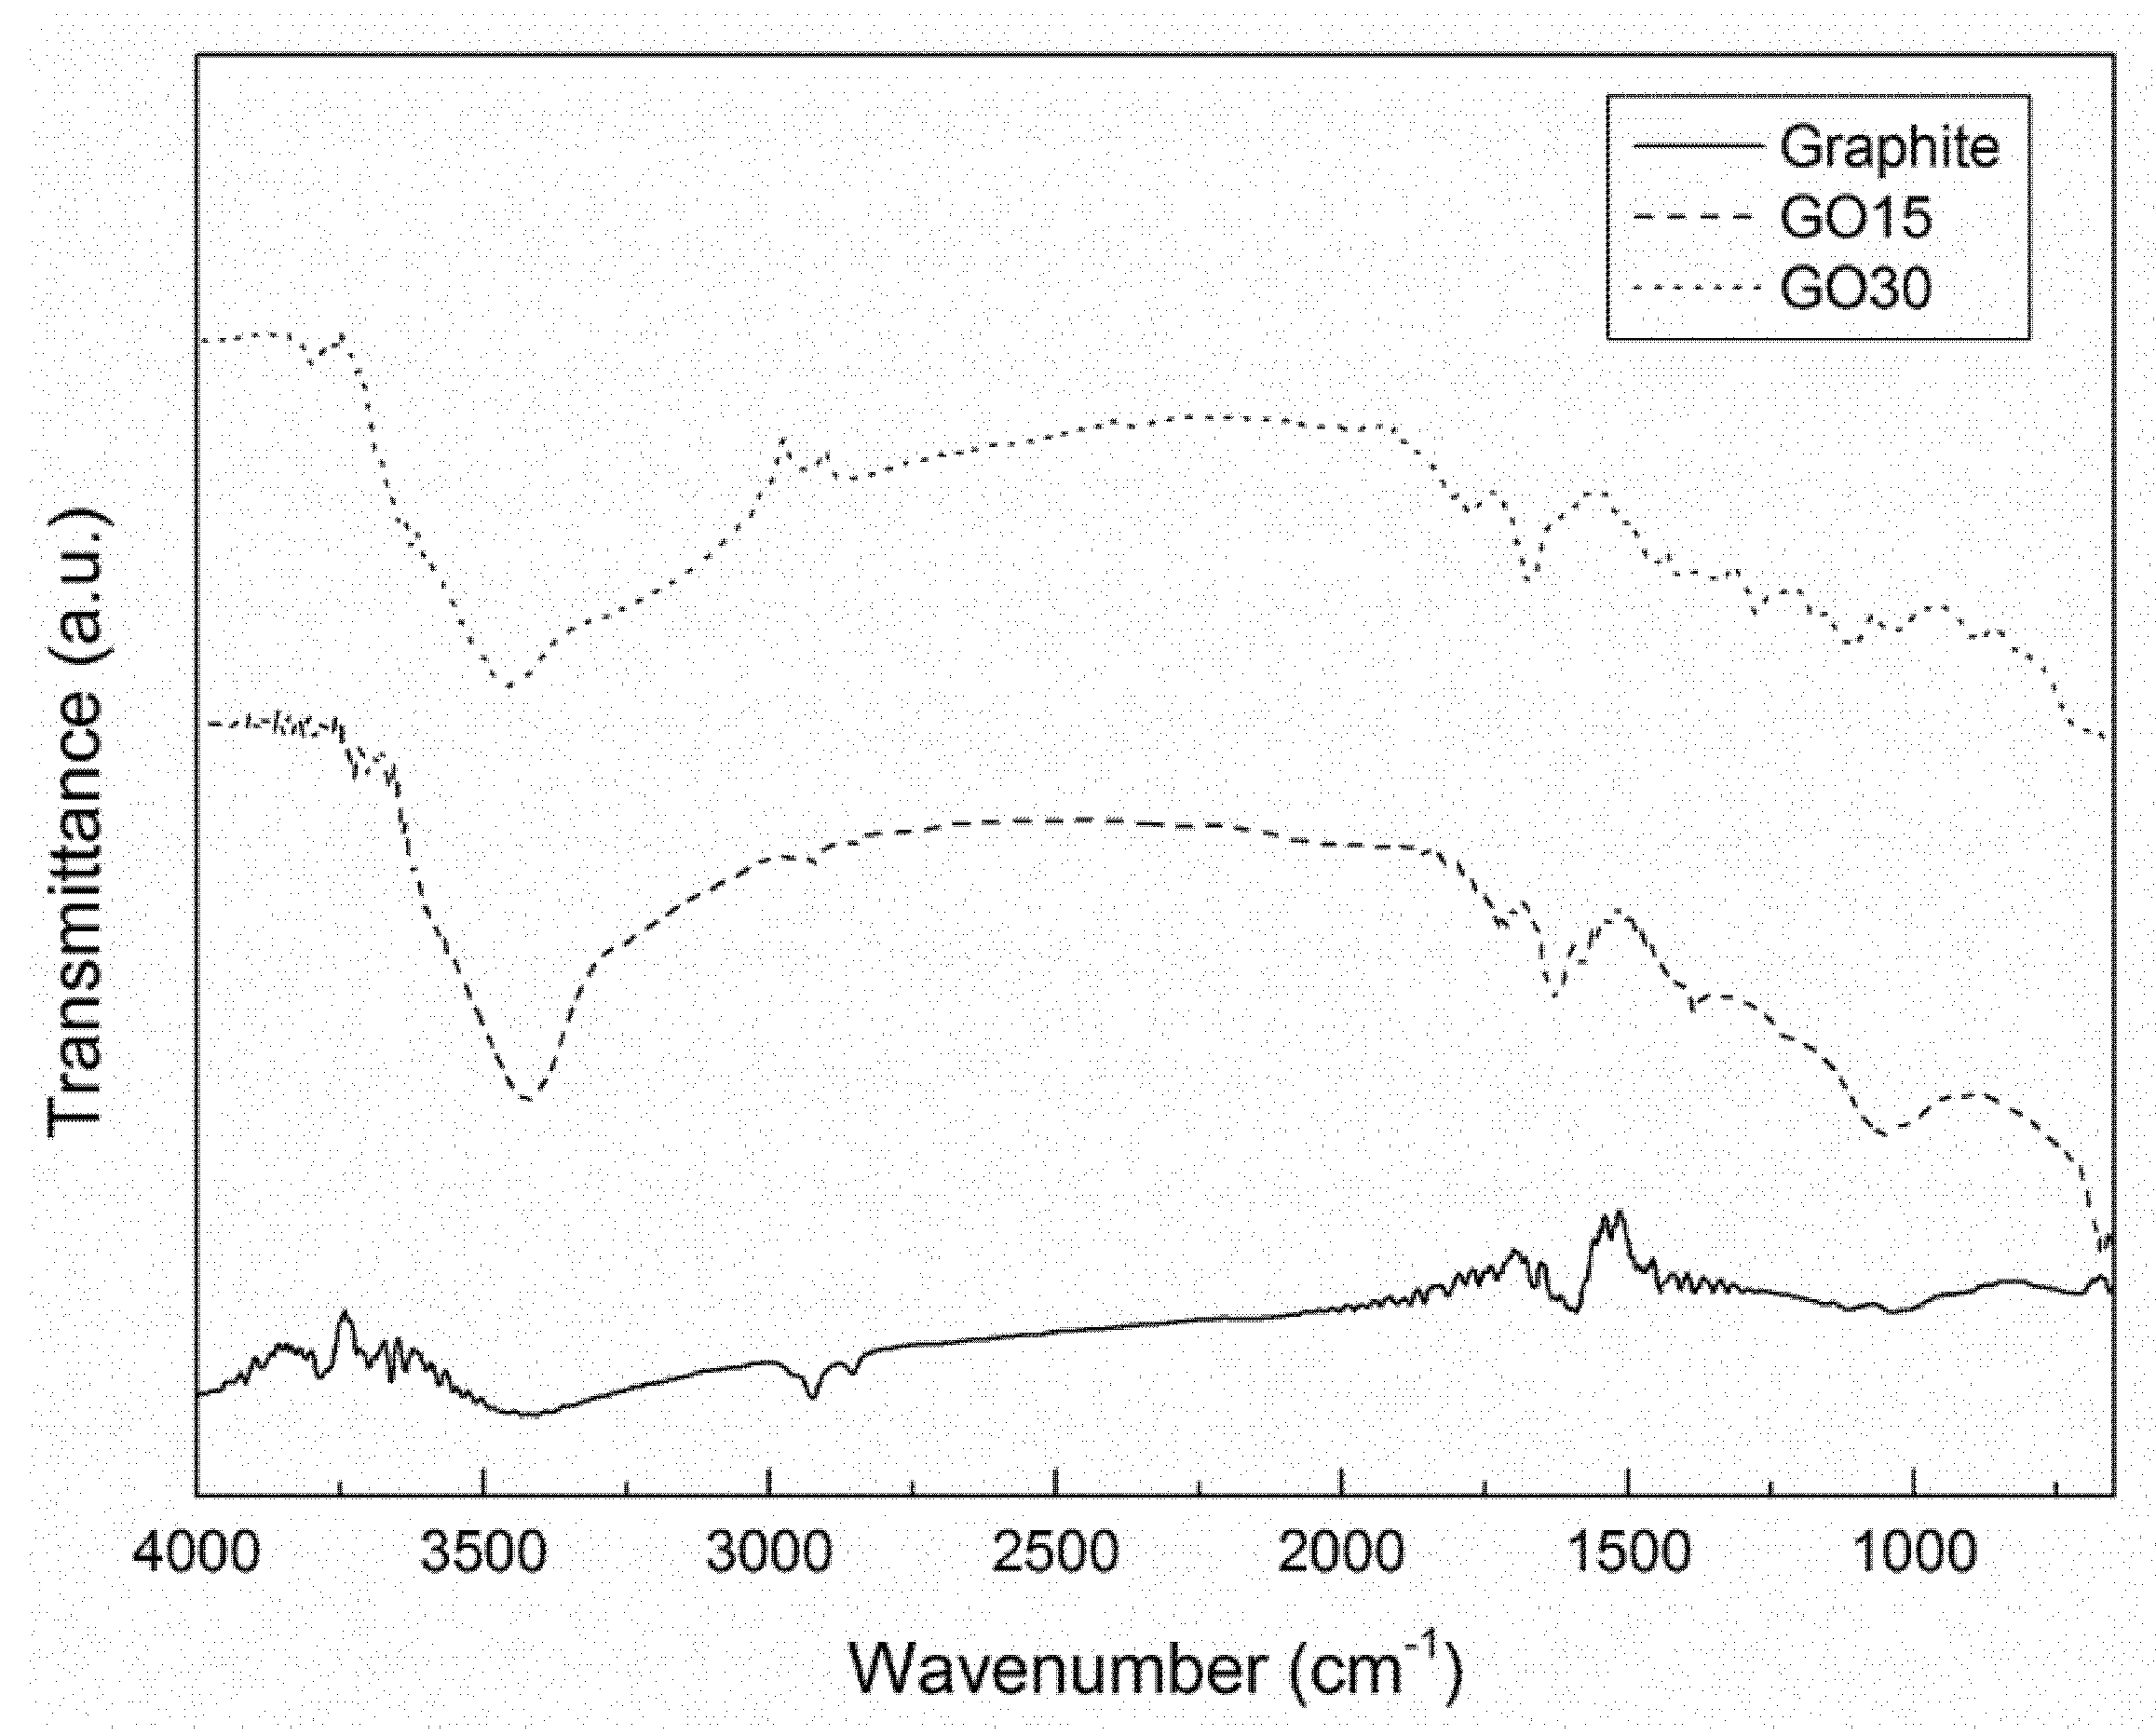
2.2.1. Fourier Transform Infrared Spectroscopy
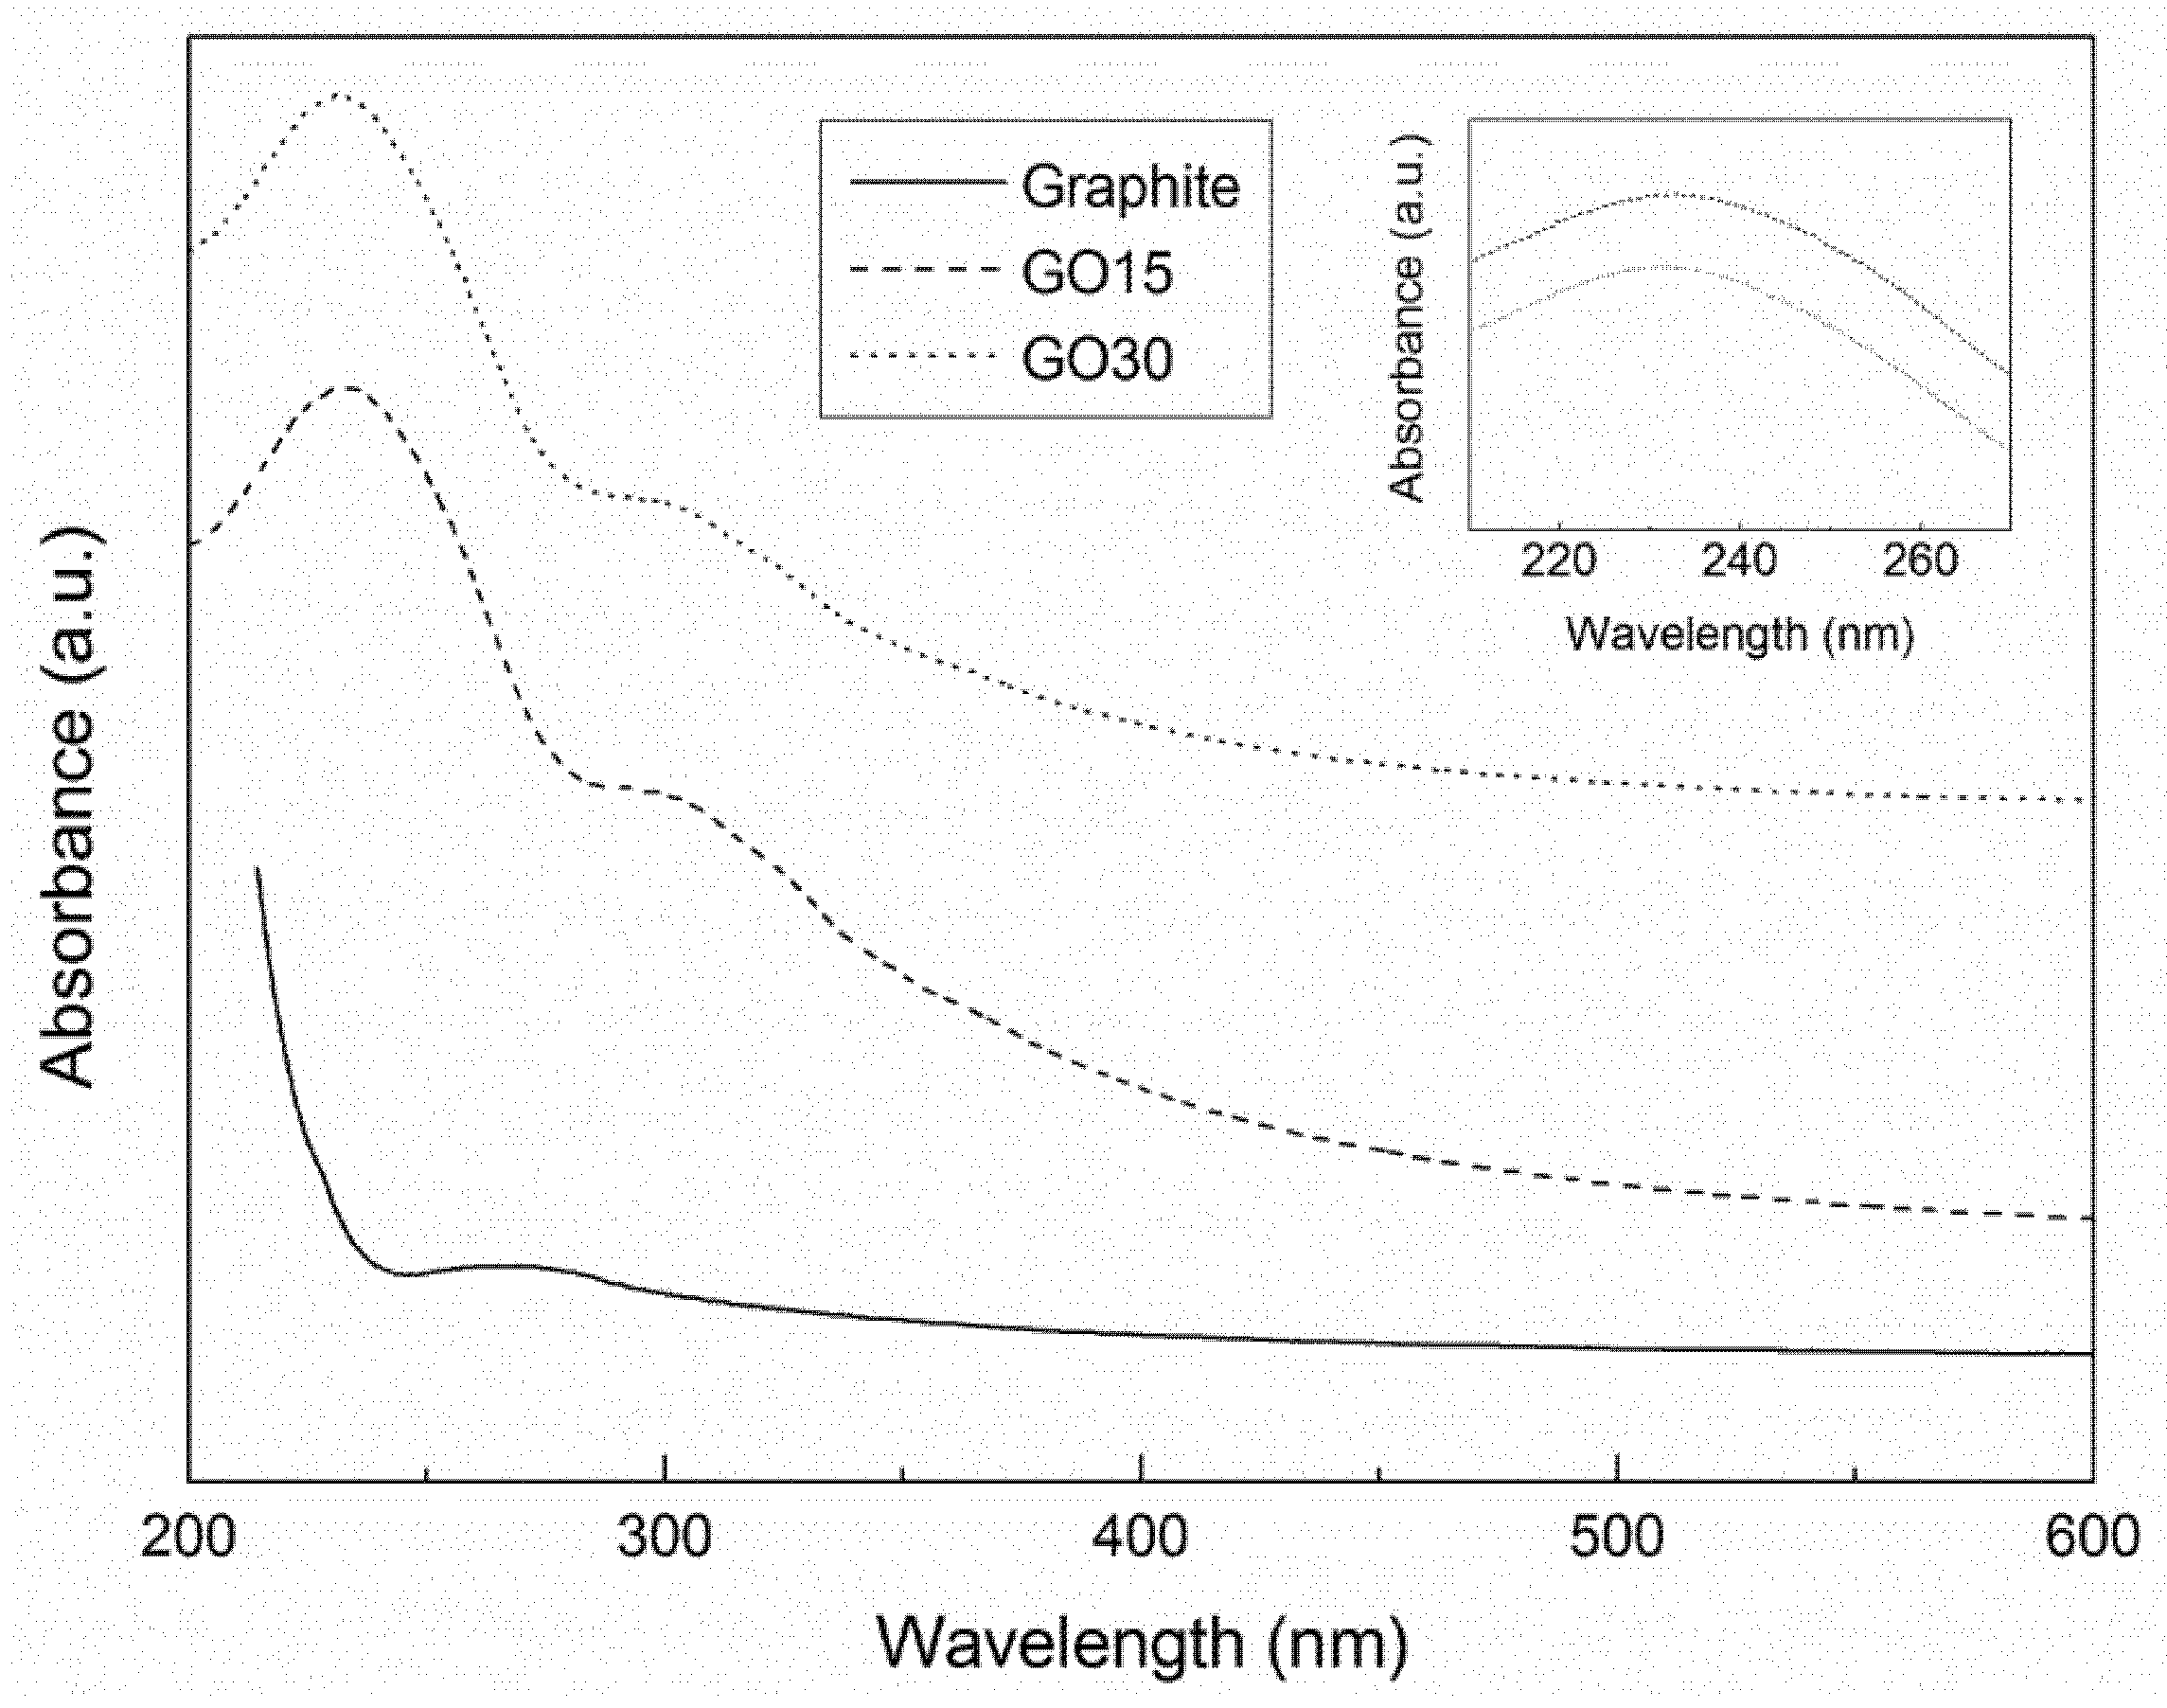
2.2.2. Ultraviolet-Visible Spectrophotometry
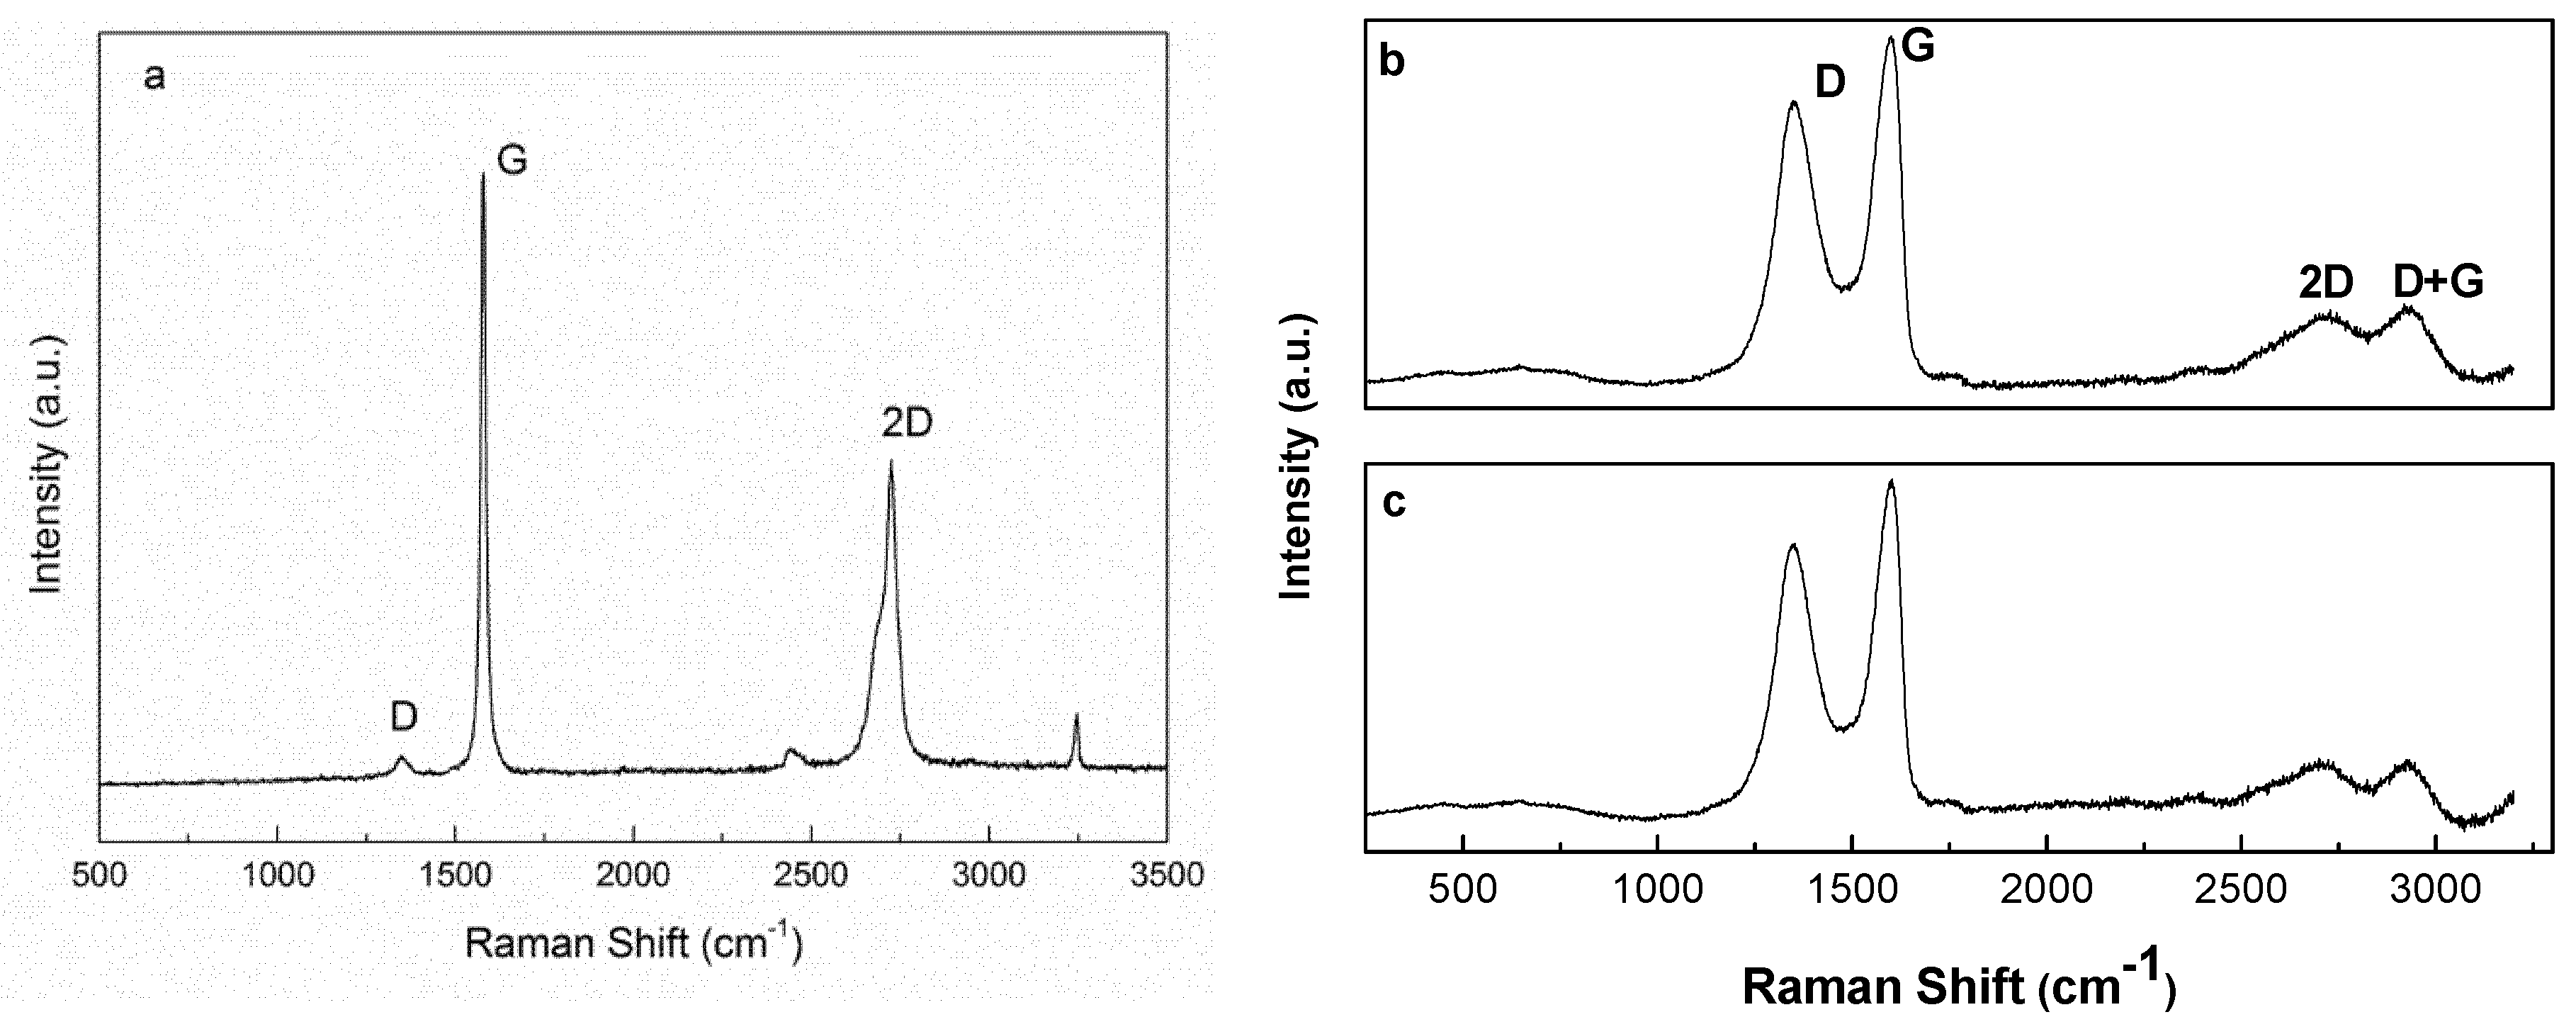
2.2.3. Raman Spectroscopy
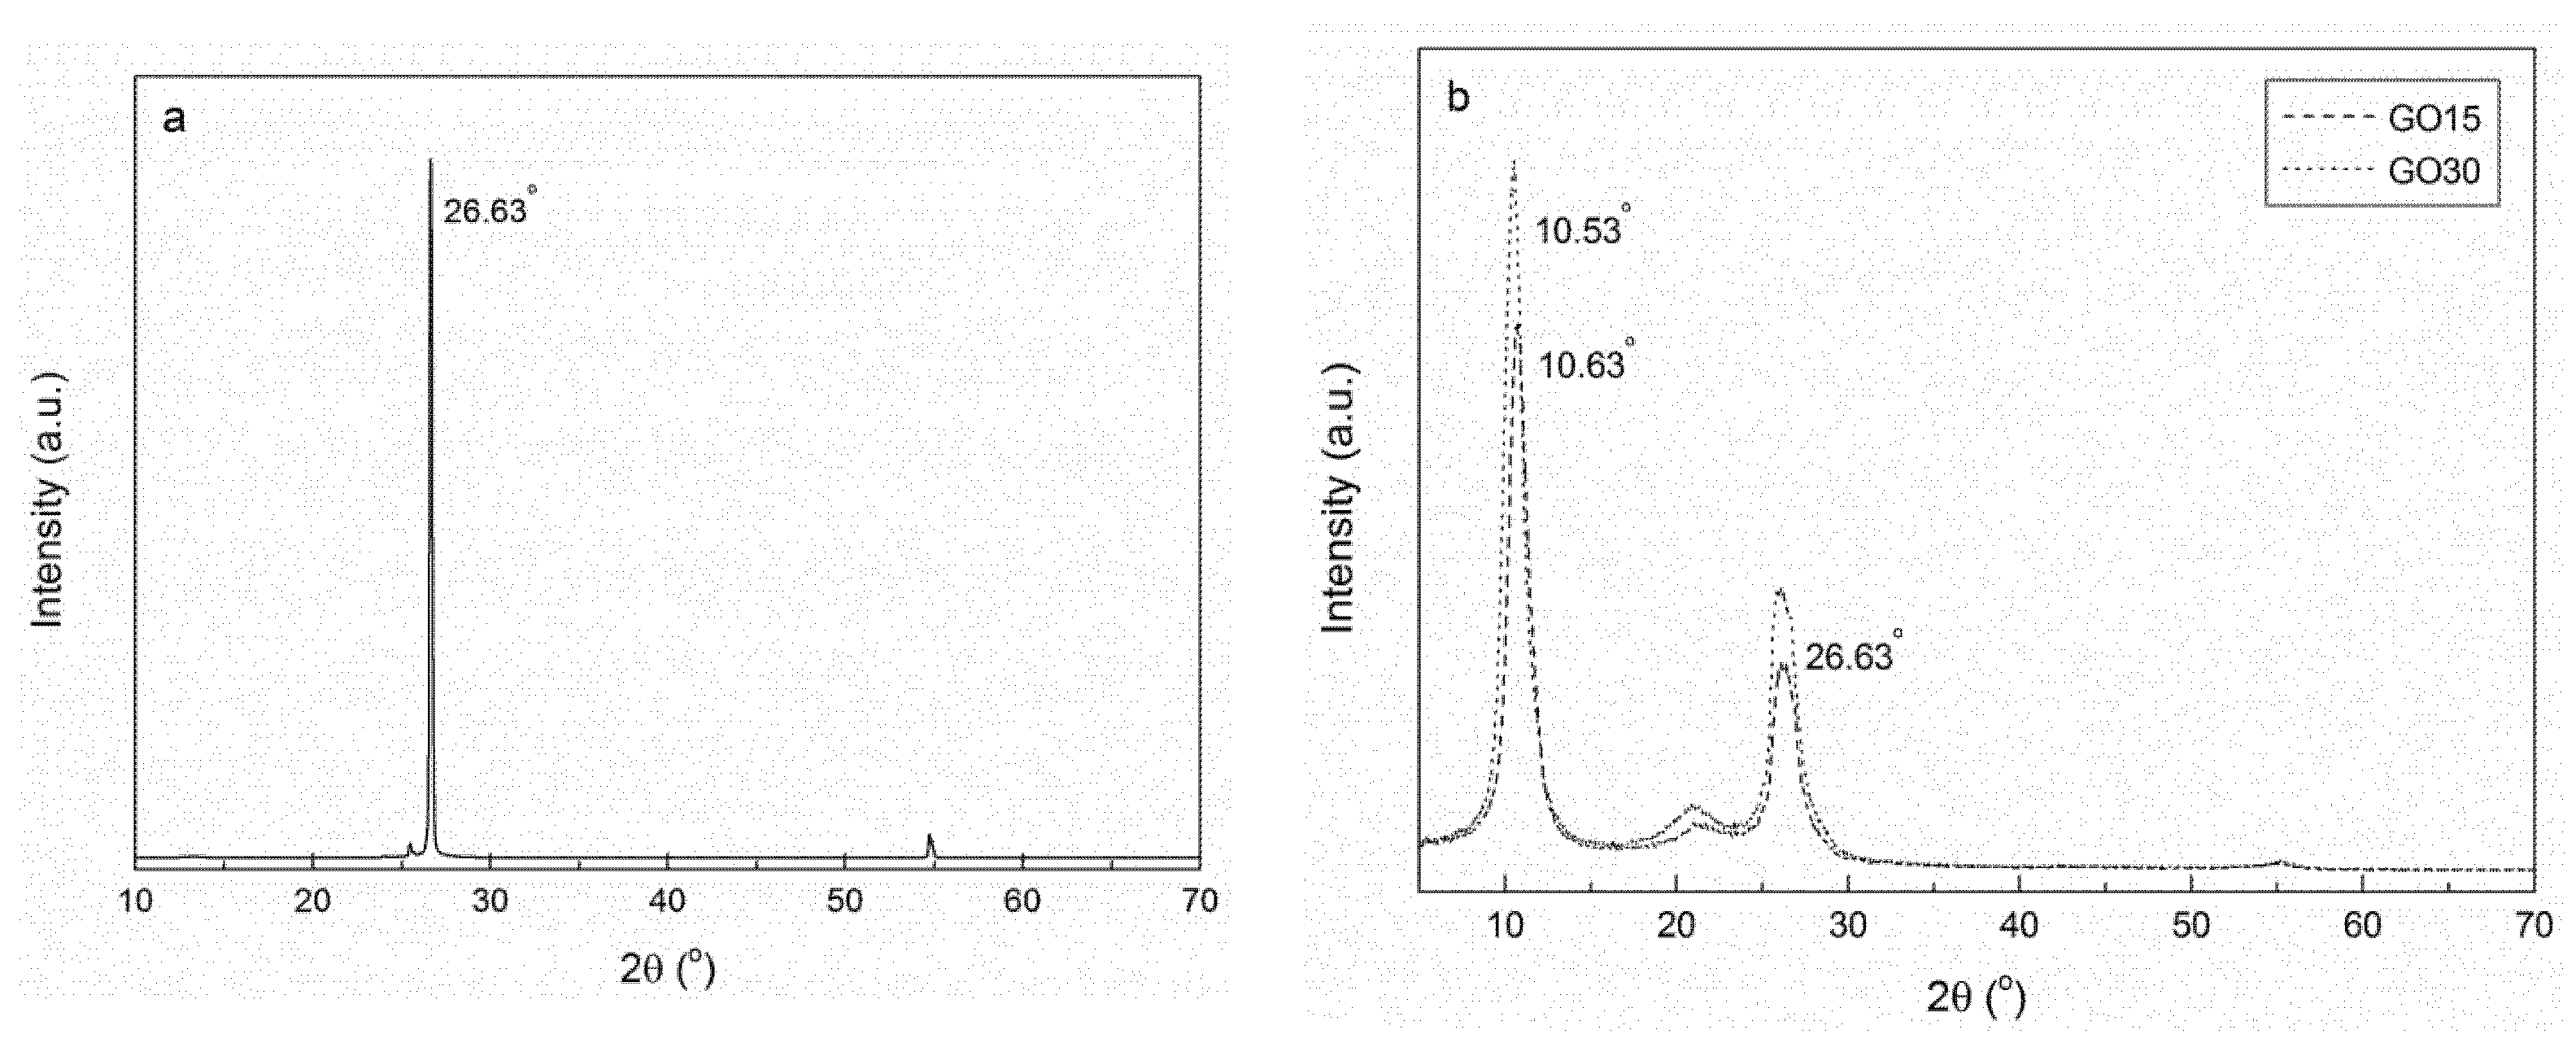
2.2.4. X-Ray Diffraction
2.2.5. Atomic Force Microscopy
2.2.6. Thermogravimetric Analysis
2.2.7. Mechanical Properties
3. Results and Discussion
3.1. Oxidation Process
3.2. Exfoliation and Size Selection of Graphene Oxide
3.3. Nanocomposites
4. Conclusions
Author Contributions
Funding
Acknowledgments
Conflicts of Interest
References
- Rouf, T.B.; Kokini, J.L. Biodegradable biopolymer–graphene nanocomposites. J. Mater. Sci. 2016, 51, 9915–9945. [Google Scholar] [CrossRef]
- Halley, P.J.; Dorgan, J.R. Next-generation biopolymers: Advanced functionality and improved sustainability. MRS Bull. 2011, 36, 687–691. [Google Scholar] [CrossRef]
- Mørch, Ý.A.; Holtan, S.; Donati, I.; Strand, B.L.; Skjåk-Bræk, G. Mechanical properties of C-5 epimerized alginates. Biomacromolecules 2008, 9, 2360–2368. [Google Scholar] [CrossRef] [PubMed]
- Draget, K.I. Handbook of Hydrocolloids; Woodhead Publishing Limited: Cambridge, UK, 2000. [Google Scholar]
- Olivas, G.I.; Barbosa-Cánovas, G.V. Alginate-calcium films: Water vapor permeability and mechanical properties as affected by plasticizer and relative humidity. LWT Food Sci. Technol. 2008, 41, 359–366. [Google Scholar] [CrossRef]
- Vauchel, P.; Kaas, R.; Arhaliass, A.; Baron, R.; Legrand, J. A new process for extracting alginates from Laminaria digitata: Reactive extrusion. Food Bioprocess Technol. 2008, 1, 297–300. [Google Scholar] [CrossRef]
- Lee, K.Y.; Mooney, D.J. Alginate: Properties and biomedical applications. Prog. Polym. Sci. 2012, 37, 106–126. [Google Scholar] [CrossRef]
- Vicini, S.; Mauri, M.; Wichert, J.; Castellano, M. Alginate gelling process: Use of bivalent ions rich microspheres. Polym. Eng. Sci. 2017, 57, 531–536. [Google Scholar] [CrossRef]
- Dodero, A.; Pianella, L.; Vicini, S.; Alloisio, M.; Ottonelli, M.; Castellano, M. Alginate-based hydrogels prepared via ionic gelation: An experimental design approach to predict the crosslinking degree. Eur. Polym. J. 2019, 118, 586–594. [Google Scholar] [CrossRef]
- Shchipunov, Y. Bionanocomposites: Green sustainable materials for the near future. Pure Appl. Chem. 2012, 84, 2579–2607. [Google Scholar] [CrossRef]
- Coleman, J.N.; Khan, U.; Blau, W.J.; Gun’ko, Y.K. Small but strong: A review of the mechanical properties of carbon nanotube-polymer composites. Carbon 2006, 44, 1624–1652. [Google Scholar] [CrossRef]
- Liu, C.; Liu, H.; Xiong, T.; Xu, A.; Pan, B.; Tang, K. Graphene oxide reinforced alginate/PVA double network hydrogels for efficient dye removal. Polymers 2018, 10, 835. [Google Scholar] [CrossRef] [PubMed]
- Huang, H.; Liu, C.; Wu, Y.; Fan, S. Aligned carbon nanotube composite films for thermal management. Adv. Mater. 2005, 17, 1652–1656. [Google Scholar] [CrossRef]
- Gholizadeh, B.S.; Buazar, F.; Hosseini, S.M.; Mousavi, S.M. Enhanced antibacterial activity, mechanical and physical properties of alginate/hydroxyapatite bionanocomposite film. Int. J. Biol. Macromol. 2018, 116, 786–792. [Google Scholar] [CrossRef]
- Safaei, M.; Taran, M.; Imani, M.M. Preparation, structural characterization, thermal properties and antifungal activity of alginate-CuO bionanocomposite. Mater. Sci. Eng. C 2019, 101, 323–329. [Google Scholar] [CrossRef] [PubMed]
- Yang, M.; Xia, Y.; Wang, Y.; Zhao, X.; Xue, Z.; Quan, F.; Geng, C.; Zhao, Z. Preparation and property investigation of crosslinked alginate/silicon dioxide nanocomposite films. J. Appl. Polym. Sci. 2016, 133, 1–9. [Google Scholar] [CrossRef]
- Du, X.; Skachko, I.; Barker, A.; Andrei, E.Y. Approaching ballistic transport in suspended graphene. Nat. Nanotechnol. 2008, 3, 491–495. [Google Scholar] [CrossRef] [PubMed]
- Lee, C.; Wei, X.; Kysar, J.W.; Hone, J. Measurement of the elastic properties and intrinsic strength of monolayer graphene. Science 2008, 321, 385–388. [Google Scholar] [CrossRef]
- Brodie, B.C. XIII. On the atomic weight of graphite. Philos. Trans. R. Soc. Lond. 1859, 149, 249–259. [Google Scholar] [CrossRef]
- Staudenmaier, L. Method for the preparation of the graphite acid. Eur. J. Inorg. Chem. 1898, 31, 1481–1487. [Google Scholar]
- Hummers, W.S.; Offeman, R.E. Preparation of graphitic oxide. J. Am. Chem. Soc. 1958, 80, 1339. [Google Scholar] [CrossRef]
- Liang, J.; Huang, Y.; Zhang, L.; Wang, Y.; Ma, Y.; Cuo, T.; Chen, Y. Molecular-level dispersion of graphene into poly(vinyl alcohol) and effective reinforcement of their nanocomposites. Adv. Funct. Mater. 2009, 19, 2297–2302. [Google Scholar] [CrossRef]
- Si, H.; Luo, H.; Xiong, G.; Yang, Z.; Raman, S.R.; Guo, R.; Wan, Y. One-step in situ biosynthesis of graphene oxide-bacterial cellulose nanocomposite hydrogels. Macromol. Rapid Commun. 2014, 35, 1706–1711. [Google Scholar] [CrossRef] [PubMed]
- Liu, L.; Li, C.; Bao, C.; Jia, Q.; Xiao, P.; Liu, X.; Zhang, Q. Preparation and characterization of chitosan/graphene oxide composites for the adsorption of Au(III) and Pd(II). Talanta 2012, 93, 350–357. [Google Scholar] [CrossRef] [PubMed]
- Chen, Y.; Yin, Q.; Zhang, X.; Jia, H.; Ji, Q.; Xu, Z. Impact of various oxidation degrees of graphene oxide on the performance of styrene–butadiene rubber nanocomposites. Polym. Eng. Sci. 2018, 58, 1409–1418. [Google Scholar] [CrossRef]
- Nie, L.; Liu, C.; Wang, J.; Shuai, Y.; Cui, X.; Liu, L. Effects of surface functionalized graphene oxide on the behavior of sodium alginate. Carbohydr. Polym. 2015, 117, 616–623. [Google Scholar] [CrossRef]
- Appel, A.K.; Thomann, R.; Mülhaupt, R. Polyurethane nanocomposites prepared from solvent-free stable dispersions of functionalized graphene nanosheets in polyols. Polymer 2012, 53, 4931–4939. [Google Scholar] [CrossRef]
- May, P.; Khan, U.; O’Neill, A.; Coleman, J.N. Approaching the theoretical limit for reinforcing polymers with graphene. J. Mater. Chem. 2012, 22, 1278–1282. [Google Scholar] [CrossRef]
- Nawaz, K.; Ayub, M.; Ul-Haq, N.; Khan, M.B.; Niazi, M.B.K.; Hussain, A. Effects of selected size of graphene nanosheets on the mechanical properties of polyacrylonitrile polymer. Fibers Polym. 2014, 15, 2040–2044. [Google Scholar] [CrossRef]
- Szparaga, G.; Brzezińska, M.; Pabjańczyk-Wlazło, E.; Puchalski, M.; Sztajnowski, S.; Krucińska, I. Structure-Property of Wet-Spun Alginate-Based Precursor Fibers Modified with Nanocarbons. Autex Res. J. 2019, 1–11. [Google Scholar] [CrossRef]
- Khan, U.; O’Neill, A.; Porwal, H.; May, P.; Nawaz, K.; Coleman, J.N. Size selection of dispersed, exfoliated graphene flakes by controlled centrifugation. Carbon 2012, 50, 470–475. [Google Scholar] [CrossRef]
- Zachariasen, W.H. A general theory of X-ray diffraction in crystals. Acta Crystallogr. 1967, 23, 558–564. [Google Scholar] [CrossRef]
- Bragg, W.L. The diffraction of short electromagnetic Waves by a Crystal. Proc. Camb. Philol. Soc. 1913, 17, 43–57. [Google Scholar]
- Dinari, M.; Salehi, E.; Abdolmaleki, A. Thermal and morphological properties of nanocomposite materials based on graphene oxide and L-leucine containing poly (benzimidazole-amide) prepared by ultrasonic irradiation. Ultrason. Sonochem. 2018, 41, 59–66. [Google Scholar] [CrossRef] [PubMed]
- Krishnamoorthy, K.; Veerapandian, M.; Yun, K.; Kim, S. The chemical and structural analysis of graphene oxide with different degrees of oxidation. Carbon 2012, 53, 38–49. [Google Scholar] [CrossRef]
- Sharifi-Bonab, M.; Rad, F.A.; Mehrabad, J.T. Preparation of laccase-graphene oxide nanosheet/alginate composite: Application for the removal of cetirizine from aqueous solution. J. Environ. Chem. Eng. 2016, 4, 3013–3020. [Google Scholar] [CrossRef]
- Todorova, N.; Giannakopoulou, T.; Boukos, N.; Vermisoglou, E.; Lekakou, C.; Trapalis, C. Self-propagating solar light reduction of graphite oxide in water. Appl. Surf. Sci. 2017, 391, 601–608. [Google Scholar] [CrossRef]
- Paredes, J.I.; Villar-Rodil, S.; Martínez-Alonso, A.; Tascón, J.M.D. Graphene oxide dispersions in organic solvents. Langmuir 2008, 24, 10560–10564. [Google Scholar] [CrossRef]
- Ferrari, A.C. Raman spectroscopy of graphene and graphite: Disorder, electron—Phonon coupling, doping and nonadiabatic effects. Solid State Commun. 2007, 143, 47–57. [Google Scholar] [CrossRef]
- Gayathri, S.; Jayabal, P.; Kottaisamy, M.; Ramakrishnan, V. Synthesis of few layer graphene by direct exfoliation of graphite and a Raman spectroscopic study. AIP Adv. 2014, 4. [Google Scholar] [CrossRef]
- Ferrari, A.C.; Meyer, J.C.; Scardaci, V.; Casiraghi, C.; Lazzeri, M.; Mauri, F.; Piscanec, S.; Jiang, D.; Novoselov, K.S.; Roth, S.; et al. Raman Spectrum of Graphene and Graphene Layers. Phys. Rev. Lett. 2006, 97, 187401. [Google Scholar] [CrossRef]
- Dresselhaus, M.S.; Jorio, A.; Saito, R. Characterizing Graphene, Graphite, and Carbon Nanotubes by Raman Spectroscopy. Annu. Rev. Condens. Matter Phys. 2010, 1, 89–108. [Google Scholar] [CrossRef]
- Sharma, S.; Susan, D.; Kothiyal, N.C.; Kaur, R. Graphene oxide prepared from mechanically milled graphite: Effect on strength of novel fly-ash based cementitious matrix. Constr. Build. Mater. 2018, 177, 10–22. [Google Scholar] [CrossRef]
- Lespade, P.; Al-Jishi, R.; Dresselhaus, M.S. Model for Raman scattering from incompletely graphitized carbons. Carbon 1982, 20, 427–431. [Google Scholar] [CrossRef]
- Cançado, L.G.; Takai, K.; Enoki, T.; Endo, M.; Kim, Y.A.; Mizusaki, H.; Jorio, A.; Coelho, L.N.; Magalhães-Paniago, R.; Pimenta, M.A. General equation for the determination of the crystallite size la of nanographite by Raman spectroscopy. Appl. Phys. Lett. 2006, 88, 163106. [Google Scholar] [CrossRef]
- Guerrero-contreras, J.; Guerrero-contreras, J. Graphene oxide powders with different oxidation degree, prepared by synthesis variations of the Hummers method Graphene oxide powders with different oxidation degree, prepared by synthesis variations of the Hummers method. Mater. Chem. Phys. 2015, 153, 209–220. [Google Scholar] [CrossRef]
- Ugarte, L.; Gómez-Fernández, S.; Tercjak, A.; Martínez-Amesti, A.; Corcuera, M.A.; Eceiza, A. Strain sensitive conductive polyurethane foam/graphene nanocomposites prepared by impregnation method. Eur. Polym. J. 2017, 90, 323–333. [Google Scholar] [CrossRef]
- Shearer, C.J.; Slattery, A.D.; Stapleton, A.J.; Shapter, J.G.; Gibson, C.T. Accurate thickness measurement of graphene. Nanotechnology 2016, 27, 125704. [Google Scholar] [CrossRef]
- Sohail, M.; Saleem, M.; Ullah, S.; Saeed, N.; Afridi, A.; Khan, M.; Arif, M. Modified and improved Hummer’s synthesis of graphene oxide for capacitors applications. Mod. Electron. Mater. 2017, 3, 110–116. [Google Scholar] [CrossRef]
- Ionita, M.; Pandele, M.A.; Iovu, H. Sodium alginate/graphene oxide composite films with enhanced thermal and mechanical properties. Carbohydr. Polym. 2013, 94, 339–344. [Google Scholar] [CrossRef]
- Hu, X.; Zhang, X.; Tian, M.; Qu, L.; Zhu, S.; Han, G. Robust ultraviolet shielding and enhanced mechanical properties of graphene oxide/sodium alginate composite films. J. Compos. Mater. 2016, 50, 2365–2374. [Google Scholar] [CrossRef]
- Sundarrajan, P.; Eswaran, P.; Marimuthu, A.; Subhadra, L.B.; Kannaiyan, P. One pot synthesis and characterization of alginate stabilized semiconductor nanoparticles. Bull. Korean Chem. Soc. 2012, 33, 3218–3224. [Google Scholar] [CrossRef]


| Sample | Oxidation Time (min) | Ultrasonication Time (h) | Centrifugation Rate (rpm) |
|---|---|---|---|
| GO15 | 15 | - | - |
| GO30 | 30 | - | - |
| GO30L | 30 | 4 | - |
| GO30S | 30 | 3 | - |
| GO30L-4000 | 30 | 4 | 4000 |
| GO30L-3000 | 30 | 4 | 3000 |
| GO30L-2000 | 30 | 4 | 2000 |
| GO30L-1000 | 30 | 4 | 1000 |
| GO30S-4000 | 30 | 3 | 4000 |
| Sample | ID/IG Ratio | La (nm) |
|---|---|---|
| Graphite | 0.063 | 264.4 |
| GO15 | 0.81 | 20.7 |
| GO30 | 0.85 | 19.8 |
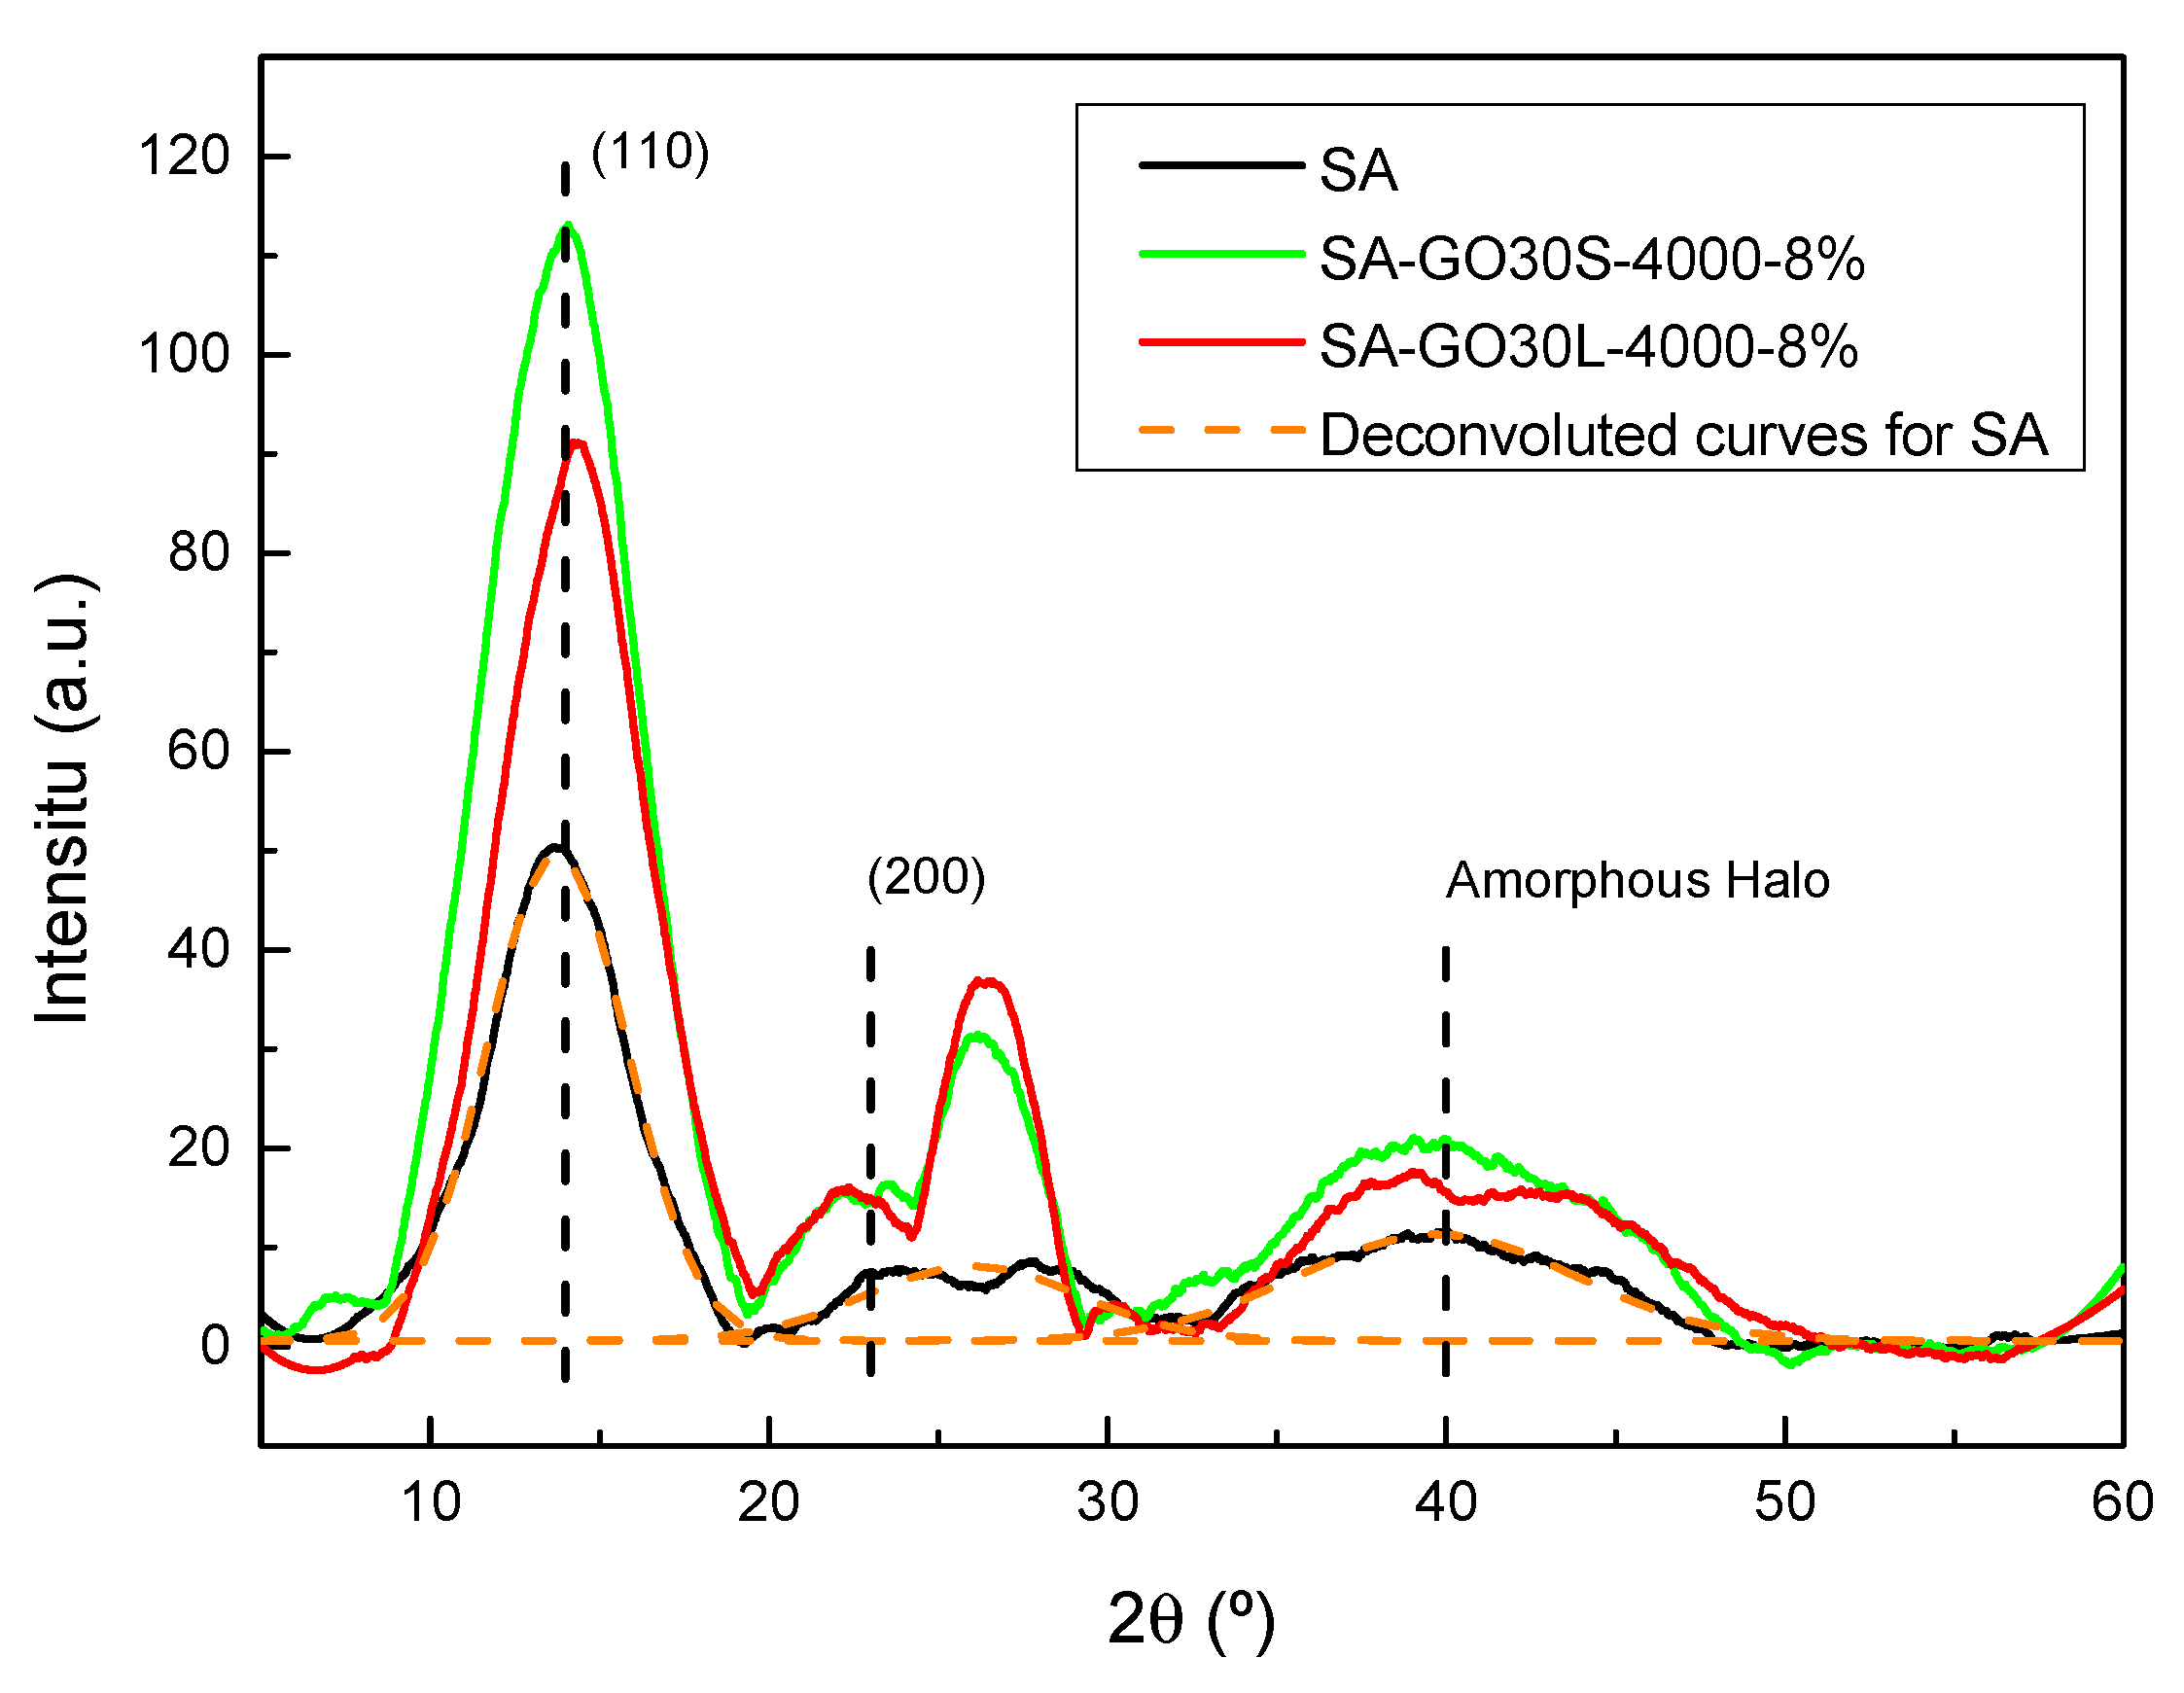
| Sample | 2θ (°) | d (nm) |
|---|---|---|
| Graphite | 26.63 | 0.335 |
| GO15 | 10.63 | 0.828 |
| GO30 | 10.53 | 0.837 |
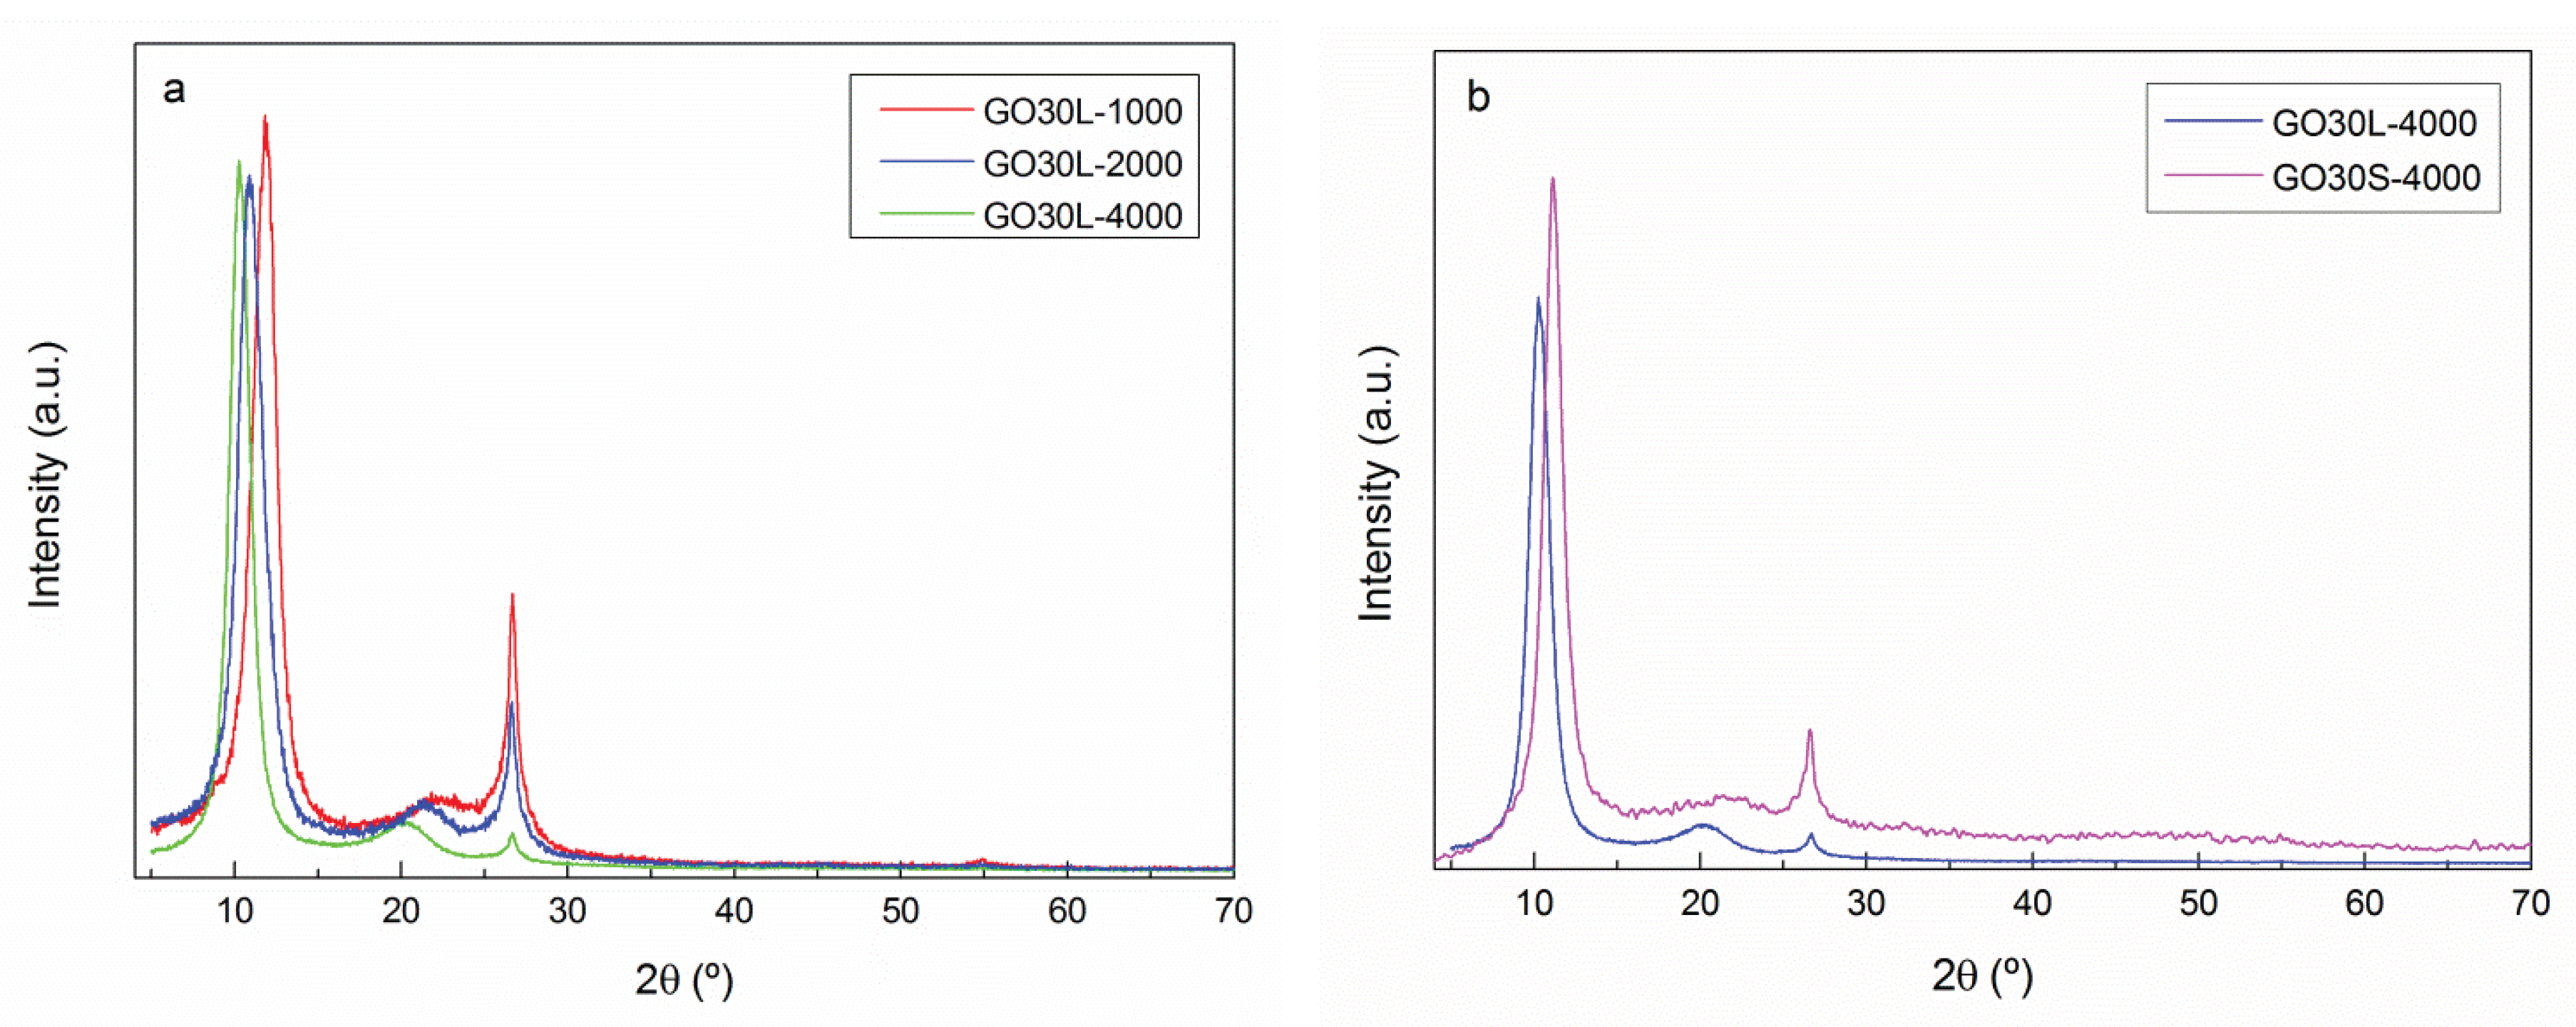
| Sample | 2θ (°) | d (nm) |
|---|---|---|
| GO30L-1000 | 12.03 | 0.733 |
| GO30L-2000 | 10.90 | 0.811 |
| GO30L-4000 | 10.27 | 0.865 |
| GO30S-4000 | 11.12 | 0.795 |
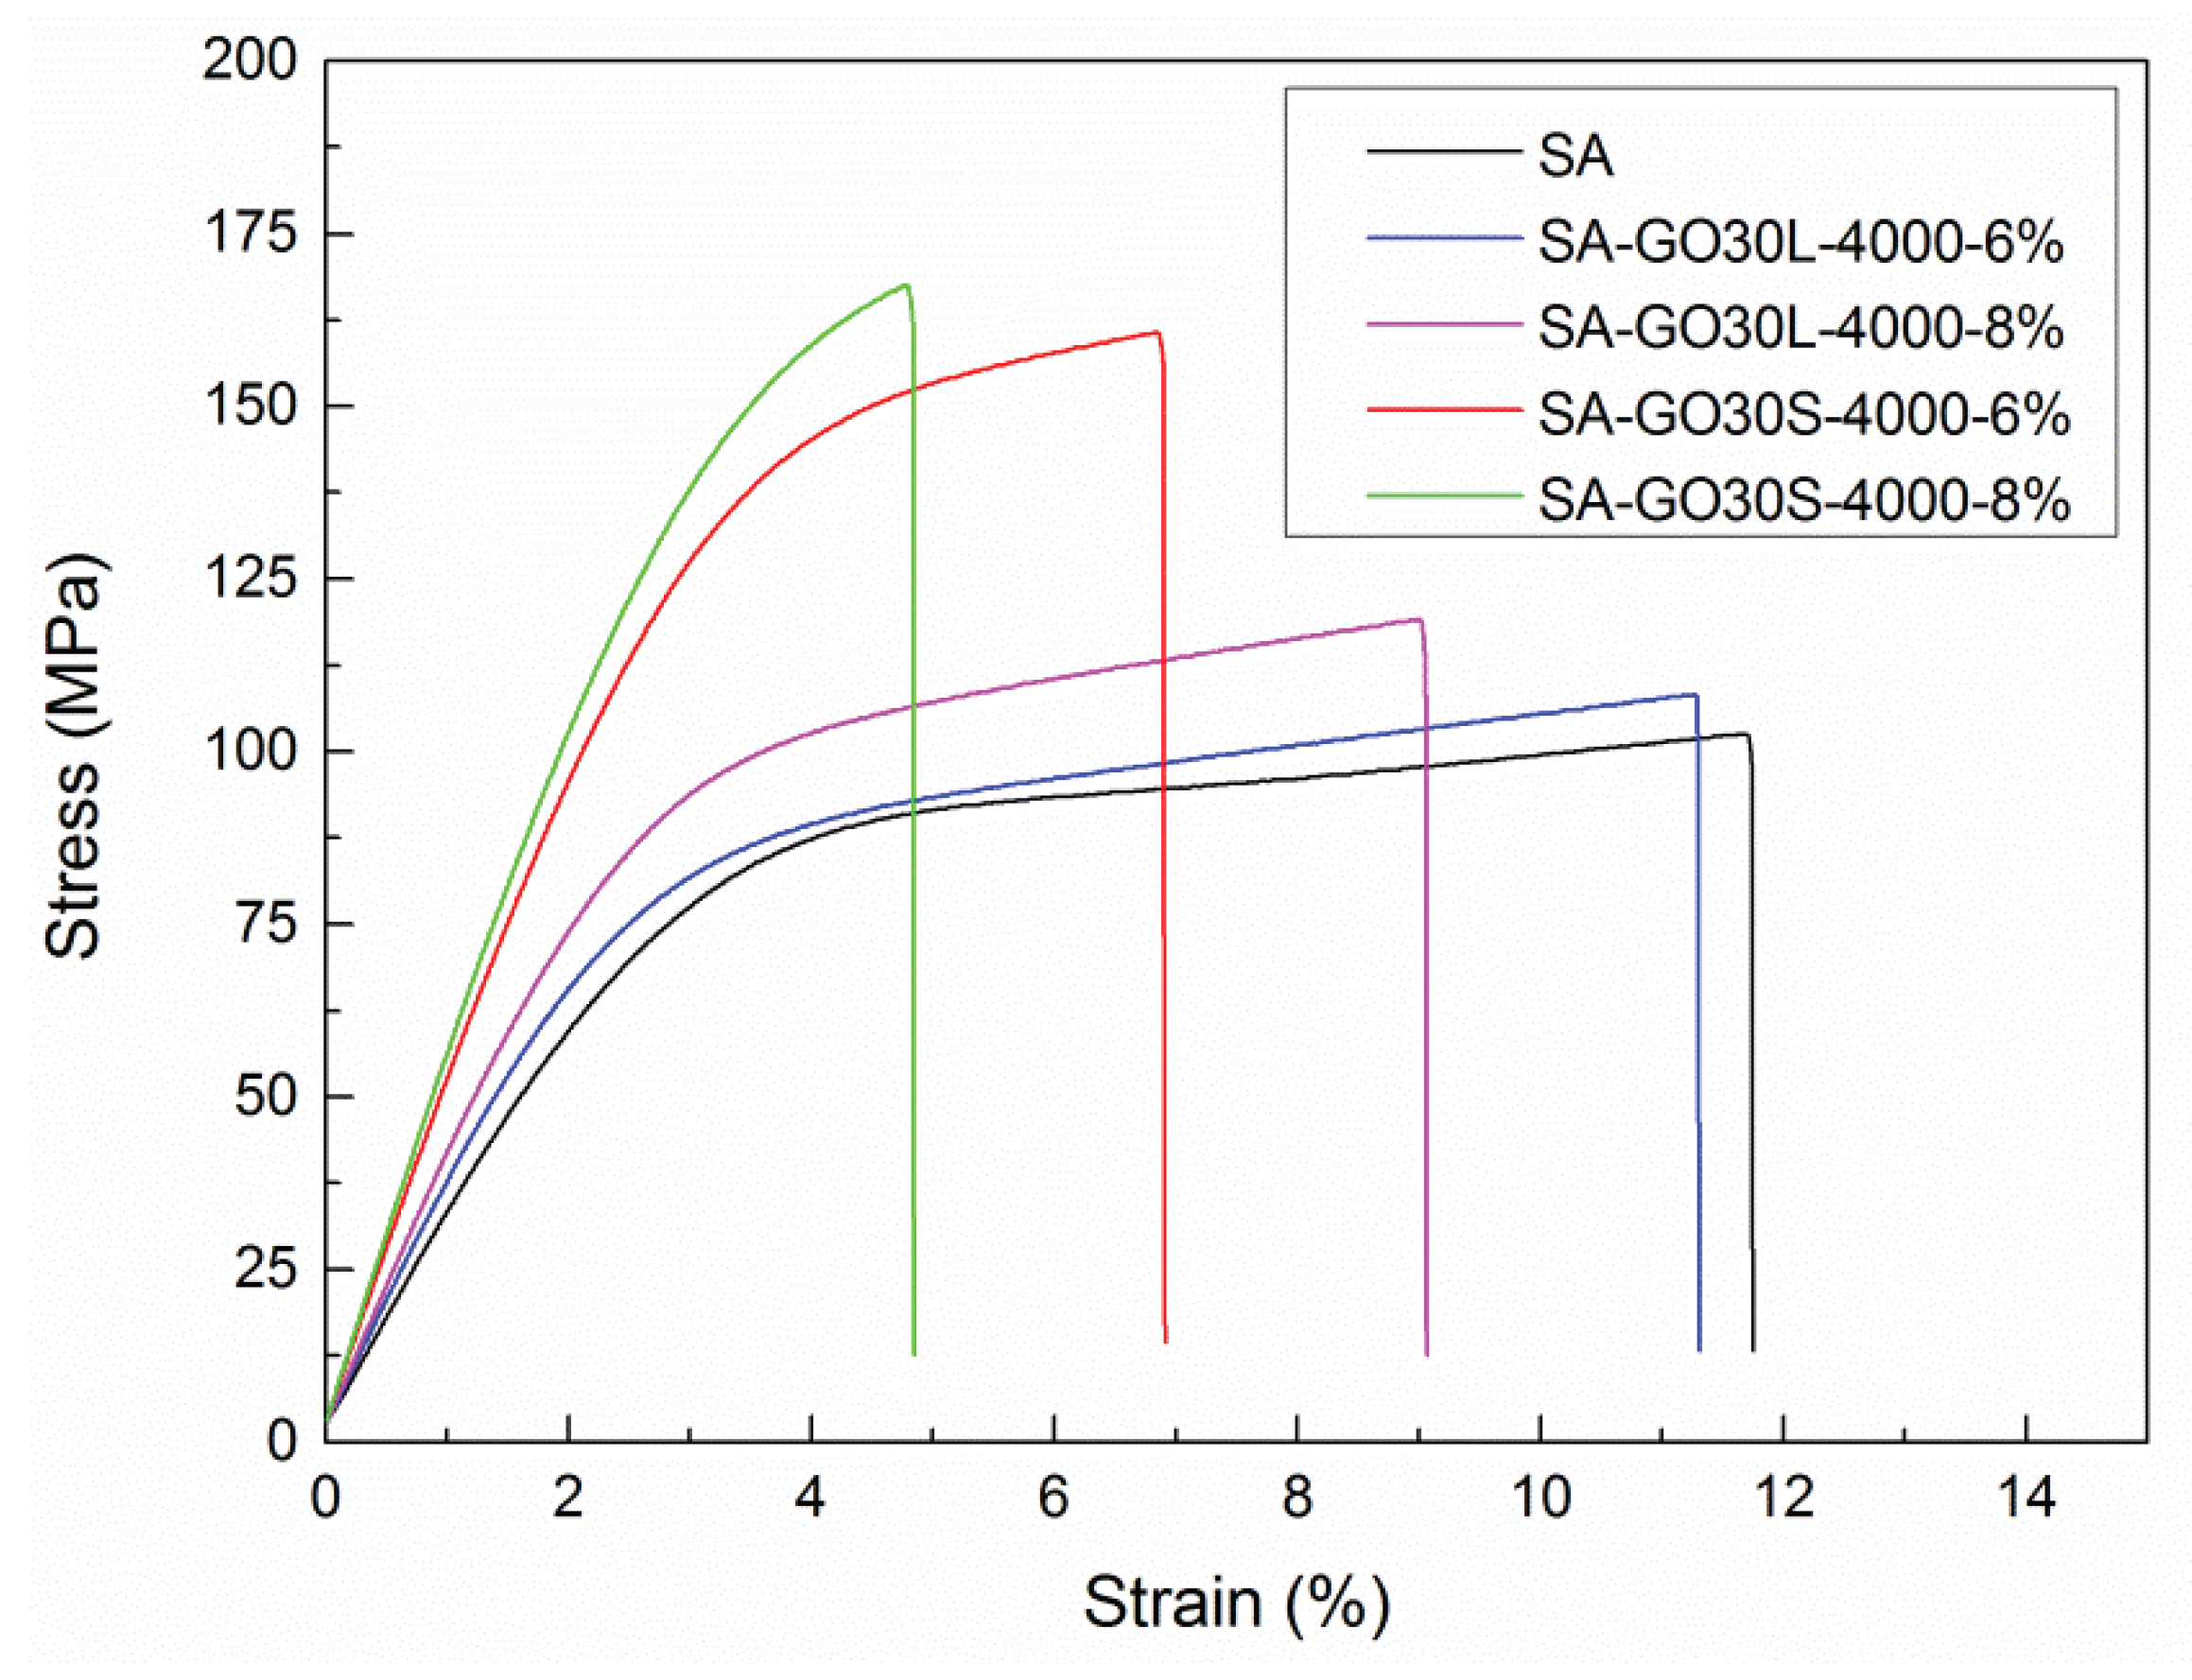
| Sample | Tensile Strength (MPa) | Young’s Modulus (GPa) | Elongation at Break (%) |
|---|---|---|---|
| SA | 101.4 ± 4.8 | 3.0 ± 0.1 | 12.8 ± 3.9 |
| SA-GO30L-4000-1% | 104.5 ± 9.1 | 3.3 ± 0.3 | 10.2 ± 0.9 |
| SA-GO30L-4000-4% | 111.9 ± 15.1 | 3.2 ± 0.5 | 14.6 ± 2.9 |
| SA-GO30L-4000-6% | 108.3 ± 8.9 | 3.6 ± 0.3 | 11.3 ± 1.6 |
| SA-GO30L-4000-8% | 119.1 ± 6.2 | 3.7 ± 0.3 | 9.0 ± 3.0 |
| Sample | Tensile Strength (MPa) | Young’s Modulus (GPa) | Elongation at Break (%) |
|---|---|---|---|
| SA | 101.4 ± 4.8 | 3.0 ± 0.1 | 12.8 ± 3.9 |
| SA-GO30L-4000-6% | 108.3 ± 8.9 | 3.6 ± 0.3 | 11.3 ± 1.6 |
| SA-GO30S-4000-6% | 160.8 ± 17.2 | 5.1 ± 0.7 | 6.9 ± 1.2 |
| SA-GO30L-4000-8% | 119.1 ± 6.2 | 3.7 ± 0.3 | 9.0 ± 3.0 |
| SA-GO30S-4000-8% | 167.7 ± 17.4 | 5.5 ± 0.3 | 4.8 ± 0.8 |
© 2020 by the authors. Licensee MDPI, Basel, Switzerland. This article is an open access article distributed under the terms and conditions of the Creative Commons Attribution (CC BY) license (http://creativecommons.org/licenses/by/4.0/).
Share and Cite
Larraza, I.; Ugarte, L.; Fayanas, A.; Gabilondo, N.; Arbelaiz, A.; Corcuera, M.A.; Eceiza, A. Influence of Process Parameters in Graphene Oxide Obtention on the Properties of Mechanically Strong Alginate Nanocomposites. Materials 2020, 13, 1081. https://doi.org/10.3390/ma13051081
Larraza I, Ugarte L, Fayanas A, Gabilondo N, Arbelaiz A, Corcuera MA, Eceiza A. Influence of Process Parameters in Graphene Oxide Obtention on the Properties of Mechanically Strong Alginate Nanocomposites. Materials. 2020; 13(5):1081. https://doi.org/10.3390/ma13051081
Chicago/Turabian StyleLarraza, Izaskun, Lorena Ugarte, Aintzane Fayanas, Nagore Gabilondo, Aitor Arbelaiz, Maria Angeles Corcuera, and Arantxa Eceiza. 2020. "Influence of Process Parameters in Graphene Oxide Obtention on the Properties of Mechanically Strong Alginate Nanocomposites" Materials 13, no. 5: 1081. https://doi.org/10.3390/ma13051081
APA StyleLarraza, I., Ugarte, L., Fayanas, A., Gabilondo, N., Arbelaiz, A., Corcuera, M. A., & Eceiza, A. (2020). Influence of Process Parameters in Graphene Oxide Obtention on the Properties of Mechanically Strong Alginate Nanocomposites. Materials, 13(5), 1081. https://doi.org/10.3390/ma13051081