Article

Effect of Nb Content on Cyclic Oxidation Behavior of As-Cast Ti-1100 Alloys

School of Materials Science and Engineering, Hebei University of Technology, Tianjin 300130, China
*
Authors to whom correspondence should be addressed.
Materials 2020, 13(5), 1082; https://doi.org/10.3390/ma13051082
Submission received: 9 February 2020 / Revised: 25 February 2020 / Accepted: 27 February 2020 / Published: 29 February 2020

Abstract

:
The cyclic oxidation behaviors of the as-cast Ti-1100-xNb (x = 0.5, 1.0, 1.5, 2.0) alloys exposed at 650 °C for up to 100 h were systematically investigated. The aim of this work is to explore the in-depth oxidation mechanism by using the oxidation kinetics and the structure of the oxide products. The oxidation kinetics were determined by thermogravimetrically, and the microstructure and composition of the oxidation scale were studied by using XRD and SEM. The results demonstrate that Nb can significantly improve the oxidation resistance. However, the average weight gains of the alloys decrease firstly and then increase with the increase of Nb content. The oxidation kinetics obeys a parabolic model. The Ti-1100-1.0Nb alloy has the lowest kp value, which is 5.7 × 10⁻¹³ g2cm−4s−1. The surface oxidation products are mainly composed of massive or acicular rutile-TiO2, TixO (x = 3, 6), NbO2 and Al2O3. Besides, Al2(MoO4)3 oxide is also presented on the oxidation surface of the Ti-1100-1.5Nb alloys. Ti-1100-1.0Nb alloy shows the best oxidation resistance property revealed by combining weight gains and EDS-SEM element content profiles analysis. The interaction of Nb, O, Ti, and other elements retarded the diffusion of O atoms into the alloys, which improves the oxidation resistance.

Graphical Abstract

1. Introduction

Ti-1100 alloy (Ti-6Al-2.7Sn-4Zr-0.4Mo-0.45Si) as a near α titanium alloy, has certain potential to be used in high temperature parts of aero-engine because of its excellent high temperature strength and creep resistance and corrosion resistance up to 600 °C [1,2]. Previous papers have reported that the room temperature strength of the forged Ti-1100 alloys can reach 900–950 MPa, and the high temperature (593 °C) strength can reach 500–570 MPa [3,4]. With the development of aircraft toward high flight speeds, in addition to low density and high strength, titanium alloys are also required to withstand higher temperatures. While a limitation of developing near-α titanium alloy is that the high temperature oxidation resistance is significantly reduced when the temperature exceeds 600 °C, the severe surface oxidation of high-temperature components of aeroengine will result in the decrease of effective load bearing area, which causes structure failure [5,6]. Previous investigation has reported that adding Nb to titanium alloy could improve the high temperature oxidation resistance and mechanical properties [7]. So, the addition of Nb element to Ti-1100 alloy may be a method to improve its high temperature oxidation resistance.
The oxidation process of titanium alloy is mainly affected by time and temperature [8], including two parts: one is the internal diffusion of O to the matrix, which can promote the formation of the low valence titanium oxide (TixO, x = 6, 3, 2) [9]. The other is the formation of TiO2 oxide particles on the oxidation surface. When the oxidation temperature exceeds 500 °C, the porosity of oxidation surface increases, even the TiO2 particles dissolve [10]. Researches showed that the addition of 5–10 at.% Nb could improve the oxidation resistance of Ti-Al alloys [11,12]. The effects of Nb atoms on oxidation behavior could be summarized as [13,14,15,16]: (1) Nb replaced the Ti4+ in TiO2, leading to a reduce of O2− vacancy, which hampered the diffusion of O ion. (2) Nb could improve the activity of Al and promote the formation of the density Al2O3 oxide film in TiO2 oxide-layer, which can reduce the solubility of O atoms in oxide-layer. (3) Nb could reduce the solubility of O in α-Ti phase lattice. However, the solid solubility of Nb in titanium alloys is limited, and the interaction of Nb with Al, Sn, Zr, Mo, and Si in the Ti-1100 alloy can form the secondary phase and change the surface oxide structure [7]. With increasing Nb element, excessive Nb segregates in the grain boundary, which may result in the oxide scales cracking and high temperature oxidation resistance depreciation [8,17]. The content of Nb in the near α titanium alloy is usually between 0.7–1.0 wt.% [18], and the excess Nb content can be selected as 1.5 and 2.0 wt.%.
Thus, the effect of Nb content (0.5, 1.0, 1.5, 2.0 wt.%) on cyclic oxidation behavior of as-cast Ti-1100 alloys was systematically investigated in this present work. The aim of this study is to explore the in-depth oxidation mechanism from the oxidation kinetics, surface oxidation products, and the cross-section oxidation layer elements distribution.

2. Materials and Methods

The Ti-1100-xNb (x = 0.5, 1.0, 1.5, 2.0) alloys were prepared by a vacuum arc smelting furnace with a non-consumable tungsten electrode and water-cooled copper crucibles. The melting stocks weighing 40 g were melted in a sealed chamber, and the melting process was at a controlled atmosphere of dry high purity argon (99.99%) maintained at 10,000 Pa. Each specimen was smelted four times to make the composition uniform. The chemical compositions tested by fluorescent spectrometer are given in Table 1.
The oxidation specimen with a dimension of 10 × 10 × 3 mm was cut by wire-cut electrical discharge machining (WEDM), which used electrical impulses to shape and manipulate hard metal materials. WEDM is mainly composed of machine itself, numerical control (NC) system, impulse power, working liquid cycle system, and machine accessories and so on. All surface roughness of the specimen is not less than 0.5 μm after grinding and polishing process. Before performing the oxidation test, the specimens were ultrasonically cleaned using the acetone solution to strip away the oily and oxidation particles. The following steps needed to be considered: (1) The size of the test specimen was measured by the micrometer with an accuracy of 0.01 mm to calculate the surface area; (2) Each specimen needed to be put in a cylindrical corundum crucible and dehydrated at 100 °C for 30 min; (3) The weight of the crucible and specimen was weighted by the CP224C electronic balance (Ohaus, USA) with an accuracy of 0.01 mg as the initial weight before oxidation test.
Cyclic oxidation experiment was performed in a resistance furnace (KSL-1100X type) (HF-Kejing, Hefei, China) at 650 °C for up to 100 h. The crucibles were taken out every 12 h to measure the weight gains, and then put it back into the furnace to continue the cyclic oxidation test. In order to keep reproducibility, three specimens in each composition alloy were tested, and the statistically averaged values of the weight gains were obtained to analysis the oxidation kinetics. The Nikon Eclipse MA100 type optical microscope (OM) (Nikon, Kyoto, Japan) was used to observe the microstructure of as-cast alloys, and the Quanta 450-FEG type scanning electron microscope (SEM) (FEI, Eindhoven, Netherland) with an octane plus type energy dispersion spectrometer (EDS) was used to examine the oxidation surface and cross morphology. The phases and oxidation products of the as-cast alloys were examined by the D/Max-2500/pc type X-ray diffractometer (XRD) (Rigaku, Akishima, Japan) with copper Kα radiation, and the 2θ scans were collected from 10° to 90° with the scanning speed of 8°/min. The obtained data were analyzed by MDI Jade 6 software. Specimens for OM observations were prepared according to conventional metallographic techniques. The specimens were polished and etched with Kroll’s reagent (6 vol.% HNO3, 3 vol.% HF, 91 vol.% H2O).

3. Results and Discussion

3.1. Microstructure

XRD spectra of the as-cast Ti-1100-xNb (x = 0.5, 1.0, 1.5, 2.0) alloys are shown in Figure 1. It can be observed that all the peaks are well matched with the α-Ti phase regardless of Nb content. Nb is a β-Ti stabilizing element, however no β phase is detected due to the sensitivity of XRD, and the alloy is still classified as near α titanium alloy. It also can be seen that the XRD peaks move to a low angle direction and then shift toward high angle orientations with the increase of Nb content. According to Bragg’s equation, the shift in peaks will cause an increase or decrease in the α-Ti phase lattice parameter. The effect of Nb content on the α-Ti lattice constant of the as-cast Ti-1100-xNb alloys will be discussed in the later part.
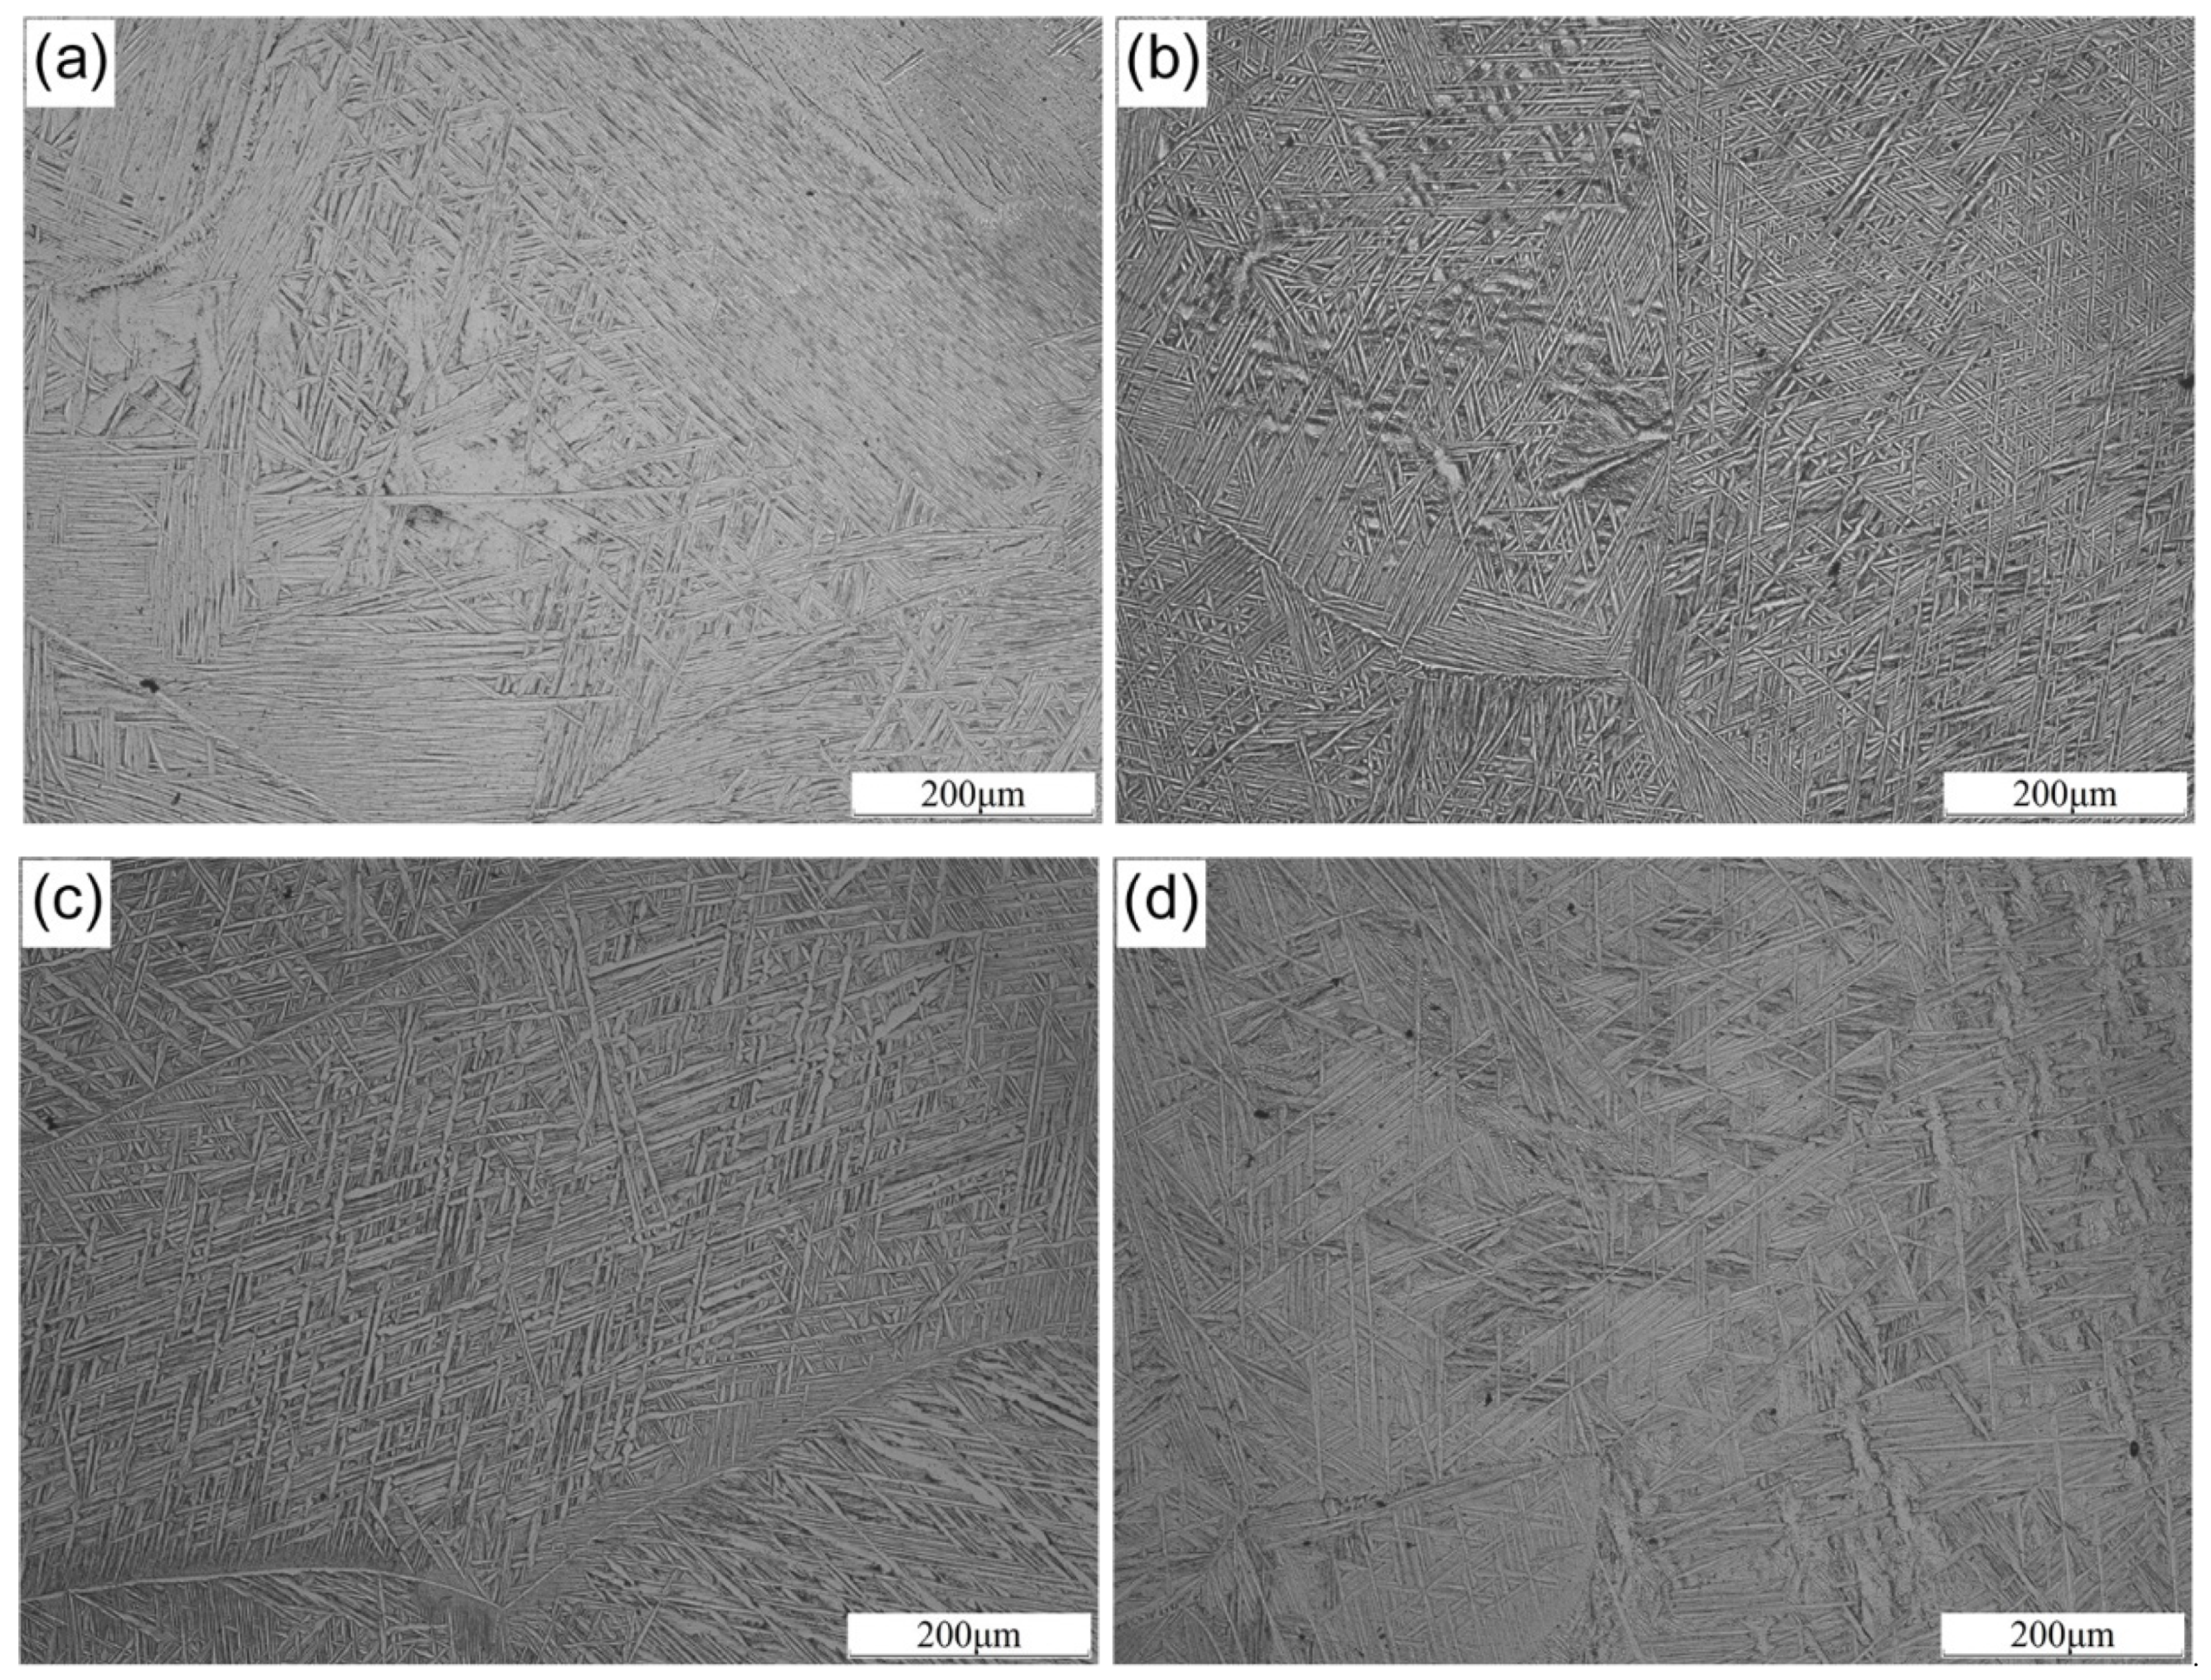
Figure 2 shows the OM microstructure of the as-cast Ti-1100 based alloys. It can be seen that addition of Nb did not change the microstructure classification of the alloys. All the microstructures are the widmanstätten structure with typical basket weave features. The average α-laths spacing of the alloys is 2.3, 1.4, 1.7 and 1.9 μm, respectively, which calculated by a mean linear intercept method. With the increase of Nb content, the space between α-laths decreases first and then increases. Our previous investigation found that the addition of 0.5 wt.% and 1.0 wt.% Nb had a grain refinement effect on Ti-1100 alloys [7]. However, the excessive Nb would weaken the grain refinement effect. This is due to the fact that Nb is a β-Ti stabilizing element, and its solid solubility in the β-Ti phase is much greater than that in the α-Ti phase [19]. With the further increase of Nb content, the amount of β-Ti phase increase, and the solid solubility of Nb in the β-Ti phase increases, leading to the weakening of the pinning grain boundary effect. Therefore, the α-laths spacing began to coarsen.

3.2. Analysis of Oxidation Kinetics

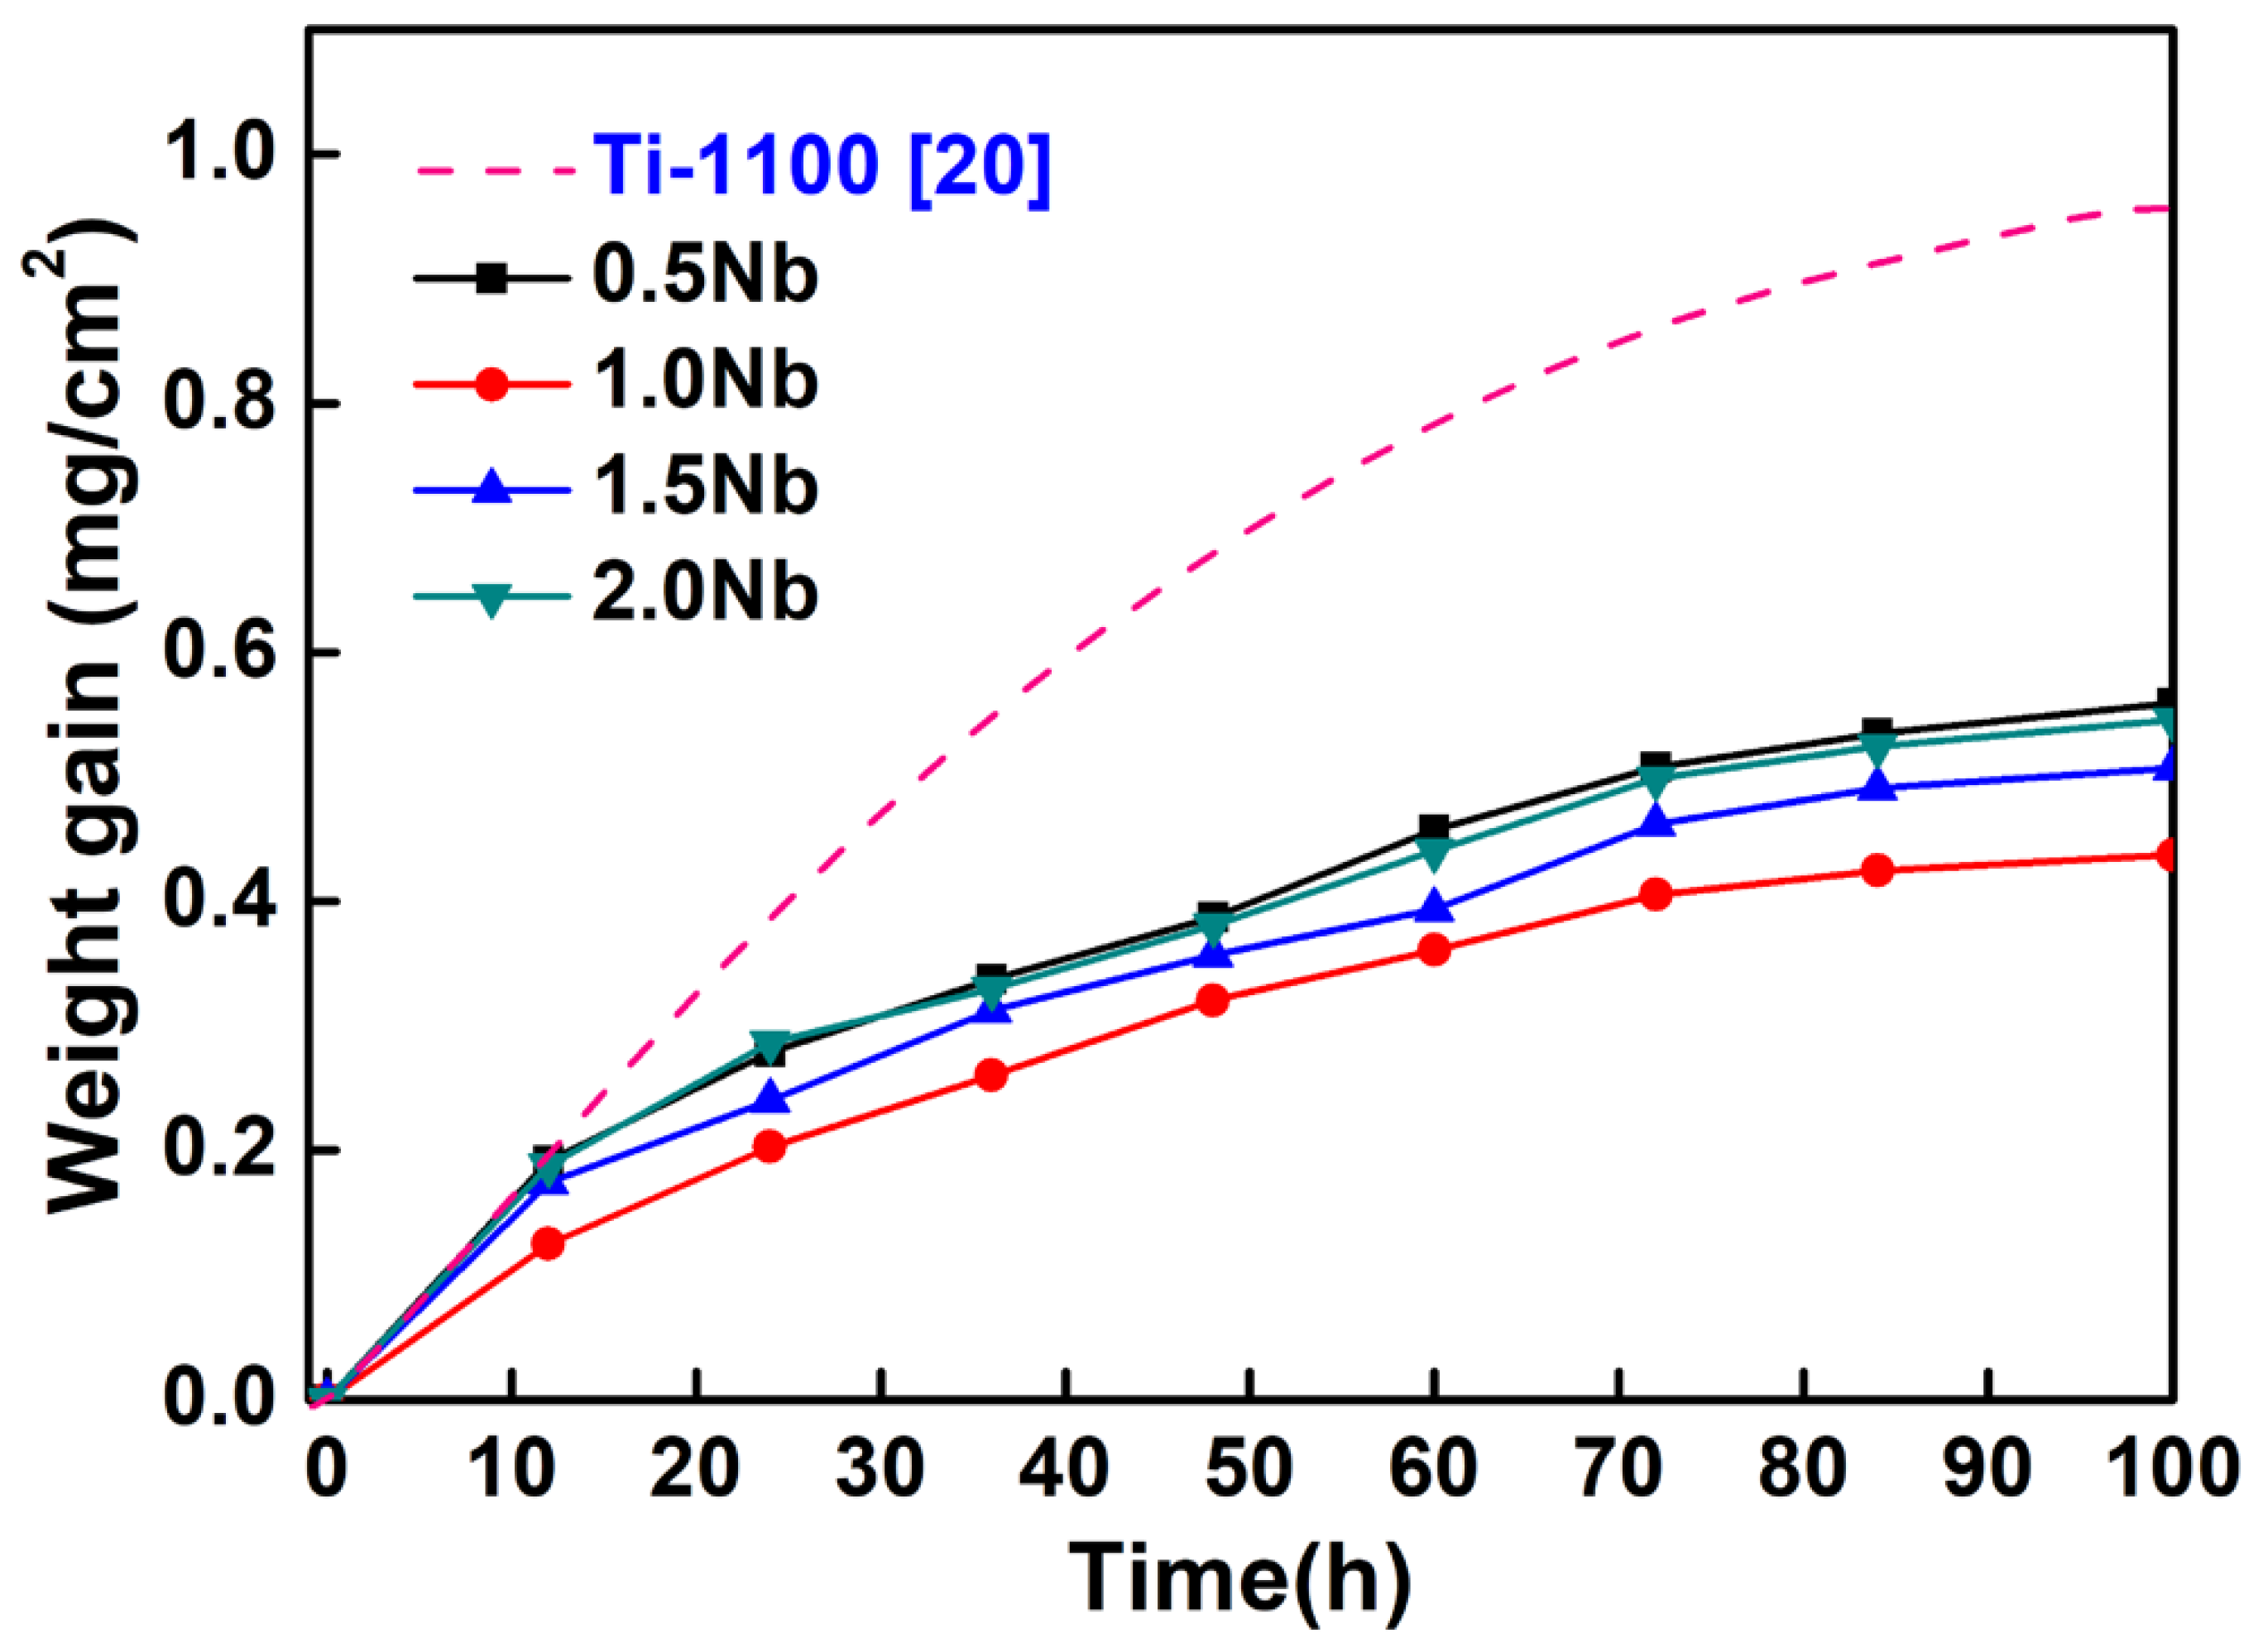
Figure 3 refers to the average weight gains per unit oxidation surface (ΔW/A) of Ti-1100-xNb (x = 0.5, 1.0, 1.5, 2.0) alloys and Nb-free Ti-1100 alloy [20] cyclic oxidized at 650 °C in an atmospheric environment for up to 100 h. The results indicate that all the average weight gains of the same composition alloy increase with the increase of oxidation time. The average weight gains of the alloys for 100 h oxidation decrease firstly and then increase with the increase of Nb content, and its value is 0.89, 0.56, 0.43, 0.51, and 0.55 mg/cm2, respectively. All the weight gains of Nb-added alloys are lower than that of Nb-free alloys, which shows that Nb can significantly improve the oxidation resistance. It also can be seen that the weight gain curves of the alloys follow a parabolic oxidation kinetic model, indicating that the oxidation process was controlled by diffusion [21]. The oxidation kinetics can be described by the Equation (1) [21,22]:
(ΔW/A)n = knt
where ΔW/A is the weight gain per unit surface area, n is the oxidation reaction index, kn is the oxidation rate constant, and t is the time.
According to the regression analysis of the curves in Figure 3, the values of the oxidation reaction index (n) were presented in Table 2. When n = 1, the oxidation kinetics curve followed the liner law, and if n = 2, the oxidation kinetics curve followed the parabolic law [21]. It can be seen that all the values of n are close to 2, and the corresponding coefficient of determination R2 of n values are 0.996, 0.989, 0.995 and 0.995, respectively. Therefore, the parabolic model was confirmed to fit well with the oxidation kinetic behavior.
Figure 4 shows a plot of (ΔW/A)2 versus oxidation time for determination the parabolic oxidation rate constant (kp) of the investigated alloys. kp values can be obtained from the slope of regression curves of Figure 4 and the results are presented in Table 3. It can be seen that kp values decrease firstly and then increase with the increase of Nb content. The corresponding coefficient of determination R2 of kp values are 0.990, 0.981, 0.988 and 0.989, respectively. The Ti-1100-1.0Nb alloy has the lowest kp value, which revealed the best oxidation resistance property.

3.3. Phase Composition of the Oxidized Surface

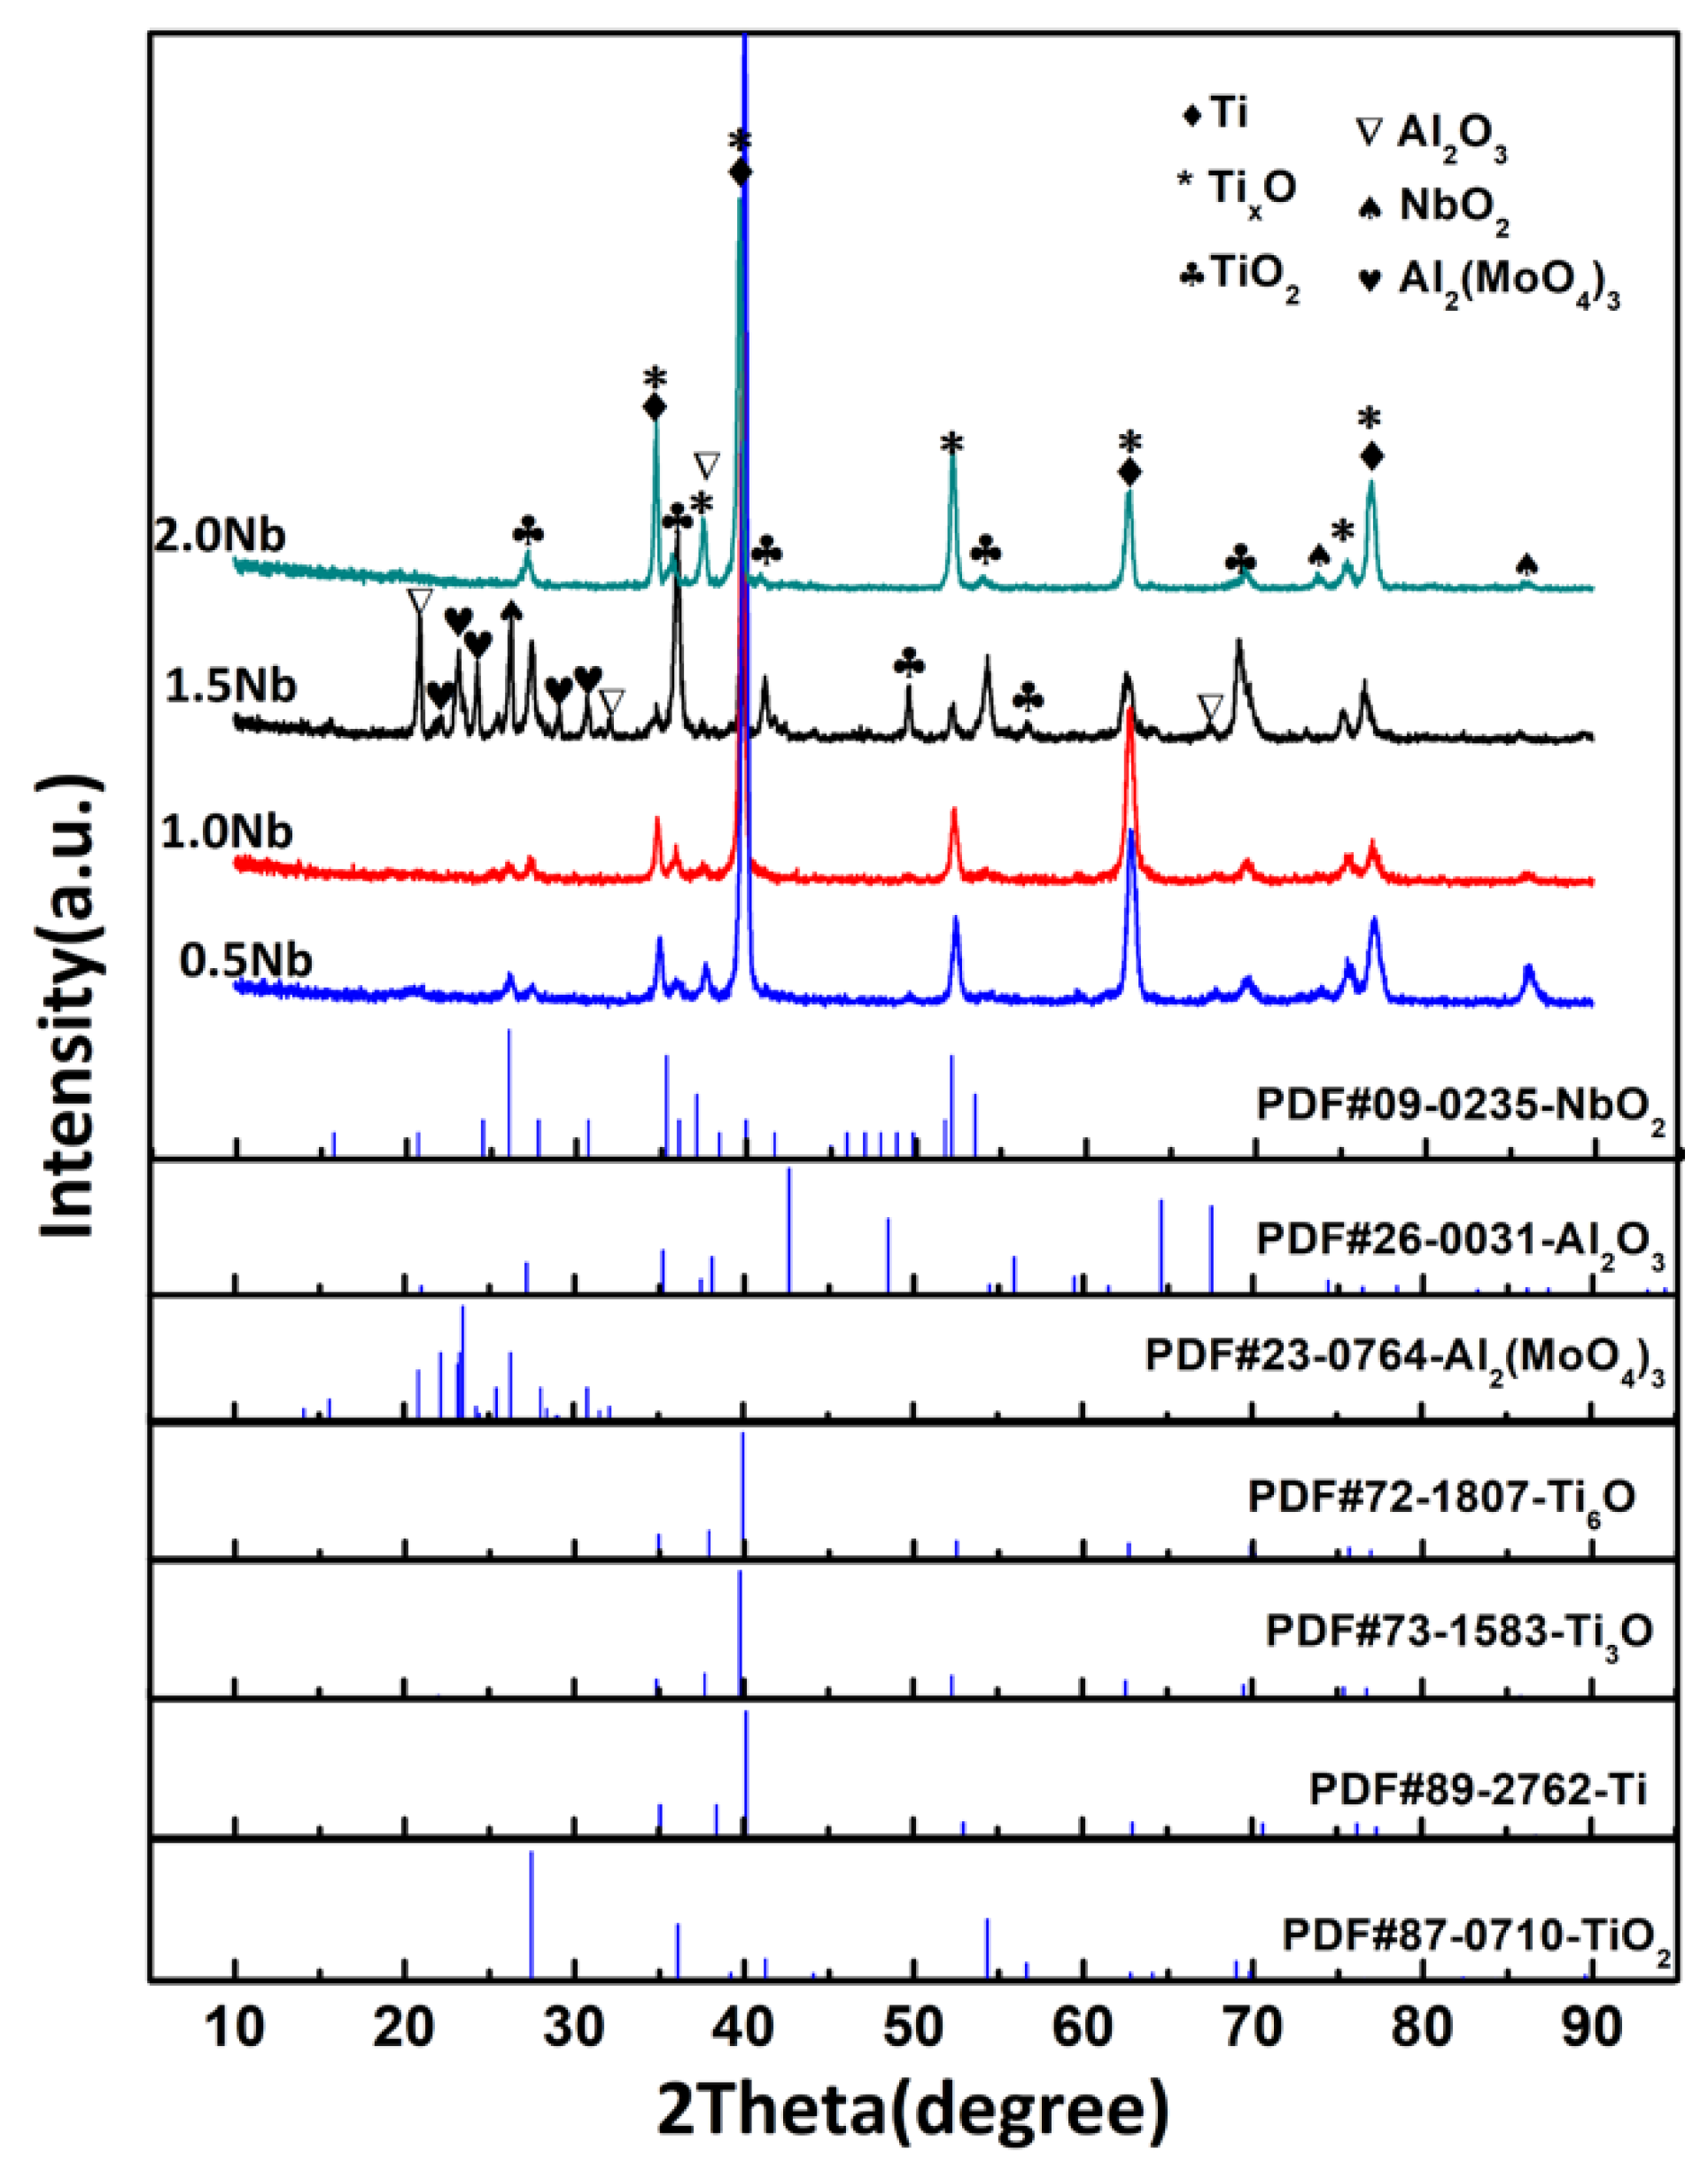
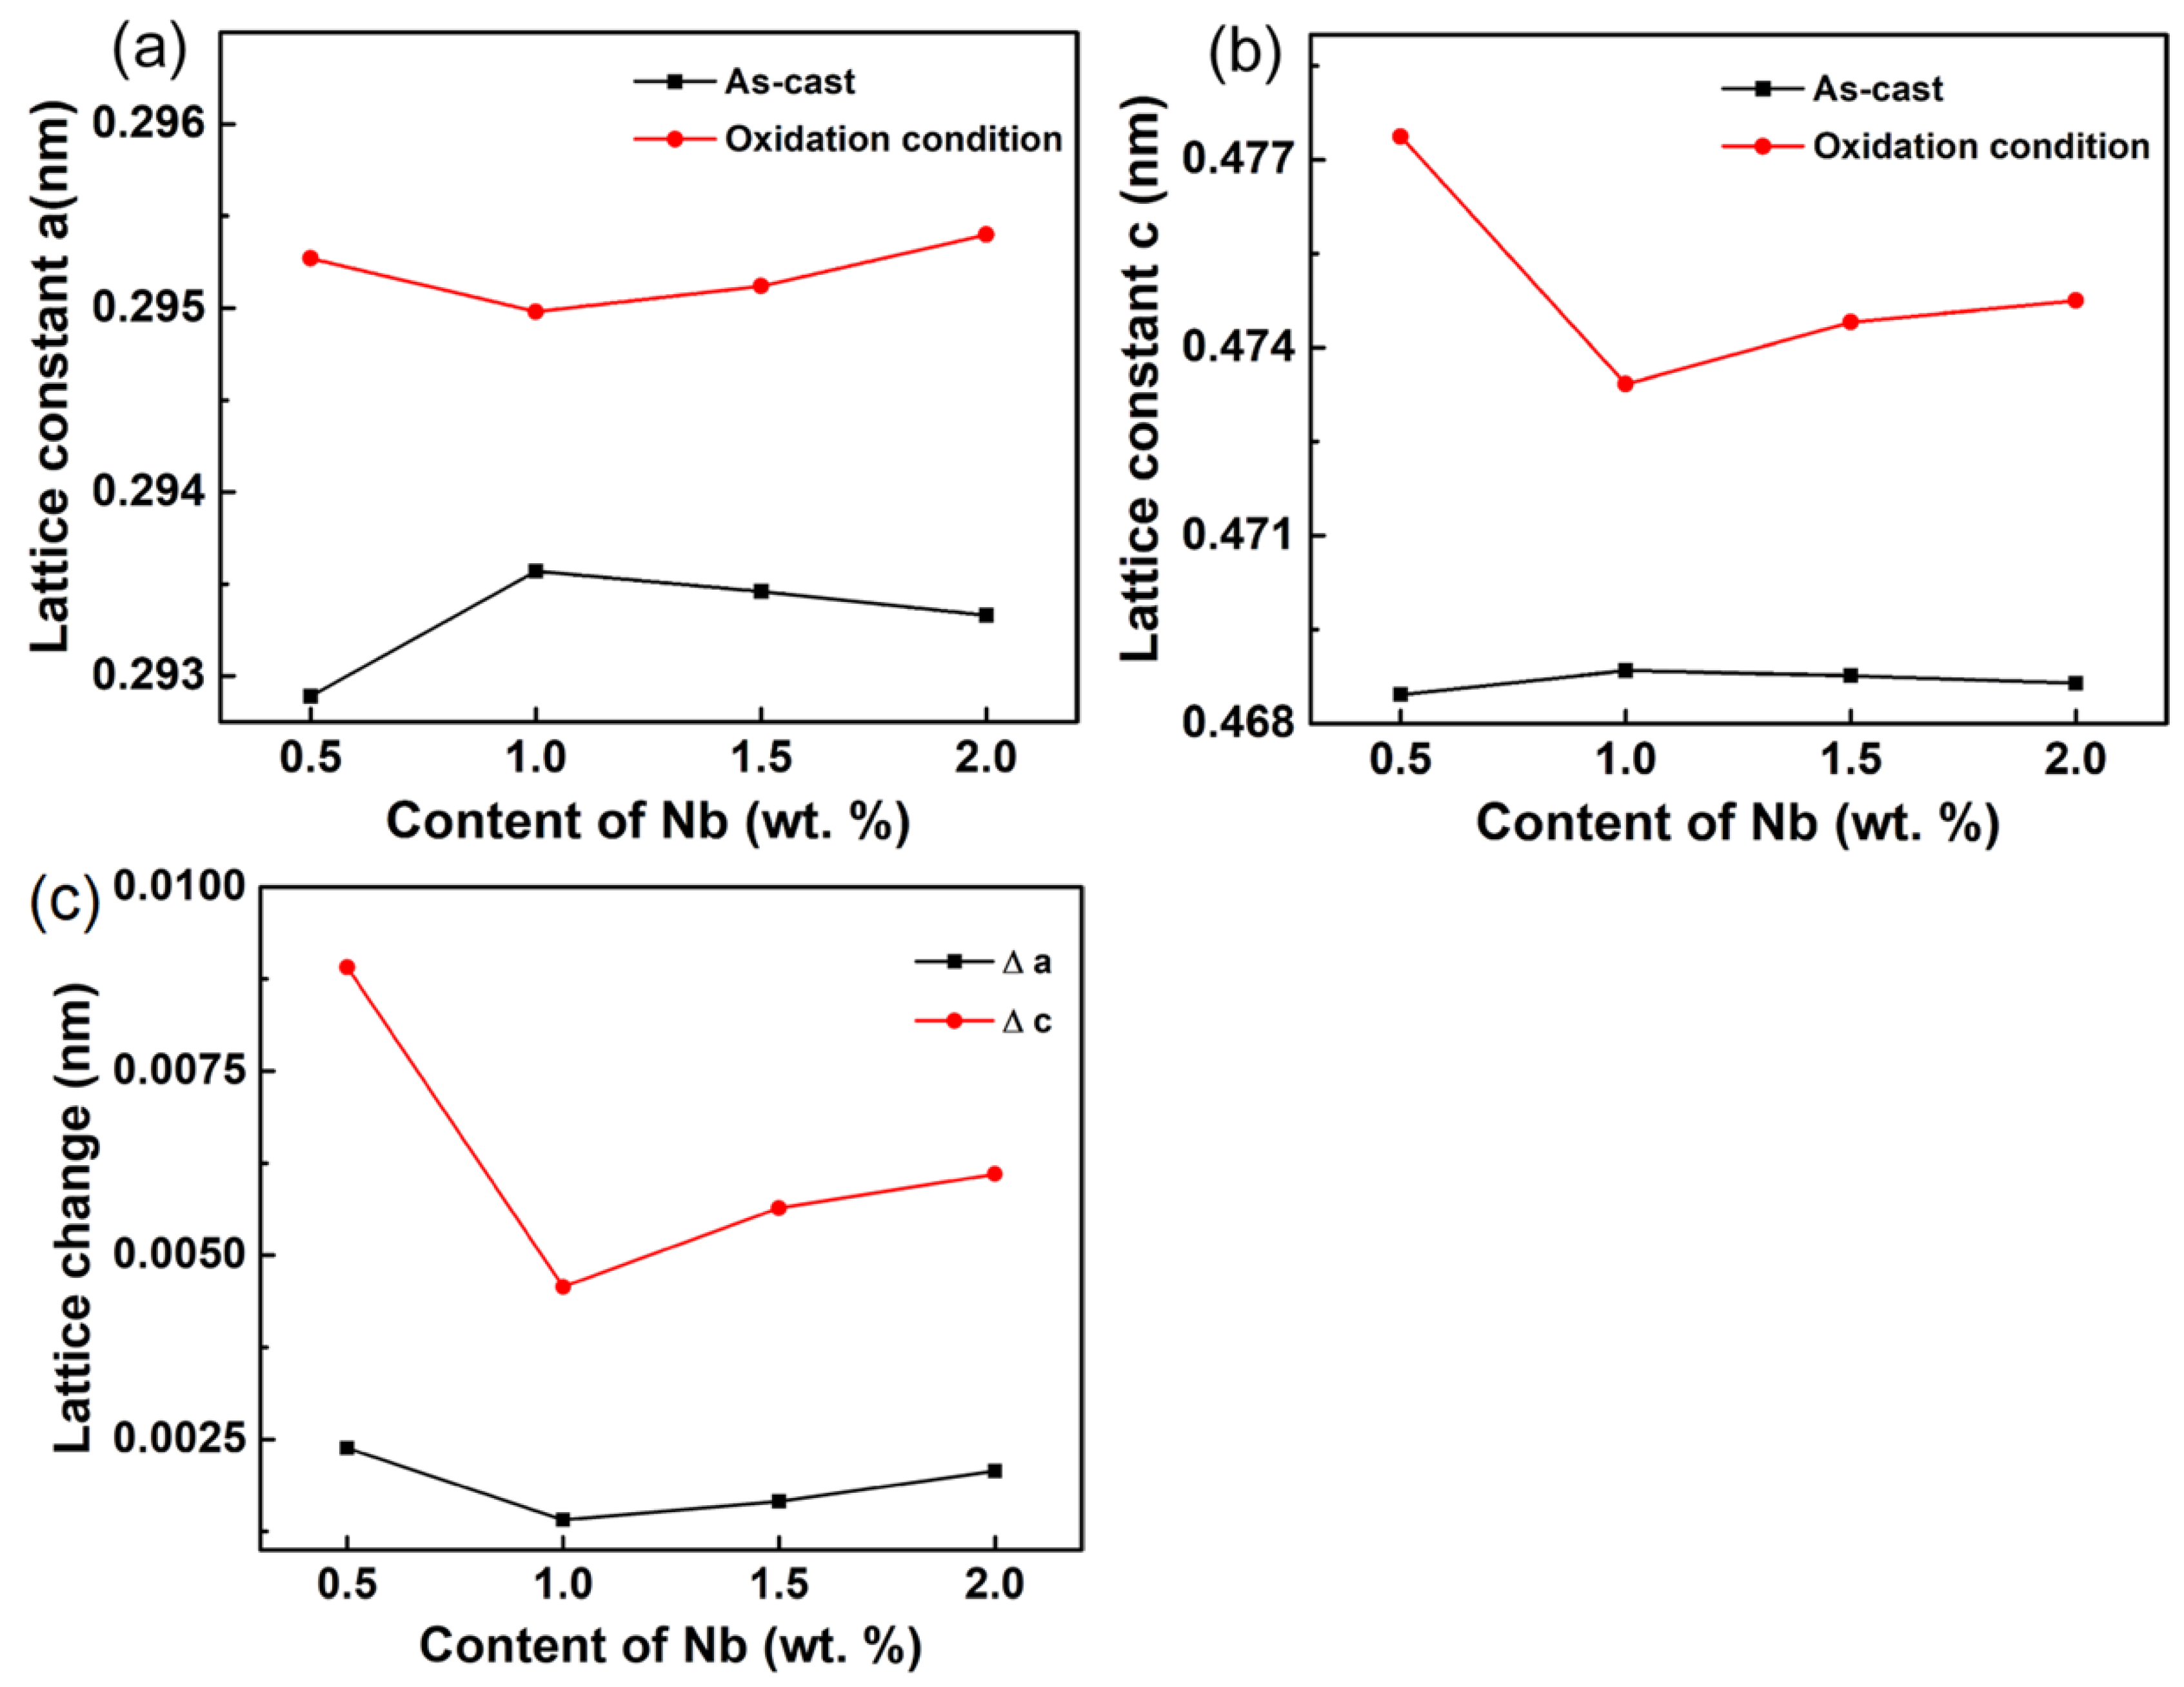
Figure 5 shows the XRD patterns of oxidized surface of the Ti-1100-xNb (x = 0.5, 1.0, 1.5, 2.0) near α titanium alloys under oxidation at 650 °C for 100 h. Rutile-TiO2, TixO (x = 3, 6), NbO2, Al2O3, and Al2(MoO4)3 were detected as major oxidation products on the surface. It also can be seen that the peak intensity in Figure 5 changes irregularly, and the local unusual peak intensity may be caused by preferred crystallographic orientation, or residual stress during the oxidation process, which needs further study. The lattice constant of α-Ti of the as-cast Ti-1100-xNb alloys before and after oxidized at 650 °C for 100 h are calculated by XRD refinement, and the results are presented in Table 4 and Figure 6. It can be seen that both the lattice parameters ‘a’ and ‘c’ of the as-cast alloys first rise and then decrease, with the increase of Nb content. Nb can replace titanium atoms in α-Ti lattice to form substitutional solid solution inducing an increase in the lattice parameter. However, the continue addition of Nb decreases the silicon solid solubility in Ti to promote the formation of β and silicide phases, which caused the α-Ti lattice contraction [7]. When the as-cast Ti-1100-xNb alloys are oxidized at 650 °C for 100 h, both the lattice parameters ‘a’ and ‘c’ increase due to the small size interstitial oxygen dissolving into the lattice. And the lattice expansion in the c-axis direction is more severe (Figure 6c), which is consistent with the findings of Baillieux et al. [23]. Jostsons et al. showed that the solution of O atoms in α-Ti lattice can reach 34 at.% [24]. It is also found that the Ti-1100-1.0Nb has the minimal lattice changes (Figure 6c), which shows the best lattice stability.
The massive solid solutions of O atoms in α-Ti can promote the formation of the low valence titanium oxide TixO (x = 3, 6) near the matrix surface, and the XRD analysis has proved the existence of Ti3O and Ti6O (Figure 5). Thermodynamic Equations (2)–(4) [25] at 650 °C showed that NbO2 was easy to form but with the lower stability, however the Al2O3 was more difficult to be formed in spite of the best stability. The lower Nb content and oxidation temperature caused the weak peak intensity of NbO2 and Al2O3.
Nb (s) + O2 (g) = NbO2 (s) ΔG = −626.1 kJ/mol
Ti (s) + O2 (g) = TiO2 (s) ΔG = −776.0 kJ/mol
2 Al (s) +3/2 O2 (g) = Al2O3 (s) ΔG = −1386.3 kJ/mol
With the increase of Nb content, the diffraction peak intensity of TiO2 and Al2O3 became stronger, and the peak of TixO constantly decreased. This phenomenon illustrated that the solution interstices of oxygen are captured by Nb atom, and the research shows that Nb atoms may take place the Ti atoms in the α-Ti lattice and it can promote the formation of TiO2 and Al2O3 [10]. The Al2(MoO4)3 phase was first discovered in oxidation surface of Ti-1100-1.5Nb oxidation at 650 °C, and its peak is stronger. The standard Gibbs free energy of formation Al2(MoO4)3 at 650 °C (Equation (6)) can be obtained from the thermodynamic Equations (4) and (5) [25]. The negative value proves that the Al2(MoO4)3 phase can be formed spontaneously.
Mo (s) + 3/2 O2 (g) = MoO3 (s) ΔG = −626.1 kJ/mol
2 Al (s) + 3 Mo (s)+ 6 O2 (g) = Al2(MoO4)3 (s) ΔG = −2922.9 kJ/mol

3.4. Surface Morphology of the Oxidized Surface

Figure 7 displays the surface morphology of Ti-1100-xNb (x = 0.5, 1, 1.5, 2) alloys after oxidation for 100 h at 650 °C. The TiO2 with morphology of massive (Figure 7b) and acicular (Figure 7d) could be identified on the oxidation surfaces according to the EDS analysis results of Table 5. It is also found that the Ti-1100-0.5Nb alloy has finest acicular TiO2 and lower density porosity, which can inhabit the internal diffusion of O atoms and the growth of the oxide-film. With the increase of Nb content, some bright white particles with high oxide-layer density appeared on the surface, as shown in Figure 7c,d. The white oxide particles are the Mo-oxide which was proved by EDS in Table 5 (Area 3). The continuous oxide film can be found on the surface of Ti-1100-1.5Nb alloy. And it can be indexed as Al2(MoO4)3 according to the EDS (Table 5) as well as XRD (Figure 5) analyses. The Al2(MoO4)3 might be formed by the reaction between the MoO3 and the Al2O3, which was also confirmed by Heracleous et al. [26]. The atomic radius of Al, Ti, Mo is 0.143, 0.145 and 0.140 nm, respectively, which illustrate the Mo and Al solubilized in α-Ti lattice could cause the small distortion energy [27]. Table 5 (Areas 3 and 4) shows the enrichment of Mo and Al on the oxidized surface, so it is easy to form the MoO3 and Al2O3 on the near surface due to the lower ionization energy of Mo atoms and the higher covalent bond of Al-O [28,29]. Thus, a continuous Al2(MoO4)3 was formed on the matrix surface. It is found that the new nucleus is easy to form at the grain boundary, because it can promote more growth steps. The massive growth steps and rough growth interface can increase the nucleation rate and growth rate. Therefore, it can be concluded that the mass gains of Ti-1100-1.5Nb alloys exposed at 650 °C were mainly contributed by the Al2(MoO4)3 oxide-layer growth instead of the internal diffusion of O. Low valence oxides Ti3O, Ti6O have the same crystal structure (hcp) and similar lattice constant, and the O atoms easily dissolve in the octahedral of the α-Ti lattice to form an ordered structure [30]. Therefore, the Ti3O, Ti6O oxides can be identified by the α-Ti matrix (Figure 7b).
The XRD analysis presented in Figure 5 showed that NbO2 and Al2O3 oxides were also existed on the oxidation surfaces. However, they could not be recognized in Figure 7. The Nb dissolved in Ti-1100 alloy lattices can promote the precipitation of the silicide and the formation of TiO2 [7,31]. Therefore, the formation of NbO2 may be less and finer, which was invisible. In addition to the combination of Al2O3 and MoO3 to form Al2(MoO4)3 (Figure 7f), the Al2O3 oxide may also have a uniform fine particle distribution, which was not easy to find. As mentioned above, TiO2 has a different morphology. The crystal structure of rutil-TiO2 is the tetragonal with lattice constants of a = 0.4589 nm and c = 0.2954 [32,33]. Nb atoms may replace randomly Ti atoms at the corner of the tetragonal lattice, leading to the lattice expansion. Research pointed out that the energy barrier formed by Nb-O is lower than that of Ti-O [34]. Therefore, the crystal surface enriched by Nb was easy to capture the O atoms, which promotes the growth of this crystal planes. When Nb is randomly distributed in the TiO2 crystal, the crystal growth will show anisotropy, and the single crystal of TiO2 has massive structure. When Nb is distributed symmetrically on the crystal surface, crystal growth shows orientation, and the single crystal of TiO2 has a flake structure. TiO2 can grow with one dimensional along a certain direction to form acicular structure if no impurity atoms entered the lattice.

3.5. Cross-Section Morphologies and Elemental Profiles of the Oxide Layers

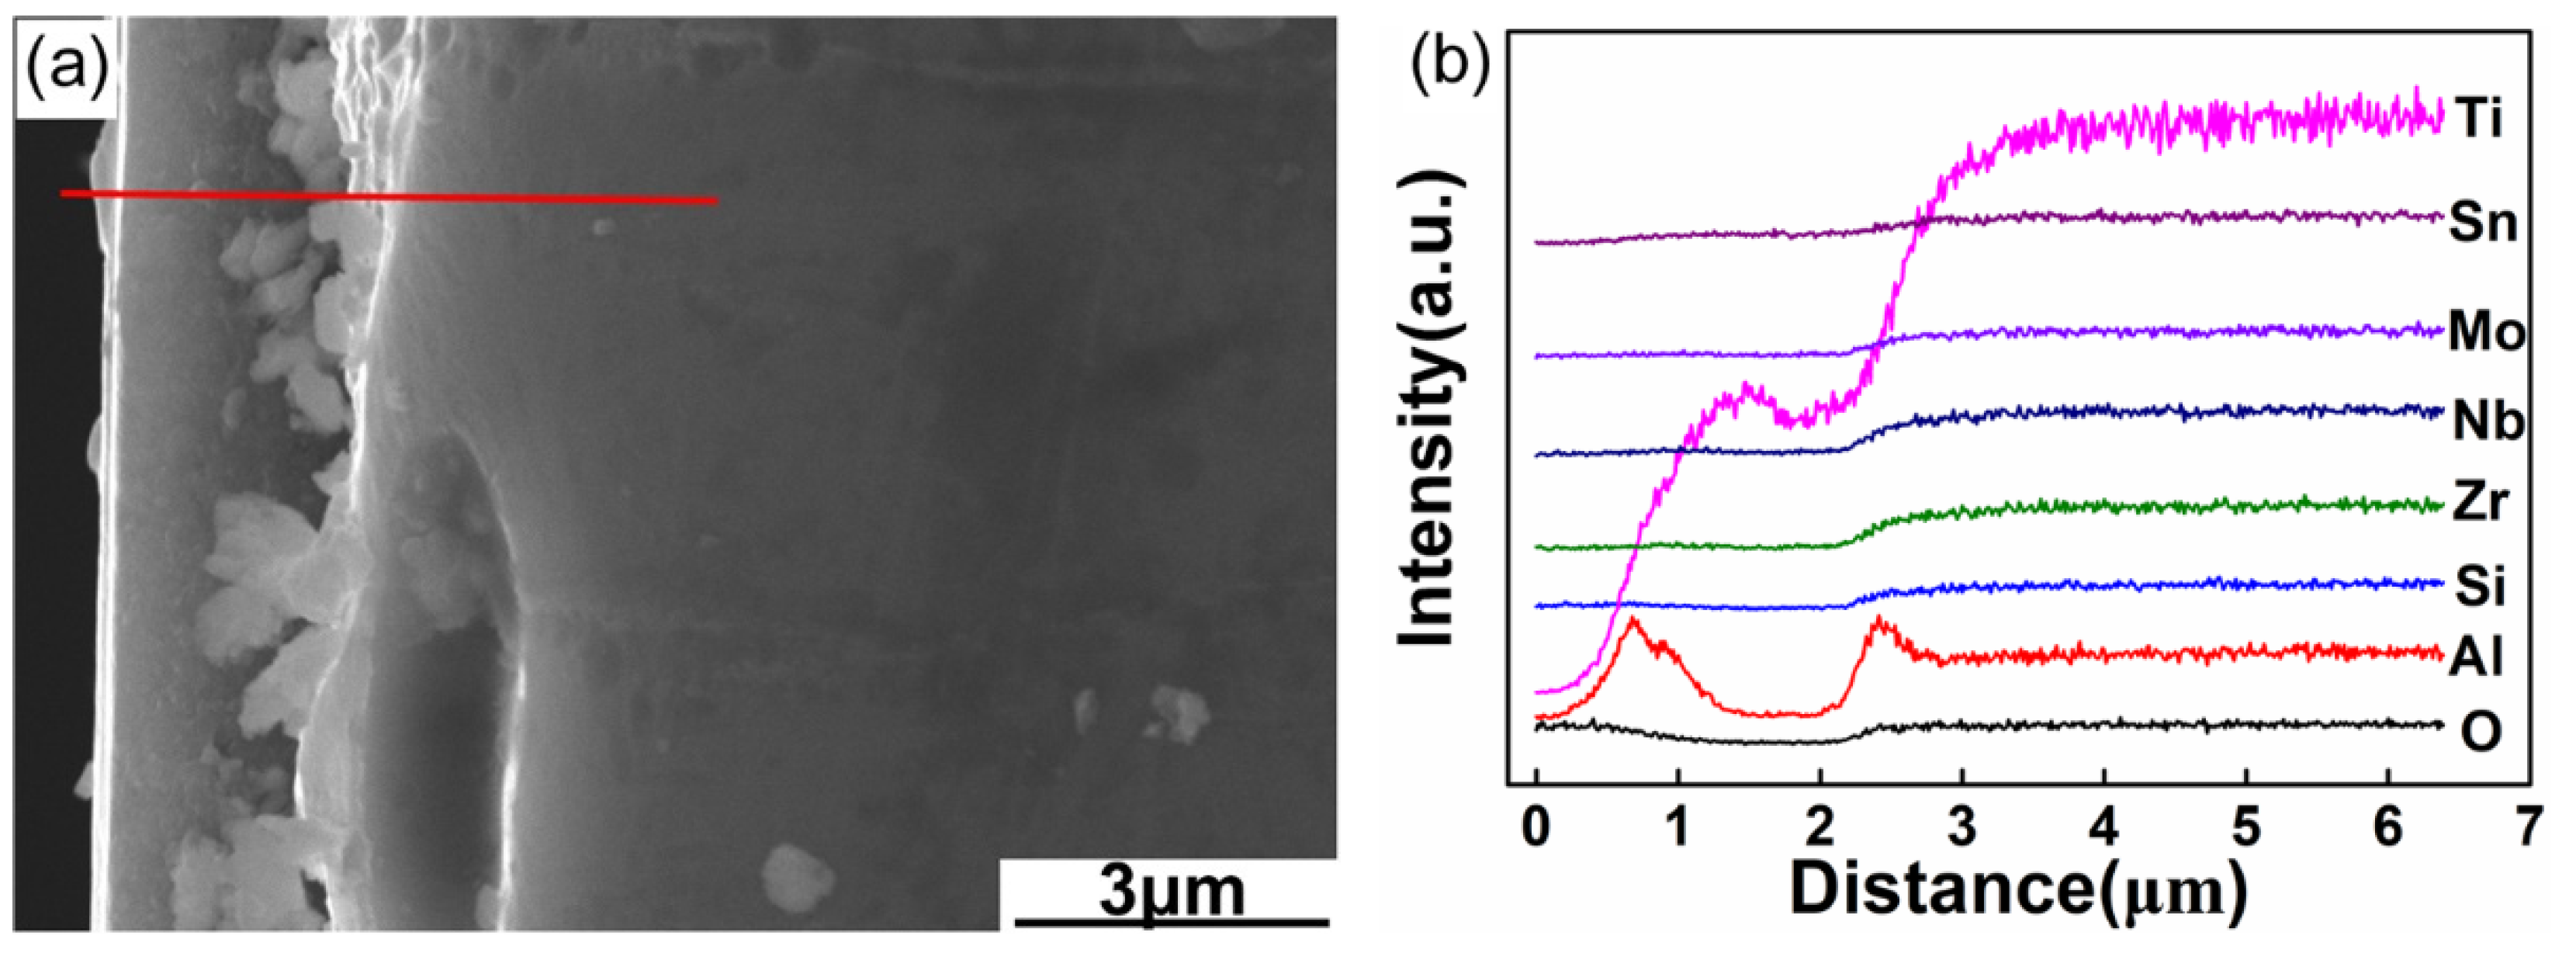
Figure 8 shows the cross-section morphologies and elemental distribution curves of the oxidation surfaces of Ti-1100-xNb (x = 0.5, 1, 1.5, 2) alloys for 650 °C oxidation during 100 h. The oxide-layer is mainly composed of surface oxide-film and oxygen diffusion layer. Thickness of oxide-layer is 3.2, 1.8, 4.2 and 4.9 µm, respectively, with the increase of Nb content. It can be seen that the oxide layer increases firstly and then decreases, which was consistent with the weight gain law of the titanium alloys. Ti-1100-1.0Nb alloy has the minimum weight gains and oxide-layer thickness, which is conducive to the protection of slender TiO2 and the lower density porosity TixO (x = 3, 6) based microstructure (Figure 8d). Meanwhile, the enrichment Nb atoms can absorb the O atoms to refrain the internal diffusion of O atoms.
When the Nb content increases to 1.5 wt.%, there were the enriched layers of Mo, Nb and Al atoms near the oxide-surface, and its thickness reaches to 1.2 µm, as seen in Figure 8f. It can be identified as Al2(MoO4)3 layer according to the previous analysis. Some micropores in the Al2(MoO4)3 oxide-layer revealed its bad binding properties with the subsurface microstructure, which can lead to the peel off of the oxide-layer. It can also be found that Zr, Si have a slight fluctuation in Figure 8f,h. The enrichment Zr, Si and α-Ti in the interface may produce other compounds, such as (TiZr)6Si3 type silicide with the increase of Nb content [7], which caused the TiO2 oxide-film to crack and peel.
The growth rate of oxide-film can be determined by the Wagner model, as shown in Equation (7) [35]:
J O 2   =   C O 2   v O 2 =   C O 2 B O 2 ( u O 2 x +   Z O 2 F x )
where J O 2 is the diffusive flux of O ion, C O 2 is the concentrations of O ion, v O 2 is the diffusion rate of O ion, B O 2 is the mobility of O ion, u O 2 x is the concentration gradient of O ion, Z O 2 is the particles charge, F is the Faraday constant, x is electric potential.
The Wagner’s equation indicates that the driving force of internal diffusion of O atoms is electric potential gradient and concentration gradient. The diffusion rate of O ion is accelerated under the driving force of electric potential and concentration gradient. And there are a lot of oxygen vacancies in the segregation of elements or porosity area, which can promote the internal diffusion of O2−. On the contrary, the formation of compact oxide-film can reduce the O2− concentration on the oxide surface. Nb can capture the O2− in α-Ti lattice to form the ionic bond to reduce the electric potential gradient of O2−, which can inhibit the further diffusion of O atoms to the internal of matrix and effectively improve the oxidation resistance of titanium. Moreover, the interaction of Nb, O, Ti, and other elements can also retard the diffusion of O atoms into the alloys, which will further improve the oxidation resistance property.
In summary, the influence of adding Nb element on improving the high temperature oxidation resistance was quantitatively presented, with discussion on the role of Nb on surface oxide formation. However, the excessive addition of Nb may deteriorate the mechanical properties of the substrate, especially for the plasticity. So, how to balance the relationship between high temperature oxidation resistance and mechanical properties when choosing alloy composition should be considered in the future research.

4. Conclusions

  • With the increase of Nb content, both the α-Ti lattice parameters ‘a’ and ‘c’ of the as-cast alloys first rise and then decrease.
  • Adding Nb to Ti-1100 alloy did not change the microstructure classification of the alloys, and the space between α-laths decreases first and then increases with the increase of Nb content.
  • Nb can significantly improve the high temperature oxidation resistance. The oxidation behaviors of the alloys follow a parabolic kinetic model. The parabolic oxidation rate decreased firstly and then increased with the increase of Nb content. The Ti-1100-1.0Nb alloy has the lowest kp value, which is 5.7 × 10⁻¹³.
  • Surface oxidation products are mainly composed of rutile-TiO2, TixO (x = 3, 6), NbO2 and Al2O3. The morphology of TiO2 is massive and acicular. Al2(MoO4)3 as the mainly oxide was first detected in the Ti-1100-1.5Nb alloys.
  • A novel oxidation resistance was obtained in the Ti-1100-1.0Nb alloy. The interaction of Nb, O, Ti, and other elements retarded the diffusion of O atoms into the alloys, which improved the oxidation resistance property as a result.

Author Contributions

Conceptualization, B.F. and J.L.; methodology, B.F.; validation, Y.S., T.D. and G.L.; formal analysis, F.W. and X.Z.; data curation, F.W. and Y.S.; writing—original draft preparation, Y.S. and T.D.; writing—review and editing, B.F.; supervision, J.L. and G.L.; project administration, X.Z.; funding acquisition, B.F. and X.Z. All authors have read and agreed to the published version of the manuscript.

Funding

This work was financially supported by the National Natural Science Foundation of China (NSFC) under Grant No. 51601054, the Natural Science Foundation of Hebei Province of China under Grant Nos. E2017202095 and E2016202100, the Scientific and Technological Transformative Project of Tianjin Supporting Beijing-Tianjin-Hebei under Grant No. 18YFCZZC00030.

Conflicts of Interest

The authors declare no conflict of interest.

References

  1. Shams, S.A.A.; Mirdamadi, S.; Abbasi, S.M.; Lee, Y.; Lee, C.S. Coarsening kinetics of primary alpha in near alpha titanium alloy. J. Alloys. Compd. 2018, 735, 1769–1777. [Google Scholar] [CrossRef]
  2. Fu, B.G.; Wang, H.W.; Zou, C.M.; Wei, Z.J. The influence of Zr content on microstructure and precipitation of silicide in as-cast near α titanium alloys. Mater. Charact. 2015, 99, 17–24. [Google Scholar] [CrossRef]
  3. Madsen, A.; Ghonem, H. Effects of aging on the tensile and fatigue behavior of the near-α Ti-1100 at room temperature and 593 °C. Mater. Sci. Eng. A 1994, 177, 63–73. [Google Scholar] [CrossRef]
  4. Chandravanshi, V.; Sarkar, R.; Kamat, S.V.; Nandy, T.K. Effects of thermomechanical processing and heat treatment on the tensile and creep properties of boron-modified near alpha titanium alloy Ti-1100. Metall. Mater. Trans. A 2013, 44, 201–211. [Google Scholar] [CrossRef]
  5. Ouyang, P.X.; Mi, G.B.; Li, P.J.; He, L.J.; Cao, J.X.; Huang, X. Non-isothermal oxidation behavior and mechanism of a high temperature near-α titanium alloy. Materials 2018, 11, 2141. [Google Scholar] [CrossRef] [Green Version]
  6. Alam, M.Z.; Das, D.K. Effect of cracking in diffusion aluminide coatings on their cyclic oxidation performance on Ti-based IMI-834 alloy. Corros. Sci. 2009, 51, 1405–1412. [Google Scholar] [CrossRef]
  7. Fu, B.G.; Wang, H.W.; Zou, C.M.; Wei, Z.J. The effects of Nb content on microstructure and fracture behavior of near α titanium alloys. Mater. Des. 2015, 66, 267–273. [Google Scholar] [CrossRef]
  8. Dai, J.J.; Zhu, J.Y.; Chen, C.Z.; Weng, F. High temperature oxidation behavior and research status of modifications on improving high temperature oxidation resistance of titanium alloys and titanium aluminides: A review. J. Alloys. Compd. 2016, 685, 784–798. [Google Scholar] [CrossRef]
  9. Fargas, G.; Roa, J.J.; Sefer, B.; Pederson, R.; Antti, M.L.; Mateo, A. Influence of cyclic thermal treatments on the oxidation behavior of Ti-6Al-2Sn-4Zr-2Mo alloy. Mater. Charact. 2018, 145, 218–224. [Google Scholar] [CrossRef]
  10. Zhang, S.Z.; Zhou, B.; Liu, N.; Chen, L.Q. Effects of microstructure and rare-earth constituent on the oxidation behavior of Ti-5.6Al-4.8Sn-2Zr-1Mo-0.35Si-0.7Nd titanium alloy. Oxid. Met. 2014, 81, 373–382. [Google Scholar] [CrossRef]
  11. Jiang, H.R.; Hirohasi, M.; Lu, Y.; Imanari, H. Effect of Nb on the high temperature oxidation of Ti-(0-50 at.%) Al. Scripta. Mater. 2002, 46, 639–643. [Google Scholar] [CrossRef]
  12. Pflumm, R.; Donchev, A.; Mayer, S.; Clemens, H.; Schütze, M. High-temperature oxidation behavior of multi-phase Mo-containing γ-TiAl-based alloys. Intermetallics 2014, 53, 45–55. [Google Scholar] [CrossRef]
  13. Lin, J.P.; Zhao, L.L.; Li, G.Y.; Zhang, L.Q.; Song, X.P.; Ye, F.; Chen, G.L. Effect of Nb on oxidation behavior of high Nb containing TiAl alloys. Intermetallics 2011, 19, 131–136. [Google Scholar] [CrossRef]
  14. Zheng, N.; Quadakkers, W.J.; Gil, A.; Nickel, H. Studies concerning the effect of nitrogen on the oxidation behavior of TiAl-based intermetallics at 900° C. Oxid. Met. 1995, 44, 477–499. [Google Scholar] [CrossRef]
  15. Pérez, P.; Haanappel, V.A.C.; Stroosnijder, M.F. The effect of niobium on the oxidation behavior of titanium in N2/20% O2 atmospheres. Mater. Sci. Eng. A 2000, 284, 126–137. [Google Scholar] [CrossRef]
  16. Yoshihara, M.; Miura, K. Effects of Nb addition on oxidation behavior of TiAl. Intermetallics 1995, 3, 357–363. [Google Scholar] [CrossRef]
  17. Shida, Y.; Anada, H. The influence of ternary element addition on the oxidation behaviour of TiAl intermetallic compound in high temperature air. Corros. Sci. 1993, 35, 945–953. [Google Scholar] [CrossRef]
  18. Eylon, D.; Fujishiro, S.; Postans, P.J.; Froes, F.H. High temperature titanium alloys-a review. JOM 1984, 36, 55–62. [Google Scholar] [CrossRef]
  19. Gehring, D.; Monroe, J.A.; Karaman, I. Effects of composition on the mechanical properties and negative thermal expansion in martensitic TiNb alloys. Scripta. Mater. 2020, 178, 351–355. [Google Scholar] [CrossRef]
  20. Cui, W.F.; Wei, H.R.; Luo, G.Z.; Hong, Q.; Zhou, L. Oxidation behaviour of IMI 834 and Ti-1100 alloys at high temperature of 550 °C to 750 °C. Rare. Metal. Mat. Eng. 1997, 26, 31–35. [Google Scholar]
  21. Aniołek, K.; Kupka, M.; Łuczuk, M.; Barylski, A. Isothermal oxidation of Ti-6Al-7Nb alloy. Vacuum 2015, 114, 114–118. [Google Scholar] [CrossRef]
  22. Lee, H.S.; Yoon, J.H.; Yi, Y.M. Oxidation behavior of titanium alloy under diffusion bonding. Thermochim. Acta. 2007, 455, 105–108. [Google Scholar] [CrossRef]
  23. Baillieux, J.; Poquillon, D.; Malard, B. Observation using synchrotron X-ray diffraction of the crystallographic evolution of α-titanium after oxygen diffusion. Phil. Mag. Lett. 2015, 95, 245–252. [Google Scholar] [CrossRef] [Green Version]
  24. Jostsons, A.; Malin, A.S. The ordered structure of Ti3O. Acta. Crystallogr. B 1968, 24, 211–213. [Google Scholar] [CrossRef]
  25. Chase, M.W. NIST-JANAF Thermochemical Tables, 4th ed.; National Institute of Standards and Technology: Gaithersburg, MD, USA, 1998.
  26. Heracleous, E.; Lee, A.F.; Vasalos, I.A.; Lemonidou, A.A. Surface properties and reactivity of Al2O3-supported MoO3 catalysts in ethane oxidative dehydrogenation. Catal. Lett. 2003, 88, 47–53. [Google Scholar] [CrossRef]
  27. Smith, D.W. Inorganic Substances: A Prelude to the Study of Descriptive Inorganic Chemistry; Cambridge University Press: New York, NY, USA, 1990. [Google Scholar]
  28. Chen, L.; Cooper, A.C.; Pez, G.P.; Cheng, H.S. On the mechanisms of hydrogen spillover in MoO3. J. Phys. Chem. C 2008, 112, 1755–1758. [Google Scholar] [CrossRef]
  29. Nordahl, C.S.; Messing, G.L. Sintering of α-Al2O3-seeded nanocrystalline γ-Al2O3 powders. J. Eur. Ceram. Soc. 2002, 22, 415–422. [Google Scholar] [CrossRef]
  30. Zhong, X.; Xu, M.L.; Yang, L.L.; Qu, X.; Yang, L.H.; Zhang, M.; Liu, H.Y.; Ma, Y.M. Predicting the structure and stability of titanium oxide electrides. NPJ Comput. Mater. 2018, 4, 1–6. [Google Scholar] [CrossRef]
  31. Berthaud, M.; Popa, I.; Chassagnon, R.; Heintz, O.; Lavkovά, J.; Chevalier, S. Study of titanium alloy Ti6242S oxidation behaviour in air at 560 °C: Effect of oxygen dissolution on lattice parameters. Corros. Sci. 2020, 164, 108049. [Google Scholar] [CrossRef]
  32. Straumanis, M.E.; Ejima, T.; James, W.J. The TiO2 phase explored by the lattice constant and density method. Acta Crystallogr. 1961, 14, 493–497. [Google Scholar] [CrossRef]
  33. Lv, J.P.; Yang, J.Q.; Li, X.J.; Chai, Z.Y. Size dependent radiation-stability of ZnO and TiO2 particles. Dyes. Pigments. 2019, 164, 87–90. [Google Scholar] [CrossRef]
  34. Wang, Y.J.; Wang, J.F.; Chen, H.C.; Zhong, W.L.; Zhang, P.L.; Dong, H.M.; Zhao, L.Y. Electrical properties of SnO2-ZnO-Nb2O5 varistor system. J. Phys. D Appl. Phys. 2000, 33, 96–99. [Google Scholar]
  35. Birks, N.; Meier, G.H.; Pettit, F.S. Introduction to the High-Temperature Oxidation of Metals; Cambridge University Press: New York, NY, USA, 2006. [Google Scholar]
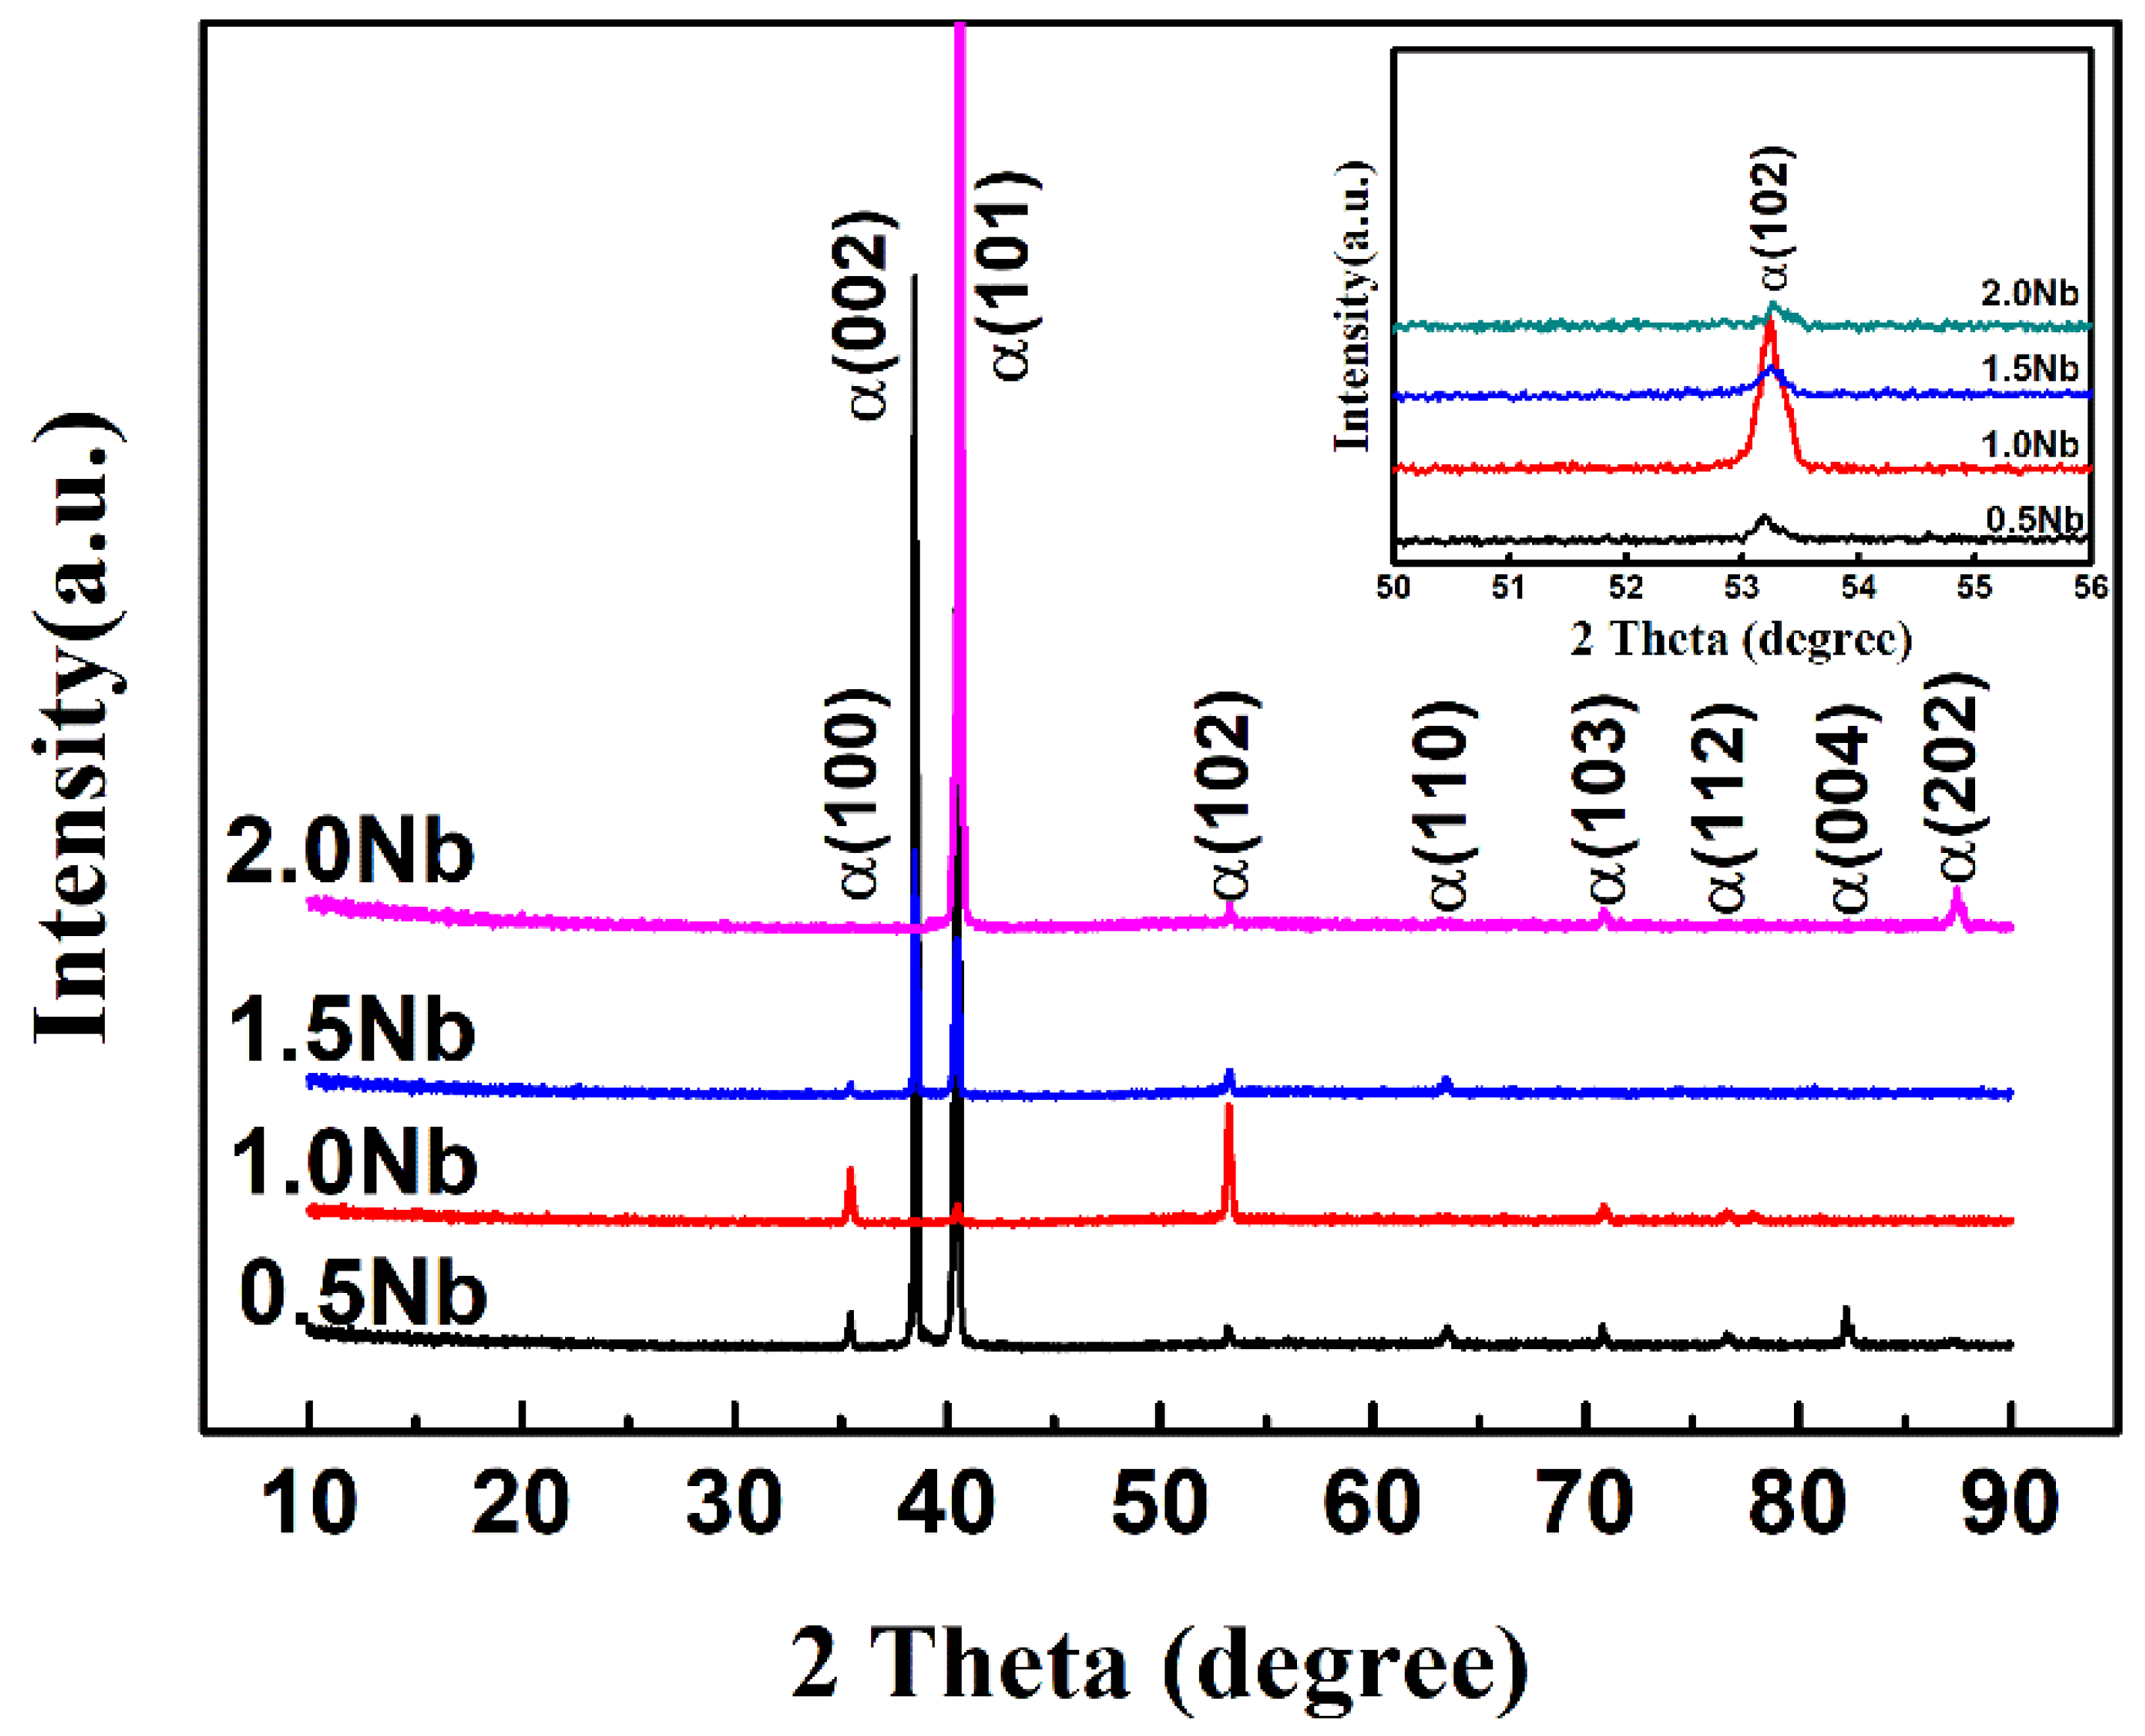
Figure 1. XRD patterns of the as-cast Ti-1100-xNb alloys.
Materials 13 01082 g001
Figure 2. OM microstructures of the as-cast Ti-1100 based alloys (a) Ti-1100-0.5Nb; (b) Ti-1100-1.0Nb; (c) Ti-1100-1.5Nb; (d) Ti-1100-2.0Nb.
Materials 13 01082 g002
Figure 3. Variation of average weight gain with respect to oxidation time of the investigated alloys oxidized at 650 °C.
Materials 13 01082 g003
Figure 4. A plot of (ΔW/A)2 vs. oxidation time for obtaining the parabolic oxidation rate constant.
Materials 13 01082 g004
Figure 5. XRD patterns of the Nb contained Ti-1100 alloys surface after oxidation during 100 h at the temperature of 650 °C.
Materials 13 01082 g005
Figure 6. Effect of Nb content on the α-Ti lattice constant (a) a; (b) c and (c) lattice change of the as-cast Ti-1100-xNb alloys before and after oxidized at 650 °C for 100 h.
Materials 13 01082 g006
Figure 7. Surface morphology of the as-cast Ti-1100 based alloys for 650 °C oxidation during 100 h (a), (b) Ti-1100-0.5Nb; (c), (d) Ti-1100-1.0Nb; (e), (f) Ti-1100-1.5Nb; (g), (h) Ti-1100-2.0Nb.
Materials 13 01082 g007
Figure 8. Cross-section morphologies and elemental distribution curves of the oxidation surfaces of the as-cast Ti-1100 based alloys after oxidation during 100 h at the temperature of 650 °C (a), (b) Ti-1100-0.5Nb; (c), (d) Ti-1100-1.0Nb; (e), (f), Ti-1100-1.5Nb; (g), (h) Ti-1100-2.0Nb.
Materials 13 01082 g008aMaterials 13 01082 g008b
Table 1. Chemical composition of as-cast Ti-1100-xNb alloys (wt.%).
AlSnZrMoSiNbTi
0.5 Nb5.712.953.810.430.410.45Balance
1.0 Nb5.852.743.920.510.430.96Balance
1.5 Nb5.832.813.870.460.421.47Balance
2.0 Nb5.782.773.850.420.442.05Balance
Table 2. Values of the oxidation reaction index n and the coefficient of determination R2 of Nb modified Ti-1100 alloys for 650 °C oxidation during 100 h.
AlloynR2
Ti-1100-0.5Nb1.9550.996
Ti-1100-1.0Nb1.7920.989
Ti-1100-1.5Nb1.9190.995
Ti-1100-2.0Nb2.0000.995
Table 3. Values of the parabolic oxidation rate constant kp and the coefficient of determination R2 of Nb modified Ti-1100 alloys for 650 °C oxidation during 100 h.
Alloykp (g2cm−4s−1)R2
Ti-1100-0.5Nb9.222 × 10−130.990
Ti-1100-1.0Nb5.749 × 10−130.981
Ti-1100-1.5Nb7.496 × 10−130.988
Ti-1100-2.0Nb8.733 × 10−130.989
Table 4. Lattice constant of α-Ti of the as-cast Ti-1100-xNb alloys before and after oxidized at 650 °C for 100 h.
CompositionacΔaΔc
As-cast0.5Nb0.292890.46846--
1.0Nb0.293570.46885--
1.5Nb0.293460.46877--
2.0Nb0.293330.46865--
Oxidation condition0.5Nb0.295270.477370.002380.00891
1.0Nb0.294980.473420.001410.00457
1.5Nb0.295120.474410.001660.00564
2.0Nb0.295400.474750.002070.00610
Table 5. EDS analysis results of the oxidation surface marked in Figure 7 (wt.%).
PositionOAlSiNbMoTiZrSn
Area134.13.90.50.61.155.52.61.7
Area 234.63.20.00.00.059.90.71.6
Area 351.43.30.10.29.534.40.50.6
Area 444.16.90.20.719.227.20.90.8
Area 538.92.70.60.30.254.81.60.9