Development of A Novel High Throughput Photo-catalyst Screening Procedure: UV-A Degradation of 17α-Ethinylestradiol with Doped TiO2-Based Photo-catalysts


Abstract
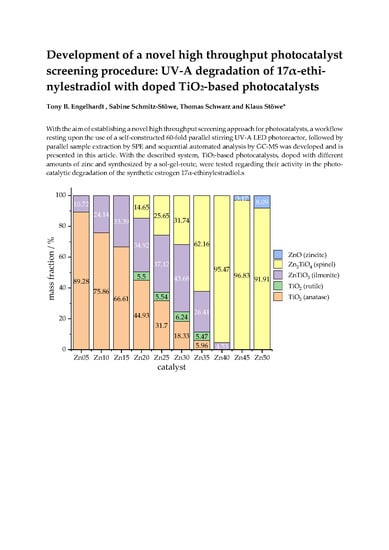
:
1. Introduction
2. Results
2.1. Calibration
2.2. Photocatalytic Experiments
2.2.1. Catalyst Screening
2.2.2. Reaction Monitoring
2.3. Catalyst Characterisation
2.3.1. Powder X-Ray Diffraction (PXRD)
2.3.2. Surface Determination by BET-Measurements
3. Discussion
4. Materials and Methods
4.1. Materials
4.1.1. Chemicals
4.1.2. 60-Fold Parallel Stirring UV-A LED Photoreactor
4.2. Methods
4.2.1. Catalyst Syntheses
4.2.2. Catalyst Characterisation
4.2.3. Calibration
4.2.4. Photocatalytic Reaction
4.2.5. Sample Pretreatment for Chromatography
4.2.6. Analyses
4.2.7. High Throughput Workflow
5. Conclusions
Author Contributions
Funding
Acknowledgments
Conflicts of Interest
Abbreviations
| AOP | advanced oxidation processes |
| BET | Brunauer–Emmett–Teller |
| c | concentration |
| CIS | Hcold injection system |
| DIN | Deutsches Institut für Normung |
| E | irradiance |
| EDC | endocrine disruptive chemicals |
| EI | ion impact ionisation |
| EIC | extracted-ion current |
| E1 | estron |
| E2 | 17β-estradiol |
| E3 | estriol |
| EE2 | 17α-ethinylestradiol |
| frot | rotation speed |
| GC-MS | gas chromatography coupled to mass spectrometry |
| init. | initial |
| κ | conductivity |
| k | rate constant |
| λ | wavelength |
| LED | light-emitting diode |
| LOD | limit of detection |
| LOQ | limit of quantitation |
| m | mass |
| MSTFA | N-methyl-N-(trimethylsilyl)trifluoroacetamide |
| MPS | multi-purpose auto sampler |
| m/z | mass-to-charge ratio |
| mol% | mole fraction |
| n | amount of substance |
| nt | ion count after the irradiation time t |
| n0 | ion count without irradiation |
| P123 | Pluronic®, triblock-copolymer |
| PSD | process standard deviation |
| PTV | programmed temperature vaporising |
| PXRD | powder X-ray diffraction |
| Q | flow |
| R2 | coefficient of determination |
| SPE | solid phase extraction |
| T | temperature |
| t | time |
| UPC | universal politer cooling |
| UV-A | ultra violet A |
| V | volume |
| v | reaction rate |
| wt% | mass fraction |
| XEE2 | conversion of EE2 |
| Zn XX | Zinc-titanate; XX indicates the amount of zinc in comparison to the amount of titanium in mol-percent |
References
- Gerland, P.; Raftery, A.E.; Ševčikova, H.; Li, N.; Gu, D.; Spoorenberg, T.; Alkema, L.; Fosdick, B.K.; Chunn, J.; Lalic, N.; et al. World population stabilization unlikely this century. Science 2014, 346, 234–237. [Google Scholar] [CrossRef] [PubMed] [Green Version]
- Gaw, S.; Thomas, K.V.; Hutchinson, T.H. Sources, Impacts and trends of pharmaceuticals in the marine and coastal environment. Philos. Trans. R. Soc. B Biol. Sci. 2014, 369, 20130572. [Google Scholar] [CrossRef] [PubMed] [Green Version]
- Tran, N.H.; Reinhard, M.; Gin, K.Y.-H. Occurrence and fate of emerging contaminants in municipal wastewater treatment plants from different geographical regions-a review. Water Res. 2018, 133, 182–207. [Google Scholar] [CrossRef] [PubMed]
- Blair, B.D.; Crago, J.P.; Hedman, C.J.; Klaper, R.D. Pharmaceuticals and personal care products found in the Great Lakes above concentrations of environmental concern. Chemosphere 2013, 93, 2116–2123. [Google Scholar] [CrossRef] [Green Version]
- Vilela, C.L.S.; Bassin, J.P.; Peixoto, R.S. Water contamination by endocrine disruptors: Impacts, microbiological aspects and trends for environmental protection. Environ. Pollut. 2018, 235, 546–559. [Google Scholar] [CrossRef]
- Orton, F.; Tyler, C.R. Do hormone-modulating chemicals impact on reproduction and development of wild amphibians? Endocrine disruption in amphibians. Biol. Rev. 2015, 90, 1100–1117. [Google Scholar] [CrossRef]
- Patisaul, H. Long-term effects of environmental endocrine disruptors on reproductive physiology and behavior. Front. Behav. Neurosci. 2009, 3, 10. [Google Scholar] [CrossRef] [Green Version]
- Cram, R.A.; Lawrence, J.M.; Dzieweczynski, T.L. Mating under the influence: Male siamese fighting fish prefer EE2-exposed females. Ecotoxicology 2019, 28, 201–211. [Google Scholar] [CrossRef]
- Sweeney, M.F.; Hasan, N.; Soto, A.M.; Sonnenschein, C. Environmental endocrine disruptors: Effects on the human male reproductive system. Rev. Endocr. Metab. Disord. 2015, 16, 341–357. [Google Scholar] [CrossRef] [Green Version]
- Gore, A.C.; Chappell, V.A.; Fenton, S.E.; Flaws, J.A.; Nadal, A.; Prins, G.S.; Toppari, J.; Zoeller, R.T. Executive summary to EDC-2: The Endocrine Society’s second scientific statement on endocrine-disrupting chemicals. Endocr. Rev. 2015, 36, 593–602. [Google Scholar] [CrossRef] [Green Version]
- Murk, A.J.; Legler, J.; van Lipzig, M.M.H.; Meerman, J.H.N.; Belfroid, A.C.; Spenkelink, A.; van der Burg, B.; Rijs, G.B.J.; Vethaak, D. Detection of estrogenic potency in wastewater and surface water with three in vitro bioassays. Environ. Toxicol. Chem. 2002, 21, 16–23. [Google Scholar] [CrossRef] [PubMed]
- Johnson, A.; Belfroid, A.; Di Corcia, A. Estimating steroid oestrogen inputs into activated sludge treatment works and observations on their removal from the effluent. Sci. Total Environ. 2000, 256, 163–173. [Google Scholar] [CrossRef]
- Baronti, C.; Curini, R.; D’Ascenzo, G.; Di Corcia, A.; Gentili, A.; Samperi, R. Monitoring natural and synthetic estrogens at activated sludge sewage treatment plants and in a receiving river water. Environ. Sci. Technol. 2000, 34, 5059–5066. [Google Scholar] [CrossRef]
- Nakada, N.; Shinohara, H.; Murata, A.; Kiri, K.; Managaki, S.; Sato, N.; Takada, H. Removal of selected pharmaceuticals and personal care products (PPCPs) and endocrine-disrupting chemicals (EDCs) during sand filtration and ozonation at a municipal sewage treatment plant. Water Res. 2007, 41, 4373–4382. [Google Scholar] [CrossRef]
- Gomes, R.L.; Scrimshaw, M.D.; Cartmell, E.; Lester, J.N. The fate of steroid estrogens: Partitioning during wastewater treatment and onto river sediments. Environ. Monit. Assess. 2011, 175, 431–441. [Google Scholar] [CrossRef] [Green Version]
- Ternes, T.A.; Stüber, J.; Herrmann, N.; McDowell, D.; Ried, A.; Kampmann, M.; Teiser, B. Ozonation: A tool for removal of pharmaceuticals, contrast media and musk fragrances from wastewater? Water Res. 2003, 37, 1976–1982. [Google Scholar] [CrossRef]
- Kim, S.-E.; Yamada, H.; Tsuno, H. Evaluation of estrogenicity for 17β-estradiol decomposition during ozonation. Ozone Sci. Eng. 2004, 26, 563–571. [Google Scholar] [CrossRef]
- Alum, A.; Yoon, Y.; Westerhoff, P.; Abbaszadegan, M. Oxidation of bisphenol A, 17β-estradiol, and 17α-ethynyl estradiol and byproduct estrogenicity. Environ. Toxicol. 2004, 19, 257–264. [Google Scholar] [CrossRef]
- Dodd, M.C.; Buffle, M.-O.; von Gunten, U. Oxidation of antibacterial molecules by aqueous ozone: Moiety-specific reaction kinetics and application to ozone-based wastewater treatment. Environ. Sci. Technol. 2006, 40, 1969–1977. [Google Scholar] [CrossRef]
- Esplugas, S.; Bila, D.M.; Krause, L.G.T.; Dezotti, M. Ozonation and advanced oxidation technologies to remove endocrine disrupting chemicals (EDCs) and pharmaceuticals and personal care products (PPCPs) in water effluents. J. Hazard. Mater. 2007, 149, 631–642. [Google Scholar] [CrossRef]
- Wert, E.C.; Rosario-Ortiz, F.L.; Snyder, S.A. Effect of ozone exposure on the oxidation of trace organic contaminants in wastewater. Water Res. 2009, 43, 1005–1014. [Google Scholar] [CrossRef] [PubMed]
- Weber, S.; Gallenkemper, M.; Melin, T.; Dott, W.; Hollender, J. Efficiency of nanofiltration for the elimination of steroids from water. Water Sci. Technol. 2004, 50, 9–14. [Google Scholar] [CrossRef] [PubMed]
- Nghiem, L.D.; Schäfer, A.I.; Elimelech, M. Removal of natural hormones by nanofiltration membranes: Measurement, modeling, and mechanisms. Environ. Sci. Technol. 2004, 38, 1888–1896. [Google Scholar] [CrossRef]
- Urase, T.; Kagawa, C.; Kikuta, T. Factors affecting removal of pharmaceutical substances and estrogens in membrane separation bioreactors. Desalination 2005, 178, 107–113. [Google Scholar] [CrossRef]
- Cartinella, J.L.; Cath, T.Y.; Flynn, M.T.; Miller, G.C.; Hunter, K.W.; Childress, A.E. Removal of natural steroid hormones from wastewater using membrane contactor processes †. Environ. Sci. Technol. 2006, 40, 7381–7386. [Google Scholar] [CrossRef] [PubMed]
- Hattori, M.; Frazier, J.; Miles, H.T. Poly(8-aminoguanylic acid): Formation of ordered self-structures and interaction with poly(cytidylic acid). Biochemistry 1975, 14, 5033–5045. [Google Scholar] [CrossRef] [PubMed]
- Yoon, Y.; Westerhoff, P.; Snyder, S.A.; Esparza, M. HPLC-fluorescence detection and adsorption of bisphenol A, 17β-estradiol, and 17α-ethynyl estradiol on powdered activated carbon. Water Res. 2003, 37, 3530–3537. [Google Scholar] [CrossRef]
- Snyder, S.A.; Adham, S.; Redding, A.M.; Cannon, F.S.; DeCarolis, J.; Oppenheimer, J.; Wert, E.C.; Yoon, Y. Role of membranes and activated carbon in the removal of endocrine disruptors and pharmaceuticals. Desalination 2007, 202, 156–181. [Google Scholar] [CrossRef]
- Margot, J.; Kienle, C.; Magnet, A.; Weil, M.; Rossi, L.; de Alencastro, L.F.; Abegglen, C.; Thonney, D.; Chèvre, N.; Schärer, M.; et al. Treatment of micropollutants in municipal wastewater: Ozone or powdered activated carbon? Sci. Total Environ. 2013, 461–462, 480–498. [Google Scholar] [CrossRef]
- Jiang, L.; Liu, Y.; Liu, S.; Zeng, G.; Hu, X.; Hu, X.; Guo, Z.; Tan, X.; Wang, L.; Wu, Z. Adsorption of estrogen contaminants by graphene nanomaterials under natural organic matter preloading: Comparison to carbon nanotube, biochar, and activated carbon. Environ. Sci. Technol. 2017, 51, 6352–6359. [Google Scholar] [CrossRef]
- Fujishima, A.; Zhang, X. Titanium dioxide photocatalysis: Present situation and future approaches. C. R. Chim. 2006, 9, 750–760. [Google Scholar] [CrossRef]
- Dalrymple, O.K.; Yeh, D.H.; Trotz, M.A. Removing pharmaceuticals and endocrine-disrupting compounds from wastewater by photocatalysis. J. Chem. Technol. Biotechnol. 2007, 82, 121–134. [Google Scholar] [CrossRef]
- Silva, C.P.; Otero, M.; Esteves, V. Processes for the elimination of estrogenic steroid hormones from water: A review. Environ. Pollut. 2012, 165, 38–58. [Google Scholar] [CrossRef] [PubMed]
- Sornalingam, K.; McDonagh, A.; Zhou, J.L. Photodegradation of estrogenic endocrine disrupting steroidal hormones in aqueous systems: Progress and future challenges. Sci. Total Environ. 2016, 550, 209–224. [Google Scholar] [CrossRef]
- Coleman, H.M.; Eggins, B.R.; Byrne, J.A.; Palmer, F.L.; King, E. Photocatalytic degradation of 17-βoestradiol on immobilised TiO2. Appl. Catal. B Environ. 2000, 24, L1–L5. [Google Scholar] [CrossRef]
- Coleman, H.M.; Chiang, K.; Amal, R. Effects of Ag and Pt on photocatalytic degradation of endocrine disrupting chemicals in water. Chem. Eng. J. 2005, 113, 65–72. [Google Scholar] [CrossRef]
- Coleman, H.M.; Abdullah, M.I.; Eggins, B.R.; Palmer, F.L. Photocatalytic degradation of 17β-oestradiol, oestriol and 17α-ethynyloestradiol in water monitored using fluorescence spectroscopy. Appl. Catal. B Environ. 2005, 55, 23–30. [Google Scholar] [CrossRef]
- Karpova, T.; Preis, S.; Kallas, J. Selective photocatalytic oxidation of steroid estrogens in water treatment: Urea as co-pollutant. J. Hazard. Mater. 2007, 146, 465–471. [Google Scholar] [CrossRef]
- Mai, J.; Sun, W.; Xiong, L.; Liu, Y.; Ni, J. Titanium dioxide mediated photocatalytic degradation of 17β-estradiol in aqueous solution. Chemosphere 2008, 73, 600–606. [Google Scholar] [CrossRef]
- Frontistis, Z.; Daskalaki, V.M.; Hapeshi, E.; Drosou, C.; Fatta-Kassinos, D.; Xekoukoulotakis, N.P.; Mantzavinos, D. Photocatalytic (UV-A/TiO2) degradation of 17α-ethynylestradiol in environmental matrices: Experimental studies and artificial neural network modeling. J. Photochem. Photobiol. Chem. 2012, 240, 33–41. [Google Scholar] [CrossRef]
- Han, J.; Liu, Y.; Singhal, N.; Wang, L.; Gao, W. Comparative photocatalytic degradation of estrone in water by ZnO and TiO2 under artificial UVA and solar irradiation. Chem. Eng. J. 2012, 213, 150–162. [Google Scholar] [CrossRef]
- Dimitroula, H.; Daskalaki, V.M.; Frontistis, Z.; Kondarides, D.I.; Panagiotopoulou, P.; Xekoukoulotakis, N.P.; Mantzavinos, D. Solar photocatalysis for the abatement of emerging micro-contaminants in wastewater: Synthesis, characterization and testing of various TiO2 samples. Appl. Catal. B Environ. 2012, 117, 283–291. [Google Scholar] [CrossRef]
- Mboula, V.M.; Héquet, V.; Andrès, Y.; Gru, Y.; Colin, R.; Doña-Rodríguez, J.M.; Pastrana-Martínez, L.M.; Silva, A.M.T.; Leleu, M.; Tindall, A.J.; et al. Photocatalytic degradation of estradiol under simulated solar light and assessment of estrogenic activity. Appl. Catal. B Environ. 2015, 162, 437–444. [Google Scholar] [CrossRef]
- Kober, S. A colorimetric determination of the sex hormone (menformone). Biochem. Z. 1931, 239, 209–212. [Google Scholar]
- Bauld, W.S. Some errors in the colorimetric estimation of oestriol, oestrone and oestradiol by the Kober reaction. Biochem. J. 1954, 56, 426–434. [Google Scholar] [CrossRef] [PubMed] [Green Version]
- Nocke, W. A study of the colorimetric estimation of oestradiol-17β, oestradiol-17α, oestrone, oestriol and 16-epioestriol by the Kober reaction. Biochem. J. 1961, 78, 593–602. [Google Scholar] [CrossRef]
- Brown, J.B.; Macnaughtan, C.; Smith, M.A.; Smyth, B. Further observations on the Kober colour and Ittrich flourescnece reactions in the measurement of oestriol, oestrone and oestradiol. J. Endocrinol. 1968, 40, 175–188. [Google Scholar] [CrossRef]
- Jones, H.A.; Hähnel, R. The specificity and mechanism of the Kober reaction. Steroids 1969, 13, 693–710. [Google Scholar] [CrossRef]
- Trapp, O. Unified equation for access to rate constants of first-order reactions in dynamic and on-column reaction chromatography. Anal. Chem. 2006, 78, 189–198. [Google Scholar] [CrossRef]
- Trapp, O. Boosting the throughput of separation techniques by “multiplexing”. Angew. Chem. Int. Ed. 2007, 46, 5609–5613. [Google Scholar] [CrossRef] [Green Version]
- Trapp, O.; Weber, S.K.; Bauch, S.; Hofstadt, W. High-throughput screening of catalysts by combining reaction and analysis. Angew. Chem. Int. Ed. 2007, 46, 7307–7310. [Google Scholar] [CrossRef] [PubMed]
- Siegle, A.F.; Trapp, O. Hochdurchsatz-Multiplexing-Gaschromatographie. Chem. Ing. Tech. 2014, 86, 1044–1051. [Google Scholar] [CrossRef]
- Sun, W.; Li, S.; Mai, J.; Ni, J. Initial photocatalytic degradation intermediates/pathways of 17α-ethynylestradiol: Effect of pH and methanol. Chemosphere 2010, 81, 92–99. [Google Scholar] [CrossRef] [PubMed]
- Mao, K.; Li, Y.; Zhang, H.; Zhang, W.; Yan, W. Photocatalytic degradation of 17α-ethinylestradiol and inactivation of Escherichia coli using Ag-modified TiO2 nanotube arrays. CLEAN Soil Air Water 2013, 41, 455–462. [Google Scholar] [CrossRef]
- Frontistis, Z.; Fatta-Kassinos, D.; Mantzavinos, D.; Xekoukoulotakis, N.P. Photocatalytic degradation of 17α-ethynylestradiol in environmental samples by ZnO under simulated solar radiation. J. Chem. Technol. Biotechnol. 2012, 87, 1051–1058. [Google Scholar] [CrossRef]
- Li Puma, G.; Puddu, V.; Tsang, H.K.; Gora, A.; Toepfer, B. Photocatalytic oxidation of multicomponent mixtures of estrogens (estrone (E1), 17β-estradiol (E2), 17α-ethynylestradiol (EE2) and estriol (E3)) under UVA and UVC radiation: Photon absorption, quantum yields and rate constants independent of photon absorption. Appl. Catal. B Environ. 2010, 99, 388–397. [Google Scholar]
- Alcântara Marinho, B.; de Liz, M.V.; Lopes Tiburtius, E.R.; Nagata, N.; Peralta-Zamona, P. TiO2 and ZnO mediated photocatalytic degradation of E2 and EE2 estrogens. Photochem. Photobiol. Sci. 2013, 12, 678–683. [Google Scholar] [CrossRef]
- Murray, J.L.; Wriedt, H.A. The O−Ti (oxygen-titanium) system. J. Phase Equilib. 1987, 8, 148–165. [Google Scholar] [CrossRef]


| PSD/µmol L−1 | LOD/ppm | LOQ/ppm |
|---|---|---|
| 0.25 | 0.56 | 1.09 |
| Catalyst | Lattice Parameters/Å | |
|---|---|---|
| a | c | |
| Zn05 | 3.7840(1) | 9.5063(3) |
| Zn10 | 3.7851(1) | 9.5043(4) |
| Zn15 | 3.7851(1) | 9.5033(4) |
| Zn20 | 3.7853(1) | 9.5004(4) |
| Zn25 | 3.7849(1) | 9.5036(3) |
| Zn30 | 3.7850(1) | 9.5026(4) |
| Zn35 | 3.7853(3) | 9.4928(1) |
© 2020 by the authors. Licensee MDPI, Basel, Switzerland. This article is an open access article distributed under the terms and conditions of the Creative Commons Attribution (CC BY) license (http://creativecommons.org/licenses/by/4.0/).
Share and Cite
Engelhardt, T.B.; Schmitz-Stöwe, S.; Schwarz, T.; Stöwe, K. Development of A Novel High Throughput Photo-catalyst Screening Procedure: UV-A Degradation of 17α-Ethinylestradiol with Doped TiO2-Based Photo-catalysts. Materials 2020, 13, 1365. https://doi.org/10.3390/ma13061365
Engelhardt TB, Schmitz-Stöwe S, Schwarz T, Stöwe K. Development of A Novel High Throughput Photo-catalyst Screening Procedure: UV-A Degradation of 17α-Ethinylestradiol with Doped TiO2-Based Photo-catalysts. Materials. 2020; 13(6):1365. https://doi.org/10.3390/ma13061365
Chicago/Turabian StyleEngelhardt, Tony B., Sabine Schmitz-Stöwe, Thomas Schwarz, and Klaus Stöwe. 2020. "Development of A Novel High Throughput Photo-catalyst Screening Procedure: UV-A Degradation of 17α-Ethinylestradiol with Doped TiO2-Based Photo-catalysts" Materials 13, no. 6: 1365. https://doi.org/10.3390/ma13061365