Structural and Magnetic Studies of Bulk Nanocomposite Magnets Derived from Rapidly Solidified Pr-(Fe,Co)-(Zr,Nb)-B Alloy


Abstract
:1. Introduction
2. Materials and Methods
3. Resultsand Discussion
4. Conclusions
Author Contributions
Funding
Conflicts of Interest
References
- Coey, J.M.D. Permanent magnets: Plugging the gap. Scripta Mater. 2012, 67, 524–529. [Google Scholar] [CrossRef]
- Riba, J.R.; López-Torres, C.; Romeral, L.; Garcia, A. Rare-earth-free propulsion motors for electric vehicles: A technology review. Renew. Sustain. Energ. Rev. 2016, 57, 367–379. [Google Scholar] [CrossRef] [Green Version]
- Brown, D.N. Fabrication, processing technologies, and new advances for RE-Fe-B magnets. IEEE Trans. Magn. 2016, 52, 1–9. [Google Scholar] [CrossRef]
- Sagawa, M.; Hirosawa, S.; Yamamoto, H.; Fujimura, S.; Matsuura, Y. Nd-Fe-B permanent magnet materials. Jpn. J. Appl. Phys. 1987, 26, 785–800. [Google Scholar] [CrossRef]
- Betancourt, I.; Davies, H.A. Exchange coupled nanocomposite hard magnetic alloys. Mater. Sci. Technol. 2010, 26, 5–19. [Google Scholar] [CrossRef]
- Sagawa, M.; Fujimura, S.; Togawa, N.; Yamamoto, H.; Matsuura, Y. New material for permanent magnets on a base of Nd and Fe. J. Appl. Phys. 1984, 55, 2083–2087. [Google Scholar] [CrossRef]
- Croat, J.J.; Herbst, J.F.; Lee, R.W.; Pinkerton, F.E. Pr-Fe and Nd-Fe-based materials: A new class of high-performance permanent magnets. J. Appl. Phys. 1984, 55, 2078–2082. [Google Scholar] [CrossRef]
- Herbst, J.F.; Yelon, W.B. Crystal and magnetic structure of Pr2Fe14B and Dy2Fe14B. J. Appl. Phys. 1985, 57, 2343–2345. [Google Scholar] [CrossRef]
- Wohlfarth, E.P.; Buschow, K.H.J. Handbook of Magnetic Materials; North-Holland Publishing Company: Amsterdam, The Netherlands, 1988. [Google Scholar]
- Hirosawa, S.; Matsuura, Y.; Yamamoto, H.; Fujimura, S.; Sagawa, M.; Yamauchi, H. Magnetization and magnetic anisotropy of R2Fe14B measured on single crystals. J. Appl. Phys. 1986, 59, 873–879. [Google Scholar] [CrossRef]
- Liu, Z.; Davies, H.A. Composition and microstructure dependent spin reorientation in nanocrystalline (Nd-Pr)-(Fe-Co)-B alloys. IEEE Trans. Magn. 2004, 40, 2898–2900. [Google Scholar] [CrossRef]
- Hirosawa, S.; Kanekiyo, H.; Shigemoto, Y.; Miyoshi, T. In Proceedings of the 18th International Workshop on High Performance Magnets and their Applications, Annecy, France, 29 August–2 September 2004; p. 655.
- Zhang, J.; Lim, K.Y.; Feng, Y.P.; Li, Y. Fe–Nd–B-based hard magnets from bulk amorphous precursor. Scripta Mater. 2007, 56, 943–946. [Google Scholar] [CrossRef]
- Xiaoqian, B.; Jie, Z.; Wei, L.; Xuexu, G.; Shouzeng, Z. Influence of zirconium addition on microstructure, magnetic properties and thermal stability of nanocrystalline Nd12.3Fe81.7B6.0 alloy. J. Rare Earths 2009, 27, 843–847. [Google Scholar] [CrossRef]
- Pawlik, P.; Pawlik, K.; Davies, H.A.; Wysłocki, J.J.; Kaszuwara, W. Nanocrystalline (Pr, Dy)-(Fe, Co)-Zr-Ti-B magnets produced directly by rapid solidification. J. Phys. Conf. Ser. 2009, 144, 012060. [Google Scholar] [CrossRef]
- Kaszuwara, W.; Leonowicz, M.; Psoda, M.; Harland, C.; Davies, H.A. Nanostructure formation in mechanically milled Nd-Fe-B alloys. In Proceedings of the 16th International Workshop on RE Magnets and Their Applications, Sendai, Japan, 10–13 September 2000; p. 669. [Google Scholar]
- McGuiness, P.J.; Short, C.; Wilson, A.F.; Harris, I.R. The production and characterization of bonded, hot-pressed and die-upset HDDR magnets. J. Alloys Comp. 1992, 184, 243–255. [Google Scholar] [CrossRef]
- Liu, Z.W.; Huang, H.Y.; Gao, X.X.; Yu, H.Y.; Zhong, X.C.; Zhu, J.; Zeng, D.C. Microstructure and property evolution of isotropic and anisotropic NdFeB magnets fabricated from nanocrystalline ribbons by spark plasma sintering and hot deformation. J. Phys. D Appl. Phys. 2010, 44, 025003. [Google Scholar] [CrossRef]
- Yue, M.; Zhang, X.; Liu, J.P. Fabrication of bulk nanostructured permanent magnets with high energy density: Challenges and approaches. Nanoscale 2017, 9, 3674–3697. [Google Scholar] [CrossRef]
- Simon, J.; Guélou, G.; Srinivasan, B.; Berthebaud, D.; Mori, T.; Maignan, A. Exploring the thermoelectric behavior of spark plasma sintered Fe7-xCoxS8 compounds. J. Alloys Comp. 2020, 819, 152999. [Google Scholar] [CrossRef]
- Veluri, B.; Brown, D. Higher Density Melt Spun Isotropic Magnets. IEEE Trans. Magn. 2017, 53, 1–4. [Google Scholar] [CrossRef]
- Srinivasan, B.; Gellé, A.; Halet, J.F.; Boussard-Pledel, C.; Bureau, B. Detrimental Effects of Doping Al and Ba on the Thermoelectric Performance of GeTe. Materials 2018, 11, 2237. [Google Scholar] [CrossRef] [PubMed] [Green Version]
- Srinivasan, B.; Berthebaud, D.; Mori, T. Is LiI a Potential Dopant Candidate to Enhance the Thermoelectric Performance in Sb-free GeTe Systems? A Prelusive Study. Energies 2020, 13, 643. [Google Scholar] [CrossRef] [Green Version]
- Leonowicz, M.; Kaszuwara, W.; Jezierska, E.; Januszewski, D.; Mendoza, G.; Davies, H.A.; Paszula, J. Application of the shock compaction technique for consolidation of hard magnetic powders. J. Appl. Phys. 1998, 83, 6634–6636. [Google Scholar] [CrossRef]
- Wysłocki, J.J.; Pawlik, P. Arc-plasma spraying and suction-casting methods in magnetic materials manufacturing. J. Achiev. Mater. Manuf. Eng. 2010, 43, 463–468. [Google Scholar]
- Kozieł, T. Examination of cooling rates in suction casting and copper-mould casting processes. Arch. Metall. Mater. 2015, 60, 767–771. [Google Scholar] [CrossRef]
- Pawlik, P.; Davies, H.A.; Kaszuwara, W.; Wysłocki, J.J. PrFeCoB-based magnets derived from bulk alloy glass. J. Magn. Magn. Mater. 2005, 290, 1243–1246. [Google Scholar] [CrossRef]
- Pawlik, P.; Pawlik, K.; Davies, H.A.; Kaszuwara, W.; Wysłocki, J.J.; Harrison, N.; Todd, I. Directly quenched bulk nanocrystalline (Pr, Dy)–(Fe, Co)–B–Zr–Ti hard magnets. J. Alloys Comp. 2006, 423, 99–101. [Google Scholar] [CrossRef]
- Pawlik, K.; Pawlik, P.; Kaszuwara, W.; Wysłocki, J.J. Glass Forming Abilities and Crystallization Process in Amorphous Pr-Fe-Co-Zr-Nb-B Alloys of Various B Content. Acta Phys. Pol. A 2017, 131, 979–981. [Google Scholar] [CrossRef]
- Pawlik, K.; Pawlik, P.; Wyslocki, J.J. The Bulk Glass Forming Ability and Magnetic Properties of Pr9Fe50+xCo13Zr1Nb4B23-x (x= 0, 2, 5, 8) Alloys. Acta Phys. Pol. A 2010, 118, 900–902. [Google Scholar] [CrossRef]
- Sorai, M. Comprehensive Handbook of Calorimetry and Thermal Analysis; J. Wiley&Sons, Ltd.: Oxford, UK, 2004. [Google Scholar]
- Zhang, H.W.; Rong, C.B.; Du, X.B.; Zhang, S.Y.; Shen, B.G. Investigation on the coercivity and remanence of single-phase nanocrystalline permanent magnets by micromagnetic finite-element method. J. Magn. Magn. Mater. 2004, 278, 127–137. [Google Scholar] [CrossRef]
- Ceglarek, A.; Płusa, D.; Pawlik, P.; Gębara, P. Structural and magnetic properties of the as-cast Nd10Fe83Zr1B6 ribbons, studied by X-ray diffraction and Mössbauer spectroscopy. Nukleonika 2013, 58, 105–108. [Google Scholar]
- Herzer, G. Grain structure and magnetism of nanocrystalline ferromagnets. IEEE Trans. Magn. 1989, 25, 3327–3329. [Google Scholar] [CrossRef]
- Harland, C.L.; Davies, H.A. Effect of Co and Zr on magnetic properties of nanophase PrFeB alloys. J. Appl. Phys. 2000, 87, 6116–6118. [Google Scholar] [CrossRef]
- Bruker, A.X.S. TOPAS V.2: General Profile and Structure Analysis Software for Powder Diffraction Data–User’s Manual; Bruker AXS: Karlsruhe, Germany, 2008. [Google Scholar]
- Scarlett, N.V.; Madsen, I.C. Quantification of phases with partial or no known crystal structures. Powder Diffr. 2006, 21, 278–284. [Google Scholar] [CrossRef]
- Herbst, J.F.; Yelon, W.B. Preferential site occupation and magnetic structure of Nd2(CoxFe1−x)14B systems. J. Appl. Phys. 1986, 60, 4224–4229. [Google Scholar] [CrossRef]
- Pedziwiatr, A.T.; Jiang, S.Y.; Wallace, W.E. Structure and magnetism of the Pr2Fe14-xCoxB system. J. Magn. Magn. Mater. 1986, 62, 29–35. [Google Scholar] [CrossRef]
- Bolzoni, F.; Coey, J.M.D.; Gavigan, J.; Givord, D.; Moze, O.; Pareti, L.; Viadieu, T. Magnetic properties of Pr2(Fe1-xCox)14B compounds. J. Magn. Magn. Mater. 1987, 65, 123–127. [Google Scholar] [CrossRef]
- Galego, E.; Serna, M.M.; Ramanathan, L.V.; Faria, R.N. Crystallographic parameters of magnetic Pr2Fe14−xCoxB-type alloys determined using anomalous x-ray diffraction with synchrotron radiation. J. Magn. Magn. Mater. 2017, 424, 298–303. [Google Scholar] [CrossRef]
- Kablov, E.N.; Ospennikova, O.G.; Bayukov, O.A.; Pletnev, N.O.; Rezchikova, I.I.; Valeev, R.A.; Morgunov, R.B. Effect of stoichiometry of Fe and Co on the temperature stability of the magnetic anisotropy in Pr-Dy-Fe-Co-B alloys. Phys. Solid State 2015, 57, 1362–1365. [Google Scholar] [CrossRef]
- Pawlik, P.; Pawlik, K.; Przybył, A. Investigation of the cooling rate in the suction casting process. Rev. Adv. Mater. Sci. 2008, 18, 81–84. [Google Scholar]
- Fischer, R.; Schrefl, T.; Kronmüller, H.; Fidler, J. Grain-size dependence of remanence and coercive field of isotropic nanocrystalline composite permanent magnets. J. Magn. Magn. Mater. 1996, 153, 35–49. [Google Scholar] [CrossRef]
- Wang, Z.; Zhou, S.; Zhang, M.; Qiao, Y.; Wang, R. Effects of as-quenched structures on the phase transformations and magnetic properties of melt-spun Pr7Fe88B5 ribbons. J. Appl. Phys. 1999, 86, 7010–7016. [Google Scholar] [CrossRef]
- Chen, Z.M.; Brown, D.N.; WU, Y.Q.; Kramer, M.J. Microstructure and Magnetic Properties of Rapidly Quenched Pr9Fe91–xBx (x = 4–12) Nanocomposite Magnets. J. Iron Steel Res. Int. 2006, 13, 177–182. [Google Scholar] [CrossRef]
- Chrobak, A.; Ziółkowski, G.; Randrianantoandro, N.; Klimontko, J.; Chrobak, D.; Prusik, K.; Rak, J. Ultra-high coercivity of (Fe86−xNbxB14)0.88Tb0.12 bulk nanocrystalline magnets. Acta Mater. 2015, 98, 318–326. [Google Scholar] [CrossRef]


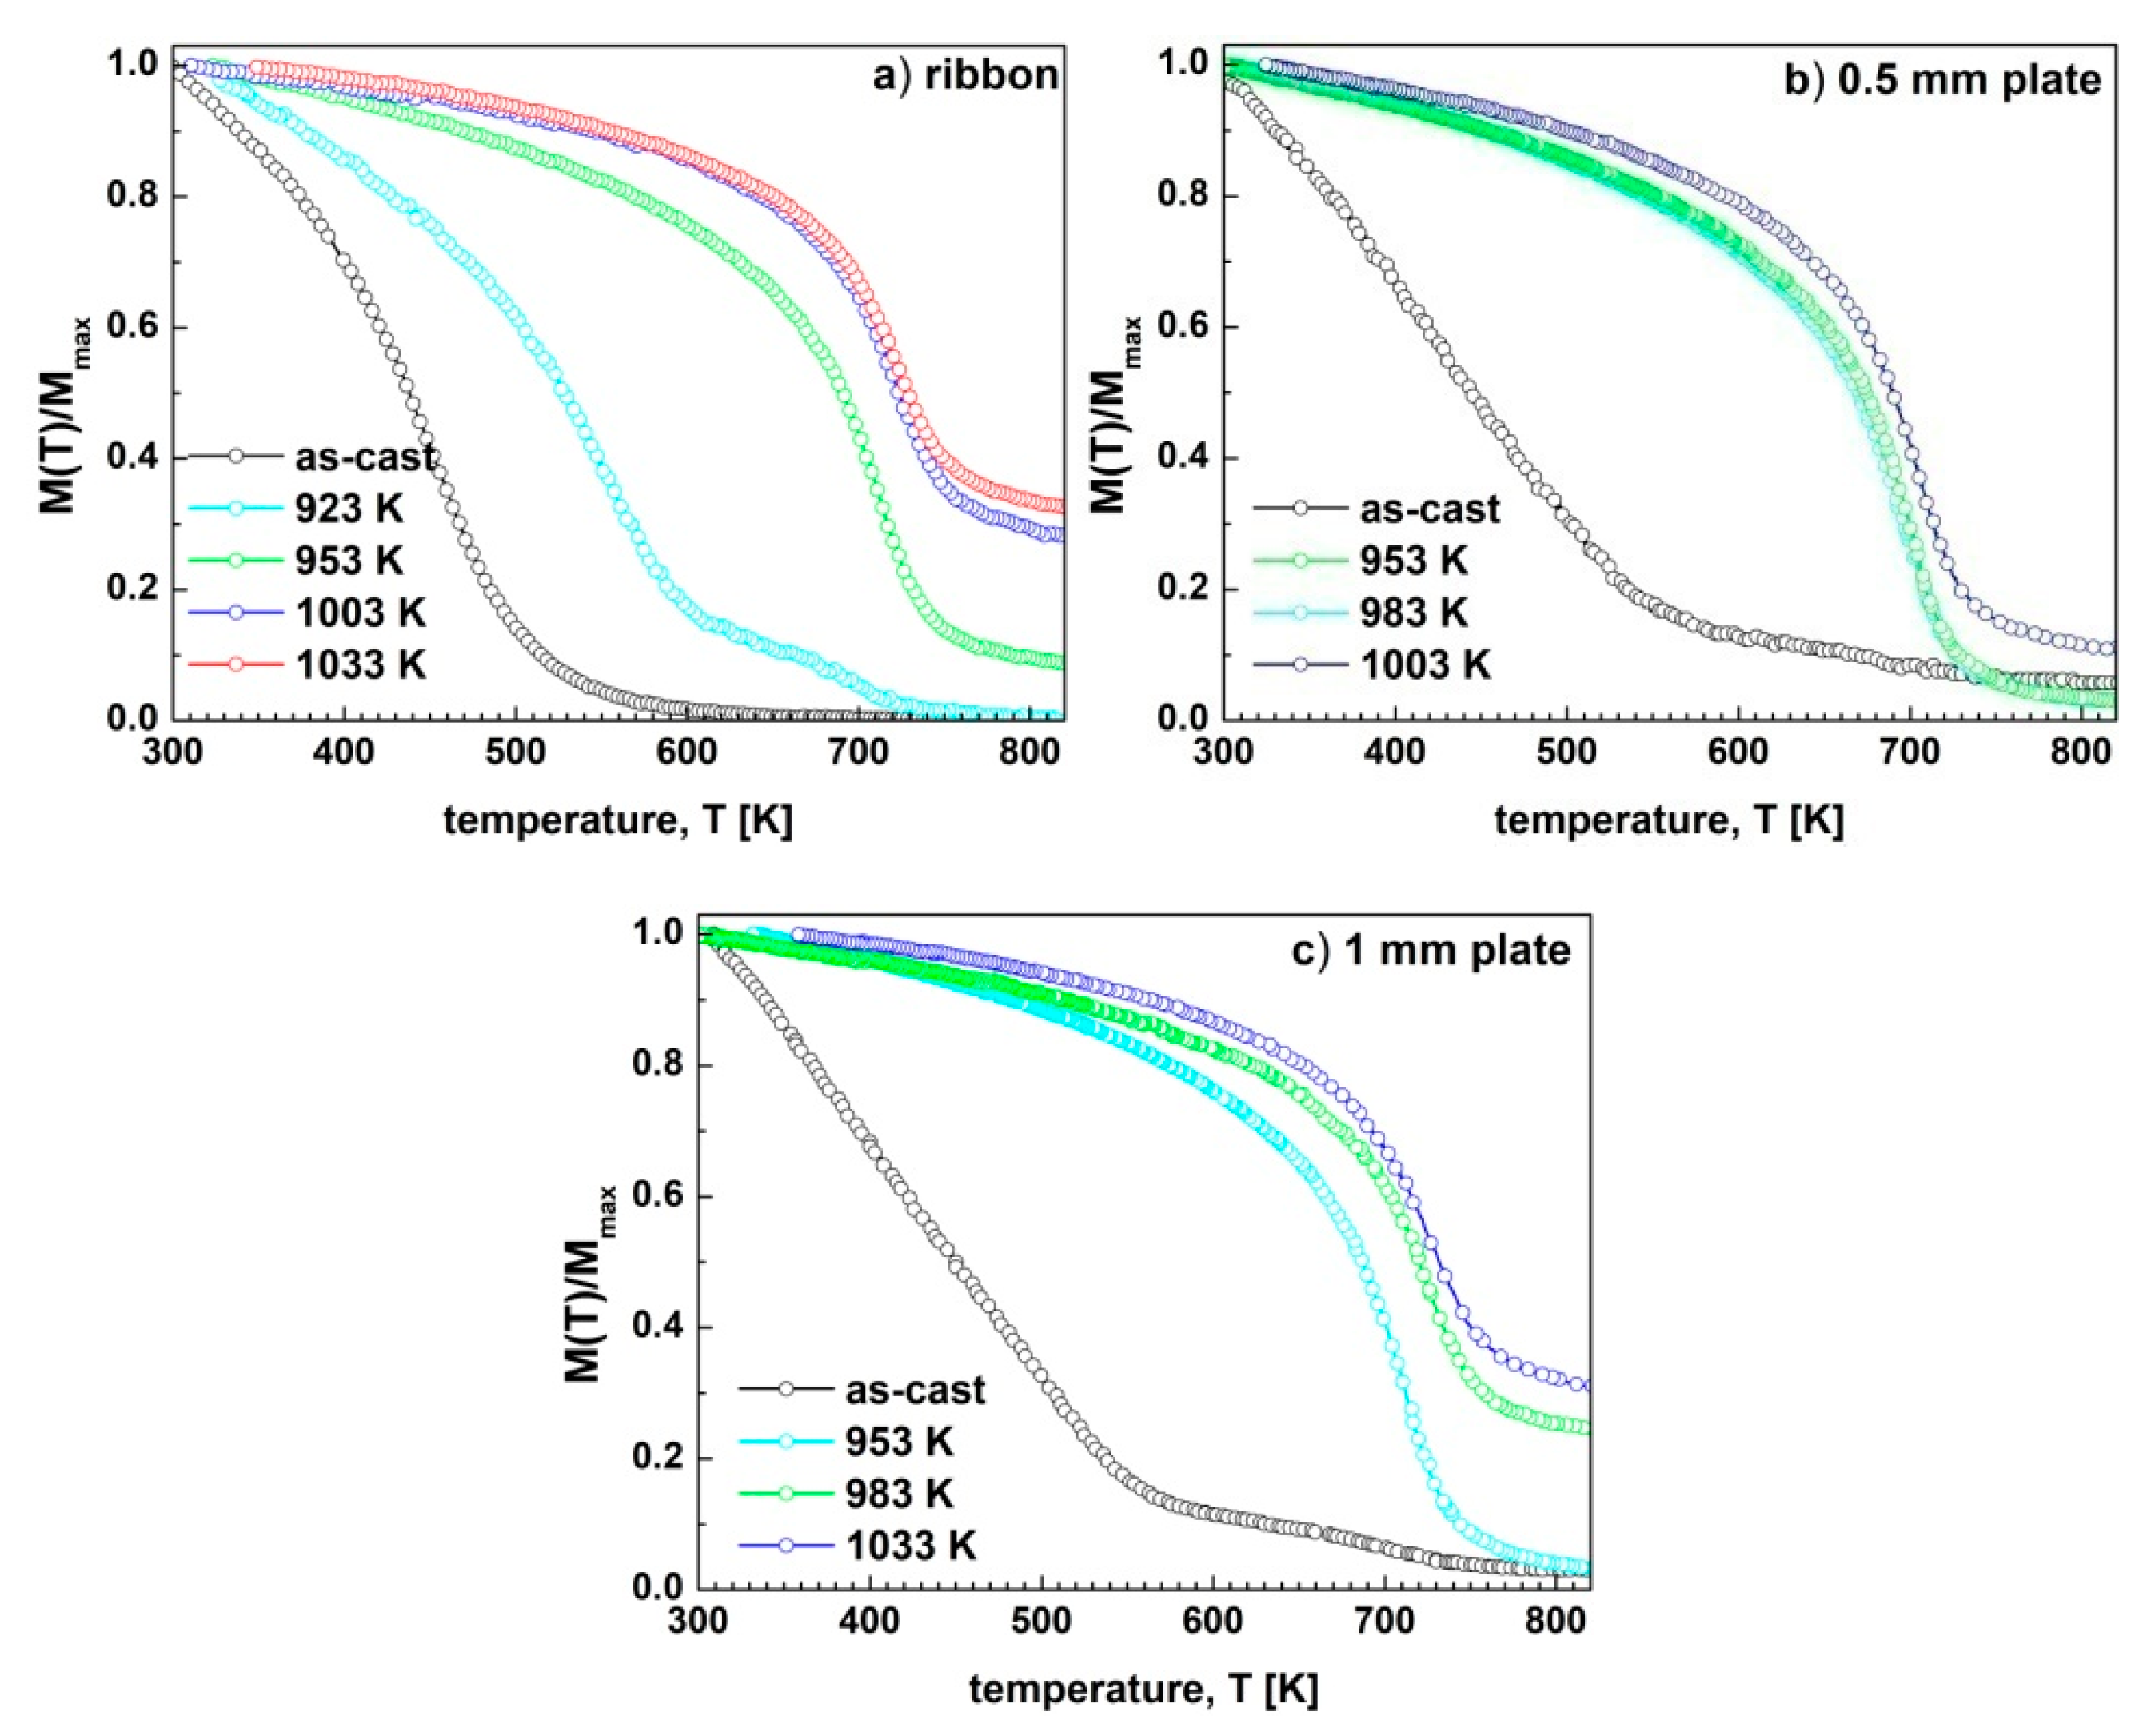
| Ta | TC1 [K] | TC2 [K] |
|---|---|---|
| Ribbons | ||
| as-cast | 515 | — |
| 923 K | 627 | 690 |
| 953 K | — | 708 |
| 1003 K | — | 721 |
| 1033 K | — | 723 |
| 0.5 mm plate | ||
| as-cast | 571 | 674 |
| 953 K | — | 693 |
| 983 K | — | 695 |
| 1033 K | — | 710 |
| 1 mm plate | ||
| as-cast | 580 | 705 |
| 953 K | — | 712 |
| 983 K | — | 729 |
| 1033 K | — | 731 |
| Sample/Ta [K] | Rexp | Rwp | GOF |
|---|---|---|---|
| Ribbon | |||
| 923 | 0.643 | 0.783 | 1.218 |
| 953 | 0.672 | 0.922 | 1.373 |
| 1003 | 0.669 | 0.933 | 1.396 |
| 1033 | 0.703 | 1.141 | 1.622 |
| 0.5 mm plate | |||
| 953 | 0.808 | 0.959 | 1.187 |
| 983 | 0.674 | 0.922 | 1.373 |
| 1003 | 0.748 | 1.005 | 1.345 |
| 1033 | 0.858 | 1.264 | 1.473 |
| 1 mm plate | |||
| 953 | 0.723 | 0.934 | 1.175 |
| 983 | 0.754 | 0.976 | 1.181 |
| 1003 | 0.765 | 0.983 | 1.265 |
| 1033 | 0.854 | 1.125 | 1.378 |
| Phase Space Group | Pr2(Fe,Co)14B P42/mnm | Pr(Fe,Co)4B4 Pccn | α-Fe Im-3m | Pr2O3 Ia-3 | ||
|---|---|---|---|---|---|---|
| a [nm] | c [nm] | a [nm] | c [nm] | a [nm] | a [nm] | |
| initial value | 0.8811 | 1.2231 | 0.7117 | 3.50699 | 0.2868 | 1.1156 |
| Ta[K] | Ribbon | |||||
| 923 | 0.8763 ± 0.0001 | 1.2159 ± 0.0002 | 0.7103 ± 0.0003 | 3.5056 ± 0.0028 | — | — |
| 953 | 0.8754 ± 0.0001 | 1.2125 ± 0.0002 | 0.7104 ± 0.0001 | 3.4773 ± 0.0013 | 0.2870 ± 0.0001 | — |
| 1003 | 0.8763 ± 0.0001 | 1.2141 ± 0.0002 | 0.7115 ± 0.0001 | 3.4860 ± 0.0009 | 0.2868 ± 0.0002 | — |
| 1033 | 0.8764 ± 0.0001 | 1.2130 ± 0.0002 | 0.7120 ± 0.0001 | 3.4856 ± 0.0012 | 0.2867 ± 0.0001 | 1.1187 ± 0.0001 |
| 0.5 mm plate | ||||||
| 953 | 0.8757 ± 0.0001 | 1.2148 ± 0.0002 | 0.7091 ± 0.0002 | 3.4705 ± 0.0028 | — | — |
| 983 | 0.8754 ± 0.0001 | 1.2125 ± 0.0002 | 0.7104 ± 0.0001 | 3.4773 ± 0.0013 | — | — |
| 1003 | 0.8769 ± 0.0001 | 1.2150 ± 0.0002 | 0.7106 ± 0.0001 | 3.4855 ± 0.0016 | 0.2873 ± 0.0003 | — |
| 1033 | 0.8783 ± 0.0001 | 1.2174 ± 0.0003 | 0.7126 ± 0.0002 | 3.4915 ± 0.0014 | 0.2875 ± 0.0001 | 1.1165 ± 0.0001 |
| 1 mm plate | ||||||
| 953 | 0.8759 ± 0.0001 | 1.2143 ± 0.0002 | 0.7107 ± 0.0001 | 3.4748 ± 0.0010 | — | — |
| 983 | 0.8757 ± 0.0001 | 1.2133 ± 0.0002 | 0.7106 ± 0.0001 | 3.4768 ± 0.0012 | 0.2871 ± 0.0001 | — |
| 1003 | 0.8764 ± 0.0001 | 1.2130 ± 0.0002 | 0.7104 ± 0.0001 | 3.4854 ± 0.0018 | 0.2867 ± 0.0001 | — |
| 1033 | 0.8788 ± 0.0001 | 1.2151 ± 0.0002 | 0.7117 ± 0.0001 | 3.4858 ± 0.0012 | 0.2868 ± 0.0002 | 1.1158 ± 0.0001 |
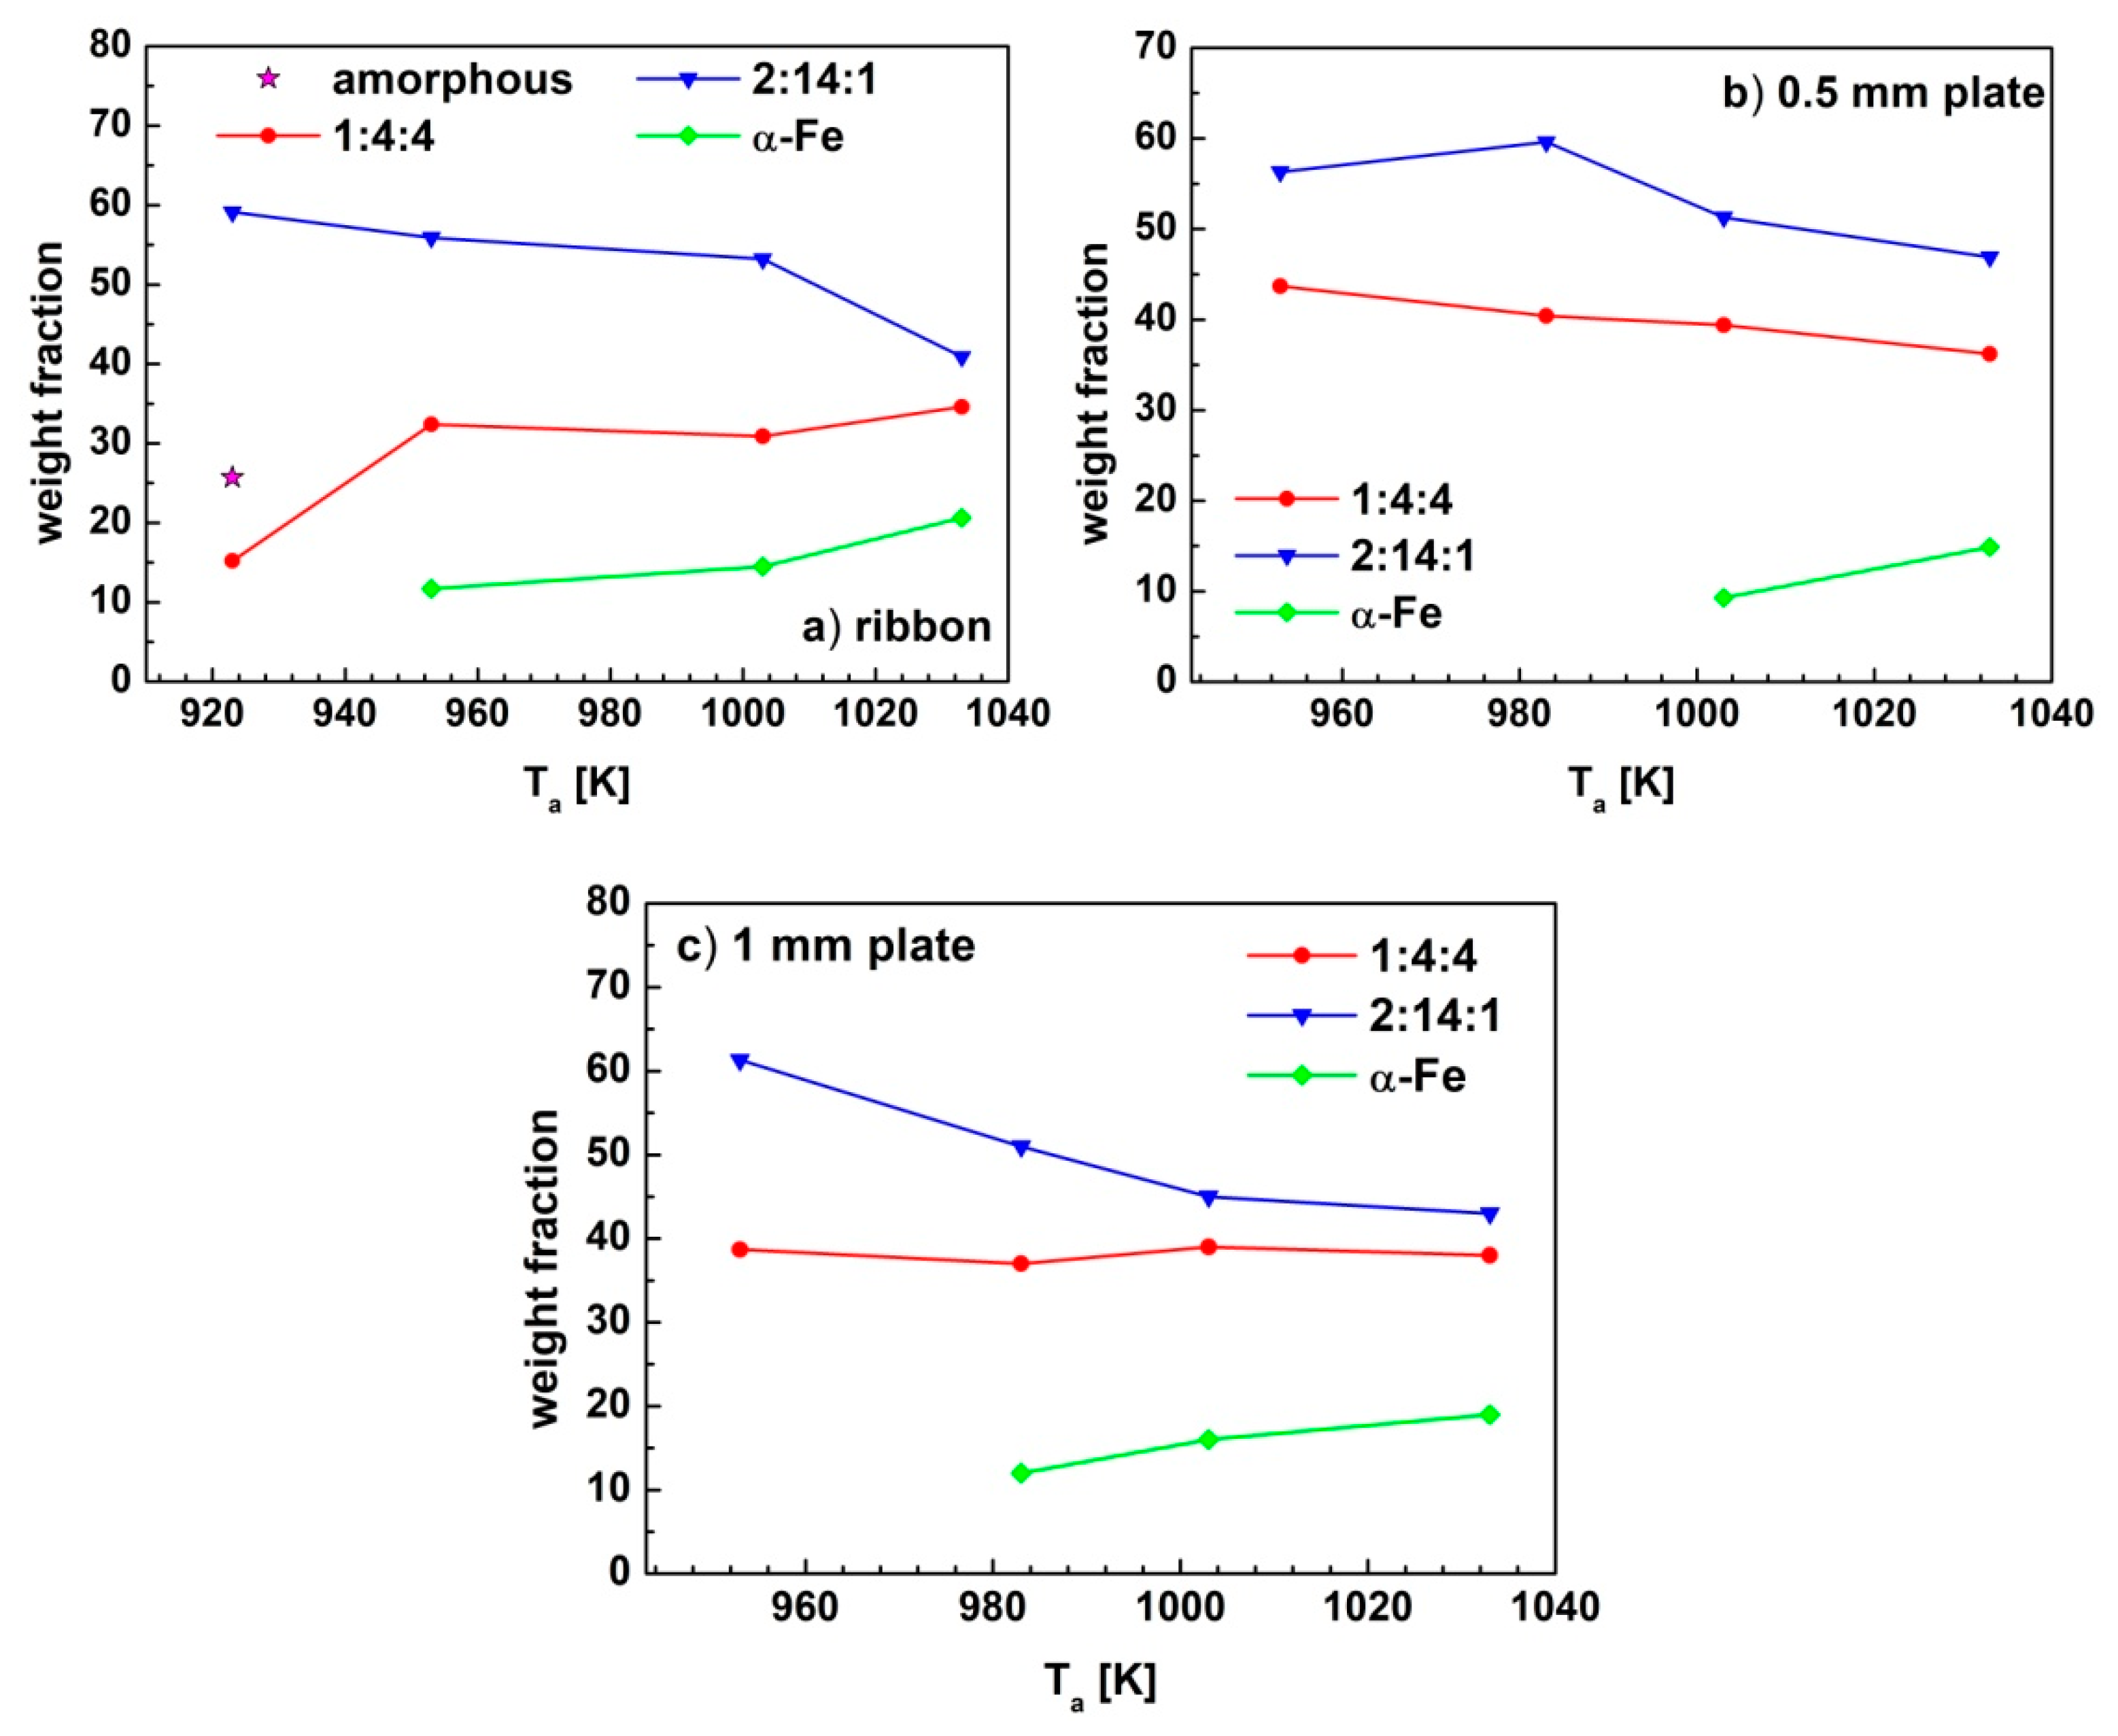
| Phase Space Group | Pr2(Fe,Co)14B P42/mnm | Pr(Fe,Co)4B4 Pccn | α-Fe Im-3m | Pr2O3 Ia-3 | Amorphous | ||||
|---|---|---|---|---|---|---|---|---|---|
| d [nm] | Wf [%] | d [nm] | Wf [%] | d [nm] | Wf [%] | d [nm] | Wf [%] | Wf [%] | |
| Ta[K] | Ribbon | ||||||||
| 923 | 20.0 ± 0.3 | 59.1 ± 0.6 | 7.9 ± 0.2 | 15.2 ± 0.3 | — | — | — | — | 25.7 ± 0.7 |
| 953 | 25.1 ± 0.4 | 55.9 ± 0.5 | 12.3 ± 0.5 | 32.4 ± 0.5 | 18.4 ± 0.5 | 11.7 ± 0.3 | — | — | — |
| 1003 | 29.7 ± 0.8 | 53.2 ± 0.6 | 15.5 ± 0.4 | 30.9 ± 0.6 | 22.4 ± 0.5 | 14.5 ± 0.3 | 29.5 ± 2.3 | 1.4 ± 0.1 | — |
| 1033 | 33.3 ± 1.4 | 40.9 ± 0.6 | 17.9 ± 0.7 | 34.6 ± 0.6 | 31.5 ± 0.6 | 20.6 ± 0.4 | 29.1 ± 1.4 | 3.9 ± 0.1 | — |
| 0.5 mm plate | |||||||||
| 953 | 34.2 ± 0.9 | 56.3 ± 0.5 | 14.4 ± 0.8 | 43.7 ± 0.8 | — | — | — | — | — |
| 983 | 38.3 ± 1.2 | 59.6 ± 0.6 | 16.5 ± 0.7 | 40.4 ± 0.8 | — | — | — | — | — |
| 1003 | 36.3 ± 1.2 | 51.3 ± 0.6 | 22.1 ± 0.7 | 39.4 ± 0.9 | 7.2 ± 0.3 | 9.3 ± 0.3 | — | — | — |
| 1033 | 42.3 ± 1.2 | 46.9 ± 1.4 | 23.1 ± 0.9 | 36.2 ± 1.4 | 12.1 ± 0.7 | 14.8 ± 1.2 | 28.7 ± 1.3 | 2.1 ± 0.1 | — |
| 1 mm plate | |||||||||
| 953 | 30.2 ± 0.8 | 61.3 ± 0.5 | 14.6 ± 0.6 | 38.7 ± 0.6 | — | — | — | — | — |
| 983 | 33.3 ± 1.1 | 51.0 ± 0.7 | 17.3 ± 0.6 | 36.9 ± 0.6 | 7.0 ± 0.4 | 12.1 ± 0.3 | — | — | — |
| 1003 | 38.3 ± 1.1 | 44.9 ± 0.7 | 21.2 ± 0.7 | 39.2 ± 0.7 | 8.2 ± 0.5 | 15.9 ± 0.4 | — | — | — |
| 1033 | 45.2 ± 1.2 | 42.8 ± 0.7 | 23.4 ± 0.8 | 36.8 ± 0.7 | 12.1 ± 0.5 | 18.9 ± 1.1 | 29.2 ± 1.2 | 1.5 ± 0.1 | — |
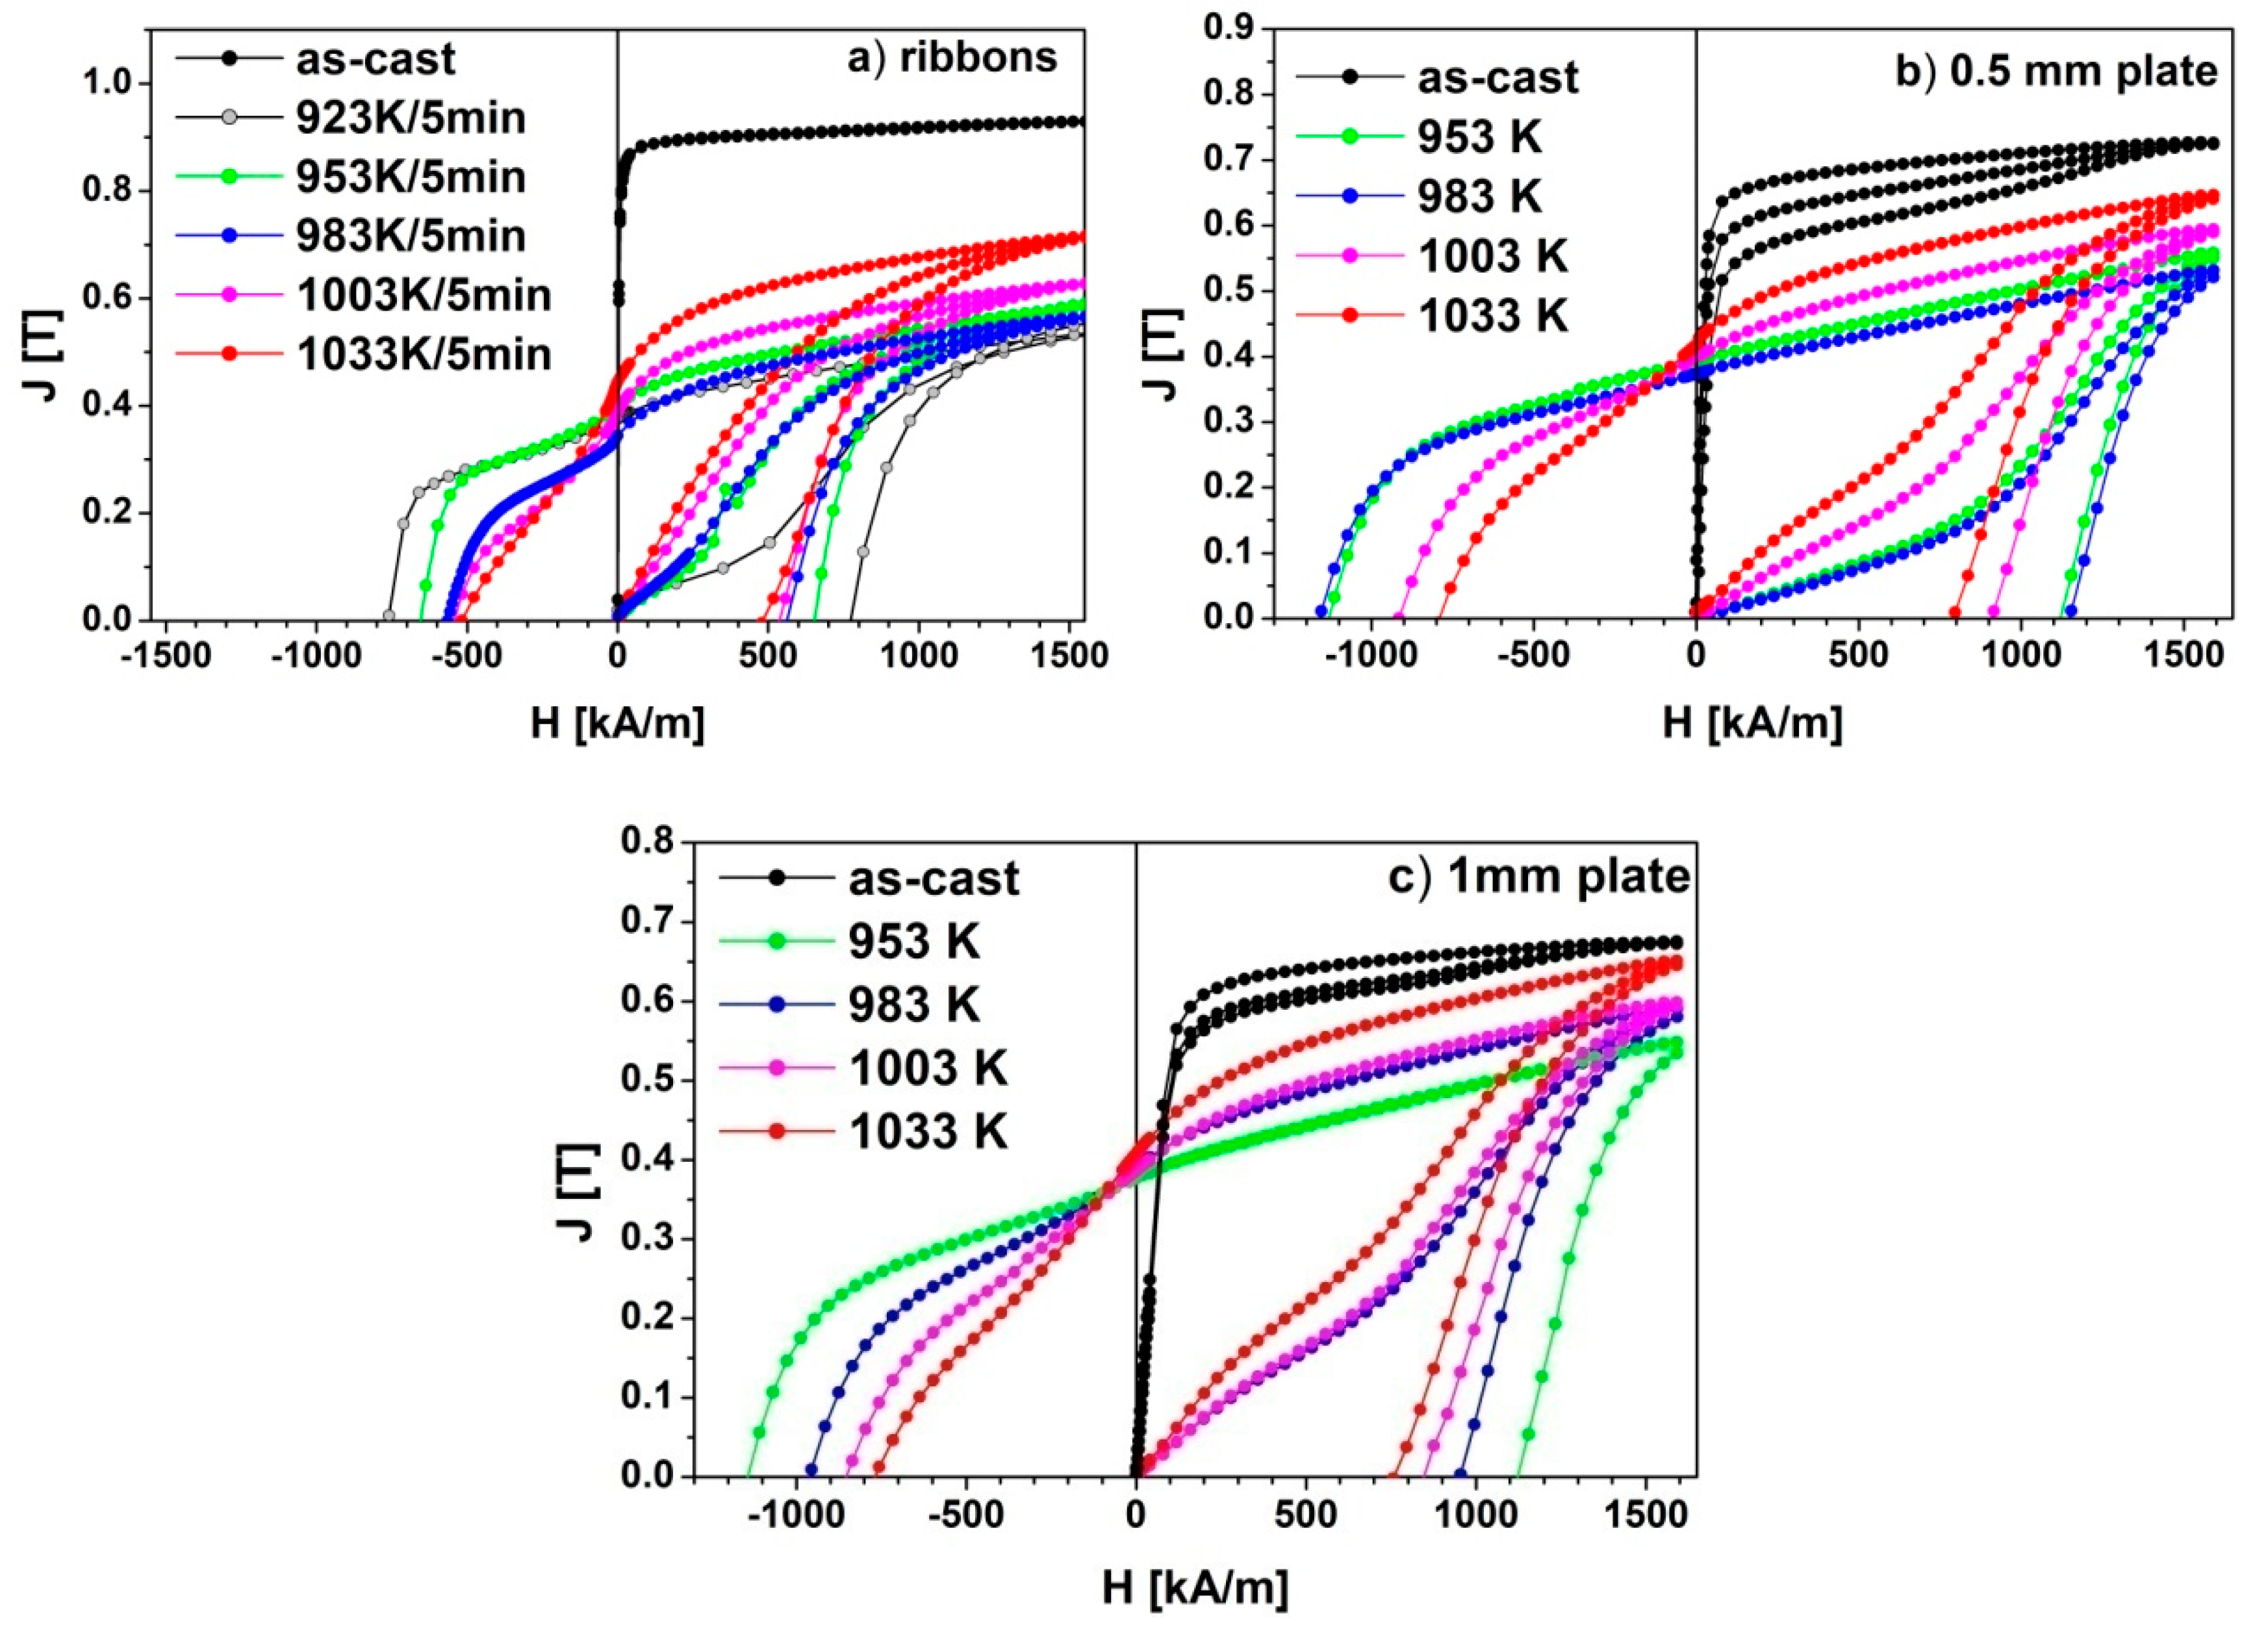
| Ta [K] | Js [T] | Jr [T] | Jr/Js | JHc [kA/m] | (BH)max [kJ/m3] |
|---|---|---|---|---|---|
| Ribbon | |||||
| 923 | 0.541 | 0.377 | 0.697 | 762 | 23 |
| 953 | 0.589 | 0.398 | 0.676 | 656 | 25 |
| 983 | 0.569 | 0.344 | 0.605 | 562 | 21 |
| 1003 | 0.628 | 0.385 | 0.613 | 537 | 17 |
| 1033 | 0.715 | 0.438 | 0.612 | 497 | 20 |
| 0.5 mm plate | |||||
| 953 | 0.550 | 0.388 | 0.705 | 1130 | 28 |
| 983 | 0.524 | 0.367 | 0.700 | 1150 | 25 |
| 1003 | 0.594 | 0.398 | 0.670 | 915 | 26 |
| 1033 | 0.641 | 0.412 | 0.643 | 795 | 26 |
| 1 mm plate | |||||
| 953 | 0.535 | 0.367 | 0.686 | 1150 | 25 |
| 983 | 0.585 | 0.384 | 0.656 | 954 | 24 |
| 1003 | 0.596 | 0.380 | 0.637 | 865 | 23 |
| 1033 | 0.647 | 0.401 | 0.620 | 759 | 23 |
© 2020 by the authors. Licensee MDPI, Basel, Switzerland. This article is an open access article distributed under the terms and conditions of the Creative Commons Attribution (CC BY) license (http://creativecommons.org/licenses/by/4.0/).
Share and Cite
Pawlik, K.; Pawlik, P.; Wysłocki, J.J.; Kaszuwara, W. Structural and Magnetic Studies of Bulk Nanocomposite Magnets Derived from Rapidly Solidified Pr-(Fe,Co)-(Zr,Nb)-B Alloy. Materials 2020, 13, 1515. https://doi.org/10.3390/ma13071515
Pawlik K, Pawlik P, Wysłocki JJ, Kaszuwara W. Structural and Magnetic Studies of Bulk Nanocomposite Magnets Derived from Rapidly Solidified Pr-(Fe,Co)-(Zr,Nb)-B Alloy. Materials. 2020; 13(7):1515. https://doi.org/10.3390/ma13071515
Chicago/Turabian StylePawlik, Katarzyna, Piotr Pawlik, Jerzy J. Wysłocki, and Waldemar Kaszuwara. 2020. "Structural and Magnetic Studies of Bulk Nanocomposite Magnets Derived from Rapidly Solidified Pr-(Fe,Co)-(Zr,Nb)-B Alloy" Materials 13, no. 7: 1515. https://doi.org/10.3390/ma13071515
APA StylePawlik, K., Pawlik, P., Wysłocki, J. J., & Kaszuwara, W. (2020). Structural and Magnetic Studies of Bulk Nanocomposite Magnets Derived from Rapidly Solidified Pr-(Fe,Co)-(Zr,Nb)-B Alloy. Materials, 13(7), 1515. https://doi.org/10.3390/ma13071515