1. Introduction
Thermoplastic (TP) composites are mostly preferred in different manufacturing industries, due to their excellent damping, impact, fracture toughness, recyclability properties, and its ability to be fused or welded to itself or with other materials [
1,
2]. Thermoplastic resin has the ability to soften once heated above the defined temperature range and retain its properties once it is cooled down. Hence, the TP composite is an attractive candidate for the welding of two similar TP composite materials and also with dissimilar materials, like thermoset (TS) composites and metals. There is a growing call from the wide spectrum of industries (aerospace, automotive, sports, and many more) to eradicate the classical ways of joining the polymer composite parts, namely mechanical fastening and the use of control adhesives. The major drawback of using the former is that, due to the holes and cutouts in the composites, they are susceptible to high-stress concentration and it is also labour intensive, whilst the latter requires an incredibly longer curing time as well as the longer surface preparation [
3,
4]. The welding attributes of thermoplastics aids the cost-effectiveness of the composite part to be manufactured in an industrial environment from forming until the finishing steps [
1,
5,
6,
7]. The most feasible welding techniques that are available for fusion bonding of thermoplastic composites are resistance [
8,
9,
10], induction [
9,
11,
12,
13,
14,
15,
16], and ultrasonic welding [
7,
17,
18,
19,
20,
21,
22,
23,
24,
25,
26,
27,
28,
29,
30,
31,
32,
33,
34,
35]. They behave differently in a way the heat is generated at the welding interface.
Ultrasonic welding is an ultrafast joining process for thermoplastic composites. The working principle of ultrasonic welding involves the use of high-frequency (commonly 20 kHz) mechanical vibrations that are transmitted through thermoplastic parts to generate a frictional heat build-up at an interface, which will help the thermoplastic material to melt and flow and then forms the interfacial bond between them [
36]. Ultrasonic welding possesses distinct advantages over other fusion bonding methodologies, such as the higher weld strength, it can be bonded in few seconds, and it is independent of the use of particular extra material at the interface, as required in electromagnetic welding [
37].
Energy director (ED) is a protrusion of the polymer on the laminate surface, which required for obtaining a good bond as it concentrates ultrasonic energy at the interface. ED is an important physical parameter that improves the welding quality. Chuah, Y.K. et al. studied the effect of different parameters on the welding strength of acrylonitrile butadiene styrene (ABS) and polyethylene (PE) [
38]. Three different energy directors were investigated—semi-circular, triangular, and rectangular—and the most efficient was found to be the semi-circular ED followed by rectangular and triangular configuration [
38]. Villegas, I.F. et al. have studied the influence of several configurations of energy directors and investigated the effect of direction of the energy director with respect to the load direction [
25]. They also studied the effect of the size and distribution of multiple energy directors. The results were examined by lap shear testing and no significant effect of the direction of the ED on the lap shear strength (LSS) value was noticed. Whereas, the laminate with multiple ED showed an increase in welding strength increase with the increase in the ED volume up to a certain threshold limit, and a further increase in the ED volume resulted in a reduction of 34% in the LSS value. Many researchers studied the effect of flat ED or flat film of different thickness [
34,
35,
39,
40] on the ultrasonic welding of thermoplastic composites. Goto, K. et al. investigated the shear and tensile strength of the ultrasonic welding of the CF/PA6 composite with flat ED (PA6, 0.3 mm film) and without ED at different weld energies [
34]. Their study showed that the LSS1 value is around 77% higher with flat ED as compared to the adherends welded without ED, while LSS2 showed almost the same result. Palardy, G. et al. [
40,
41] studied the effect of flat energy directors while using the displacement control mode with different material systems. Palardy, G. et al. investigated the effect of the thickness of the flat ED of PEI, 0.06, 0.25, and 0.5 mm on the ultrasonic welding and studied the power curve [
40]. It was deduced from the study welding with the thicker ED films 0.5 mm, they melt first, and then the substrate. While, in the case of 0.06 mm, the film and adherends melt simultaneously.
The ultrasonic welding time is one of the key parameters in the ultrasonic welding process [
42]. Tao, W. et al. [
35] investigated the effect of different welding time on welding strength of carbon fibre reinforced Polyether ether ketone (PEEK) composite with flat PEEK ED by keeping the other parameters constant. This study showed that the welding quality increases with the increase in time from 0.7 s to 0.8 s, but further at higher welding time (1.1 s) large cracks and voids are formed at the interface; 0.9 s was found to be the optimum time for good weld quality. Harras, B. et al. [
18] showed that the optimum joint strength is more related to the total energy input parameter in the welding process than the weld time. Wang, K. et al. [
32] showed that welding energy is one of the dominating parameters for obtaining good quality welding by using a two-level full factorial experiment. Liu, S.-J et al. [
21,
42] investigated the effect of different welding parameters, like weld time, weld pressure, the geometry of the ED, amplitude, hold time, and hold pressure on the weld quality while using the Taguchi method. The materials used for the study were polypropylene reinforced glass fiber composites and Nylon 6 reinforced glass fiber composites. The investigation showed that weld time, the amplitude of vibration, and ED geometry have significant effect on the weld quality.
Recently Arkema developed a novel acrylic thermoplastic resin, Elium
® which is a first of its kind TP resin system to cure at room temperature and it possesses the same in-plane mechanical properties as compared to the high-performance epoxy resin. It can be manufactured while using liquid injection processes, like Resin transfer moulding and vacuum infusion processes, as it possesses a viscosity that can go as low as 50 cP. Already, significant research is reported in the literature investigating the impact [
43,
44,
45,
46,
47], fracture toughness [
48,
49,
50], vibration [
51], flexure [
52,
53,
54], tensile [
54,
55], and other attributes [
56,
57] of this novel resin system with different fibre reinforcements. Murray, R.E. et al. investigated the flexural characteristics of GF/Elium composites for tidal wind turbine blade applications [
58]. Flexural stiffness for the epoxy spar cap was found to be 43 GPa as opposed to 40.4 GPa for thermoplastic Elium spar cap. A research study was carried out on the fusion bonding of the Elium
® composite, by Murray, R.E. et al. [
59]. In this research, resistance welding using different heating elements and induction welding techniques were used to investigate the welding attributes of Glass fibre Elium
® composites for wind turbine blade applications. It was noticed from the study that there was a 30% improvement in lap shear strength for the welded samples as compared to the one bonded with adhesives. At 10 million cycles (defined stress for no failure), the fatigue limit for a fusion-welded sample was also found to be 5 MPa as compared to 3 MPa in the case of the adhesively bonded sample.
Recently, a study was carried out by the Bhudolia, S.K. et al. [
60] on ultrasonic welding of the carbon/Elium
® composite using one configuration of integrated ED and its comparison with the conventional adhesive joint. The results showed a 23% higher lap shear for an ultrasonically welded specimen as compared to the adhesively bonded joints. Additionally, Bhudolia et al. analysed the fatigue response of the welded sample and compared the integrated ED and adhesively-bonded sample [
61]. The result showed a higher fatigue life at a given load as compared to that of the adhesive joints.
It is of paramount importance to investigate the effect of flat energy directors on the welding, as using the energy directors is not a good solution, especially for the part with complex geometries. The current research presents the first attempt at manufacturing different configurations of integrated ED carbon/Elium® laminates and comparing its welding properties to the welded configurations that are fused using a flat energy director. Additionally, a detailed investigation is carried out on understanding the effect of the different types of EDs on the welding attributes of the novel carbon Elium® composite. Current research paves an excellent way of joining Elium® composite parts. It could be significant for wind turbines, automotive, sporting, and other applications where the composite parts are currently joined using sophisticated control adhesives.
4. Results and Discussion
4.1. Initial Experimental Trials
The maximum amplitude in the current welding machine is 65 µm i.e., at 100%. Initially, For integrated ED, all of the trials were carried out at 100% amplitude with varying weld time and weld pressure. However, the welded samples resulted in (1) the excess amount of resin flowing out of the interface and (2) massive delamination of the top adherend. At 100% amplitude, the samples were also welded at the low weld time and low pressure, but the same phenomenon was observed. This phenomenon is attributed to the higher energy transfer at the weld interface. So, the amplitude was further reduced, and the samples were welded at 75% (48.75 µm). The welded samples showed more promising results in lap shear tests when compared to the one with 100% weld condition. Additionally, from the literature, it is advised to weld the acrylic-based matrix in the range of 40–70 µm amplitude [
69] and this amplitude falls within the desirable limit. Few samples were welded at 50% amplitude, but the energy director was not melted and there was a visible gap between the adherends. In most of the research available [
34,
35], the amplitude was kept constant and other parameters were varied, so in the current investigation, for integrated ED samples, 75% (48.75 µm) amplitude was used as a fixed parameter in the welding optimization study.
Similarly, for weld time for integrated ED, the samples were initially welded from 0.5 s to 3 s. The results showed that, when samples were welded with higher welding time i.e., above 2 s, there is significant damage to the sample. At higher weld time, the top adherend was damaged by delamination and fibre crushing. The adherend failed by a minimal manual force as it is over-bonded and damaged. Thus, the range of welding for the current project was selected to be from 0.5 s to 2 s with 0.5 s interval. Initially, the weld pressure used was from 1-bar to 6-bar. Weld pressure that was higher than the 5-bar showed a similar phenomenon of the delamination of the upper adherend while at the pressure lower than 3-bar, the bond was very weak that it can be fractured with manual force. Additionally, visually, a clear gap between the adherends was noticed for an un-bonded joint. In the ultrasonic welding, the energy transferred to the interface is from the top adherend; hence, in the current study for SC-ELC_FL-ELC configuration, SC-ELC adherend was kept on the top. With this methodology, energy directors can be more efficiently used. In SC-ELC_2SC-ELC configuration, SC-ELC adherent was placed at the top. Considering hold time is not the significant weld parameter [
35,
42], as compared to the other welding parameters, in the current investigation, it was kept constant at 2 s.
For flat laminates with ELF configurations, trials were also carried out at 50%, 75%, and 100% amplitude. For flat laminates, at 100%, and even at 75%, the top adherend showed the delamination and fiber breakage. But at 50% amplitude (32.5 µm) it showed more promising results. Similarly, for the flat welding configuration, initial trials were carried out with the same time range of the above-mentioned ED integrated configurations, but the bonding was found to be excessively too weak and it broke by manual force. Further adherends were tried to be welded from 3.5 s to 6 s. At 3.5 s, the bond was still weak, but it showed better results from 4 s onwards. But at the higher weld time of 6 s, adherends were found to be over-bonded. Accordingly, in the current study, a weld time of 4 s to 5.5 s was selected with a 0.5 s interval. The weld pressure was kept the same for flat ED configuration as with the above-mentioned ED integrated configurations i.e., 3-, 4-, and 5-bar. Initial trials were also carried out to understand the film thickness effect with 0.25, 0.5, and 0.9 mm ELF. For 0.9 mm thick film, proper bonding was not obtained between the adherends due to the presence of an excess amount of the resin, which does not help in welding. Whereas, for 0.25 mm and 0.5 mm ELF showed better results. Hence, in the current study detailed optimization is carried out with 0.25 and 0.5 mm thick ELF. For all of the configurations with flat laminates, the hold time was kept constant at 4 s.
Figure 8 shows the over bonded (a–c) and under-bonded (d) welded specimen of the initial trials. Where clear delamination and the fiber breakage can be observed in the over-bonded specimen, while an un-melted ED can be observed for under bonded specimens.
Figure 9 shows a summary of the initial trials and welding parameters (weld time and weld pressure) effect on the bonding conditions.
In the current research, the full factorial design (FFD) was used as the design of experiments. From the initial trails, as mentioned above, the following are the welding parameters selected for the welding of the adherends with the different weld configurations shown in
Table 4.
Analysis of variance (ANOVA) is a statistical method that is used to find out the impact of the independent factors on the dependent factor in regression analysis and to show the dominating factor which affects the response [
70,
71]. It checks the impact of one or more factors by comparing the means of different samples. In the current project, ANOVA analysis is used to determine the most significant and influencing factor that affects the lap shear strength (LSS) results. Minitab 19 was used to execute the ANOVA analysis.
4.2. Welding of Elium® Composites with Integrated Eds
Figure 10 and
Figure 11 show the Load vs. Displacement curves for the welding conditions at three different weld pressure (W
p) that correspond to four different weld time (W
t), namely SC-ELC_2SC-ELC and SC-ELC_FL-ELC configuration, respectively. It should be noted that the presented graphs are the best representative curve of the average values of the three trials at each welding condition and the standard deviation of the value is represented in Figure 13 and Figure 14, showing the lap shear strength. A small non-linearity in load vs. displacement curves at the start can be observed, which is usually attributed to the backlash in the testing machine and fixture, being is around 0.1 mm of displacement. Later, the graphs show the linear behaviour until it reached the maximum load, followed by drastic load drop showing the complete failure of the welded bond of the laminate.
Both of the ED integrated configurations, at some constant pressure, the maximum load value keeps increasing with an increase in the weld time up to an instance after which a further increase in weld time shows the reduction of the peak load value or the corresponding weld strength of the sample, as depicted
Figure 10 and
Figure 11. The weld time after which the load starts reducing represents the maximum/optimal weld strength condition corresponding to a specific pressure condition. A further increase in weld time after the optimal scenario will keep reducing the weld strength. Tao, W. et al. observed a similar effect, where they have investigated the ultrasonic welding of CF/PEEK composites at a different weld time with and without ED [
35]. Similarly, it can also be depicted from the graphs that the displacement representing the elongation also follows a similar trend; it increases to a maximum value corresponding to the maximum load value and then it starts reducing.
Displacement and weld strength changes can both be explained, as, with the increase in weld time, the amount of weld energy at the interface increases as at a specific pressure, the weld time is directly proportional to the weld energy that is transferred to the adherend [
72]. Higher energy at the interface helps in the melting and flowability characteristics of the energy directors and the adherends can be more efficiently welded and result in increases of the weld strength. Higher energy also helps the frequency to be transferred to the bottom adherend and the matrix to melt and significantly adds to the strength. Once an optimal weld strength has been reached, any further increase in weld energy i.e., weld time, at the interface will reverse the phenomenon and, as a result, there will be excessive melting of resin, which will lead to squeezing it out from the interface. The insufficient amount of resin led to less deformation and the sample easily fails without taking a significant load. On the contrary, at a lower weld time, the amount of energy that is transferred to the interface is not enough to melt the resin and fusion bond it to the bottom adherend. For instance, for SC-ELC configuration at 3-bar pressure, the obtained energy values at 0.5 s, 1 s, 1.5 s, and 2 s were 456.65 J, 903.55 J, 1243.1 J, and 1598.5 J, respectively. The energy values clearly show the trend of increase with the increase in weld time at a particular weld pressure. At 0.5 s weld time, the energy of 456.65 J is too low for the welding and, hence, resulted in lower weld strength. On the contrary, at weld time of 2 s, the amount of energy i.e., 1598.5 J was found to be significantly higher for the welding and a drastic drop of peak load can be observed. A similar phenomenon of energy was observed for all of the weld conditions.
The load values from the Load vs Displacement graph, as discussed in the previous section, is used to identify the weld effectiveness and weld quality. Two different LSS values were calculated, LSS1 and LSS2, respectively, for both the configuration of welding. LSS1 was calculated while using the total overlap area (25.4 × 25.4 mm2) and LSS2 was calculated using the actual welded area of the samples.
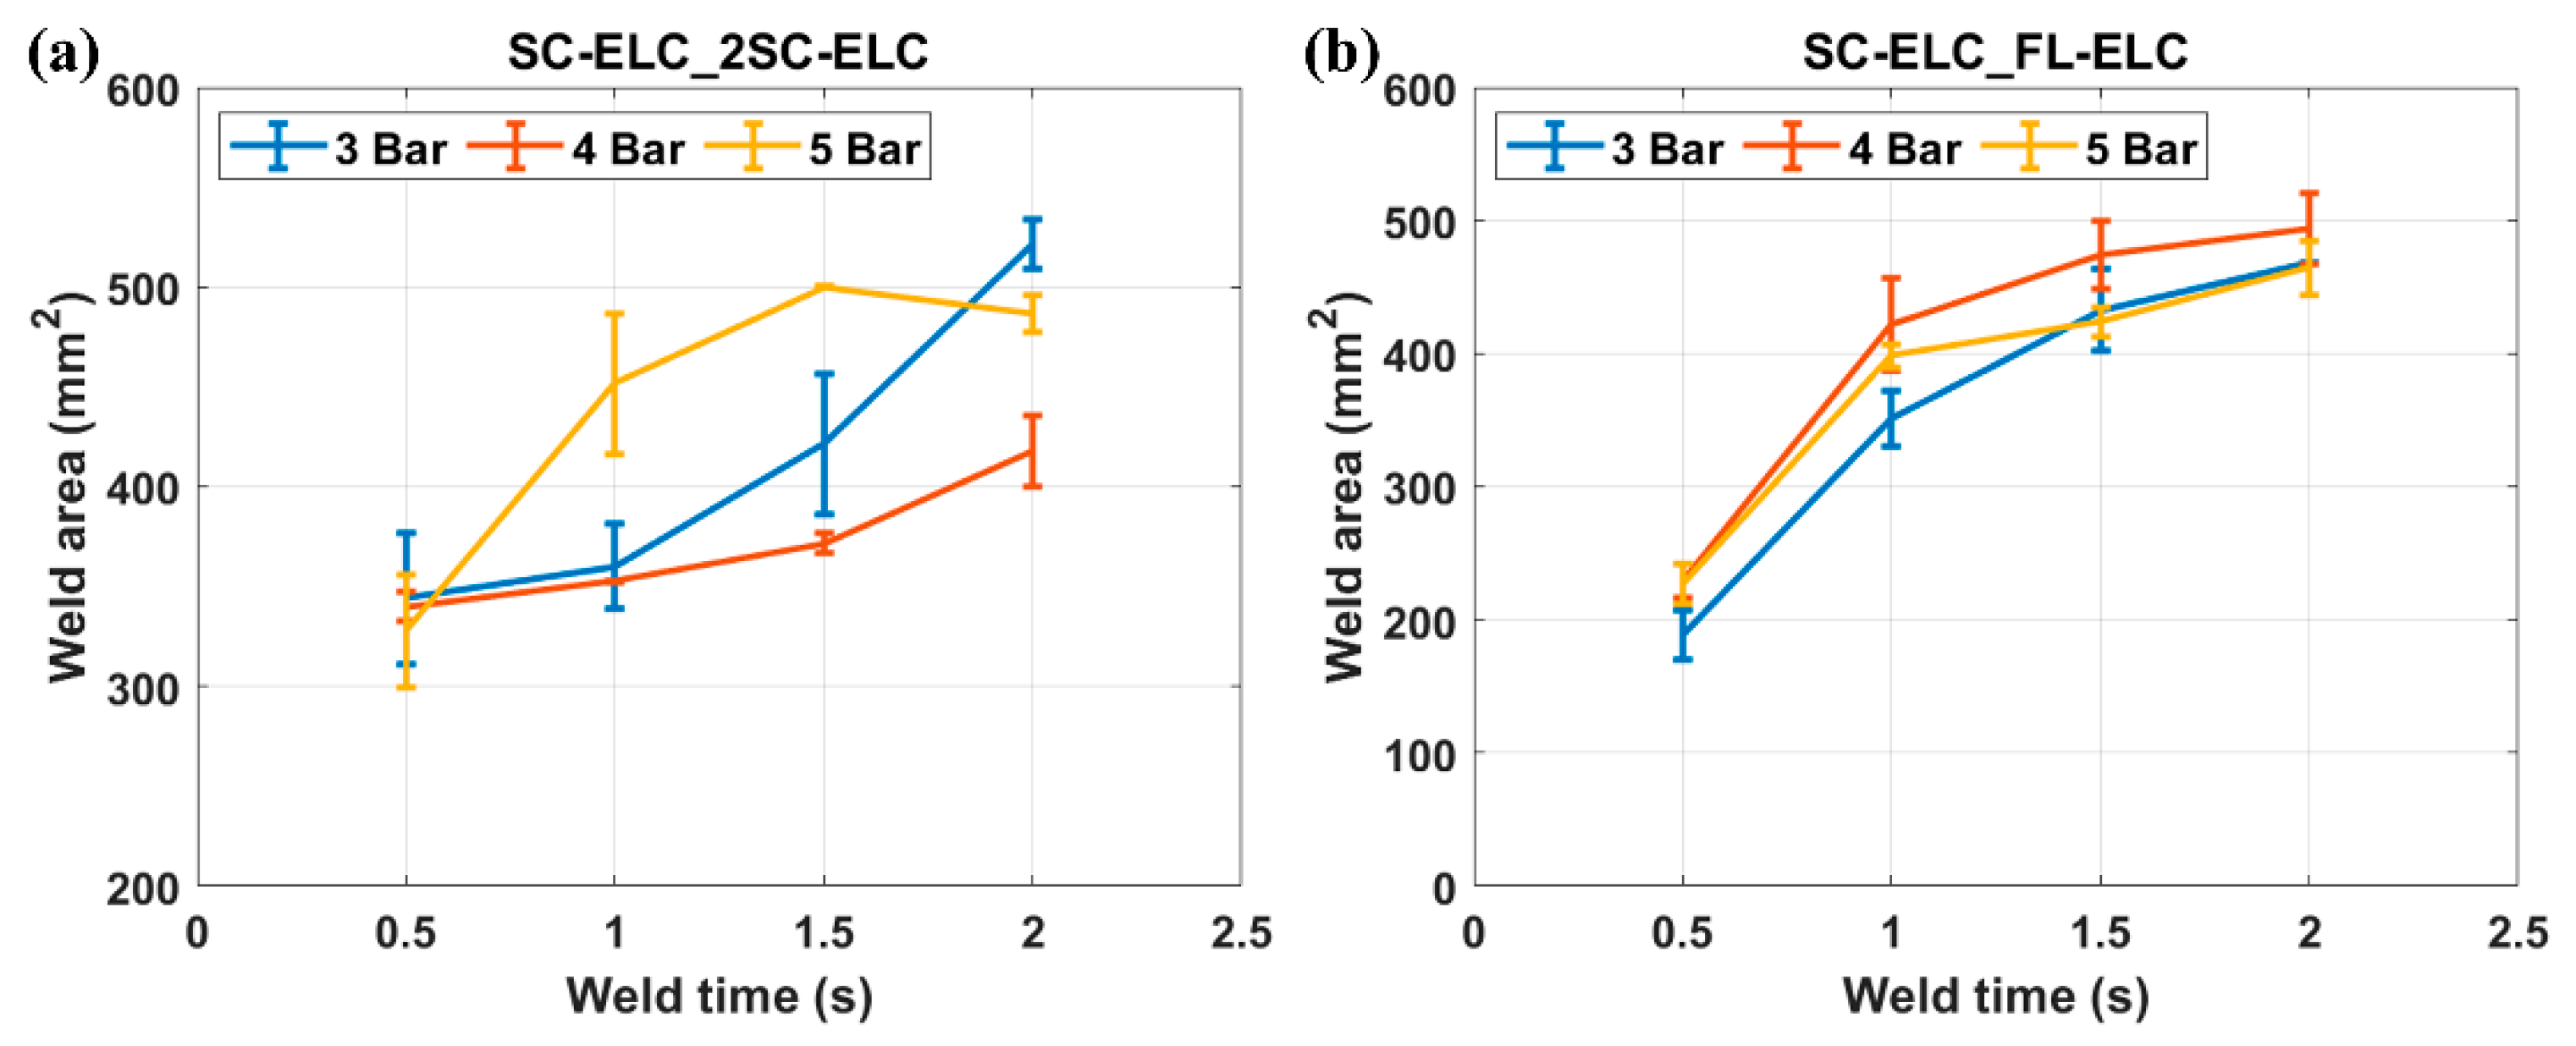
The actual welded area was calculated for all of the welding conditions using
ImageJ software for SC-ELC_2SC-ELC and SC-ELC_FL-ELC configurations, as shown in
Figure 12.
Figure 12 clearly shows that the welded area increases with the increase in weld time for each weld pressure condition. This can be explained as with the increase in weld time, the energy concentration at the interface increases, and in turn elevates the temperature at the interface. This resulted in more melting of resin and it flows over a larger area.
Figure 13 and
Figure 14 depict the LSS1 and LSS2 values of the specimens at different welding conditions for SC-ELC_2SC-ELC and SC-ELC_FL-ELC configurations, respectively. The lap shear curves show a similar trend as can be observed in the load-displacement curve.
Figure 13 and
Figure 14 show that the LSS value increases with an increase in the weld time at specific pressure the but after the optimal weld time has reached, it starts reducing. Further increasing weld time significantly reduces the LSS value. This is due to more energy concentration during welding for a longer period. At higher energy, the temperature at the interface also rises, which led to fiber breakage, delamination, and other phenomenon. These phenomena were dominant in both configurations and reduced the weld strength. It will be explained in more detail later in the section. In both the configurations, LSS2 graphs show that with the increase in the weld pressure, the weld strength remains constant or there is a slight reduction. The results at 3-bar and 4-bar has shown nearly similar weld strength, but for both the configuration at 5-bar, it has shown a drastic reduction in the weld strength. It can be explained as, at higher pressure, the resin squeezes out of the interface and it also damages the adherend, which reduces the weld strength.
From
Figure 13, it can be observed that, for SC-ELC_2SC-ELC configuration, the maximum LSS2 value of 18.68 MPa was obtained at weld time of 1 s and 4-bar pressure, and minimum LSS2 value 8.45 MPa was found at 2 s weld time and 5-bar weld pressure.
A microscopic investigation was also carried out to understand the failure mechanisms and modes of failure. In the current study, the fracture surfaces of the specimen with the highest and the lowest lap shear strength values were analysed.
Figure 15 and
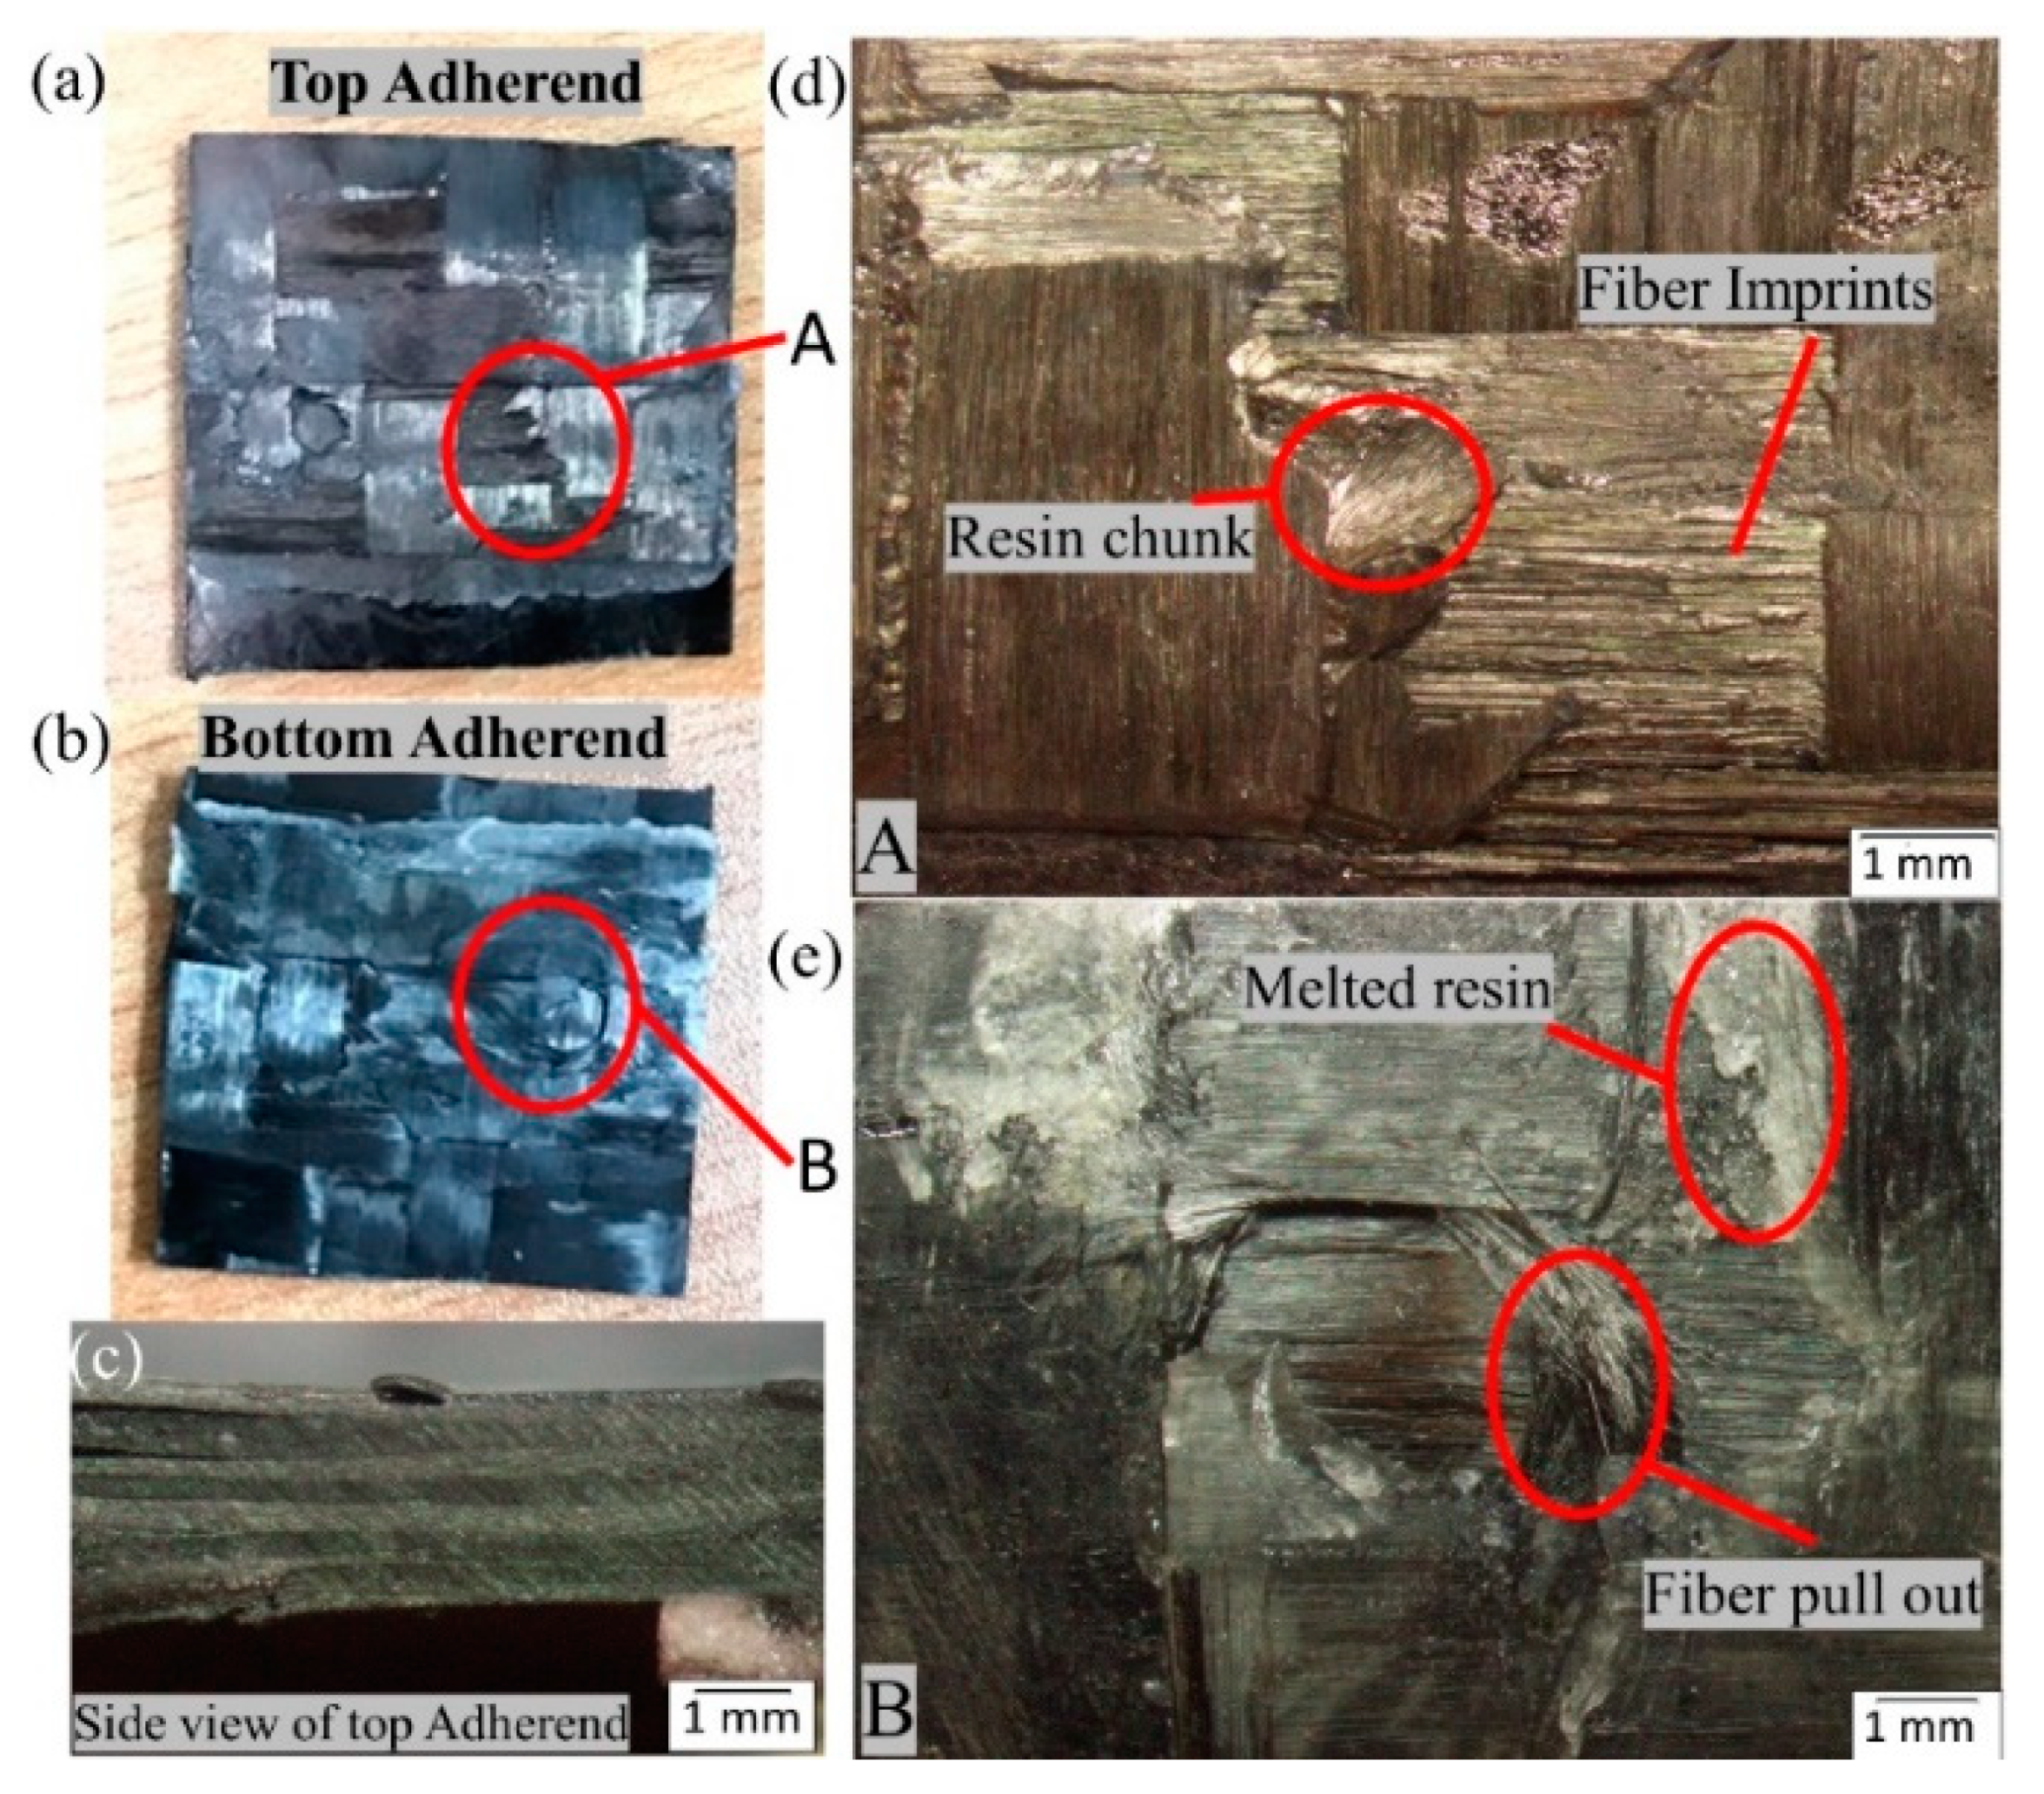
Figure 16 show the microscopic image of the top and bottom adherend of the maximum lap shear strength value and minimum lap shear strength, respectively, for SC-ELC_2SC-ELC configuration.
Figure 15a and
Figure 16a show the fractured surfaces of top adherend, while
Figure 15b and
Figure 16b show the fractured surfaces of bottom adherend and
Figure 15c and
Figure 16c show the top view of the top adherends with maximum and minimum lap shear strength, respectively. As seen from
Figure 15, at point A, fiber impingement can be observed along with fiber imprints and the melted resin chunk. At point B, the fiber pulls out and also the melted resin can be observed. These observations are evident in good interfacial bonding and they represent the cohesive failure of the specimen. Whereas, in
Figure 16 at a point, A it can be seen that there is a bundle of fiber is pulled out, and there is fiber breakage and also in bottom adherend at point B clear fiber breakage and voids can be seen, which represent the higher energy accumulation at the interface due to higher weld time and pressure condition, resulting in the poor adhesion between the adherend. This can also be observed by comparing
Figure 15c and
Figure 16c, which shows the amount of delamination that occurred at the adherend. Additionally, for the sample with minimum LSS value, the adherend is found to be delaminated more and, hence, it cannot play part in providing the strength, as it drastically fails during the static lap shear test. From
Figure 13, at 5-bar pressure, it was noticed that when the weld time is increased from 1.5 s to 2 s, the LSS2 value drops from 14.13 MPa to 8.45 MPa. Similar results can be seen for all of the pressure conditions with corresponding higher weld time parameters.
4.3. Welding of Elium® Composites with Flat EDs
Pure Elium
® films (ELF) were used for the welding of flat Elium
® composite samples without integrated energy directors. Two different thicknesses of films were analysed 0.5 and 0.25 mm. Twelve different welding conditions were examined with both the film thicknesses configurations, as discussed in the previous
Section 4.1. of initial trails.
Figure 17 and
Figure 18 show the load vs. displacement graphs for all of the welding conditions of FL-ELC_FL-ELC configuration with 0.5 mm and 0.25 mm thickness ELF, respectively.
Figure 17 and
Figure 18 show a similar trend, as discussed previously for integrated ED configuration, where the load value increases with the increase in weld time for the given pressure condition up to a certain limit and further increase in weld time reduces the peak load. For a 0.5 mm film configuration specimen, the peak load was attained at 5.5 s for all three pressure conditions. This is more evident in
Figure 19, showing the LSS values at different weld conditions. It was reported from the initial trials that with the increase in weld time to 6 s, top adherend was completely damaged with the fiber crushing as the local heat accumulation at the interface was much higher, which also leads to forming significant voids and deteriorating the weld quality.
For the welding of FL-ELC configuration, a resin film of the same dimension was used for the welding as of overlap area. Accordingly, the total overlap area and the welded area were the same, so only one LSS value is determined for this configuration.
Figure 19 shows the LSS value for all of the welding conditions of welding of FL-ELC configurations with 0.5 mm and 0.25 mm film thickness, respectively. The maximum LSS value for the 0.25 mm film configuration was obtained at the weld pressure of 5-bar and weld time of 5 s, while for 0.5 mm film configuration, it was obtained at weld pressure of 3-bar and weld time of 5.5 s. A thin film of 0.25 mm thickness required higher pressure (5 bar) and higher time (5 s) to be fused with the bottom adherend to obtain the maximum LSS, while 0.5 mm film can be welded at lower weld pressure (3 bar) and 5.5 s, as seen from
Figure 19. The usage of lower thickness ED film leads to higher cyclic strains and hence results in the increase in heat generation on both the adherends. Hence, below a certain thickness, there is a risk of overheating of the interface due to the simultaneous heating and melting of the ED and the adherend [
73]. Hence, in the current investigation, the ED with 0.25 mm thickness yielded lower weld strength as compared to the ED with 0.5 mm thickness.
The fractured samples of the FL-ELC configuration did not show much fiber impingement or fiber damage as observed in the SC-ELC_2SC-ELC and SC-ELC_FL-ELC configurations due to lower viscoelastic heating in the flat film ED as compared to the semi-circular ED. Therefore, for the FL-ELC configuration, visual observations were performed and found to be sufficient for understanding the failure mechanism.
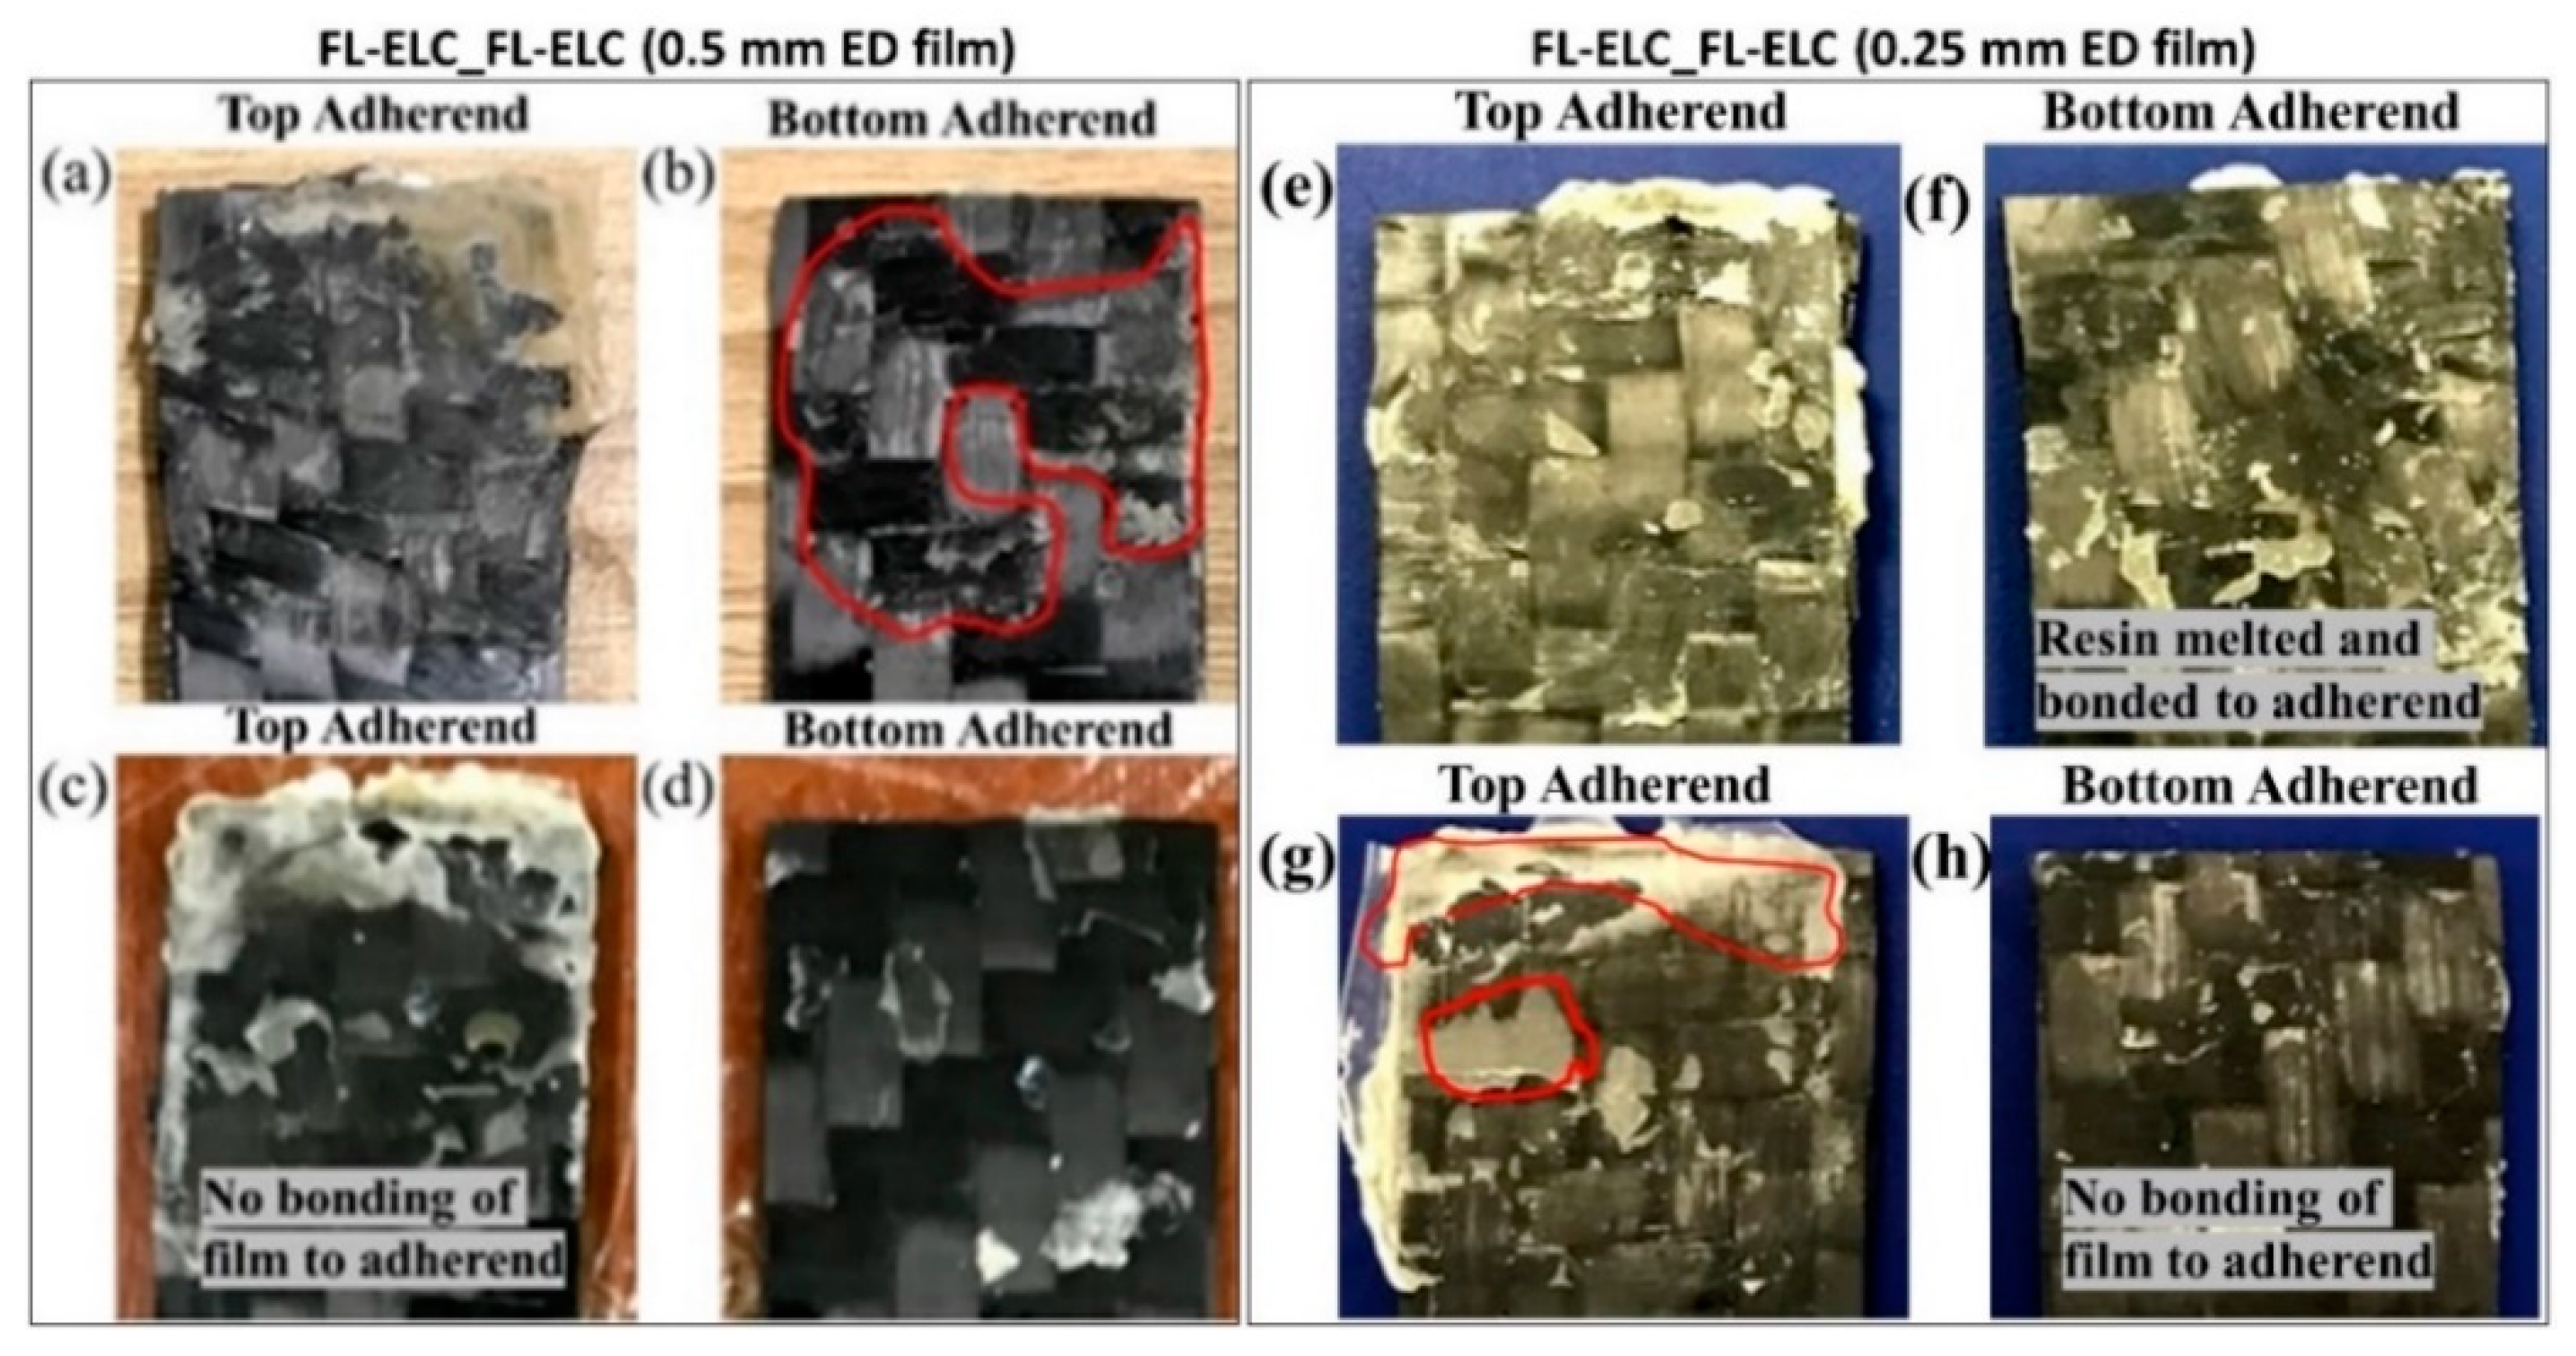
Figure 20 shows the failure images of the top and bottom adherend of the maximum LSS (a,b) and minimum LSS (c,d) under lap shear testing for FL-ELC_FL-ELC configuration with 0.5 mm ELF. The minimum LSS value for 0.5 mm ELF configuration was found at the weld time of 4 s and weld pressure of 3-bar, whereas the maximum LSS value was achieved at weld time of 5.5 s and weld pressure of 3-bar.
From
Figure 20a, the melting of the resin film and its integration with the adherend can be seen, whereas, in
Figure 20c, a clear film can be seen at the top adherend, which is not melted, represents the insufficient energy at the interface for bonding. While comparing
Figure 20b,d, for the laminate with maximum LSS condition, it was noticed that the resin at the bottom adherend marked was partially bonded with the adherend showing that the failure more is partial cohesive model, on the other hand, in
Figure 20d it is evident that the failure mode is purely adhesive failure owing to the lesser weld time of 4 s and weld pressure of 3-bar.
Figure 20e–h shows the fractured images of the FL-ELC adherends welded with 0.25 mm Elium
® film at the interface between the adherends.
Figure 20e,f shows the adherends with maximum LSS value, whereas
Figure 20e,f depicts the one with minimum LSS value. From
Figure 20e,f, it can be seen that there is a melting of the resin and melted resin can be found on both the top and bottom adherends whereas, from
Figure 20g,h, an adhesive failure can be seen i.e., film has not formed a good bond with the bottom adherend.
Figure 20g shows an un-melted resin chunk, which suggests that there was insufficient energy at the interface to melt the Elium
® film, hence it formed a weaker bond.
As for the minimum LSS weld condition, there was lesser weld time and the weld pressure of 4 s and 3-bar respectively as opposed to maximum LSS welding condition with weld time and weld pressure are 5 s and 5-bar, respectively. For the FL-ELC_FL-ELC configuration, the LSS value for different film thicknesses was also compared. It was noticed that the welding of flat samples with 0.5 mm film gives around 25% higher LSS when compared with the flat samples that were welded with 0.25 mm Elium® film. As the film thickness reduces, weld pressure required to form a good bond also increases i.e., 0.25 mm film welding adherend required 5-bar welding pressure, whereas the samples that were welded with 0.5 mm film only required 3-bar of pressure to obtain an optimal bonding between the adherends.
Few trials were also carried out to check the weld results of flat samples while using significantly higher volume resin film i.e., Elium
® film of thickness 0.9 mm, but no improvement in the results was obtained. The maximum LSS value that was obtained in the initial trials was 9 MPa, which is significantly lower when compared to the welded sample with 0.5 mm and 0.25 mm Elium
® film. An explanation to this can be deduced from the failure mode of the adherend, which was found to be an adhesive failure mode and there was also evidence of extensive squeeze out of the molten resin. This indicates the amount of resin is excessively more than required to form an optimal bond. Similar results were explained by Villegas, I.F. et al. [
25] while comparing the different configurations of ED.
4.4. Comparison of Lap Shear Bonding Strength
Figure 21 shows the comparison of the LSS values of all the welding configurations that were performed in the current research. It is to be noted that the comparison for welding is done using LSS2 value, which is the measure of the weld quality. It can be clearly seen that, among all the welding configurations, SC-ELC_2SC-ELC shows the best result with 18.68 MPa, as seen from
Figure 21. Between SC-ELC_2SC-ELC and SC-ELC_FL-ELC configurations, there is not much to separate in terms of LSS values. FL-ELC_FL-ELC (0.5 mm ELF) shows a 35% lower LSS value when compared to ED integrated SC-ELC_2SC-ELC samples showing the effectiveness of the energy director in the ultrasonic welding. From the failure mechanism study, it was noticed that the energy directors helped to concentrate more energy at the interface and, hence, resulted in higher LSS value when compared to the Flat ED configuration. The weld time for the maximum LSS2 value for SC-ELC_2SC-ELC configuration was 1s, while that of FL-ELC_FL_ELC (0.5 mm ELF) is 5.5s. Semi-circular energy directors are found not only to increase the weld strength, but it is also up to four times faster the welding, which is carried out with a 0.5 mm flat ED film.
4.5. Fractography
In the present SEM investigation, the fracture surfaces of the SC-ELC_2SC-ELC and SC-ELC_FL-ELC configurations of lap-shear specimens are investigated in detail. The fracture study is analysed based on the lowest and the highest values of the lap-shear samples under investigation. The range of the lap shear strength values for the SC-ELC_2SC-ELC and SC-ELC_FL-ELC configurations was (8.45 ± 0.05 MPa and 18.86 ±0.14 MPa) and (8.42 ±1.14 MPa 1−7.5 ±1.24 MPa), respectively. Hence, the specimens that are examined under scanning electron microscopy are divided into the above-mentioned groups, the sample with minimum and maximum shear strength values for both the ED integrated configurations.
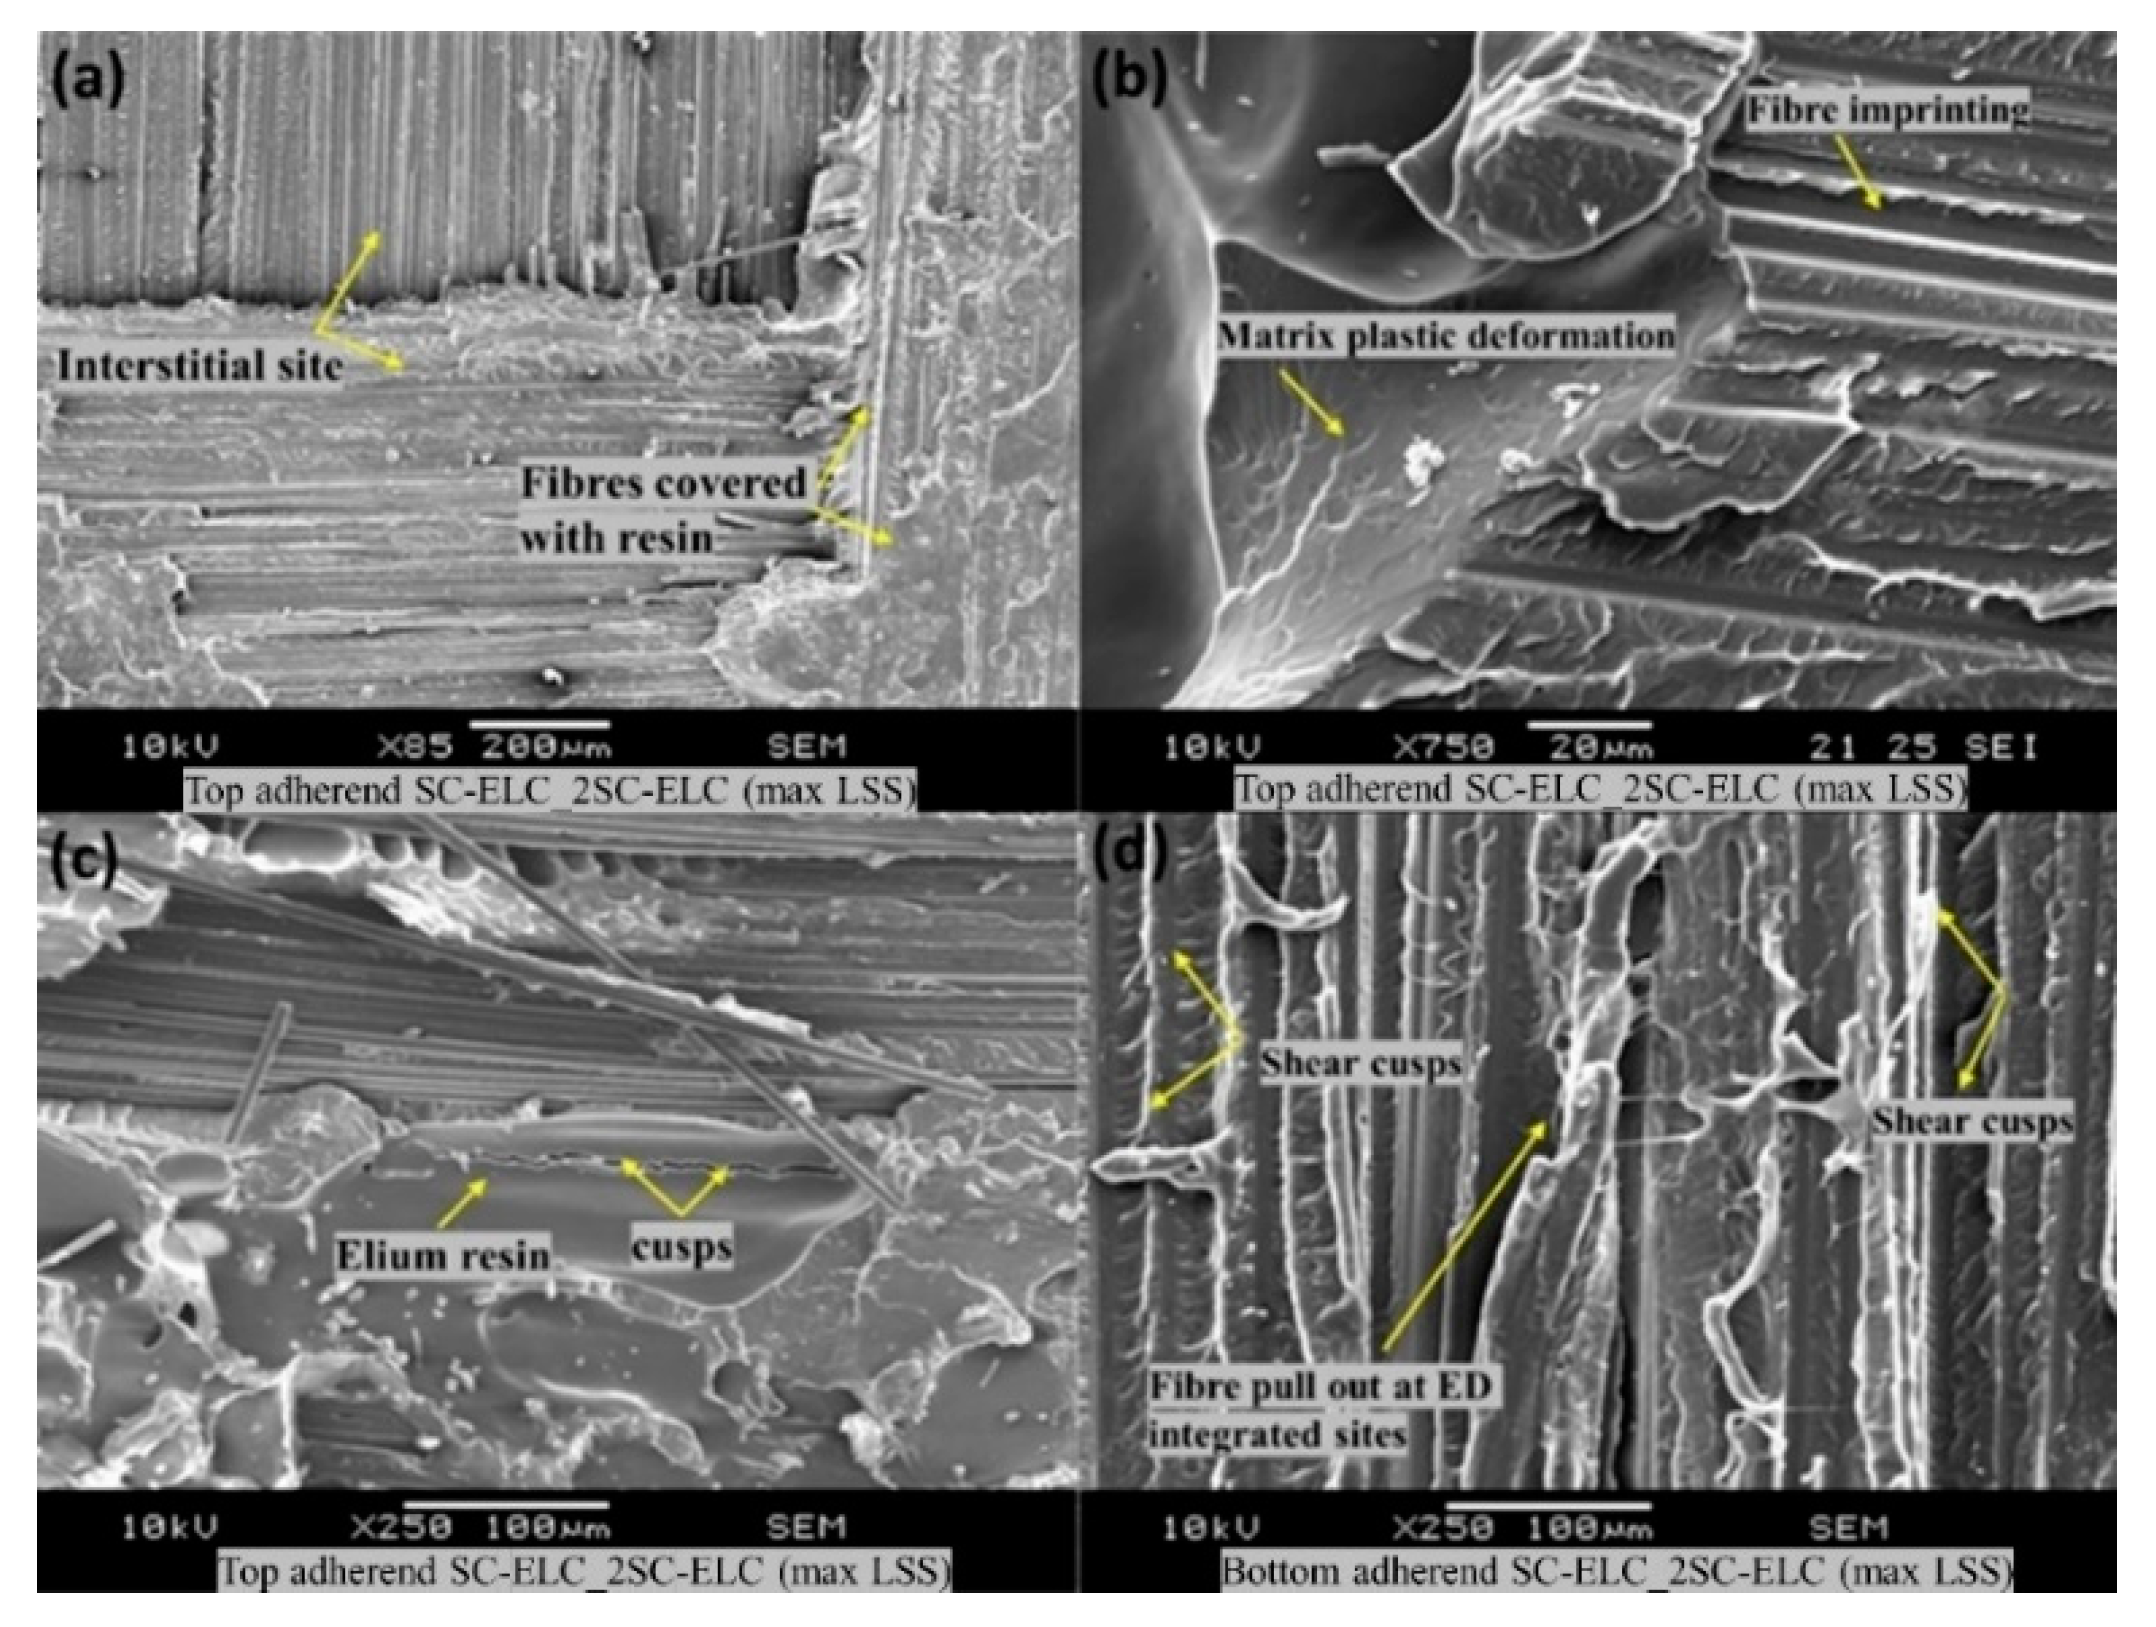
Figure 22 shows the surface morphology of the SC-ELC_2SC-ELC composite laminate with the highest shear strength being achieved at welding parameters: 1 s, 4-bar and 75% amplitude (48 µm). During the welding, both the top (with single ED) and the bottom (with two EDs) adherends have different welding phenomenon and they are investigated.
Figure 22a shows the interstitial site of the twill weave reinforcement, where the fibers are covered with the melted resin. Additonally, there is clear evidence of the formation of the plastically deformed zone at the interstitial site, as seen from
Figure 22a, and it has been further investigated at higher magnification (refer
Figure 22b). As explained in the previous researches [
48,
74,
75], the fracture surfaces noticed in
Figure 22a,b is a typical characteristic of slow and ductile fracture, which is attributed to the viscoelastic property of the thermoplastic matrix, herein is the case with Elium
® resin. This shows that the flat ED affects the LSS value more than the integrated ED, and the thickness of ED film is an important selection parameter for ultrasonic welding.
Figure 22b also shows the fibre imprinting features on the resin, which was caused due to the excellent carbon fibre impingement/anchorage during the welding process [
76]. This feature signifies the excellent carbon fibre/Elium
® interfacial bond after welding.
Figure 22c shows the formation of the cusps, which results from the application of the load on the fibre bundles during the lap shear testing [
77]. This load causes the interlaminar shear at the fiber-matrix interface. The larger shear cusps are evident at the resin dominated sites (refer to
Figure 22c), while the smaller shear cusps are found at the vicinity of the fiber-matrix interfaces, where a relatively smaller amount of resin is present (refer to
Figure 22d). Similar features were noticed by Barbosa, L.C.M. et al. where the welding performance of PPS/glass fiber composite was investigated [
76]. On the bottom adherend, as seen from
Figure 22d, the fibers are found to be covered with resin and the fibre pull out is observed at the ED integrated site, which potentially increases the lap shear strength of the specimen.
Figure 23 shows the fractography of the SC-ELC_2SC-ELC composite laminate with the lowest shear strength of 8.45 ±0.05 MPa achieved at welding parameters: 2 s, 5-bar, and 75% amplitude (48 µm). With the increase in the pressure and the weld time, there was an excess amount of resin that was squeezed out, which consequently lead to voids in the welding region due to the presence of insufficient resin (refer
Figure 23a,b). Additionally, on both the top and bottom adherends, resin deprived bare fibers are noticed along with the poor interfacial bond. These features significantly lowered the welding efficiency of the SC-ELC_2SC-ELC composite and highlighted the necessity of optimizing the weld parameters.
4.6. Analysis of Variance (ANOVA) Results
As discussed in
Section 4.1, Analysis of Variance (ANOVA) was performed to statistically evaluate the result of the given welding parameters and find the significant parameter that affects the weld quality by considering LSS as a response function. Separate ANOVA analysis was carried out each configuration, as the welding parameters for integrated ED and flat Elium
® film ED configurations were different.
The ANOVA analysis of the integrated ED i.e., SC-ELC_FL-ELC and 2SC-ELC_SC-ELC configurations have four levels for weld time (0.5, 1, 1.5, 2 s), three levels for weld pressure (3-, 4-, and 5- bar), and two ED configurations. Similarly, for flat ED, the ANOVA analysis results have four levels of weld time (4, 4.5, 5, 5.5 s), three levels of weld pressure (3-, 4-, and 5-bar), and two ED film (0.5 mm and 0.25 mm) configuration was carried out.
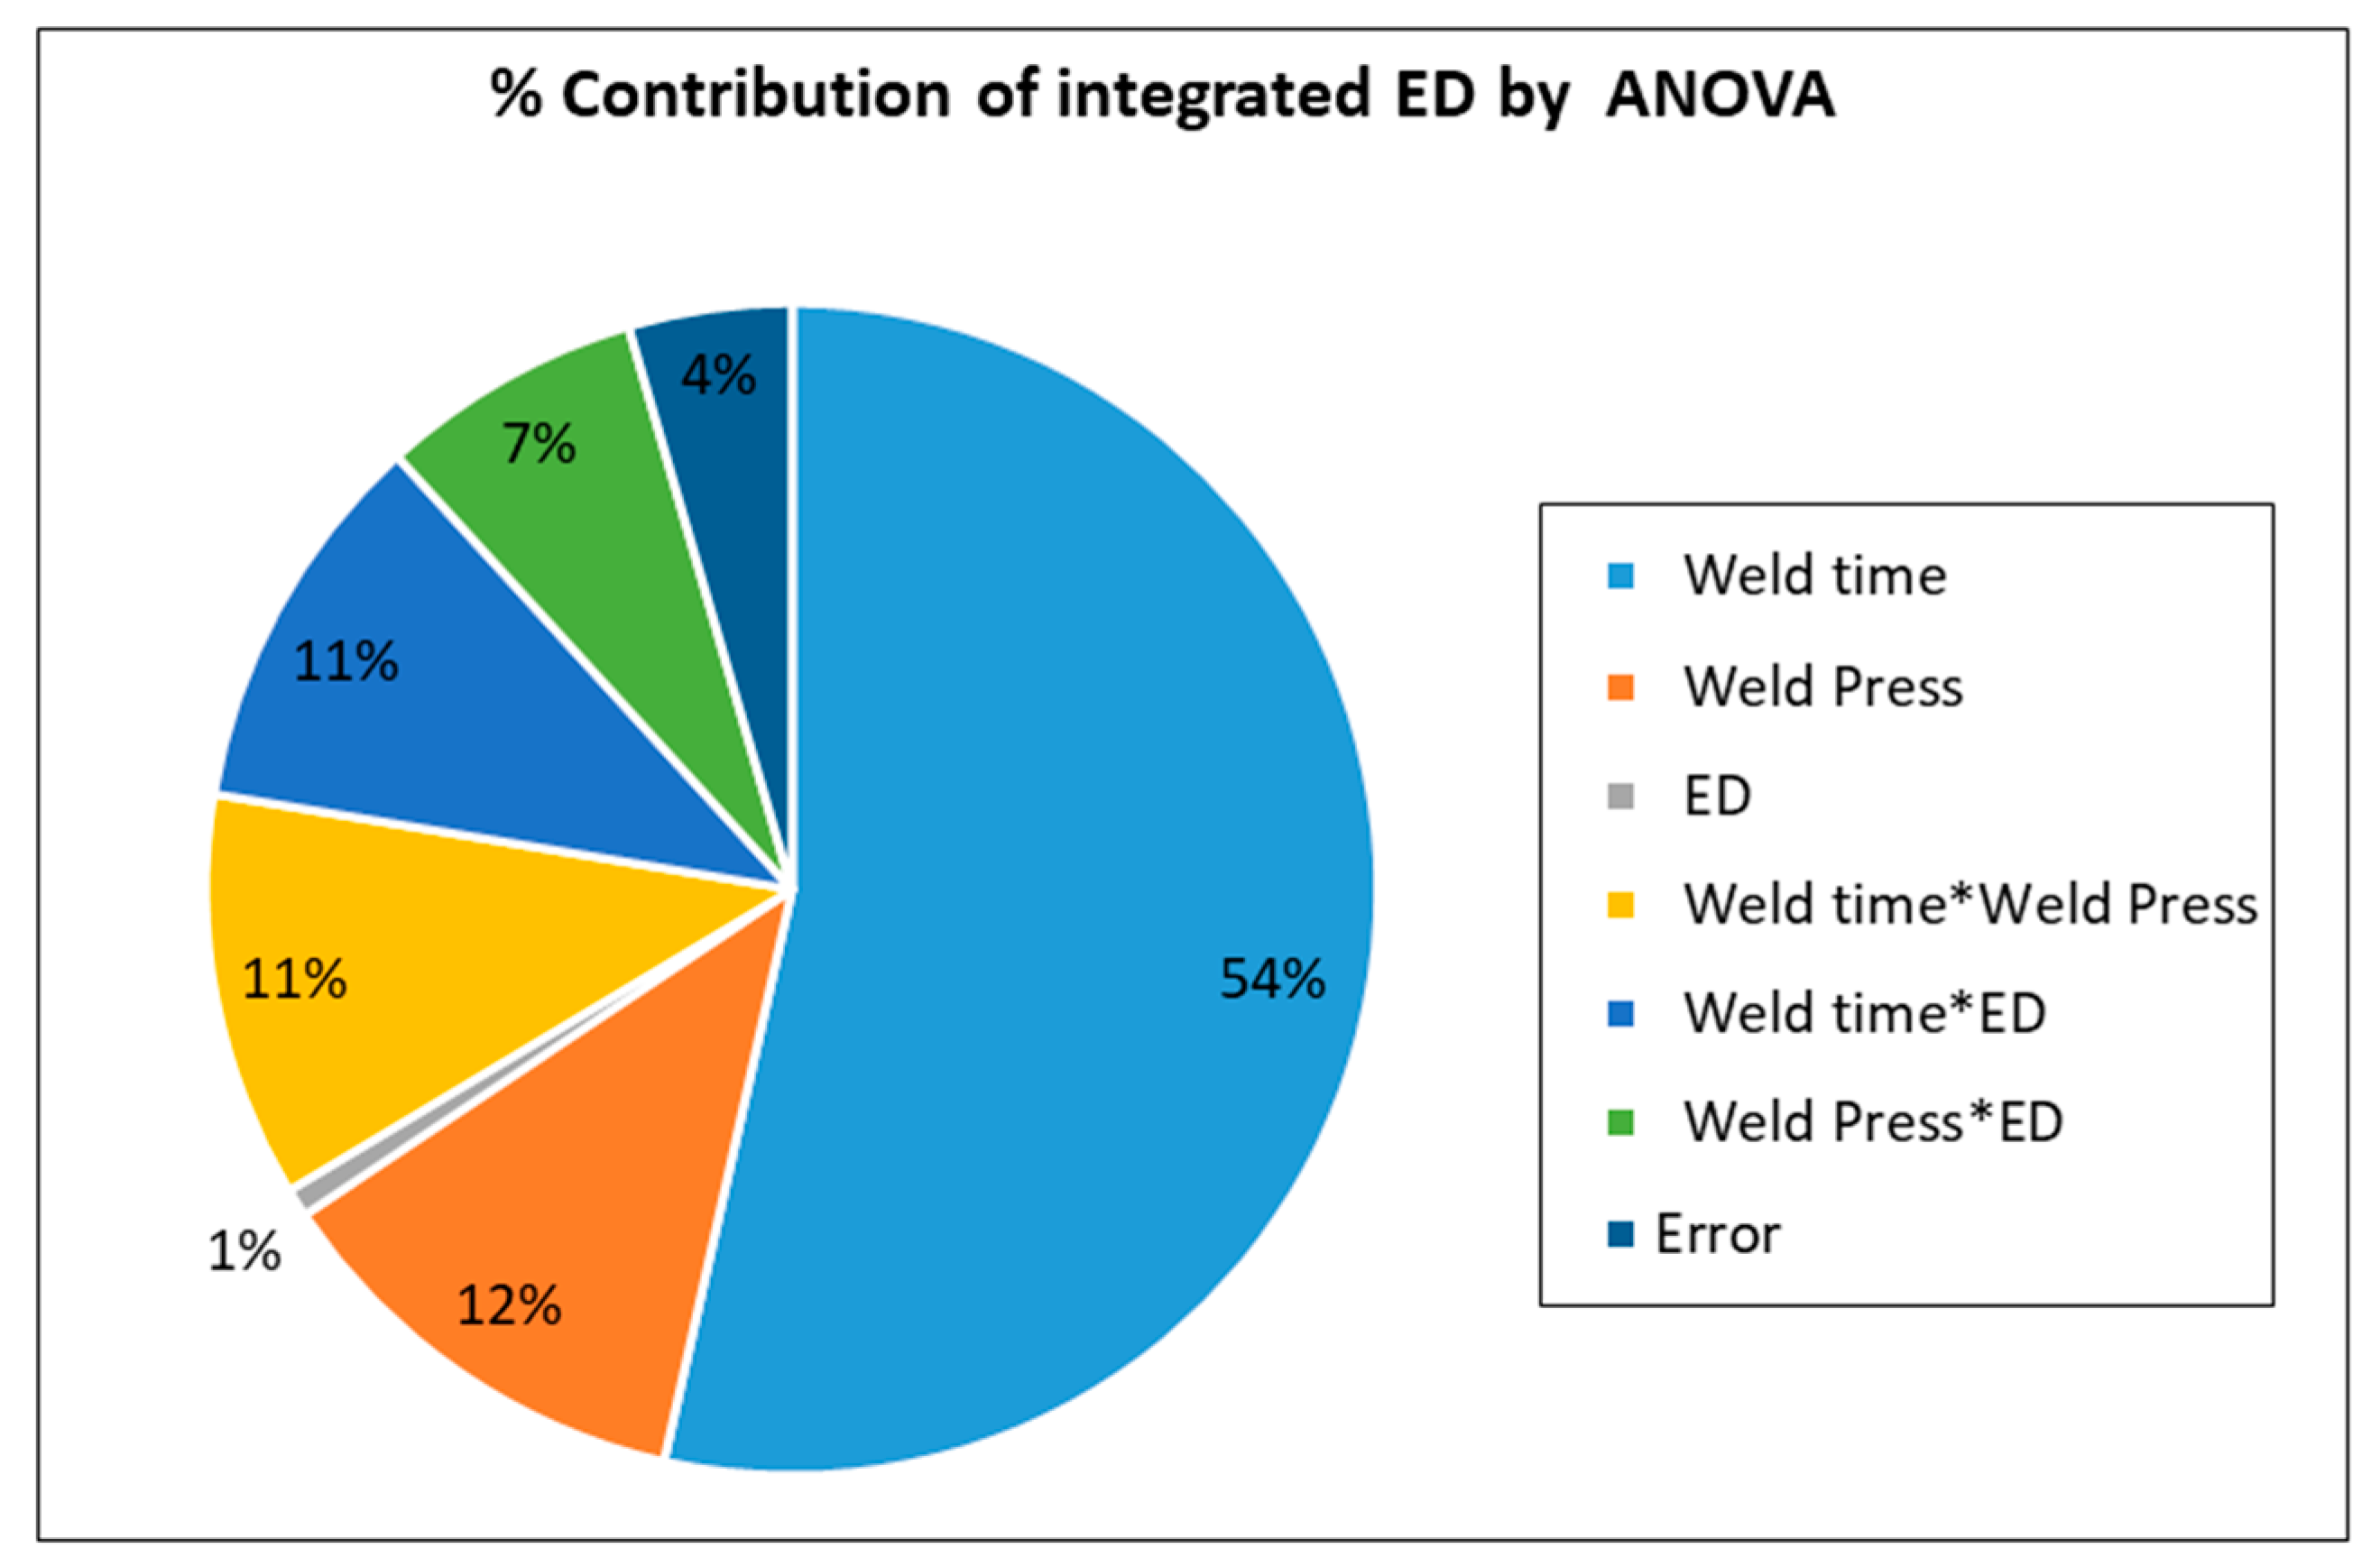
The interactions of the above-mentioned parameters and the % contribution of each parameter and their interactions were also carried out and the values are presented in
Appendix A for more details. The result of the ANOVA analysis clearly showed that the weld time has the maximum % contribution (53.5%) as compared to the other main factors and their interactions. This shows that the weld time has the maximum influence on the welding and it has a major say in determining the LSS2 value. This can be clearly observed from
Figure 13 and
Figure 14, where a small change of weld time by 0.5 s resulted in a considerable change in in LSS. Similarly, the results in the literature also state that the weld time is one of the most influencing factors in welding [
42,
76,
78]. ED has the minimum contribution for LSS value for integrated ED configuration.
For flat ED, ANOVA analysis also showed a similar result and weld time was found to be the most significant factor with a maximum contribution of 40.37%. Whereas, this analysis also confirmed that the weld pressure has a minimum % contribution among the three welding parameters. Interestingly, the ED parameter has also shown a contribution of 19.3%. By increasing the thickness of ELF by 0.25 mm i.e., adherend bonded by 0.5 mm ELF has resulted in an increase in LSS value by 24.6% as compared to adherend bonded by 0.25 mm ELF, as seen from
Figure 19. This shows that the flat ED affects the LSS value more than the integrated ED and the thickness of ED film is an important selection parameter for ultrasonic welding.

 ,
, 


