Towards Macroporous α-Al2O3—Routes, Possibilities and Limitations


Abstract
:1. Preface
2. Literature Review: Synthesis Routes for α-Al2O3 with Increased Specific Surface Area
2.1. Introduction
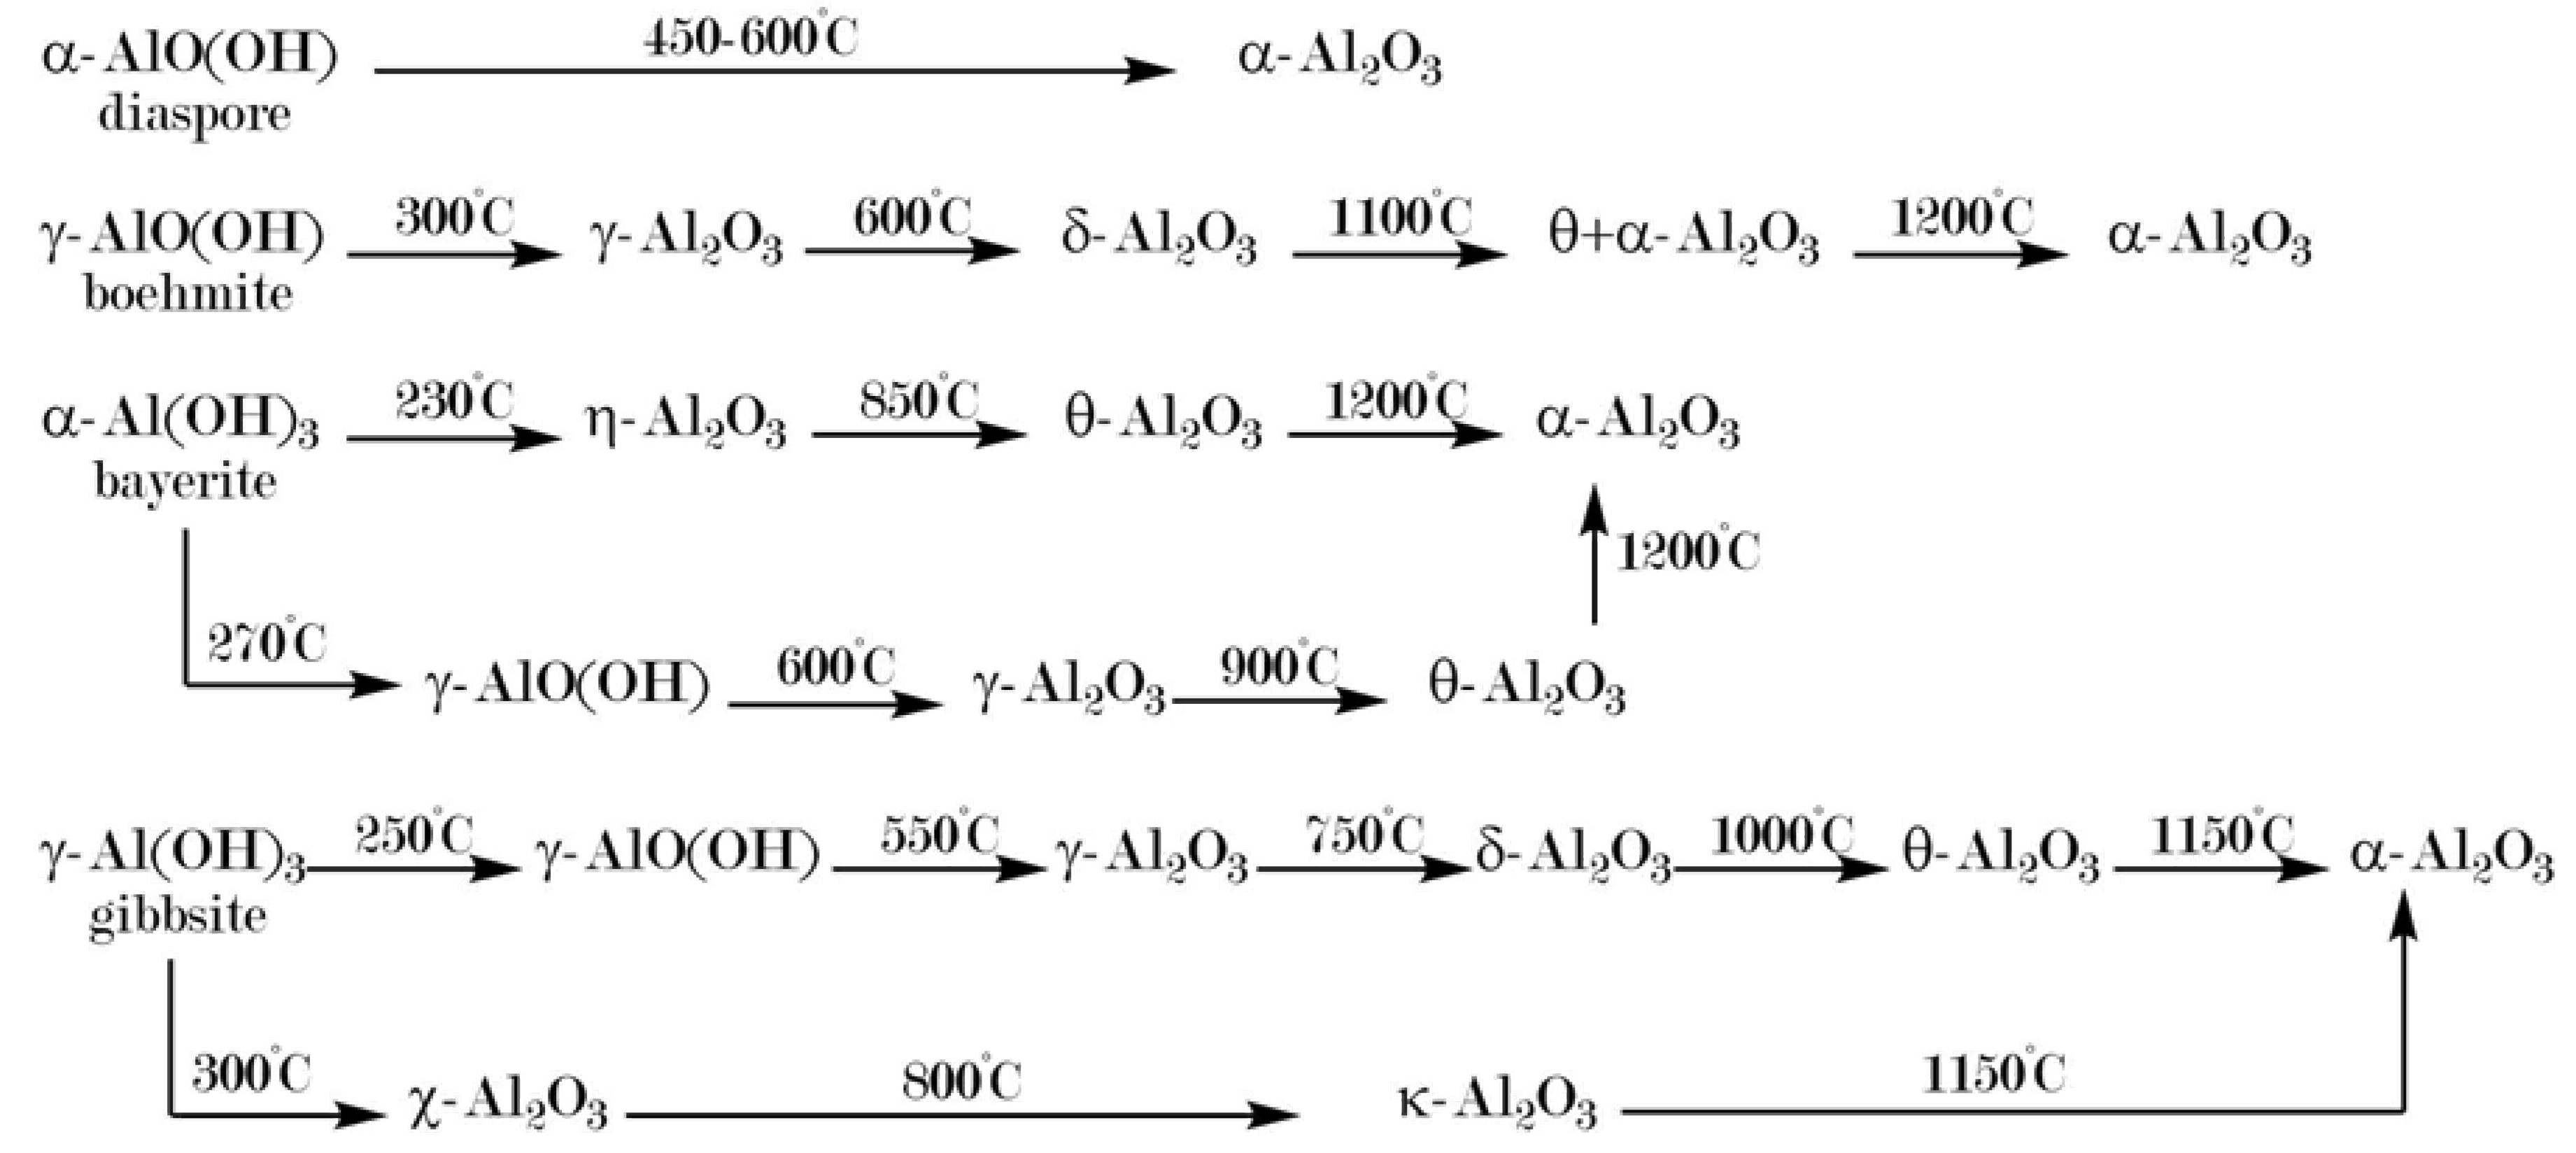
2.2. Diaspore-Derived Corundum
2.3. Hydrothermal Syntheses
2.4. Pore Protection by Carbon Filling
2.5. Introducing Porosity via Soft Templating in Sol-Gel Syntheses
2.6. Porous Membrane Preparation via Anodic Oxidation of Aluminum
2.7. Ultrafine α-Al2O3 Powders with High Specific Surface Area
2.8. Miscellaneous Methods
2.9. Dopants Favoring or Inhibiting α-Transition
2.10. Pure α-Alumina with Pores in the Sub-Micrometer Range
3. Materials and Methods
3.1. Syntheses of Macroporous α-Al2O3
3.1.1. Epoxide-Mediated Sol-Gel Synthesis of Porous α-Al2O3re
3.1.2. Mutual Cross-Hydrolysis in Combined Sol-Gel Synthesis
3.1.3. Anodic Oxidation of Aluminum Chips
3.1.4. Solid Solutions Concept
3.1.5. Pore Protection by Carbon Filling
3.1.6. List of Samples
3.2. Characterization Techniques
4. Calculation of Theoretical Porosity Limits
4.1. Porous Material
- the pore diameter corresponds to the modal pore diameter, dp,mod,
- the pore diameter is constant over the entire length of a pore, meaning that
- the pore is a perfect cylinder withwhere V is the volume, h is the height, and r is the radius of the cylinder,
- all pores of a mode have the same diameter.
4.2. Nanopowder
- particles are entirely non-porous,
- all particles exhibit the same diameter, implying a perfectly monomodal size distribution,
- particles are either
- comparison between the two models is based on uniform particle volume, i.e., constant mass.
5. Recent Results and Discussion
5.1. Epoxide-Mediated Sol-Gel Synthesis of Porous α-Al2O3
5.2. Mutual Cross-Hydrolysis in Combined Sol-Gel Synthesis
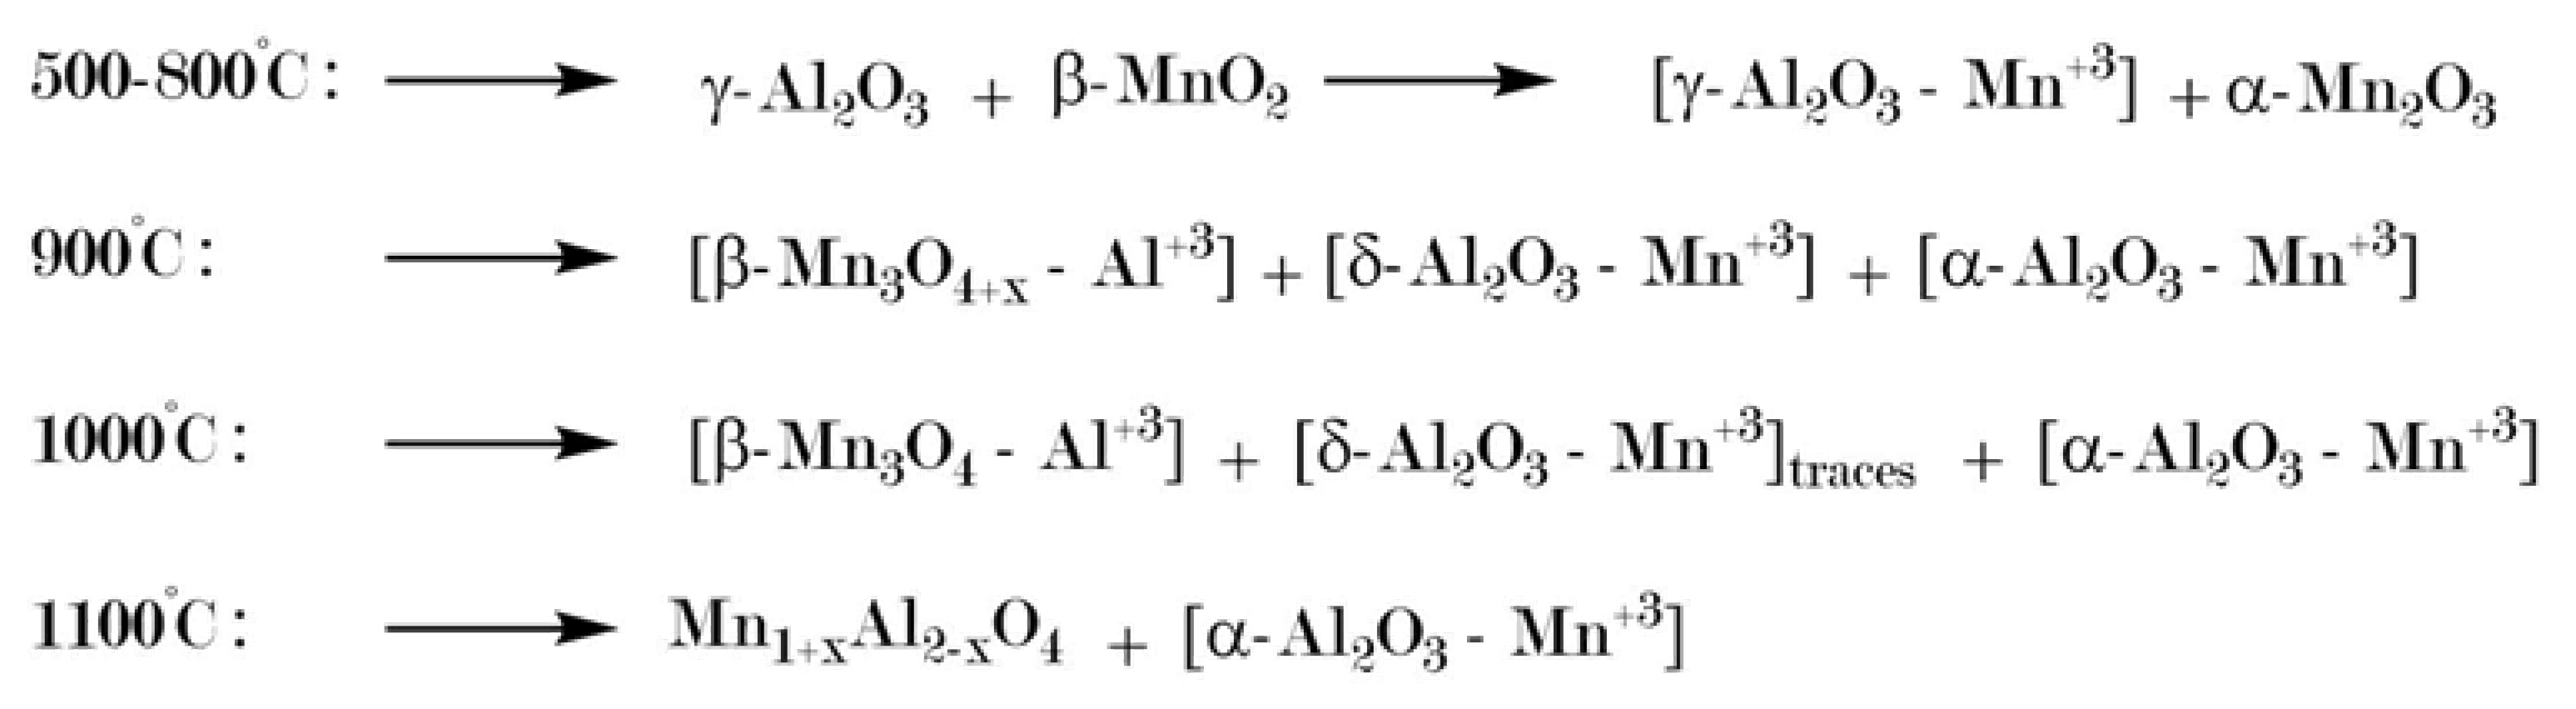
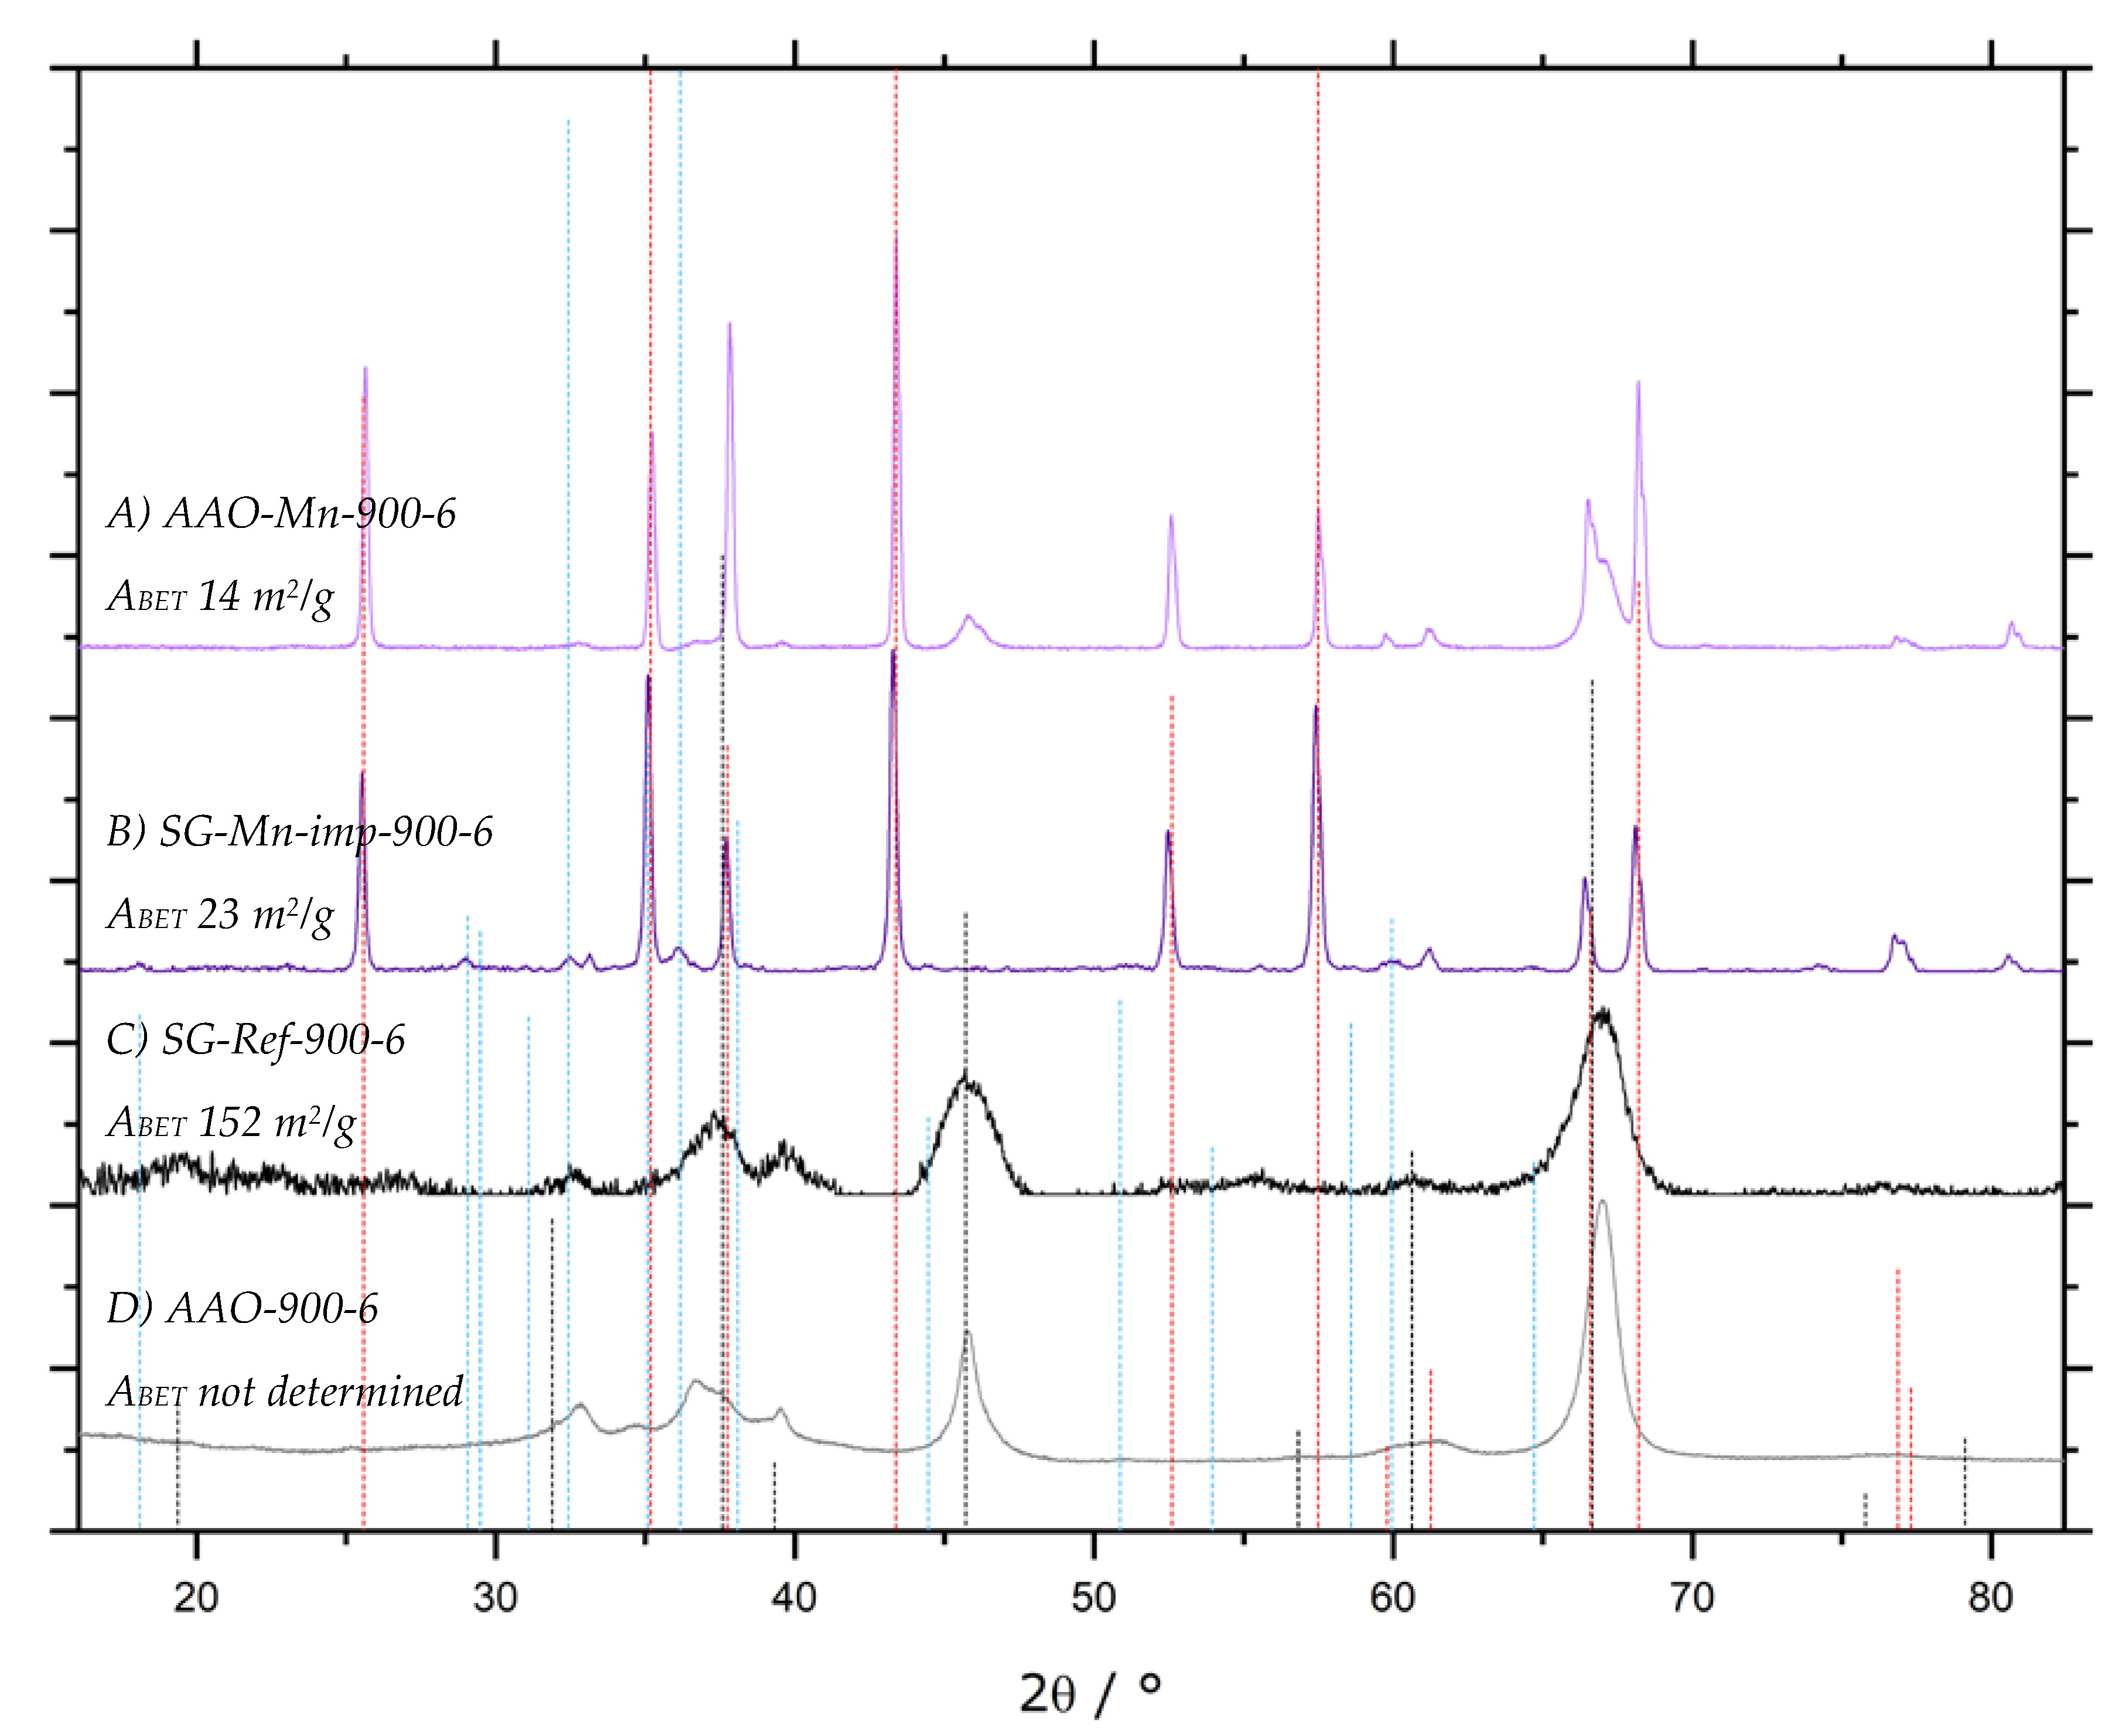
5.3. Manganese-Assisted α-Transition in AAO Membranes
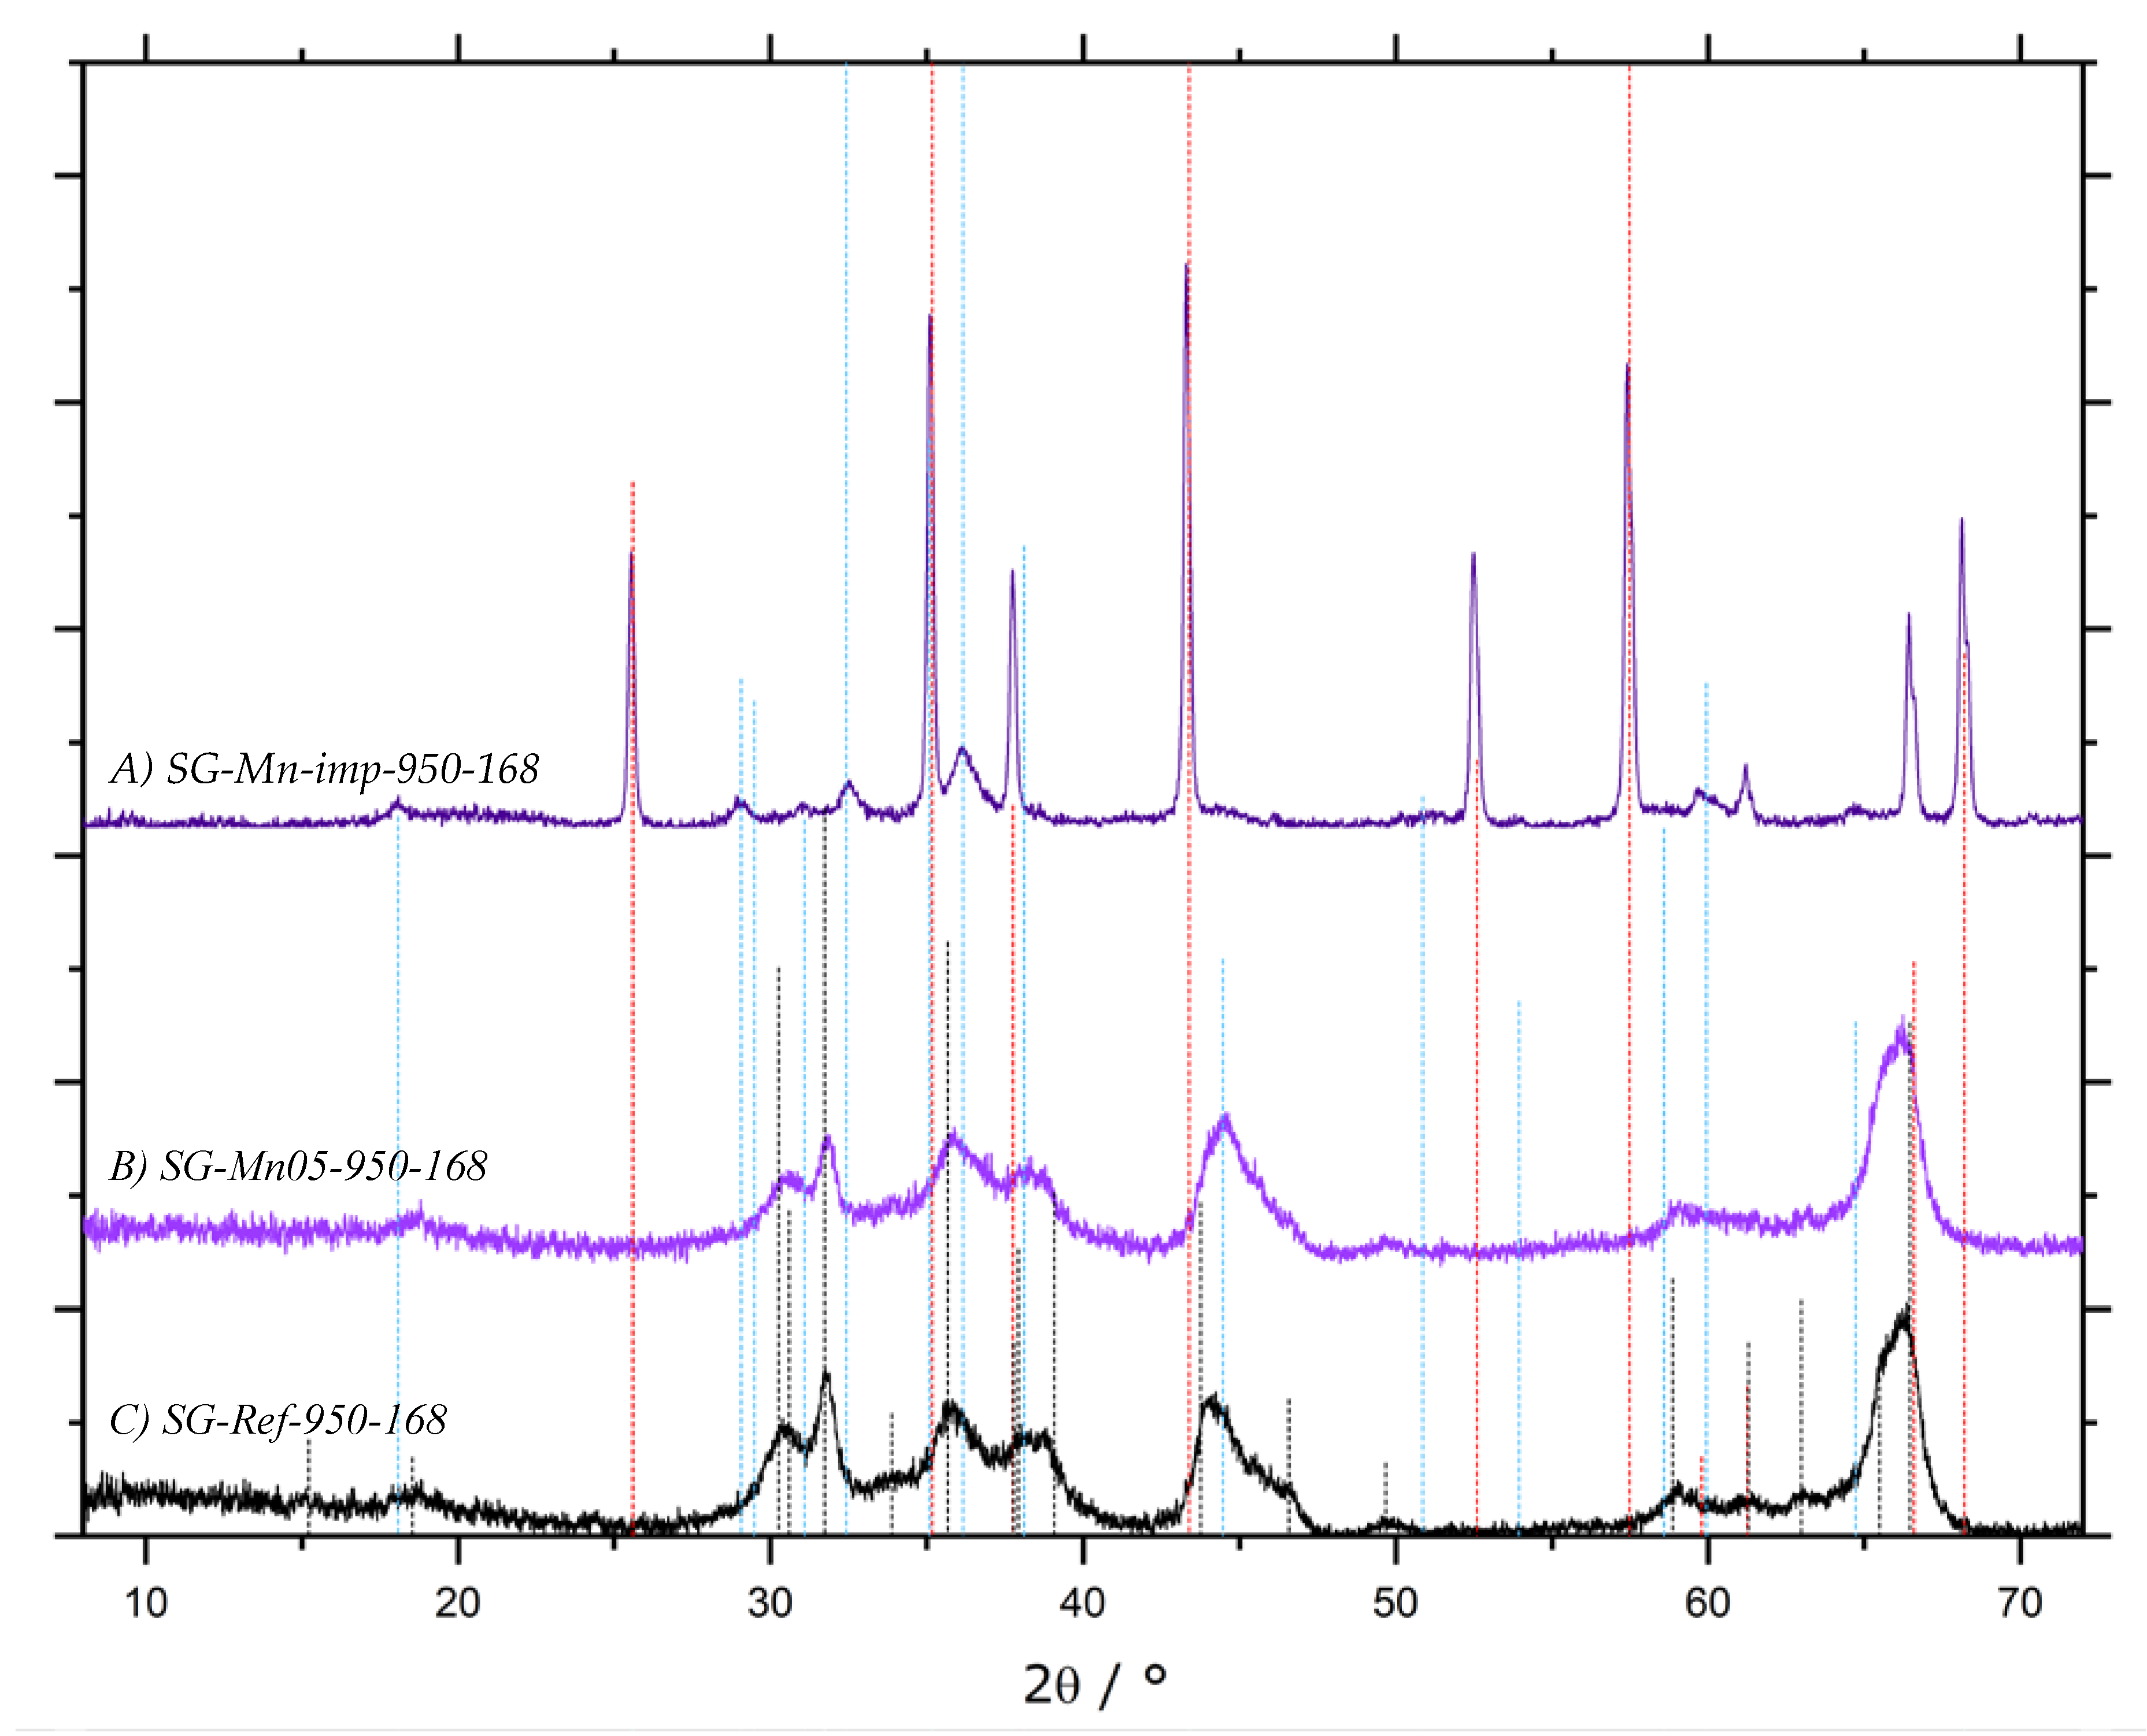
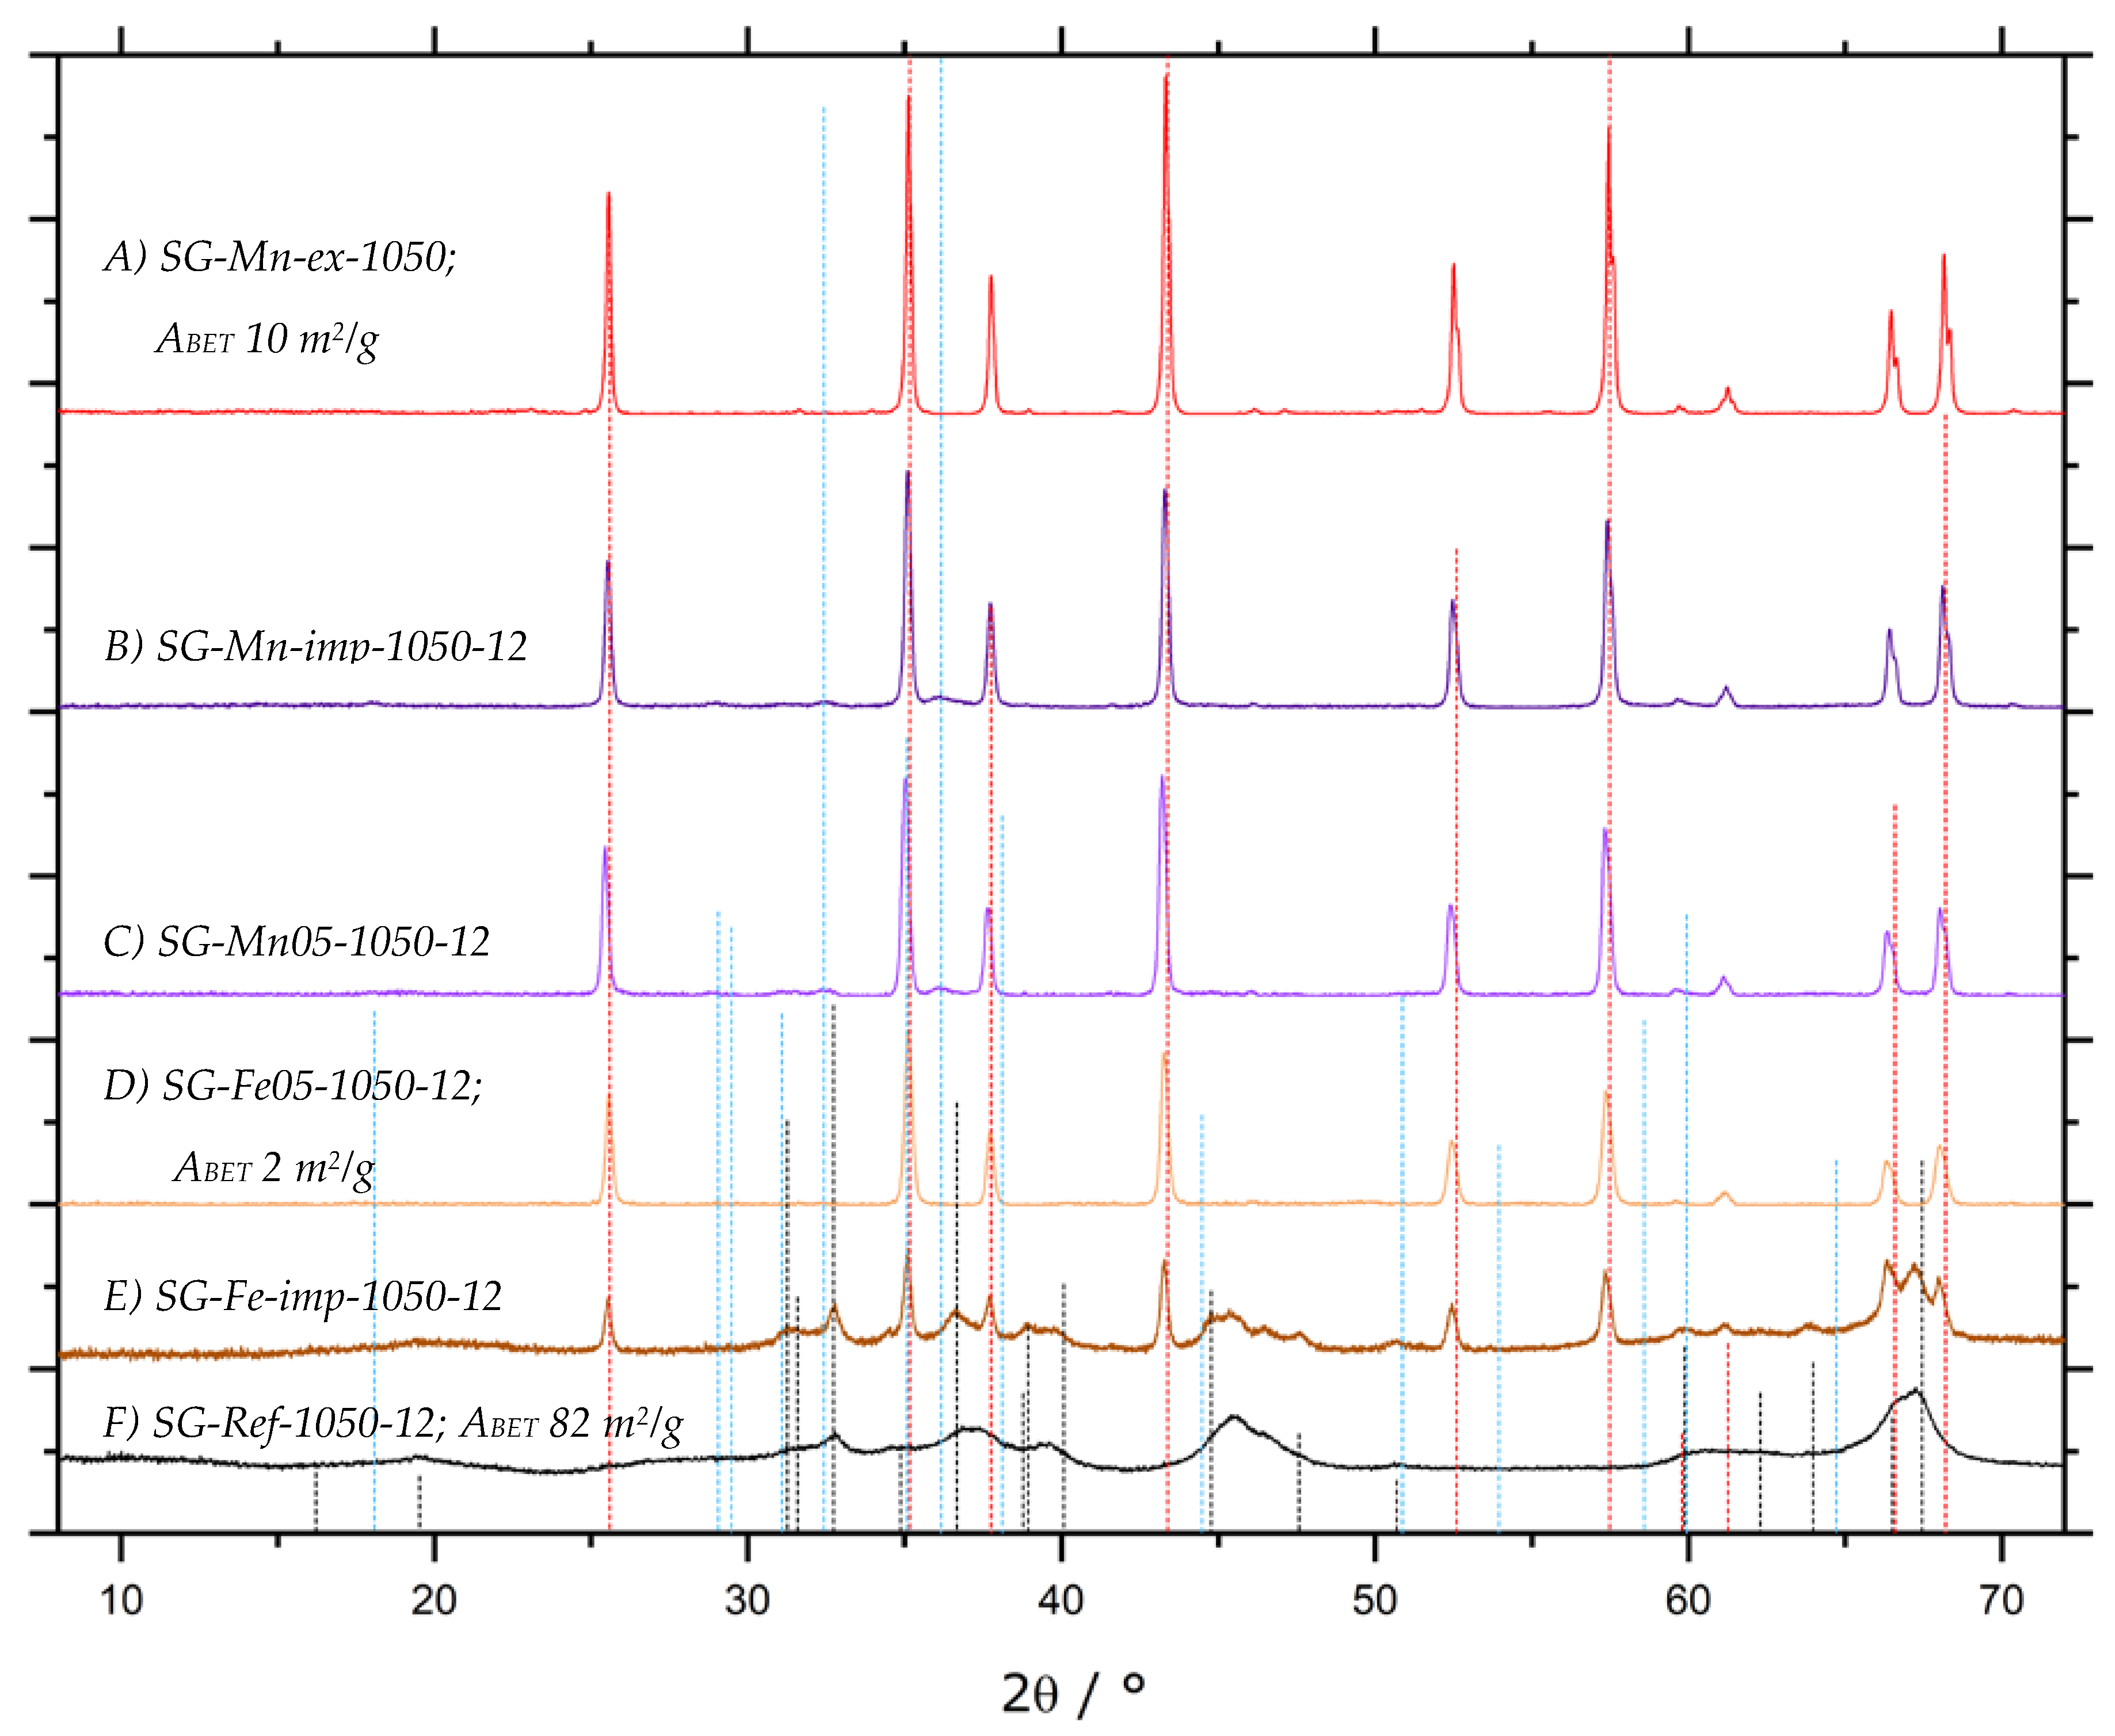
5.4. Application of Solid Solutions Concept to Sol-Gel Materials
5.5. Pore Protection by Carbon Filling
6. Conclusions
Author Contributions
Funding
Acknowledgments
Conflicts of Interest
References
- Wefers, K.; Misra, C. Oxides and Hydroxides of Aluminum; Alcoa Technical Paper No. 19, Revised; Alcoa Laboratories: Pittsburgh, PA, USA, 1987. [Google Scholar]
- Chase, M.W., Jr. NIST-JANAF Themochemical Tables: Part I, Al-Co, 4th ed.; American Institute of Physics: Gaithersburg, MD, USA, 1998. [Google Scholar]
- Yokokawa, T.; Kleppa, O.J. A Calorimetric Study of the Transformation of Some Metastable Modifications of Alumina to α-Alumina. J. Phys. Chem. 1964, 68, 3246–3249. [Google Scholar] [CrossRef]
- Liu, Y.; Oganov, A.R.; Wang, S.; Zhu, Q.; Dong, X.; Kresse, G. Prediction of new thermodynamically stable aluminum oxides. Sci. Rep. 2015, 5, 9518. [Google Scholar] [CrossRef] [PubMed] [Green Version]
- Bartholomew, C.H.; Farrauto, R.J. Fundamentals of Industrial Catalytic Processes, 2nd ed.; Wiley & Sons: New York, NY, USA, 2006. [Google Scholar]
- Faure, R.; Rossignol, F.; Chartier, T.; Bonhomme, C.; Maître, A.; Etchegoyen, G.; Del Gallo, P.; Gary, D. Alumina foam catalyst supports for industrial steam reforming processes. J. Eur. Cer. Soc. 2011, 31, 303–312. [Google Scholar] [CrossRef]
- Zievers, J.F.; Zievers, E.C.; Eggerstedt, P.; Universal Porosics, Inc; Industrial Filter & Pump Mfg. Co. Hot Gas Filters. U.S. Patent 5,256,175, 6 November 1990. [Google Scholar]
- Hay, R.A.; Norton Company. Fine Alpha Alumina Ultrafiltration Membranes. U.S. Patent 4,968,426, 6 November 1989. [Google Scholar]
- Cesteros, Y.; Salagre, P.; Medina, F.; Sueiras, J.E. Several Factors Affecting Faster Rates of Gibbsite Formation. Chem. Mater. 1999, 11, 123–129. [Google Scholar] [CrossRef]
- Chang, P.-L.; Yen, F.-S.; Cheng, K.-C.; Wen, H.-L. Examinations on the Critical and Primary Crystallite Sizes during θ- to α-Phase Transformation of Ultrafine Alumina Powders. Nano Lett. 2001, 1, 253–261. [Google Scholar] [CrossRef]
- Guzmán-Castillo, M.L.; Bokhimi, X.; Toledo-Antonio, A.; Salmones-Blásquez, J.; Hernández-Beltrán, F. Effect of Boehmite Crystallite Size and Steaming on Alumina Properties. J. Phys. Chem. B 2001, 105, 2099–2106. [Google Scholar] [CrossRef]
- Schaper, H.; Doesburg, E.B.M.; de Korte, P.H.M.; van Reijen, L.L. Thermal stabilization of high surface area alumina. Solid State Ion. 1985, 16, 261–266. [Google Scholar] [CrossRef]
- McPherson, R. Formation of metastable phases in flame- and plasma-prepared alumina. J. Mater. Sci. 1973, 8, 851–858. [Google Scholar] [CrossRef]
- McHale, J.M.; Auroux, A.; Perrotta, A.J.; Navrotsky, A. Surface Energies and Thermodynamic Phase Stability in Nanocrystalline Aluminas. Science 1997, 277, 788–791. [Google Scholar] [CrossRef] [Green Version]
- McHale, J.M.; Navrotsky, A.; Perrotta, A.J. Effects of Increased Surface Area and Chemisorbed H2O on the Relative Stability of Nanocrystalline γ-Al2O3 and α-Al2O3. J. Phys. Chem. B 1997, 101, 603–613. [Google Scholar] [CrossRef]
- Tavakoli, A.H.; Maram, P.S.; Widgeon, S.J.; Rufner, J.; van Benthem, K.; Ushakov, S.; Sen, S.; Navrotsky, A. Amorphous Alumina Nanoparticles: Structure, Surface Energy, and Thermodynamic Phase Stability. J. Phys. Chem. C 2013, 117, 17123–17130. [Google Scholar] [CrossRef]
- Laubengayer, A.W.; Weisz, R.S. A Hydrothermal Study of Equilibria in the System Alumina—Water. J. Am. Chem. Soc. 1943, 65, 247–250. [Google Scholar] [CrossRef]
- Torkar, K. Untersuchungen über Aluminiumhydroxyde und-oxyde, 5. Mitt. Monatshefte für Chemie 1960, 91, 757–763. [Google Scholar] [CrossRef]
- Wefers, K. Phasenbeziehungen im System Al2O3-Fe2O3-H2O. Z. Erzbergbau Met. 1967, 20, 13–19 & 71–75. [Google Scholar]
- Tsuchida, T.; Kodaira, K. Hydrothermal synthesis and characterization of diaspore, β-Al2O3 · H2O. J. Mater. Sci. 1990, 25, 4423–4426. [Google Scholar] [CrossRef]
- Krause, A.; Skupinowa, W.; Nowacki, A. Preparation of α-alumina at temperature 500.deg. Roczniki Chemii 1970, 44, 1337–1338. [Google Scholar]
- Tsuchida, T. Preparation of high surface area α-Al2O3 and its surface properties. Appl. Catal. A 1993, 105, L141–L146. [Google Scholar] [CrossRef]
- Vannice, M.A.; Mao, C.-F. High surface area α-alumina. Appl. Catal. A 1994, 111, 151–173. [Google Scholar]
- Contescu, C.; Schwarz, J.A. Another view of the surface properties of high surface area α-alumina. Appl. Catal. A 1994, 118, L5–L10. [Google Scholar] [CrossRef]
- Smith, R.L.; Rohrer, G.S.; Perrotta, A.J. Influence of Diaspore Seeding and Chloride Concentration on the Transformation of “Diasporic” Precursors to Corundum. J. Am. Cer. Soc. 2001, 84, 1896–1902. [Google Scholar] [CrossRef]
- Smith, R.L.; Yanina, S.V.; Rohrer, G.S.; Perrotta, A.J. Inhibition of Sintering and Surface Area Loss in Phosphorus-Doped Corundum Derived from Diaspore. J. Am. Chem. Soc. 2002, 85, 2325–2330. [Google Scholar] [CrossRef]
- Sarikaya, Y.; Sevinç, İ.; Akinç, M. The effect of calcination temperature on some of the adsorptive properties of fine alumina powders obtained by emulsion evaporation technique. Powder Technol. 2001, 116, 109–114. [Google Scholar] [CrossRef]
- Perrotta, A.J. Nanosized corundum synthesis. Mater. Res. Innov. 1998, 2, 33–38. [Google Scholar] [CrossRef]
- Mitchell, H.L.; Exxon Research & Engineering Co. High Surface Area alpHa Aluminas. U.S. Patent 4,012,337, 15 March 1975. [Google Scholar]
- Wefers, K. Über die thermische Umwandlung des Diaspors. Z. Erzbergbau Met. 1962, 15, 339–343. [Google Scholar]
- Heck, R.M.; Farrauto, R.J.; Gulati, S.T. Catalytic Air Pollution Control: Commercial Technology, 3rd ed.; Wiley: Hoboken, NJ, USA, 2009. [Google Scholar]
- Suchanek, W.L. Hydrothermal Synthesis of Alpha Alumina (α-Al2O3) Powders. J. Am. Cer. Soc. 2010, 93, 399–412. [Google Scholar] [CrossRef]
- Suchanek, W.L.; Garcés, J.M. Hydrothermal synthesis of novel alpha alumina nano-materials with controlled morphologies and high thermal stabilities. CrystEngComm 2010, 12, 2996. [Google Scholar] [CrossRef]
- Suchanek, W.L.; Garcés, J.M.; Fulvio, P.F.; Jaroniec, M. Hydrothermal Synthesis and Surface Characteristics of Novel Alpha Alumina Nanosheets with Controlled Chemical Composition. Chem. Mater. 2010, 22, 6564–6574. [Google Scholar] [CrossRef]
- Ghanizadeh, S.; Bao, X.; Vaidhyanathan, B.; Binner, J. Synthesis of nano α-alumina powders using hydrothermal and precipitation routes. Cer. Int. 2014, 40, 1311–1319. [Google Scholar] [CrossRef] [Green Version]
- Sharma, P.K.; Jilavi, M.H.; Burgard, D.; Nass, R.; Schmidt, H. Hydrothermal Synthesis of Nanosize α-Al2O3 from Seeded Aluminum Hydroxide. J. Am. Cer. Soc. 1998, 81, 2732–2734. [Google Scholar] [CrossRef]
- Yamamura, K.; Kobayashi, Y.; Yasuda, Y.; Morita, T. Low temperature synthesis of α -alumina through a hydrothermal process combined with a seeding technique. Mater. Res. Innov. 2017, 23, 166–171. [Google Scholar] [CrossRef]
- Yamamura, K.; Kobayashi, Y.; Yasuda, Y.; Morita, T. Fabrication of α-alumina by a combination of a hydrothermal process and a seeding technique. Funct. Mater. Lett. 2018, 11, 1850042. [Google Scholar] [CrossRef]
- Lee, J.S.; Kim, H.S.; Park, N.-K.; Lee, T.J.; Kang, M. Low temperature synthesis of α-alumina from aluminum hydroxide hydrothermally synthesized using [Al(C2O4)x(OH)y] complexes. Chem. Eng. J. 2013, 230, 351–360. [Google Scholar] [CrossRef]
- Abdullah, M.; Mehmood, M.; Ahmad, J. Single step hydrothermal synthesis of 3D urchin like structures of AACH and aluminum oxide with thin nano-spikes. Cer. Int. 2012, 38, 3741–3745. [Google Scholar] [CrossRef]
- Ahmad, J.; Tariq, M.I.; Ahmad, R.; ul-Hassan, S.M.; Mehmood, M.; Khan, A.F.; Waseem, S.; Mehboob, S.; Tanvir, M.T. Formation of porous α-alumina from ammonium aluminum carbonate hydroxide whiskers. Cer. Int. 2019, 45, 4645–4652. [Google Scholar] [CrossRef]
- Jian, K.; Truong, T.C.; Hoffman, W.P.; Hurt, R.H. Mesoporous carbons with self-assembled surfaces of defined crystal orientation. Microporous Mesoporous Mater. 2008, 113, 143–151. [Google Scholar] [CrossRef] [Green Version]
- Küster, C.; Reinhardt, B.; Fröba, M.; Enke, D. Hierarchically Structured MCM-41 Silica Beads via Nanocasting in Combination with “Pore-protected” Pseudomorphic Transformation. Z. Anorg. Allg. Chem. 2014, 640, 565–569. [Google Scholar] [CrossRef]
- Taubert, M.; Beckmann, J.; Lange, A.; Enke, D.; Klepel, O. Attempts to design porous carbon monoliths using porous concrete as a template. Microporous Mesoporous Mater. 2014, 197, 58–62. [Google Scholar] [CrossRef]
- Toombs, A.J.L.; Armstrong, W.E.; Shell Oil Company. Production of Catalyst or Catalyst Support. U.S. Patent 3,726,811, 7 May 1971. [Google Scholar]
- Murrell, L.L.; Grenoble, D.C.; DeLuca, J.P.; Exxon Research & Engineering Co. Process for Preparing Ultra-Stable, High Surface Area Alpha-Alumina. U.S. Patent 4,169,883, 2 October 1978. [Google Scholar]
- Holler, H.V.; Shell Oil Company. Production of Alpha Alumina. U.S. Patent 3,908,002, 24 June 1972. [Google Scholar]
- Wen, S.-B.; Lin, C.-P.; National Science Council, Taipei. Process of Making α-Alumina Powder. U.S. Patent 6,461,584, 8 October 2002. [Google Scholar]
- Benítez Guerrero, M.; Pérez-Maqueda, L.A.; Pena Castro, P.; Pascual-Cosp, J. Porous Aluminas: The biotemplate method for the synthesis of stable high surface area aluminas. Boletín de la Sociedad Española de Cerámica y Vidrio 2013, 52, 251–267. [Google Scholar] [CrossRef]
- Niu, T.; Shen, L.M.; Liu, Y. Preparation of meso-macroporous α-alumina using carbon nanotube as the template for the mesopore and their application to the preferential oxidation of CO in H2-rich gases. J. Porous Mater. 2013, 20, 789–798. [Google Scholar] [CrossRef]
- Angappan, S.; Jeneafer, R.A.; Visuvasam, A.; Berchmans, L.J. Synthesis of AlN—Presence and absence of additive. Estonian J. Eng. 2013, 19, 239. [Google Scholar] [CrossRef] [Green Version]
- Jung, W.-S.; Dunn, B. Conversion of Alumina to Aluminum Nitride Using Polymeric Carbon Nitride as a Nitridation Reagent. J. Am. Cer. Soc. 2016, 99, 1520–1524. [Google Scholar] [CrossRef]
- Lee, J.W.; Radu, I.; Alexe, M. Oxidation behavior of AlN substrate at low temperature. J. Mater. Sci. Mater. Eletron. 2002, 13, 131–137. [Google Scholar] [CrossRef]
- Yeh, C.-T.; Tuan, W.-H. Oxidation mechanism of aluminum nitride revisited. J. Adv. Cer. 2017, 6, 27–32. [Google Scholar] [CrossRef] [Green Version]
- Das, R.N.; Bandyopadhyay, A.; Bose, S. Nanocrystalline α-Al2O3 Using Sucrose. J. Am. Cer. Soc. 2001, 84, 2421–2423. [Google Scholar] [CrossRef]
- Wang, P.; Wang, C.; Lin, L.; Zhu, Y.; Xie, Y. Efficient Preparation of Submicrometer alpha-Alumina Powders by Calcining Carbon-Covered Alumina. J. Am. Cer. Soc. 2006, 89, 2744–2748. [Google Scholar] [CrossRef]
- Schüth, F. Endo- and exotemplating to create high-surface-area inorganic materials. Angew. Chem. Lnt. Ed. Engl. 2003, 42, 3604–3622. [Google Scholar] [CrossRef]
- Livage, J.; Henry, M.; Sanchez, C. Sol-Gel Chemistry of Transition Metal Oxides. Progr. Solid State Chem. 1988, 18, 259–341. [Google Scholar] [CrossRef]
- Hakim, S.H.; Shanks, B.H. A Comparative Study of Macroporous Metal Oxides Synthesized via a Unified Approach. Chem. Mater. 2009, 21, 2027–2038. [Google Scholar] [CrossRef] [Green Version]
- Feinle, A.; Elsaesser, M.S.; Hüsing, N. Sol-gel synthesis of monolithic materials with hierarchical porosity. Chem. Soc. Rev. 2016, 45, 3377–3399. [Google Scholar] [CrossRef]
- Thiessen, P.A.; Thater, K.L. Reines Aluminiumorthohydroxyd in gallertiger und feinpulveriger Form. Z. Anorg. Allg. Chem. 1929, 181, 417–424. [Google Scholar] [CrossRef]
- Yoldas, B.E. Alumina gels that form porous transparent Al2O3. J. Mater. Sci. 1975, 10, 1856–1860. [Google Scholar] [CrossRef]
- Baumann, T.F.; Gash, A.E.; Chinn, S.C.; Sawvel, A.M.; Maxwell, R.S.; Satcher, J.H. Synthesis of High-Surface-Area Alumina Aerogels without the Use of Alkoxide Precursors. Chem. Mater. 2005, 17, 395–401. [Google Scholar] [CrossRef] [Green Version]
- Tokudome, Y.; Fujita, K.; Nakanishi, K.; Miura, K.; Hirao, K. Synthesis of Monolithic Al2O3 with Well-Defined Macropores and Mesostructured Skeletons via the Sol−Gel Process Accompanied by Phase Separation. Chem. Mater. 2007, 19, 3393–3398. [Google Scholar] [CrossRef]
- Tokudome, Y.; Nakanishi, K.; Kanamori, K.; Fujita, K.; Akamatsu, H.; Hanada, T. Structural characterization of hierarchically porous alumina aerogel and xerogel monoliths. J. Colloid Interface Sci. 2009, 338, 506–513. [Google Scholar] [CrossRef]
- Tokudome, Y.; Nakanishi, K.; Kanamori, K.; Hanada, T. In situ SAXS observation on metal-salt-derived alumina sol-gel system accompanied by phase separation. J. Colloid Interface Sci. 2010, 352, 303–308. [Google Scholar] [CrossRef] [Green Version]
- Kullmann, J. Hierarchisch strukturierte Mischoxide auf Basis von TiO2 und Al2O3. Ph.D. Thesis, Universitat Leipzig, Leipzig, Germany, 2015. [Google Scholar]
- Carstens, S.; Enke, D. Investigation of the formation process of highly porous α-Al2O3 via citric acid-assisted sol-gel synthesis. J. Eur. Cer. Soc. 2019, 39, 2493–2502. [Google Scholar] [CrossRef]
- Herwig, J.; Titus, J.; Kullmann, J.; Wilde, N.; Hahn, T.; Gläser, R.; Enke, D. Hierarchically Structured Porous Spinels via an Epoxide-Mediated Sol–Gel Process Accompanied by Polymerization-Induced Phase Separation. ACS Omega 2018, 3, 1201–1212. [Google Scholar] [CrossRef]
- Sinkó, K.; Kobzi, B.; Sinclaire, J.; Baris, A.; Temesi, O. Influence of cryogenic drying conditions on hierarchical porous structure of aluminum oxide systems. Microporous Mesoporous Mater. 2015, 218, 7–14. [Google Scholar] [CrossRef]
- Sinkó, K. Absorbability of Highly Porous Aluminum Oxide Ceramics. J. Mater. Sci. Eng. A 2017, 7, 37–43. [Google Scholar]
- Gash, A.E.; Tillotson, T.M.; Satcher, J.H.; Poco, J.F.; Hrubesh, L.W.; Simpson, R.L. Use of Epoxides in the Sol−Gel Synthesis of Porous Iron(III) Oxide Monoliths from Fe(III) Salts. Chem. Mater. 2001, 13, 999–1007. [Google Scholar] [CrossRef]
- Nakanishi, K.; Sato, Y.; Ruyat, Y.; Hirao, K. Supramolecular Templating of Mesopores in Phase-Separating Silica Sol-Gels Incorporated with Cationic Surfactant. J. Sol-Gel Sci. Technol. 2003, 26, 567–570. [Google Scholar] [CrossRef]
- Nakanishi, K.; Tanaka, N. Sol-gel with phase separation. Hierarchically porous materials optimized for high-performance liquid chromatography separations. Acc. Chem. Res. 2007, 40, 863–873. [Google Scholar] [CrossRef] [PubMed]
- Triantafillidis, C.; Elsaesser, M.S.; Hüsing, N. Chemical phase separation strategies towards silica monoliths with hierarchical porosity. Chem. Soc. Rev. 2013, 42, 3833–3846. [Google Scholar] [CrossRef]
- Gao, X.-L.; Wang, S.-F.; Xiang, X.; Liu, C.-M.; Zu, X.-T. Photoluminescence of macroporous α-alumina prepared by polyacrylamide gel technique. Acta Phys. Sin. 2013, 62, 1–6. [Google Scholar]
- El-Nadjar, W.; Bonne, M.; Trela, E.; Rouleau, L.; Mino, A.; Hocine, S.; Payen, E.; Lancelot, C.; Lamonier, C.; Blanchard, P.; et al. Infrared investigation on surface properties of alumina obtained using recent templating routes. Microporous Mesoporous Mater. 2012, 158, 88–98. [Google Scholar] [CrossRef]
- Wu, W.; Wan, Z.; Chen, W.; Zhu, M.; Zhang, D. Synthesis of mesoporous alumina with tunable structural properties. Microporous Mesoporous Mater. 2015, 217, 12–20. [Google Scholar] [CrossRef]
- López Pérez, L.; Zarubina, V.; Heeres, H.J.; Melián-Cabrera, I. Condensation-Enhanced Self-Assembly as a Route to High Surface Area α-Aluminas. Chem. Mater. 2013, 25, 3971–3978. [Google Scholar] [CrossRef]
- Zhang, K.; Fu, Z.; Nakayama, T.; Suzuki, T.; Suematsu, H.; Niihara, K. One-pot synthesis of hierarchically macro/mesoporous Al2O3 monoliths from a facile sol–gel process. Mater. Res. Bull. 2011, 46, 2155–2162. [Google Scholar] [CrossRef]
- Zhang, K.; Fu, Z.; Nakayama, T.; Niihara, K. Structural evolution of hierarchically macro/mesoporous Al2O3 monoliths under heat-treatment. Microporous Mesoporous Mater. 2012, 153, 41–46. [Google Scholar] [CrossRef]
- Kang, M.; Lee, T.J.; Lee, J.S.; Kim, H.S.; Lee, J.S.; Park, N.-K. Synthesis of α-Al2O3 at mild temperatures by controlling aluminum precursor, pH, and ethylene diamine chelating additive. Cer. Int. 2012, 38, 6685–6691. [Google Scholar]
- Wang, S.-F.; Xiang, X.; Ding, Q.-P.; Gao, X.-L.; Liu, C.-M.; Li, Z.-J.; Zu, X.-T. Size-controlled synthesis and photoluminescence of porous monolithic α-alumina. Cer. Int. 2013, 39, 2943–2948. [Google Scholar] [CrossRef]
- Gaweł, B.; Gaweł, K.; Øye, G. Sol-Gel Synthesis of Non-Silica Monolithic Materials. Materials 2010, 3, 2815–2833. [Google Scholar] [CrossRef] [Green Version]
- Petrolini, D.D.; Pulcinelli, S.H.; Santilli, C.V.; Martins, L. Textured macro- and mesoporous alumina samples designed in the presence of different surfactant types. J. Sol-Gel Sci. Technol. 2014, 71, 9–15. [Google Scholar] [CrossRef]
- Kuan, W.H.; Wang, M.K.; Huang, P.M.; Wu, C.W.; Chang, C.M.; Wang, S.L. Effect of citric acid on aluminum hydrolytic speciation. Water Res. 2005, 39, 3457–3466. [Google Scholar] [CrossRef]
- Liu, Q.; Wang, A.; Wang, X.; Zhang, T. Mesoporous γ-alumina synthesized by hydro-carboxylic acid as structure-directing agent. Microporous Mesoporous Mater. 2006, 92, 10–21. [Google Scholar] [CrossRef]
- Rajaeiyan, A.; Bagheri-Mohagheghi, M.M. Comparison of Urea and Citric Acid Complexing Agents and Annealing Temperature Effect on the Structural Properties of γ- and α-Alumina Nanoparticles Synthesized by Sol-Gel Method. Adv. Mater. Sci. Eng. 2013, 2013, 1–9. [Google Scholar] [CrossRef] [Green Version]
- Shiau, F.-S.; Fang, T.-T. Low-temperature synthesis of α-alumina using citrate process with α-alumina seeding. Mater. Chem. Phys. 1999, 60, 91–94. [Google Scholar] [CrossRef]
- Suhasinee Behera, P.; Bhattacharyya, S.; Sarkar, R. Effect of citrate to nitrate ratio on the sol-gel synthesis of nanosized α-Al2O3 powder. Cer. Int. 2017, 43, 15221–15226. [Google Scholar] [CrossRef]
- Carstens, S.; Splith, C.; Enke, D. Sol-gel synthesis of α-Al2O3 with enhanced porosity via dicarboxylic acid templating. Sci. Rep. 2019, 9, 19982. [Google Scholar] [CrossRef]
- Masuda, H.; Fukuda, K. Ordered Metal Nanohole Arrays Made by a Two-Step Replication of Honeycomb Structures of Anodic Alumina. Science 1995, 268, 1466–1468. [Google Scholar] [CrossRef]
- Masuda, H.; Satoh, M. Fabrication of Gold Nanodot Array Using Anodic Porous Alumina as an Evaporation Mask. Jpn. J. Appl. Phys. 1996, 36, L126–L129. [Google Scholar] [CrossRef]
- Hillebrand, R.; Müller, F.; Schwirn, K.; Lee, W.; Steinhart, M. Quantitative analysis of the grain morphology in self-assembled hexagonal lattices. ACS Nano 2008, 2, 913–920. [Google Scholar] [CrossRef]
- Belwalkar, A.; Grasing, E.; van Geertruyden, W.; Huang, Z.; Misiolek, W.Z. Effect of Processing Parameters on Pore Structure and Thickness of Anodic Aluminum Oxide (AAO) Tubular Membranes. J. Membr. Sci. 2008, 319, 192–198. [Google Scholar] [CrossRef] [Green Version]
- Zhao, Y.; Chen, M.; Zhang, Y.; Xu, T.; Liu, W. A facile approach to formation of through-hole porous anodic aluminum oxide film. Mater. Lett. 2005, 59, 40–43. [Google Scholar] [CrossRef]
- Nasirpouri, F.; Abdollahzadeh, M.; Almasi, M.J.; Parvini-Ahmadi, N. A comparison between self-ordering of nanopores in aluminium oxide films achieved by two- and three-step anodic oxidation. Curr. Appl. Phys. 2009, 9, S91–S94. [Google Scholar] [CrossRef]
- Lee, W.; Park, S.-J. Porous anodic aluminum oxide. Chem. Rev. 2014, 114, 7487–7556. [Google Scholar] [CrossRef]
- Mardilovich, P.P.; Govyadinov, A.N.; Mukhurov, N.I.; Rzhevski, A.M.; Paterson, R. New and modified anodic alumina membranes. J. Membr. Sci. 1995, 98, 131–142. [Google Scholar] [CrossRef]
- Brown, I.W.M.; Bowden, M.E.; Kemmitt, T.; MacKenzie, K.J.D. Structural and thermal characterisation of nanostructured alumina templates. Curr. Appl. Phys. 2006, 6, 557–566. [Google Scholar] [CrossRef]
- McQuaig, M.K.; Toro, A.; van Geertruyden, W.; Misiolek, W.Z. The effect of high temperature heat treatment on the structure and properties of anodic aluminum oxide. J. Mater. Sci. 2011, 46, 243–253. [Google Scholar] [CrossRef]
- Ozao, R.; Ochiai, M.; Ichimura, N.; Takahashi, H.; Inada, T. DSC study of alumina materials—Applicability of transient DSC (Tr-DSC) to anodic alumina (AA) and thermoanalytical study of AA. Thermochim. Acta 2000, 352–353, 91–97. [Google Scholar] [CrossRef]
- Chang, Y.; Ling, Z.; Liu, Y.; Hu, X.; Li, Y. A simple method for fabrication of highly ordered porous α-alumina ceramic membranes. J. Mater. Chem. 2012, 22, 7445. [Google Scholar] [CrossRef]
- Hashimoto, H.; Kojima, S.; Sasaki, T.; Asoh, H. α-Alumina membrane having a hierarchical structure of straight macropores and mesopores inside the pore wall. J. Eur. Cer. Soc. 2018, 38, 1836–1840. [Google Scholar] [CrossRef]
- Hashimoto, H.; Shigehara, Y.; Ono, S.; Asoh, H. Heat-induced structural transformations of anodic porous alumina formed in phosphoric acid. Microporous Mesoporous Mater. 2018, 265, 77–83. [Google Scholar] [CrossRef]
- Lauder, W.B.; Copson, R.L.; Allied Chemical Corporation. Production of Ultra-fina alpha Alumina and Such Alpha Alumina. U.S. Patent 3,264,124, 2 August 1963. [Google Scholar]
- Sextl, G.; Zimmermann, R.; Kleinschmitt, P.; Schwarz, R.; Degussa AG. Alpha-Aluminiumoxid sowie Verfahren zur Herstellung von Alpha-Aluminiumoxid. European Patent 0355481 A1, 31 July 1989. [Google Scholar]
- Kingsley, J.J.; Patil, K.C. A novel combustion process for the synthesis of fine particle α-alumina and related oxide materials. Mater. Lett. 1988, 6, 427–432. [Google Scholar] [CrossRef]
- Ogihara, T.; Nakajima, H.; Yanagawa, T.; Ogata, N.; Yoshida, K.; Matsushita, N. Preparation of Monodisperse, Spherical Alumina Powders from Alkoxides. J. Am. Cer. Soc. 1991, 74, 2263–2269. [Google Scholar] [CrossRef]
- Zeng, W.M.; Gao, L.; Guo, J.K. A new sol-gel route using inorganic salt for synthesizing Al2O3 nanopowders. NanoStruct. Mater. 1998, 10, 543–550. [Google Scholar] [CrossRef]
- Sarikaya, Y.; Alemdaroǧlu, T.; Önal, M. Determination of the shape, size and porosity of fine α-Al2O3 powders prepared by emulsion evaporation. J. Eur. Cer. Soc. 2002, 22, 305–309. [Google Scholar] [CrossRef]
- Sevinc, I.; Sarikaya, Y.; Akinc, M. Adsorption characteristics of alumina powders produced by emulsion evaporation. Cer. Int. 1991, 17, 1–4. [Google Scholar] [CrossRef]
- Hassanzadeh-Tabrizi, S.A.; Taheri-Nassaj, E. Economical synthesis of Al2O3 nanopowder using a precipitation method. Mater. Lett. 2009, 63, 2274–2276. [Google Scholar] [CrossRef]
- Liu, H.; Ning, G.; Gan, Z.; Lin, Y. Emulsion-based synthesis of unaggregated, spherical alpha alumina. Mater. Lett. 2008, 67, 1685–1688. [Google Scholar] [CrossRef]
- Xiao, J.; Qin, Q.; Wan, Y.; Zhou, F.; Chen, Y.-B.; Li, J.; Liu, Y.-X. Effect of anions on preparation of ultrafine α-Al2O3 powder. J. Cent. South Univ. Technol. 2007, 14, 773–778. [Google Scholar] [CrossRef]
- Prabhakar, R.; Samadder, S.R. Low cost and easy synthesis of aluminium oxide nanoparticles for arsenite removal from groundwater. J. Mol. Liq. 2018, 250, 192–201. [Google Scholar] [CrossRef]
- Zhuravlev, V.D.; Bamburov, V.G.; Beketov, A.R.; Perelyaeva, L.A.; Baklanova, I.V.; Sivtsova, O.V.; Vasilev, V.G.; Vladimirova, E.V.; Shevchenko, V.G.; Grigorov, I.G. Solution combustion synthesis of α-Al2O3 using urea. Cer. Int. 2013, 39, 1379–1384. [Google Scholar] [CrossRef] [Green Version]
- Laishram, K.; Mann, R.; Malhan, N. A novel microwave combustion approach for single step synthesis of α-Al2O3 nanopowders. Cer. Int. 2012, 38, 1703–1706. [Google Scholar] [CrossRef]
- Sharifi, L.; Beyhaghi, M.; Ebadzadeh, T.; Ghasemi, E. Microwave-assisted sol–gel synthesis of alpha alumina nanopowder and study of the rheological behavior. Cer. Int. 2013, 39, 1227–1232. [Google Scholar] [CrossRef]
- Yan, T.; Guo, X.; Zhang, X.; Wang, Z.; Shi, J. Low temperature synthesis of nano alpha-alumina powder by two-step hydrolysis. Mater. Res. Bull. 2016, 73, 21–28. [Google Scholar] [CrossRef]
- Kiyohara, P.K.; Souza Santos, H.; Vieira Coelho, A.C.; de Souza Santos, P. Structure, Surface Area and Morphology of Aluminas from thermal decomposition of Al(OH)(CH3COO)2 Crystals. An. Acad. Bras. Ci. 2000, 72, 471–495. [Google Scholar] [CrossRef]
- Sharma, P.K.; Varadan, V.V.; Varadan, V.K. A critical role of pH in the colloidal synthesis and phase transformation of nano size α-Al2O3 with high surface area. J. Eur. Cer. Soc. 2003, 23, 659–666. [Google Scholar] [CrossRef]
- Zhang, X.; Ge, Y.; Hannula, S.-P.; Levänen, E.; Mäntylä, T. Nanocrystalline α-alumina with novel morphology at 1000 °C. J. Mater. Chem. 2008, 18, 2423. [Google Scholar] [CrossRef]
- Zhang, X.; Ge, Y.; Hannula, S.-P.; Levänen, E.; Mäntylä, T. Process study on the formation of nanocrystalline α-alumina with novel morphology at 1000 °C. J. Mater. Chem. 2009, 19, 1915. [Google Scholar] [CrossRef]
- Zaki, T.; Kabel, K.I.; Hassan, H. Using modified Pechini method to synthesize α-Al2O3 nanoparticles of high surface area. Cer. Int. 2012, 38, 4861–4866. [Google Scholar] [CrossRef]
- Petrakli, F.; Arkas, M.; Tsetsekou, A. α-Alumina nanospheres from nano-dispersed boehmite synthesized by a wet chemical route. J. Am. Cer. Soc. 2018, 101, 3508–3519. [Google Scholar] [CrossRef]
- Kim, S.-M.; Lee, Y.-J.; Jun, K.-W.; Park, J.-Y.; Potdar, H.S. Synthesis of thermo-stable high surface area alumina powder from sol–gel derived boehmite. Mater. Chem. Phys. 2007, 104, 56–61. [Google Scholar] [CrossRef]
- Martín-Ruiz, M.M.; Pérez-Maqueda, L.A.; Cordero, T.; Balek, V.; Subrt, J.; Murafa, N.; Pascual-Cosp, J. High surface area α-alumina preparation by using urban waste. Cer. Int. 2009, 35, 2111–2117. [Google Scholar] [CrossRef]
- Horiuchi, T.; Osaki, T.; Sugiyama, T.; Masuda, H.; Horio, M.; Suzuki, K.; Mori, T.; Sago, T. High Surface Area Alumina Aerogel at Elevated Temperatures. J. Chem. Soc. Faraday Trans. 1994, 90, 2573–2578. [Google Scholar] [CrossRef]
- Kinstle, G.P.; Heasley, J.H. High Surface Area alpha-Alumina and Supercritical Fluid Synthesis Thereof; WO9003331 (A1); FERRO Corporation: Mayfield Heights, OH, USA, 1989. [Google Scholar]
- Billik, P.; Čaplovičová, M.; Čaplovič, L.; Horváth, B. Mechanochemical-molten salt synthesis of α-Al2O3 platelets. Cer. Int. 2015, 41, 8742–8747. [Google Scholar] [CrossRef]
- Huang, Y.; Xia, Y.; Liao, S.; Tong, Z.; Liu, G.; Li, Y.; Chen, Z. Synthesis of α-Al2O3 platelets and kinetics study for thermal decomposition of its precursor in molten salt. Cer. Int. 2014, 40, 8071–8079. [Google Scholar] [CrossRef]
- Zhu, L.-H.; Huang, Q.-W. Morphology control of α-Al2O3 platelets by molten salt synthesis. Cer. Int. 2011, 37, 249–255. [Google Scholar]
- Zhu, L.-H.; Tu, R.-R.; Huang, Q.-W. Molten salt synthesis of α-Al2O3 platelets using NaAlO2 as raw material. Cer. Int. 2012, 38, 901–908. [Google Scholar] [CrossRef]
- Bhattacharyya, S.; Behera, P.S. Synthesis and characterization of nano-sized α-alumina powder from kaolin by acid leaching process. Appl. Clay Sci. 2017, 146, 286–290. [Google Scholar] [CrossRef]
- Yadav, A.K.; Bhattacharyya, S. A new approach for the fabrication of porous alumina beads using acid leachate of kaolin. Microporous Mesoporous Mater. 2019, 293, 109795. [Google Scholar] [CrossRef]
- Zieliński, P.A.; Schulz, R.; Kaliaguine, S.; van Neste, A. Structural transformations of alumina by high energy ball milling. J. Mater. Res. 1993, 8, 2985–2992. [Google Scholar] [CrossRef]
- Karagedov, G.R.; Lyakhov, N.Z. Preparation and sintering of nanosized α-Al2O3 powder. NanoStruct. Mater. 1999, 11, 559–572. [Google Scholar] [CrossRef]
- Kostić, E.; Kiss, S.J.; Zec, S.; Bošković, S. Transition of γ-Al2O3 into α-Al2O3 during vibro milling. Powder Technol. 2000, 107, 48–53. [Google Scholar] [CrossRef]
- Friczic, T. Metal-Organic Frameworks: Mechanochemistry; Materials and Minerals: Dresden, Germany, 2019. [Google Scholar]
- Dynys, F.W.; Halloran, J.W. Alpha Alumina Formation in Alum-Derived Gamma Alumina. J. Am. Cer. Soc. 1982, 65, 442–448. [Google Scholar] [CrossRef]
- Wang, H.-T.; Liu, X.-Q.; Chen, F.-L.; Meng, G.-Y.; Toft Sørensen, O. Kinetics and Mechanism of a Sintering Process for Macroporous Alumina Ceramics by Extrusion. J. Am. Cer. Soc. 1998, 81, 781–784. [Google Scholar] [CrossRef]
- Dvoracek, D. Festkörper-, Metathese- und Thermit-Reaktion. Neue Wege zu porösen Metall-bzw. Mischmetalloxid Monolithen. Ph.D. Thesis, Universität Leipzig, Leipzig, Germany, 2015. [Google Scholar]
- Nettleship, I.; Sampathkumar, R. Coarsening of Mesoporous α-Al2O3 Ceramics. J. Porous Mater. 1997, 3, 157–163. [Google Scholar] [CrossRef]
- Jeng, D.-Y.; Chen, C.-J.; Suzuki, T.; Yazaki Corporation. Monolithic Alpha-Alumina Articles having Controlled Porosity, and Sol-gel Process for Making Them. WO 01/38252 A2. U.S. Patent 6,383,443, 7 May 2000. [Google Scholar]
- Vijayan, S.; Narasimman, R.; Pruvdi, C.; Prabhakaran, K. Preparation of alumina foams by the thermo-foaming of powder dispersions in molten sucrose. J. Eur. Cer. Soc. 2014, 34, 425–433. [Google Scholar] [CrossRef]
- Vijayan, S.; Wilson, P.; Prabhakaran, K. Porosity and cell size control in alumina foam preparation by thermo-foaming of powder dispersions in molten sucrose. J. Asian Cer. Soc. 2018, 4, 344–350. [Google Scholar] [CrossRef] [Green Version]
- Carstens, S.; Dammler, K.; Scheffler, M.; Enke, D. Reticulated Alumina Replica Foams with Additional Sub-Micrometer Strut Porosity. Adv. Eng. Mater. 2019, 89, 1900791. [Google Scholar] [CrossRef] [Green Version]
- Araujo, J.C.S.; Zanchet, D.; Rinaldi, R.; Schuchardt, U.; Hori, C.E.; Fierro, J.L.G.; Bueno, J.M.C. The effects of La2O3 on the structural properties of La2O3-Al2O3 prepared by the sol-gel method and on the catalytic performance of Pt/La2O3-Al2O3 towards steam reforming and partial oxidation of methane. Appl. Catal. B 2008, 84, 552–562. [Google Scholar] [CrossRef]
- Barrera, A.; Fuentes, S.; Viniegra, M.; Avalos-Borja, M.; Bogdanchikova, N.; Campa-Molina, J. Structural properties of Al2O3-La2O3 binary oxides prepared by sol–gel. Mater. Res. Bull. 2007, 42, 640–648. [Google Scholar] [CrossRef]
- Chen, X.; Liu, Y.; Niu, G.; Yang, Z.; Bian, M.; He, A. High temperature thermal stabilization of alumina modified by lanthanum species. Appl. Catal. A 2001, 205, 159–172. [Google Scholar] [CrossRef]
- Jung, M.-W.; Lee, M.-H. Characterization of Alumina Doped with Lanthanum and Pluronic P123 via Sol-Gel Process. J. Korean Cer. Soc. 2008, 45, 297–302. [Google Scholar] [CrossRef]
- Novakovic, T.; Rozic, L.; Petrovic, S.; Vukovic, Z.; Dondur, V. Pore surface fractal analysis of PEG and La(III)-doped mesoporous alumina obtained by the sol-gel method. J. Serb. Chem. Soc. 2010, 75, 833–843. [Google Scholar] [CrossRef]
- Yang, J.; Wang, Q.; Wang, T.; Liang, Y. Rapid preparation process, structure and thermal stability of lanthanum doped alumina aerogels with a high specific surface area. RSC Adv. 2016, 6, 26271–26279. [Google Scholar] [CrossRef]
- Vázquez, A.; López, T.; Gómez, R.; Morales, A.; Novaro, O. X-Ray Diffraction, FTIR, and NMR Characterization of Sol–Gel Alumina Doped with Lanthanum and Cerium. J. Solid State Chem. 1997, 128, 161–168. [Google Scholar] [CrossRef]
- Tokudome, Y.; Nakanishi, K.; Hanada, T. Effect of La addition on thermal microstructural evolution of macroporous alumina monolith prepared from ionic precursors. J. Cer. Soc. Jpn. 2009, 117, 351–355. [Google Scholar] [CrossRef] [Green Version]
- Sun, Q.; Zheng, Y.; Zheng, Y.; Xiao, Y.; Cai, G.; Wei, K. Synthesis of highly thermally stable lanthanum-doped ordered mesoporous alumina. Scr. Mater. 2011, 65, 1026–1029. [Google Scholar] [CrossRef]
- Khaleel, A.; Nawaz, M.; Al-Hadrami, S.; Greish, Y.; Saeed, T. The effect of metal ion dopants (V3+, Cr3+, Fe3+, Mn2+, Ce3+) and their concentration on the morphology and the texture of doped γ-alumina. Microporous Mesoporous Mater. 2013, 168, 7–14. [Google Scholar] [CrossRef]
- Sun, Q.; Zheng, Y.; Li, Z.; Zheng, Y.; Xiao, Y.; Cai, G.; Wei, K. Studies on the improved thermal stability for doped ordered mesoporous γ-alumina. Phys. Chem. Chem. Phys. 2013, 15, 5670–5676. [Google Scholar] [CrossRef] [PubMed]
- Burtin, P.; Brunelle, J.P.; Pijolat, M.; Soustelle, M. Influence of surface area and additives on the thermal stability of transition alumina catalyst supports. Appl. Catal. 1987, 34, 225–238. [Google Scholar] [CrossRef]
- Horiuchi, T.; Osaki, T.; Sugiyama, T.; Suzuki, K.; Mori, T. Maintenance of large surface area of alumina heated at elevated temperatures above 1300 °C by preparing silica-containing pseudoboehmite aerogel. J. Non-Cryst. Sol. 2001, 291, 187–198. [Google Scholar] [CrossRef]
- Deng, Z.-Y.; Fukasawa, T.; Ando, M.; Zhang, G.-J.; Ohji, T. High-Surface-Area Alumina Ceramics Fabricated by the Decomposition of Al(OH)3. J. Am. Cer. Soc. 2001, 84, 485–491. [Google Scholar] [CrossRef]
- Ergu, O.; Gürü, M.; Cabbar, C. Preparation and characterization of alumina-zirconia composite material with different acid ratios by the sol-gel method. Open Chem. 2008, 6, 482–487. [Google Scholar] [CrossRef]
- Jayaseelan, D.; Nishikawa, T.; Awaji, H.; Gnanam, F.D. Pressureless sintering of sol-gel derived alumina–zirconia composites. Mater. Sci. Eng. A 1998, 256, 265–270. [Google Scholar] [CrossRef]
- Dekker, E.H.L.J.; Rieck, G.D. Revised phase diagram and X-ray data of the Mn3O4-Al2O3 System in air. Z. Anorg. Allg. Chem. 1975, 6, 69–80. [Google Scholar] [CrossRef]
- Krieger, T.A.; Tsybulya, S.V.; Tsyrulnikov, P.G. High-temperature XRD studies of the phase transformations in a MnOx/Al2O3 catalyst for deep oxidation of hydrocarbons. React. Kinet. Catal. Lett. 2002, 75, 141–146. [Google Scholar] [CrossRef]
- López-Benítez, A.; Berhault, G.; Burel, L.; Guevara-Lara, A. Novel NiW hydrodesulfurization catalysts supported on Sol-Gel Mn-Al2O3. J. Catal. 2017, 354, 197–212. [Google Scholar] [CrossRef]
- Meyer, R.; Meyerhöfer, F.; Dvoracek, D.; Grimm, S.; Enke, D.; Steinhart, M. Manganese assisted phase transformation of highly ordered porous anodized alumina. 2020; publication in preparation. [Google Scholar]
- Tsyrulnikov, P.G.; Tsybulya, S.V.; Kryukova, G.N.; Boronin, A.I.; Koscheev, S.V.; Starostina, T.G.; Bubnov, A.V.; Kudrya, E.N. Phase transformations in the thermoactivated MnOx-Al2O3 catalytic system. J. Mol. Catal. 2002, 179, 213–220. [Google Scholar] [CrossRef]
- Polli, A.D.; Lange, F.F.; Levi, C.G.; Mayer, J. Crystallization Behavior and Microstructure Evolution of (Al,Fe)2O3 Synthesized from Liquid Precursors. J. Am. Cer. Soc. 1996, 79, 1745–1755. [Google Scholar] [CrossRef]
- Stößer, R.; Nofz, M.; Feist, M.; Scholz, G. Fe3+-assisted formation of α-Al2O3, starting from sol-gel precursors. J. Solid State Chem. 2006, 179, 652–664. [Google Scholar] [CrossRef]
- Takai, S.; Sawada, E.; Harada, J.; Park, S.; Oda, M.; Esaki, S.; Nishijima, M.; Yoshie, T.; Yabutsuka, T.; Yao, T. Synthesis and anode properties of corundum-type structured (Fe2O3)1−x(Al2O3)x solid solutions in the whole compositional range. Solid State Ion. 2017, 313, 1–6. [Google Scholar] [CrossRef]
- Sokolov, S.; Bell, D.; Stein, A. Preparation and Characterization of Macroporous α-Alumina. J. Am. Cer. Soc. 2003, 86, 1481–1486. [Google Scholar] [CrossRef]
- Topuz, B.; Yurttas, A.S.; Altunsoy, A. Preparation of Al2O3Supports for Thin Membrane Fabrication. J. Turk. Chem. Soc. A 2017, 191–204. [Google Scholar] [CrossRef] [Green Version]
- Roque-Ruiz, J.H.; Medellín-Castillo, N.A.; Reyes-López, S.Y. Fabrication of α-alumina fibers by sol-gel and electrospinning of aluminum nitrate precursor solutions. Res. Phys. 2019, 12, 193–204. [Google Scholar] [CrossRef]
- Grinberg, E.E.; Baranova, G.V.; Strelnikova, I.E. Influence of hydrolysis method on the sol-gel formation of the yttria-alumina system with use of alcoholates. Russ. J. Appl. Chem. 2013, 86, 11–14. [Google Scholar] [CrossRef]
- Jessensky, O. Untersuchung zum Porenwachstum in 6h-Siliziumkarbid und Anodischem Aluminiumoxid. Ph.D. Thesis, Martin Luther University, Halle, Germany, 1997. [Google Scholar]
- Rauf, A.; Mehmood, M.; Asim Rasheed, M.; Aslam, M. The effects of electropolishing on the nanochannel ordering of the porous anodic alumina prepared in oxalic acid. J. Solid State Electrochem. 2009, 13, 321–332. [Google Scholar] [CrossRef]
- Brunauer, S.; Emmett, P.H.; Teller, E. Adsorption of Gases in Multimolecular Layers. J. Am. Chem. Soc. 1938, 60, 309–319. [Google Scholar] [CrossRef]
- Anthony, J.W.; Bideau, R.A.; Bladh, K.W.; Nichols, M.C. Handbook of Mineralogy: Corundum; Mineralogical Society of America: Washington, DC, USA, 2001. [Google Scholar]
- Gardner, M. Diversions which involve the five Platonic solids. Sci. Am. 1958, 199, 126–132. [Google Scholar] [CrossRef]
- Balasubramanian, M.; Malhotra, S.K.; Gokularathnam, C.V. Sintering and mechanical properties of sol-gel derived alumina-zirconia composites. J. Mater. Process. Technol. 1997, 67, 67–70. [Google Scholar] [CrossRef]
- Păcurariu, C.; Lazău, I.; Ecsedi, Z.; Lazău, R.; Barvinschi, P.; Mărginean, G. New synthesis methods of MgAl2O4 spinel. J. Eur. Cer. Soc. 2007, 27, 707–710. [Google Scholar] [CrossRef]
- Sharma, R.K.; Ghose, R. Synthesis and characterization of nanocrystalline zinc aluminate spinel powder by sol–gel method. Cer. Int. 2014, 40, 3209–3214. [Google Scholar] [CrossRef]
- Duan, X.; Yuan, D.; Wang, X.; Xu, H. Synthesis and characterization of nanocrystalline zinc aluminum spinel by a new sol-gel method. J. Sol-Gel Sci. Technol. 2005, 35, 221–224. [Google Scholar] [CrossRef]
- Kurihara, L.K.; Suib, S.L. Sol-gel synthesis of ternary metal oxides. 1. Synthesis and characterization of MAl2O4 (M = Mg, Ni, Co, Cu, Fe, Zn, Mn, Cd, Ca, Hg, Sr, and Ba) and lead aluminum oxide (Pb2Al2O5). Chem. Mater. 1993, 5, 609–613. [Google Scholar] [CrossRef]
- Tammann, G. Die Temperatur des Beginns innerer Diffusion in Kristallen. Z. Anorg. Allg. Chem. 1926, 157, 321–325. [Google Scholar] [CrossRef]
- Tammann, G. Über chemische Reaktionen in Gemengen fester Stoffe bei erhöhter Temperatur. Angew. Chem. 1926, 39, 869–875. [Google Scholar] [CrossRef]
- Ostwald, W. Über die vermeintliche Isomerie des roten und gelben Quecksilberoxyds und die Oberflächenspannung fester Körper. Z. Phys. Chem. 1900, 34, 495–503. [Google Scholar] [CrossRef]

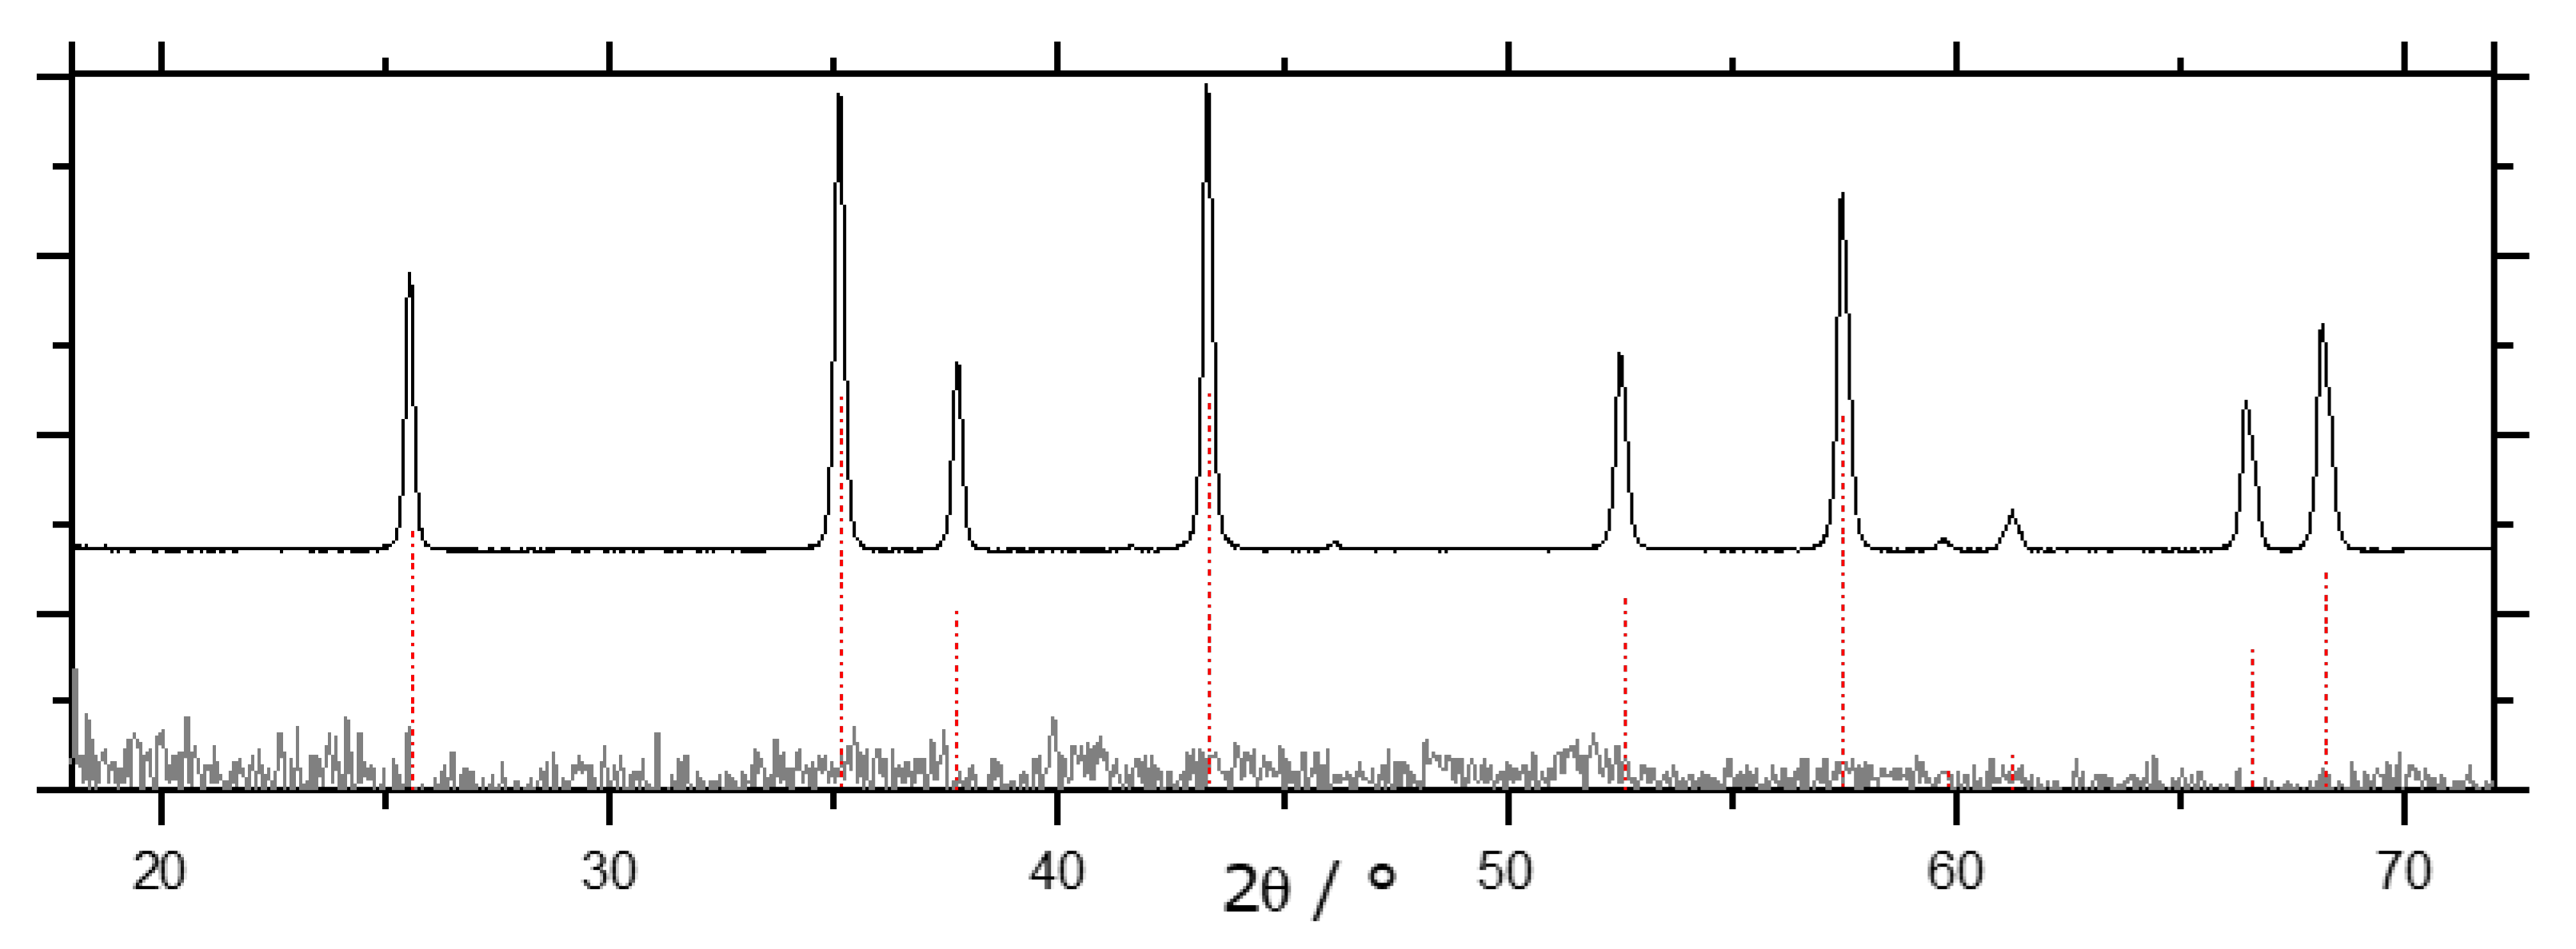
 ). All other samples display the same diffraction pattern.
). All other samples display the same diffraction pattern.
). All other samples display the same diffraction pattern.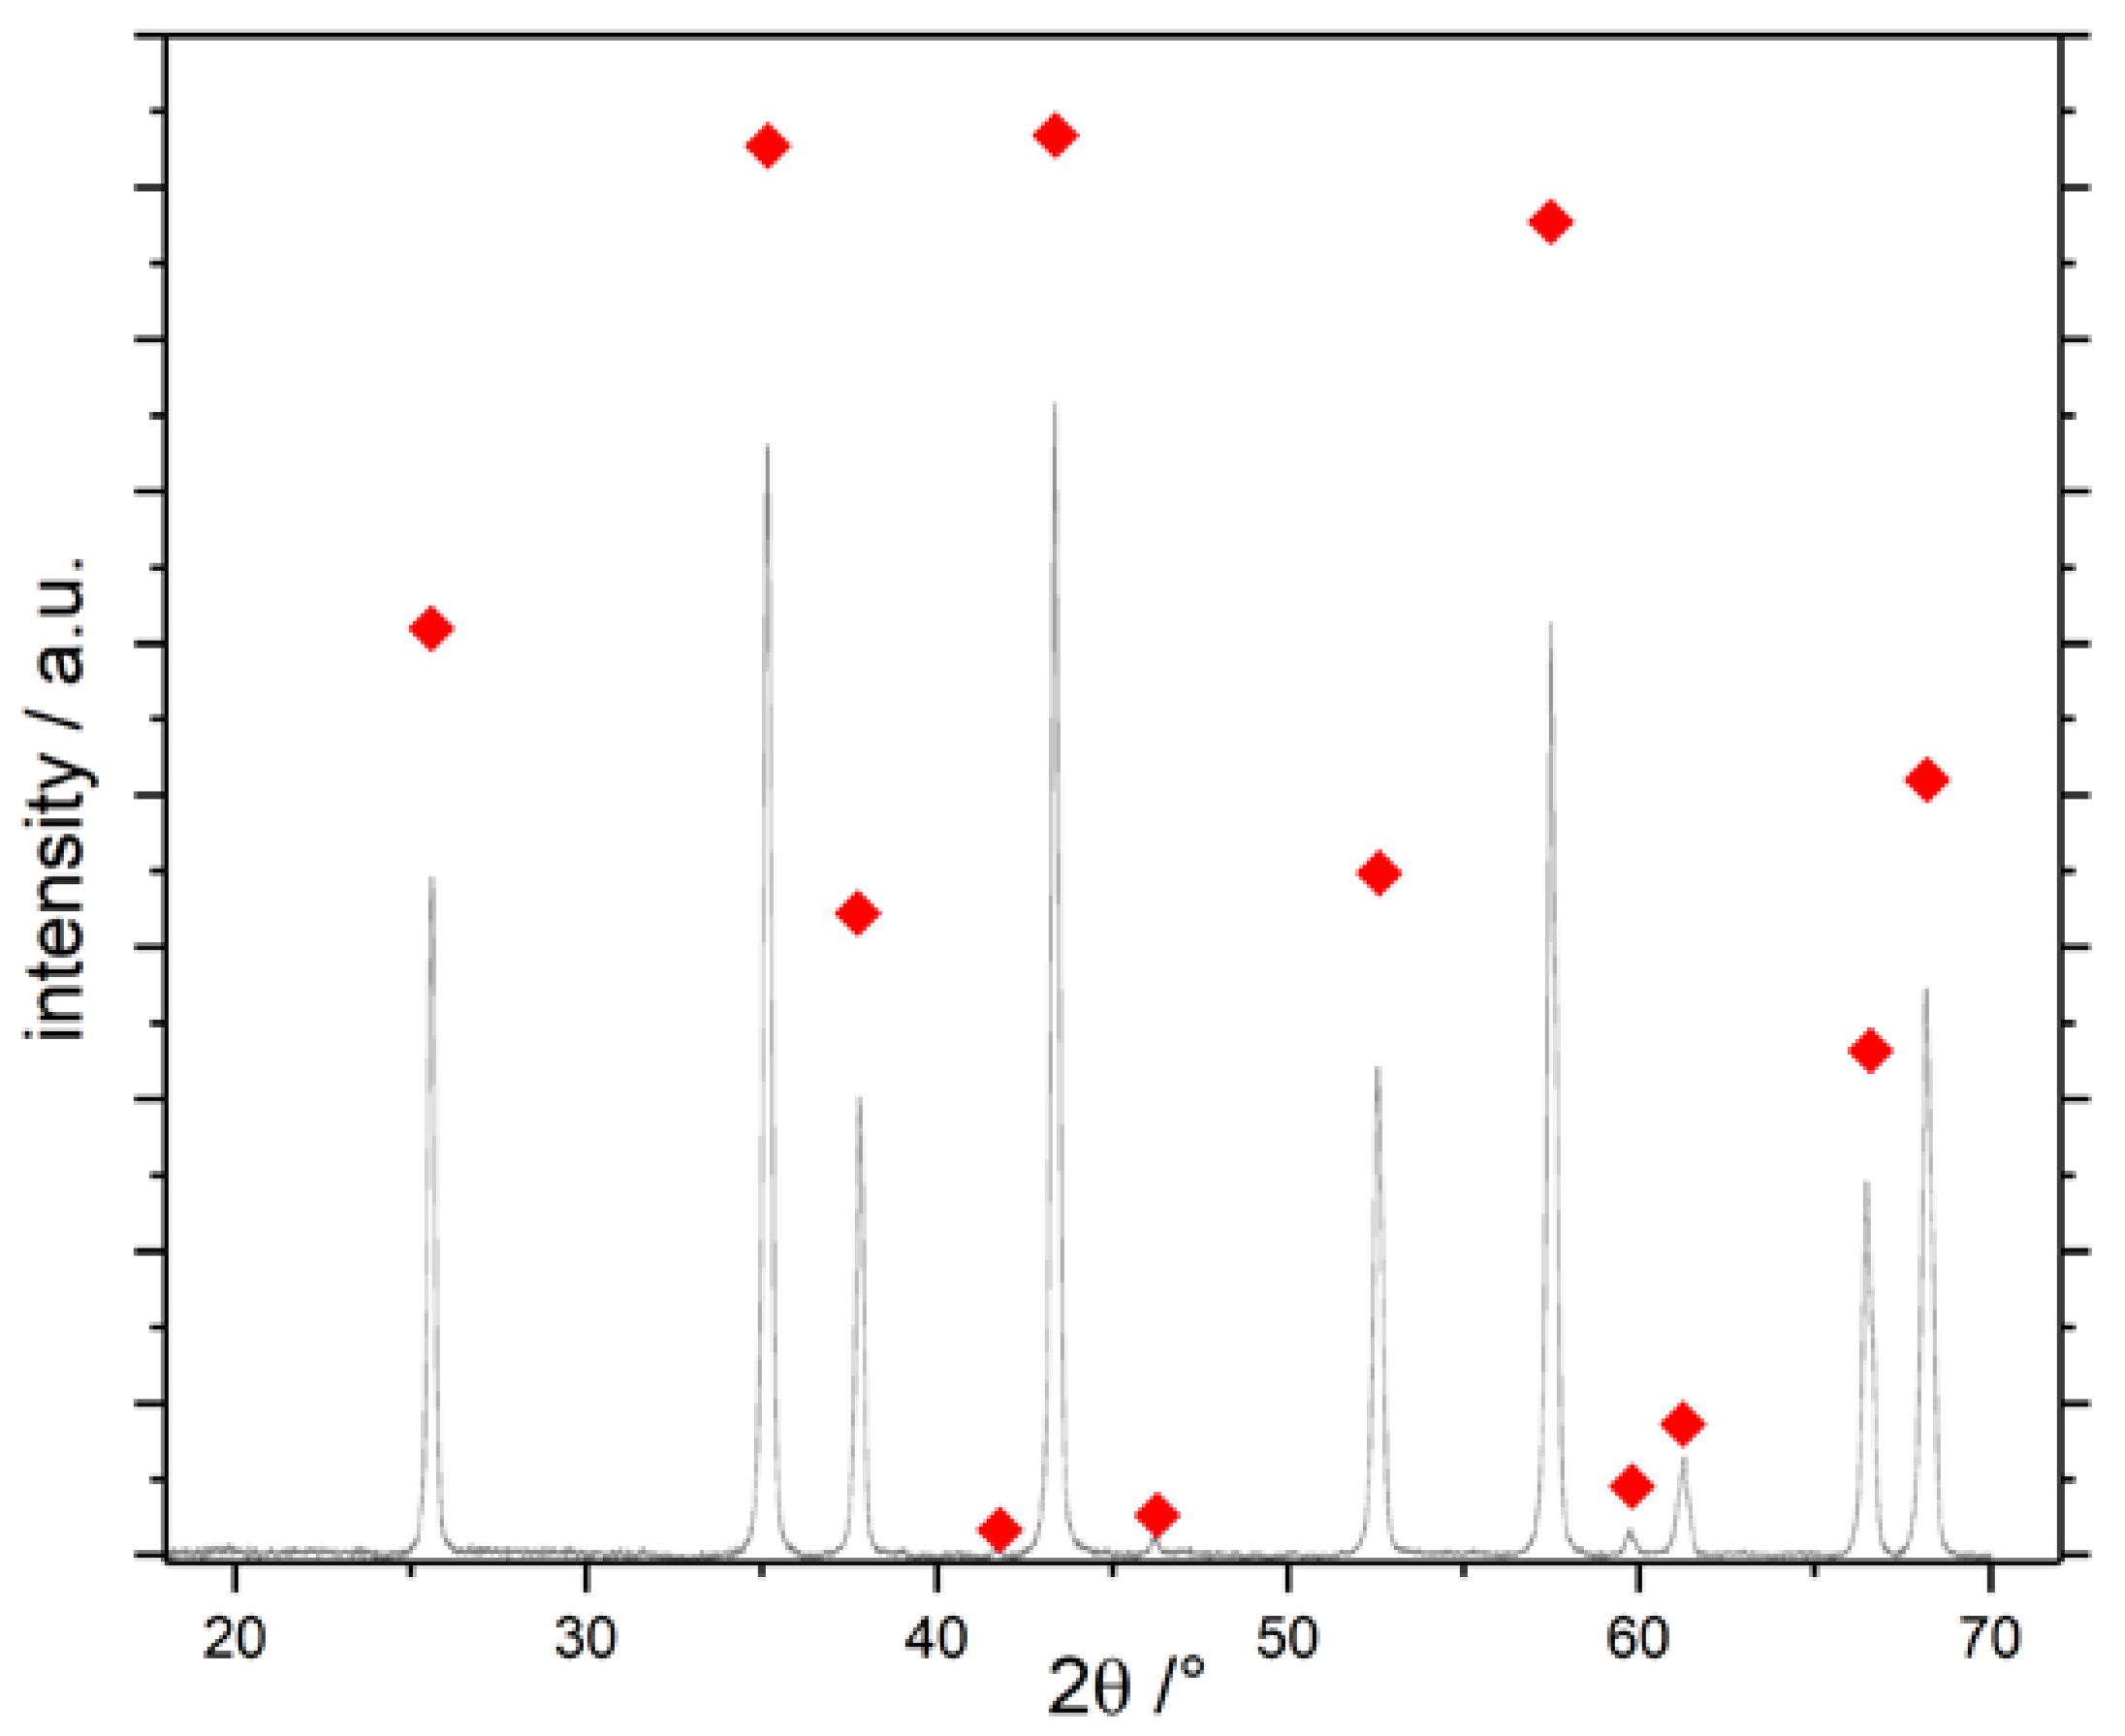


| Alumina Modification | ΔHf/kJ/mol [2] | ΔH→α/kJ/mol [2] | ΔH→α/kJ/mol [3] |
|---|---|---|---|
| γ-Al2O3 | −1656.9 | −18.8 | −22.2 |
| κ-Al2O3 | −1662.3 | −13.4 | −15.1 |
| δ-Al2O3 | −1666.5 | −9.2 | −11.3 |
| α-Al2O3 | −1675.7 | n/a | n/a |
| Exp. Section | Preparation Method | Sample Name | Short Description | Discussed in Sections | Ref. |
|---|---|---|---|---|---|
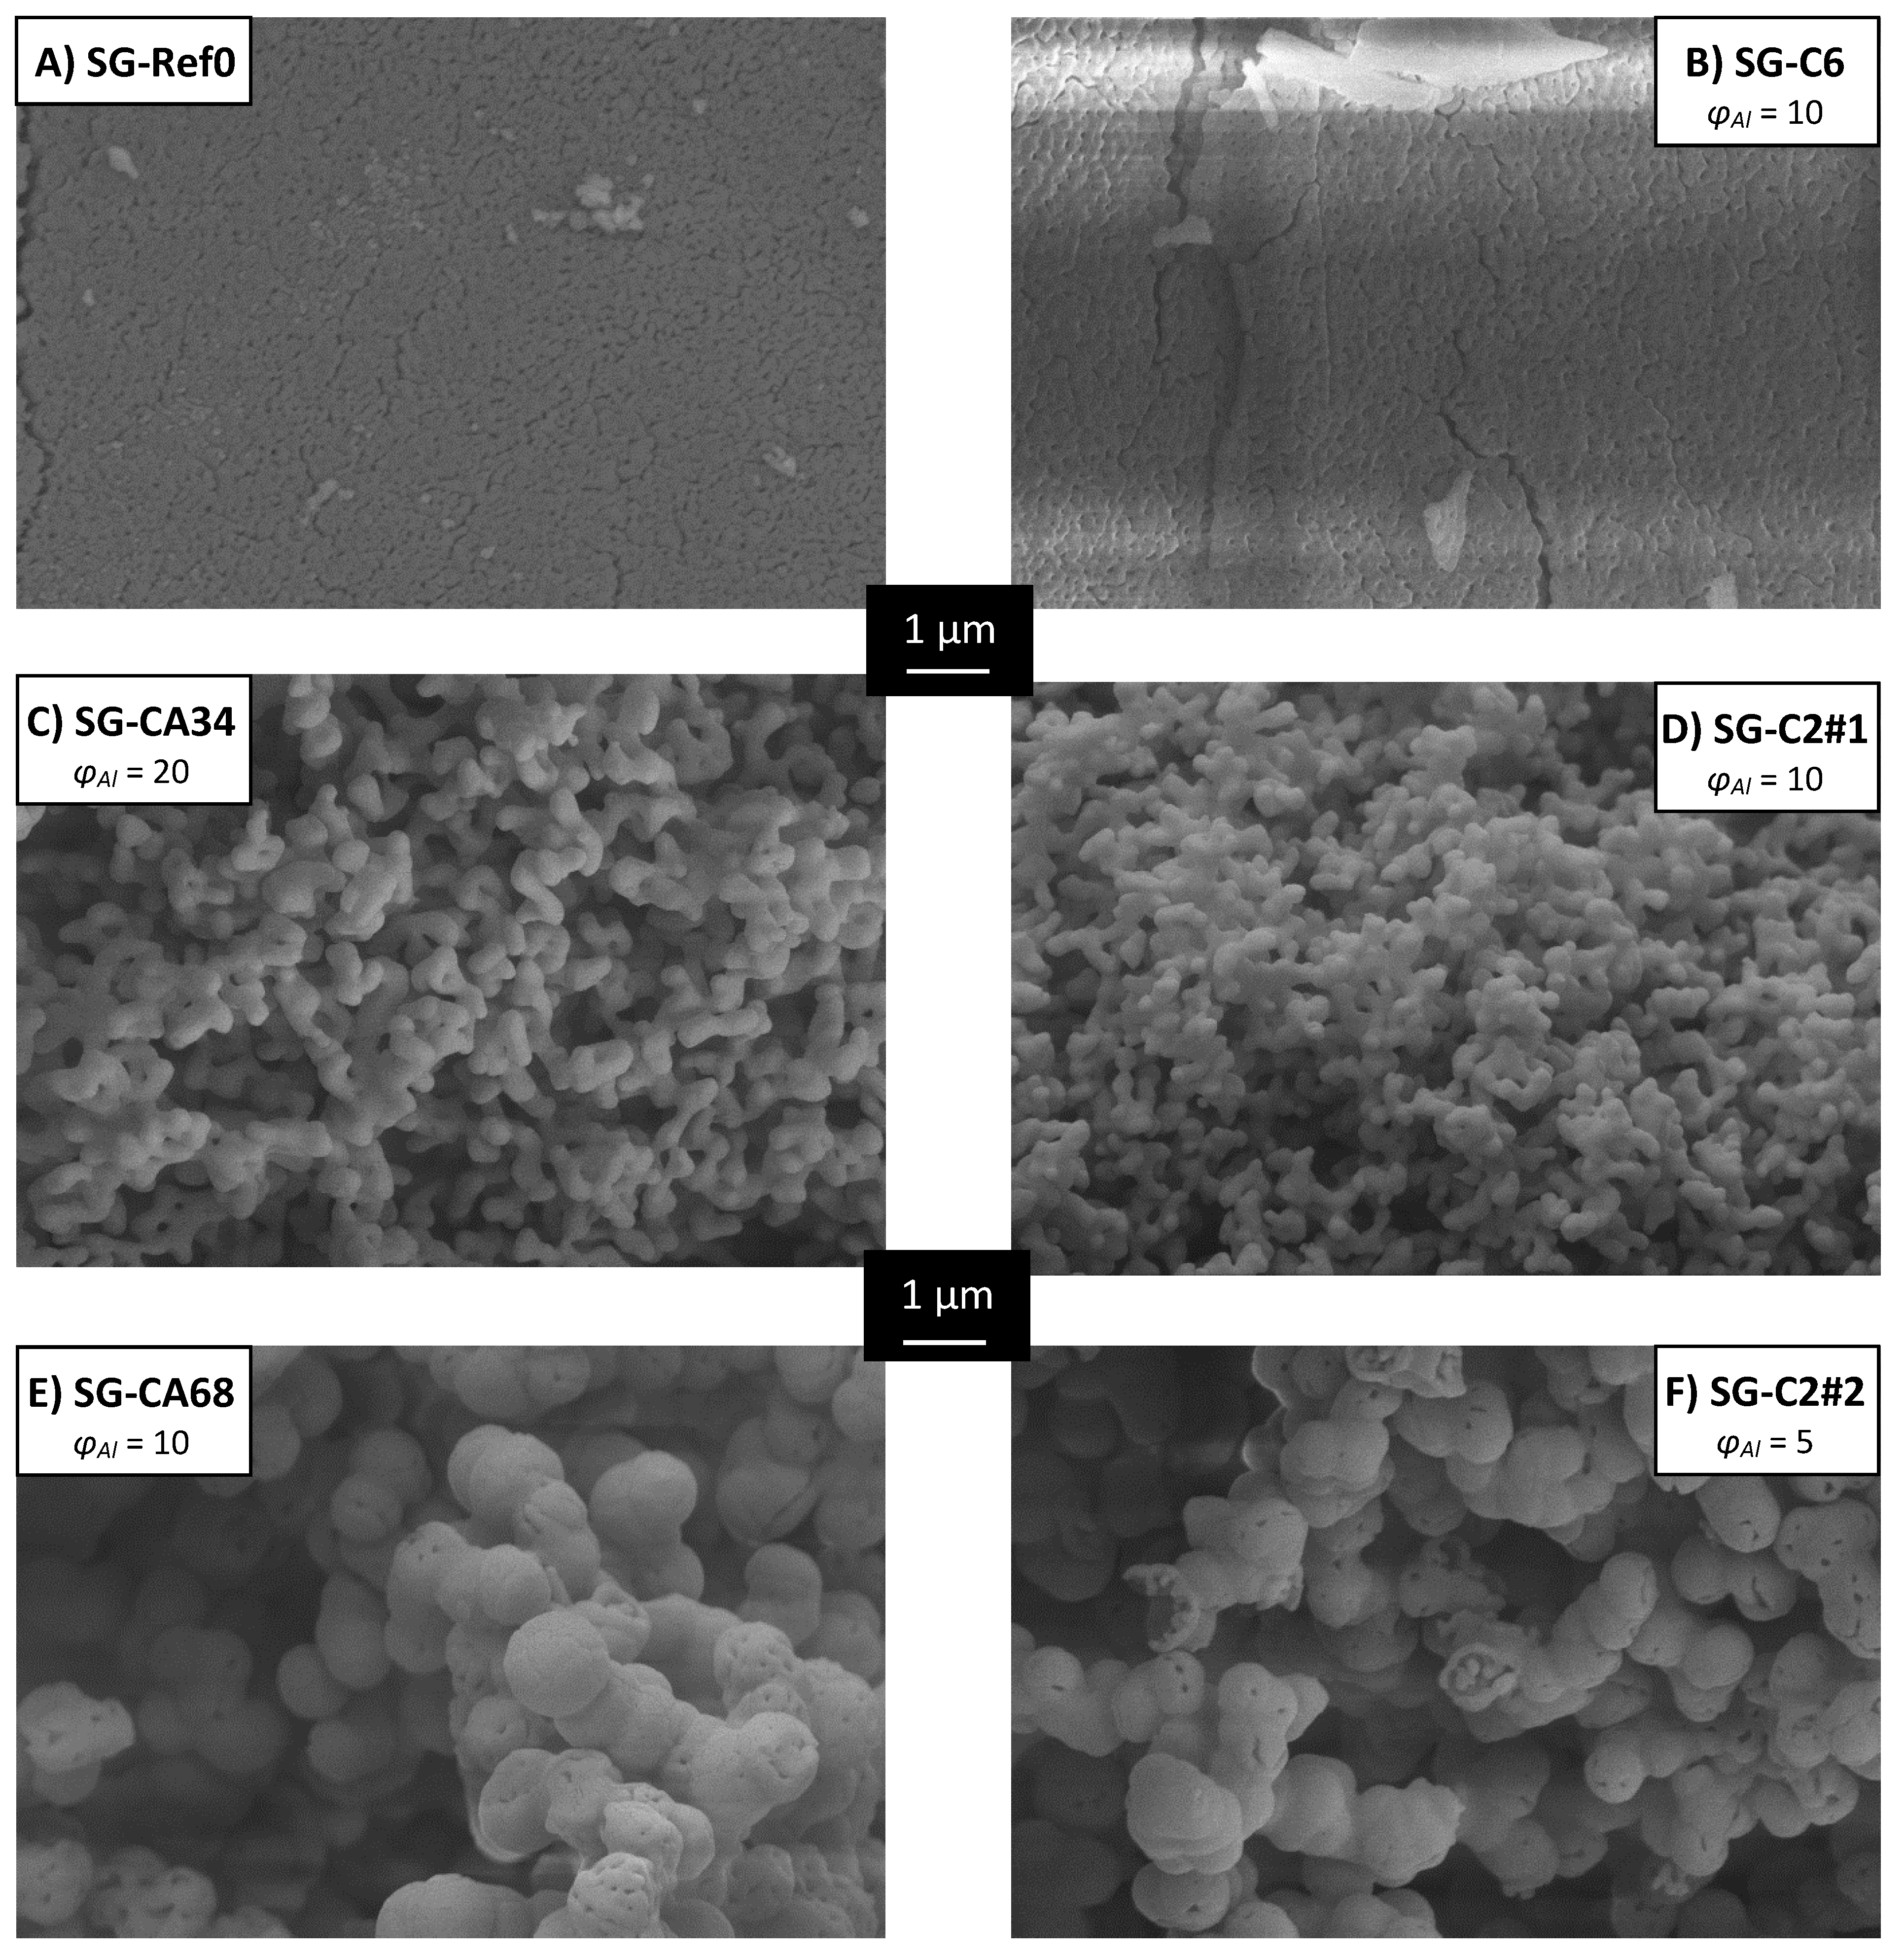
| 3.1.1 | epoxide-mediated sol-gel | SG-Ref0 | without additive | 4.1, 5.1, 5.2 | [68,91] |
| SG-Ref0-(80) | SG-Ref0, aged at 80 °C | 5.1, 5.2 | n/a | ||
| SG-Ref100 | with PEO 900,000 | 4.1, 5.1 | [68] | ||
| SG-CAxx | with 0.xx g citric acid | 4.1, 5.1 | [68] | ||
| SG-C2#1 | with oxalic acid | 5.1 | [91] | ||
| SG-C2#2 | with oxalic acid (double) | 4.1, 5.1 | [91] | ||
| SG-C3 | with malonic acid | 4.1, 5.1 | [91] | ||
| SG-C3-(80) | SG-C3, aged at 80 °C | 5.1 | n/a | ||
| SG-C4 | with succinic acid | 4.1, 5.1 | [91] | ||
| SG-C5 | with glutaric acid | 5.1 | [91] | ||
| SG-C6 | with adipic acid | 5.1 | [91] | ||
| 3.1.2 | sol-gel | MCH-w | mutual cross-hydrolysis + water | 5.2 | n/a |
| MCH-o | mutual cross-hydrolysis in organic solvents (“water-free”) | 5.2 | n/a | ||
| 3.1.3 3.1.4 | anodic oxidation | AAO-0 | pristine | 5.3 | [168] |
| AAO-1100 | calcined at 1100 °C | 5.3 | [168] | ||
| AAO-Mn-900 | impregnation with 1 M Mn(NO3)2, calcined at 900 °C | 5.3, 5.4 | [168] | ||
| 3.1.4 | calcination after impregnation | SG-Mn-imp | SG-Ref0, 1 M Mn(NO3)2 | 5.4 | n/a |
| SG-Fe-imp | SG-Ref0, 1 M Fe(NO3)3 | 5.4 | n/a | ||
| SG-Mn05 | SG-Ref0, prepared with 5% MnCl2 | 5.4 | n/a | ||
| SG-Fe05 | SG-Ref0, prepared with 5% FeCl3 | 5.4 | n/a | ||
| Mn extraction | SG-Mn-ex | SG-Mn-imp leached in HCl | 5.4 | n/a | |
| 3.1.5 | carbon filling | SG-pp | θ-alumina from SG route, pore-protected with carbon | 5.5 | n/a |
| α* | SG-pp, 10 wt.% α-Al2O3 particles | 5.5 | n/a | ||
| pellets | pore-protected commercial θ-alumina pellets | 5.5 | n/a |
| Sample Name | dp/nm | Vp/cm3/g | Atheo/m2/g | ABET/m2/g | |ABET − Atheo| ABET |
|---|---|---|---|---|---|
| SG-C5 | 195 | 0.38 | 7.8 | 8 | 0.03 |
| SG-Ref100 | 135; 1345 | 0.18; 0.34 | 6.3 | 6 | 0.05 |
| SG-CA91 | 140; 5320 | 1.14 | 5.4 | 5 | 0.08 |
| SG-CA27 | 326 | 0.67 | 8.2 | 9 | 0.09 |
| SG-CA45 | 137; 2000 | 0.14; 0.90 | 6.3 | 7 | 0.10 |
| SG-C3 | 259 | 0.75 | 11.6 | 10 | 0.16 |
| SG-CA68 | 158; 3700 | 0.23; 1.09 | 7.0 | 6 | 0.17 |
| SG-CA23 | 197 | 0.41 | 8.3 | 10 | 0.17 |
| SG-Ref0 | 116 | 0.12 | 4.1 | 5 | 0.18 |
| SG-C4 | 182 | 0.43 | 9.5 | 8 | 0.19 |
| SG-CA14 | 150 | 0.17 | 4.5 | 6 | 0.25 |
| SG-CA34 | 916 | 0.79 | 3.5 | 5 | 0.30 |
| SG-C2#2 | 147; 2530 | 0.18; 1.35 | 7.0 | 5 | 0.40 |
| SG-CA19 | 164 | 0.25 | 6.1 | 12 | 0.49 |
| SG-C6 | 138 | 0.18 | 5.2 | 3 | 0.73 |
| SG-C2#1 | 838 | 1.18 | 5.6 | 3 | 0.87 |
| Sample | Additive | φAl[a] | Vp[b]/cm3/g | dp[b]/nm | ABET[c]/m2/g |
|---|---|---|---|---|---|
| SG-Ref0 [68] | none | n/a | 0.12 | 116 | 5 |
| SG-Ref0-(80) | none | n/a | 0.34 | 151; 332 | n.d. |
| SG-Ref100 [68] | PEO | n/a | 0.52 | 135; 1345 | 6 |
| SG-CA91 [68] | citric acid | 7.5 | 1.14 | 140; 5320 | 5 |
| SG-CA68 [68] | citric acid | 10 | 1.19 | 157; 3730 | 6 |
| SG-CA45 [68] | citric acid | 15 | 1.04 | 137; 2000 | 7 |
| SG-CA34 [68] | citric acid | 20 | 0.79 | 916 | 5 |
| SG-CA27 [68] | citric acid | 25 | 0.67 | 326 | 9 |
| SG-CA23 [68] | citric acid | 30 | 0.41 | 197 | 10 |
| SG-CA19 [68] | citric acid | 35 | 0.25 | 164 | 12 |
| SG-CA14 [68] | citric acid | 50 | 0.17 | 150 | 6 |
| SG-C2#1 [91] | oxalic acid | 10 | 1.18 | 838 | 3 |
| SG-C2#2 [91] | oxalic acid | 5 | 1.53 | 147; 2530 | 5 |
| SG-C3 [91] | malonic acid | 10 | 0.75 | 259 | 10 |
| SG-C3-(80) | malonic acid | 10 | 1.39 | 786 | n.d. |
| SG-C4 [91] | succinic acid | 10 | 0.43 | 182 | 8 |
| SG-C5 [91] | glutaric acid | 10 | 0.38 | 195 | 8 |
| SG-C6 [91] | adipic acid | 10 | 0.18 | 138 | 3 |
- [a] ratio Al3+/ additive
- [b] calculated from mercury intrusion
- [c] calculated from nitrogen sorption
- n.d. not determined
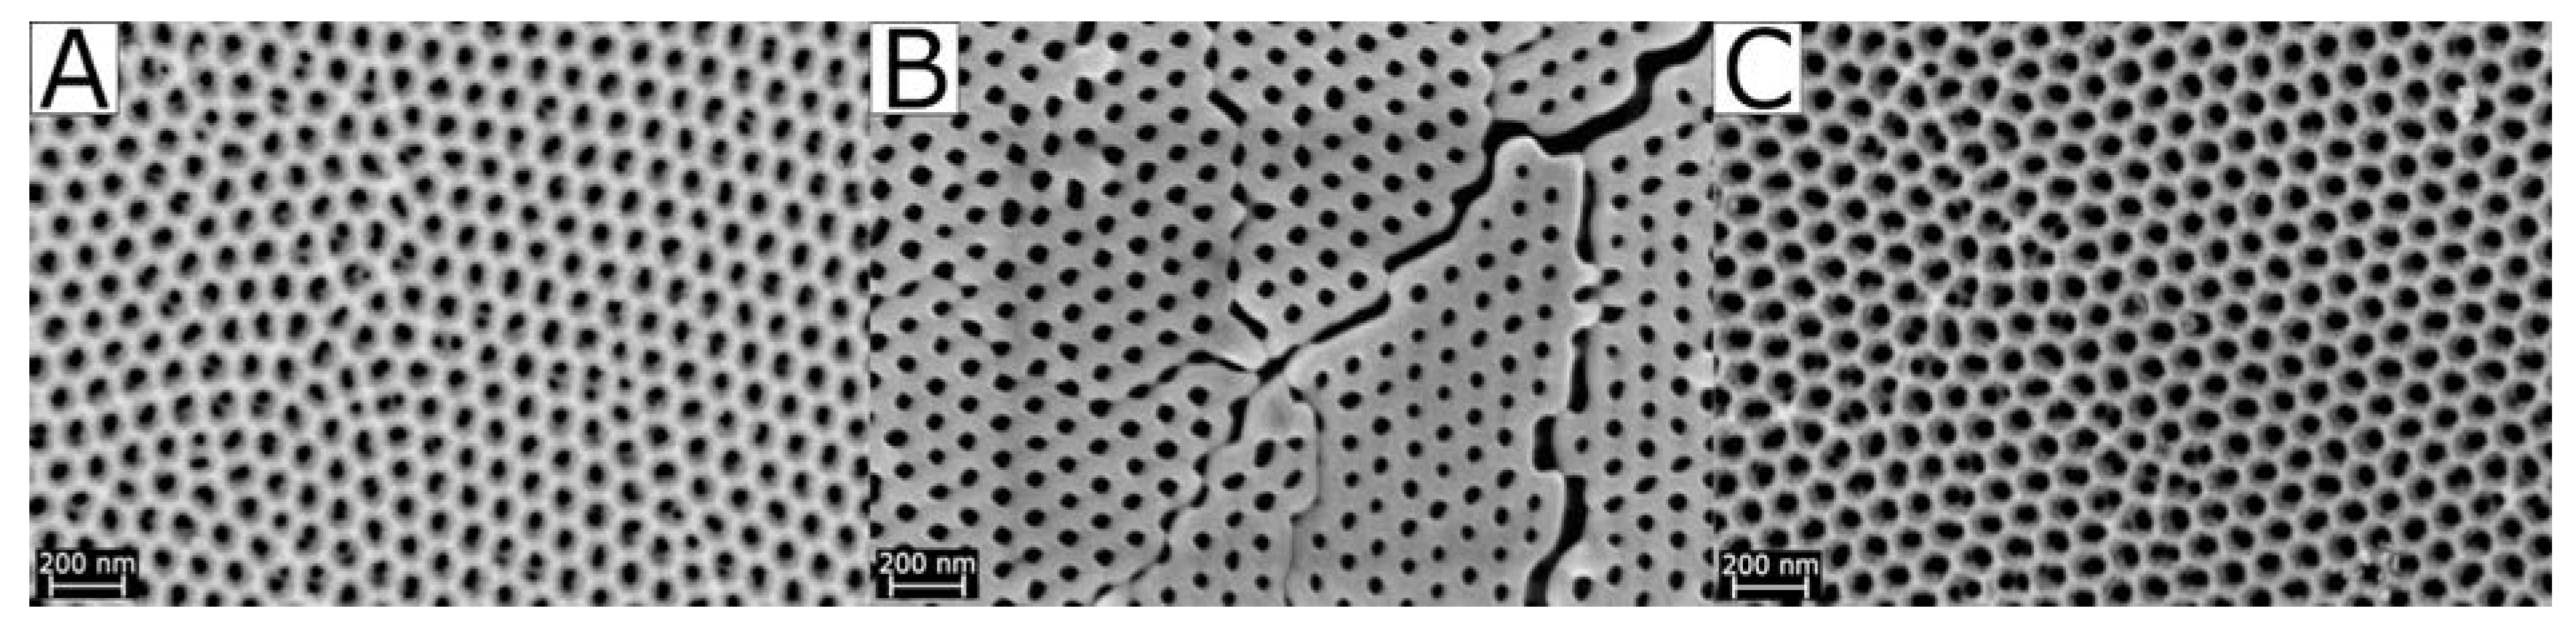
| Sample Name | Oxalic Acid AAO Treatment | Pore Size/nm (SEM) |
|---|---|---|
| AAO-0 | (A) pristine | 32–49 |
| AAO-1100 | (B) 1100 °C | 29–47 |
| AAO-Mn-900 | (C) 900 °C, Mn-impregnated | 42–46 |
© 2020 by the authors. Licensee MDPI, Basel, Switzerland. This article is an open access article distributed under the terms and conditions of the Creative Commons Attribution (CC BY) license (http://creativecommons.org/licenses/by/4.0/).
Share and Cite
Carstens, S.; Meyer, R.; Enke, D. Towards Macroporous α-Al2O3—Routes, Possibilities and Limitations. Materials 2020, 13, 1787. https://doi.org/10.3390/ma13071787
Carstens S, Meyer R, Enke D. Towards Macroporous α-Al2O3—Routes, Possibilities and Limitations. Materials. 2020; 13(7):1787. https://doi.org/10.3390/ma13071787
Chicago/Turabian StyleCarstens, Simon, Ralf Meyer, and Dirk Enke. 2020. "Towards Macroporous α-Al2O3—Routes, Possibilities and Limitations" Materials 13, no. 7: 1787. https://doi.org/10.3390/ma13071787