2.1. Metal Additive Manufacturing
According to the ISO/ASTM 52900:2015 [
18], AM is a process of joining materials to make parts from 3D model data, usually layer upon layer, as opposed to subtractive manufacturing and formative manufacturing methodologies [
19,
20,
21]. AM involves fusion of similar materials or adhesion of dissimilar materials and can be broadly classified in single-step AM process and multi-step AM processes. Single-step AM processes do not require a post-processing step like sintering and / or infiltration. Most of the metallic ceramic and composite parts require a post-processing step.
Selective laser melting (SLM), direct metal laser sintering (DMLS), selective laser sintering (SLS), laser engineered net shaping (LENS), and electron beam selective melting (EBSM) are some of the commercially available metal AM methods [
22,
23,
24]. Among these methods, SLM is a relatively mature rapid prototyping technology. SLM can be used to obtain complex shaped functional components with bulk densities close to 100%. Moreover, high geometrical precision (0.05–0.3 mm) and low surface roughness (Ra 30–50 µm) are possible when SLM is used [
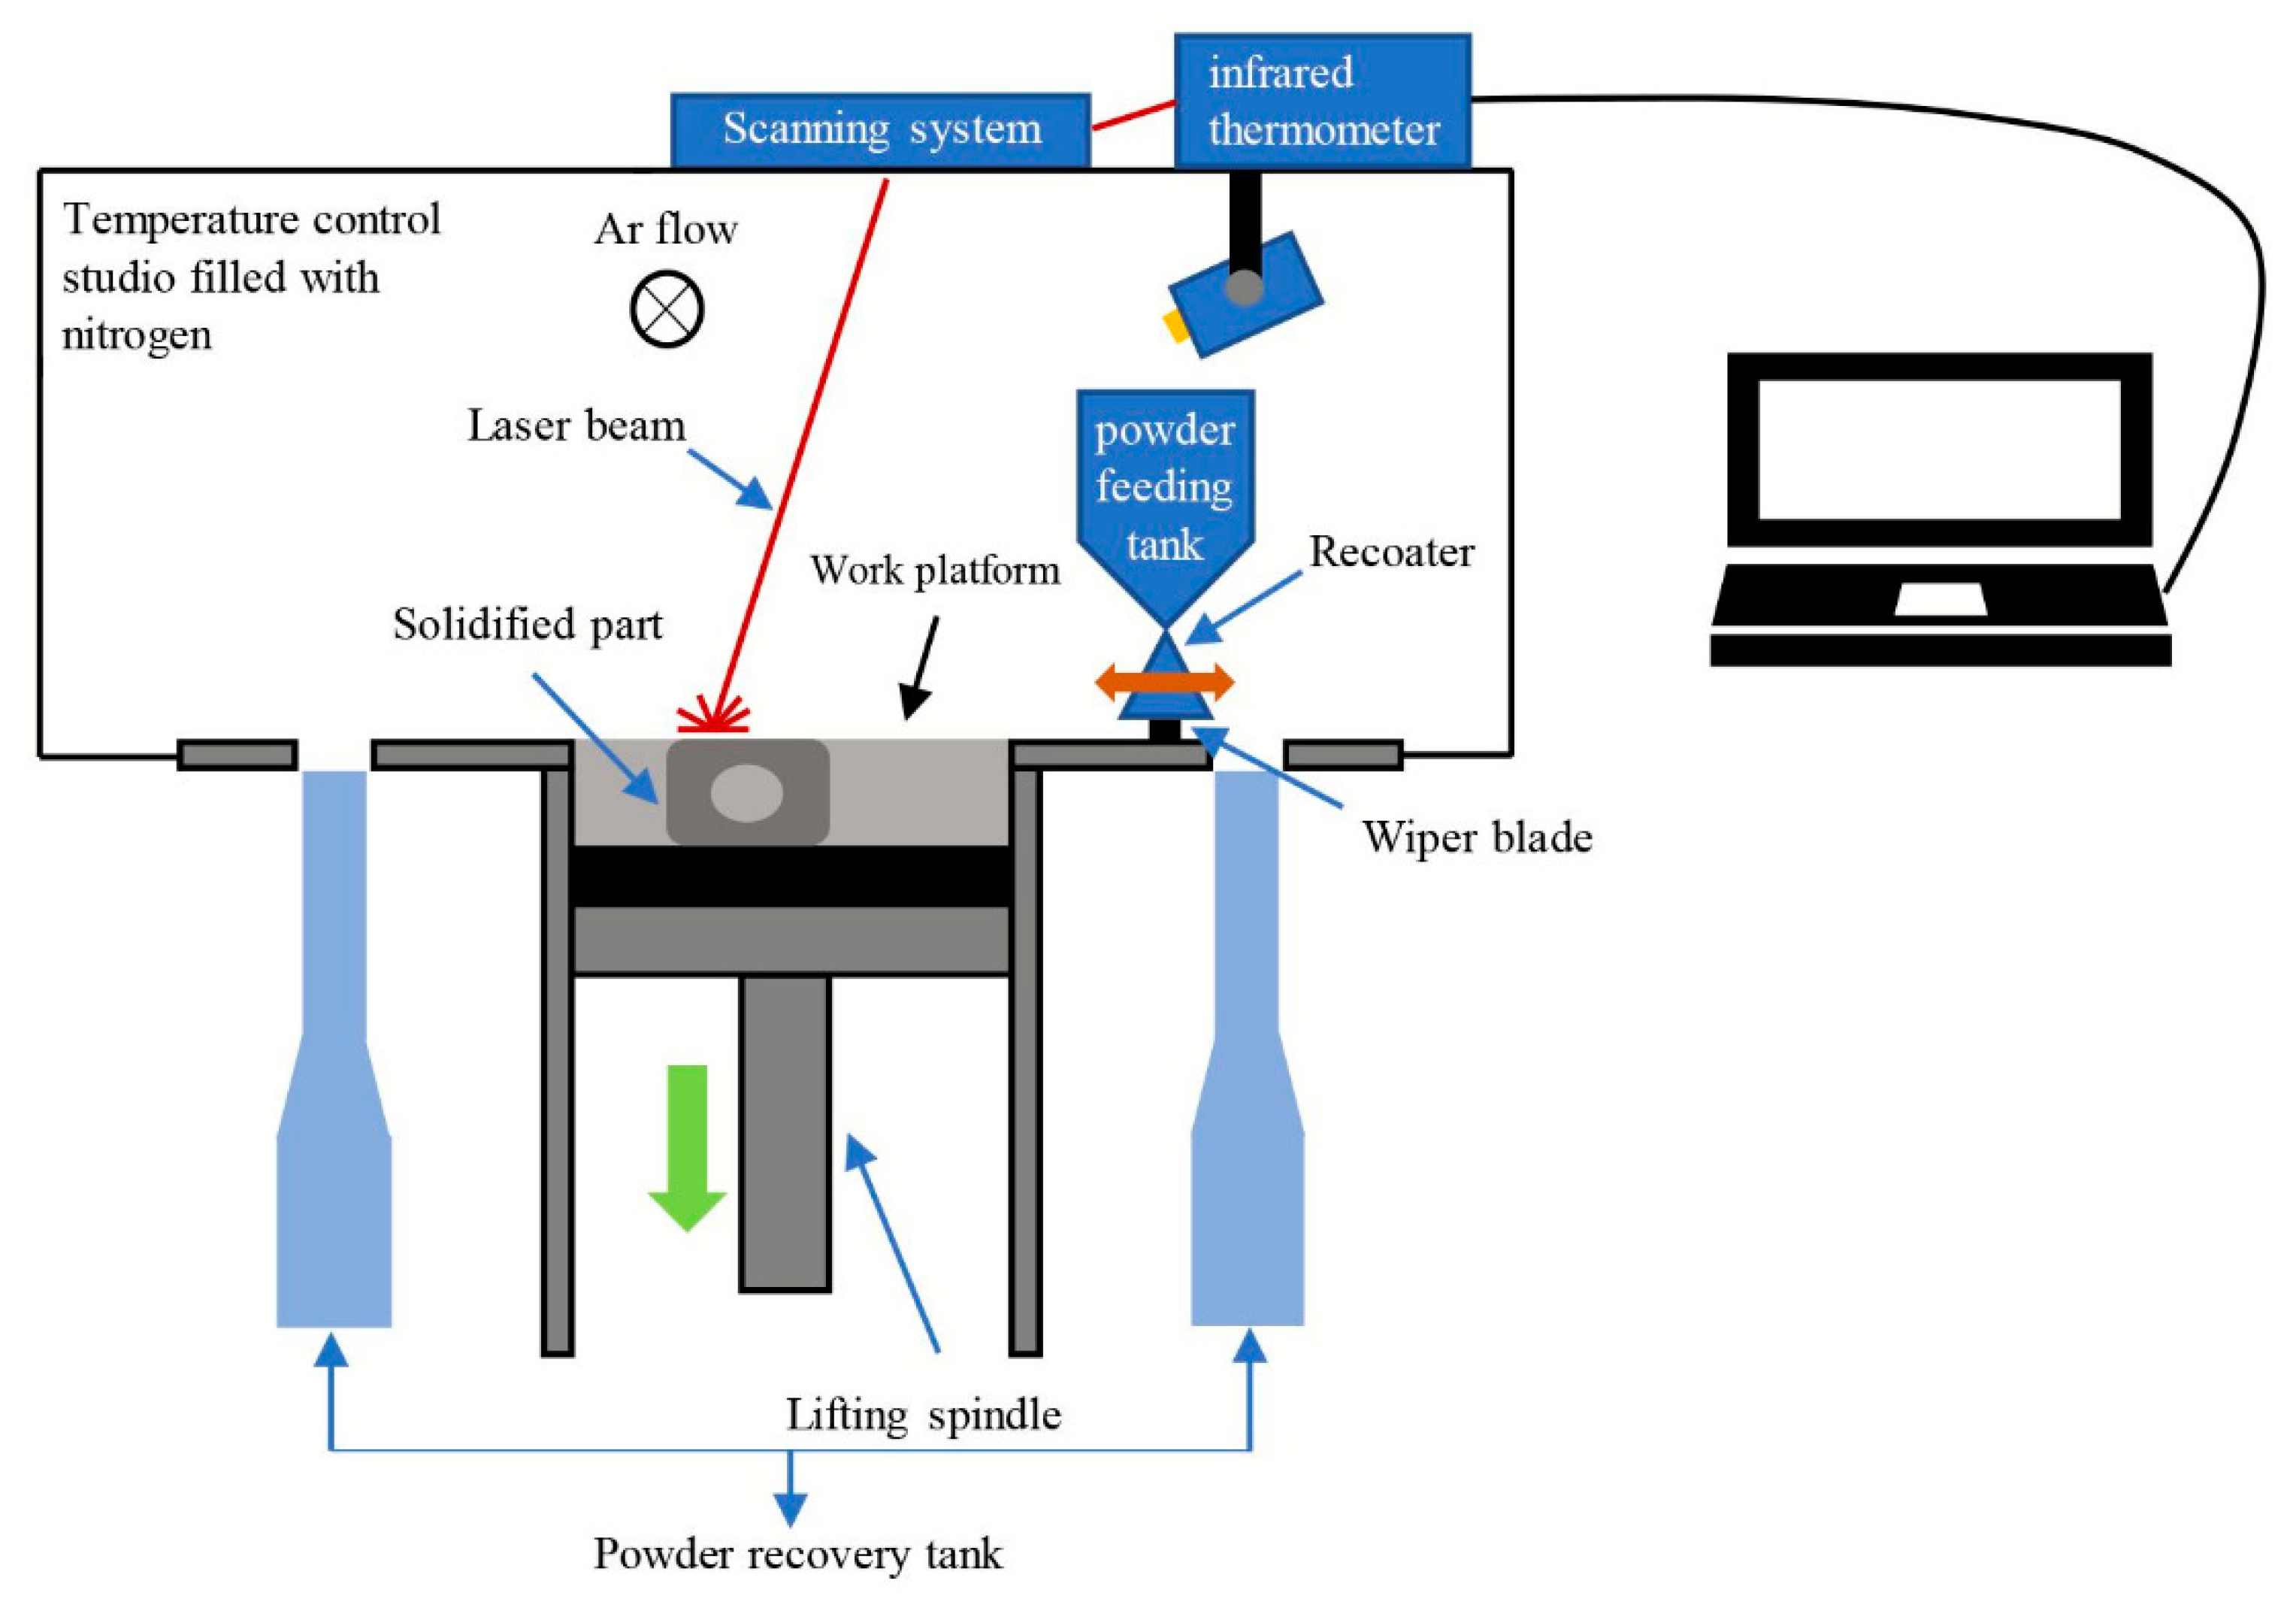
25]. The printing equipment used in this study is HBD-200 metal 3D printer of Guangdong Han-bang Laser Technology Co., Ltd. (Guangzhou, China). This machine uses a high-energy laser beam to melt a bed of metal powder building the component layer by layer according to the section-by-section input from the three-dimensional metal solid part model. The entire process is carried out in a closed atmosphere filled with an inert gas to prevent the metal powder from reacting with the air at high temperatures generated by the laser, as shown in
Figure 2. The maximum laser power of this machine is 200 W, the print layer thickness is 10–40 μm, the print line width is 40–80 μm, the line scanning speed is ≤10,000 mm/s, and the user can customize the process parameters.
There are three main causes of fatigue cracks in SLM moldings:
- (1)
Surface/ below-surface defects such as micro-voids in parts can cause stress concentrations and hence induce fatigue cracks.
- (2)
The anisotropy of additive manufacturing parts can also have a significant impact on fatigue performance.
- (3)
The high temperature gradient generated during the rapid cooling of the molten pool leads to the generation of tensile residual stress which in conjunction with micro-voids can accelerate the development of fatigue cracks.
However, the use of optimized printing process parameters and appropriate heat treatment can significantly reduce the defects, anisotropy and residual stresses, which can improve the fatigue resistance of SLM molded parts [
26]. Therefore, it is very important to study the optimization of process parameters.
2.2. Material Selection
There are many kinds of commercially available spherical metal powders used for AM of metals, such as stainless steel, bronze-based metal, cobalt-chromium series, tool steel, titanium series, nickel alloy, aluminum alloy, and other metal powders. For structural steel applications, 316L stainless steel metal powder is often preferred. 316L has good gloss improving the appearance of the finished structural component, excellent corrosion resistance due to the addition of chromium which allows the formation of a nanoscale passive layer, and excellent high temperature mechanical strength which is a desirable quality in architecturally exposed steel structures. From an economic standpoint, the price of stainless steel 316L powder material is relatively lower compared to other powder materials making it desirable for the fabrication of building components. For the above reasons, 316L stainless steel metal powder is used in the AM of joints.
Experiments were performed using aerosolized 316L stainless steel powder produced by Guangzhou Han-bang Laser Technology Co., Ltd. The chemical composition of stainless steel 316L powder material is: Mo (2.25–3%); Fe (balance); Cr (17–19%); Ni (13–15%); P (≤0.025%); S (≤0.010%); Cu (≤0.5%); C (≤0.03%); Si (≤0.1%); N (≤0.1%); and Mn (≤2%). The particle size distribution interval is 15–45 μm.
2.3. Selection of SLM Fabrication Process Parameters
In order to obtain high-density, it is necessary to optimize the process parameters of the SLM, such as scanning strategy, laser power, laser scanning rate, scanning pitch, and layer thickness. The ideal process parameters are not the same for different metal powders, and changing one process parameter will also influence the other process parameters. Some experiments are conducted to study the influence of laser power, scanning speed and scanning pitch which are the most important processing parameters with the aim of finding the ideal set of parameters. To this end, Taguchi analysis method was used to obtain more comprehensive information with fewer number of experiments [
27].
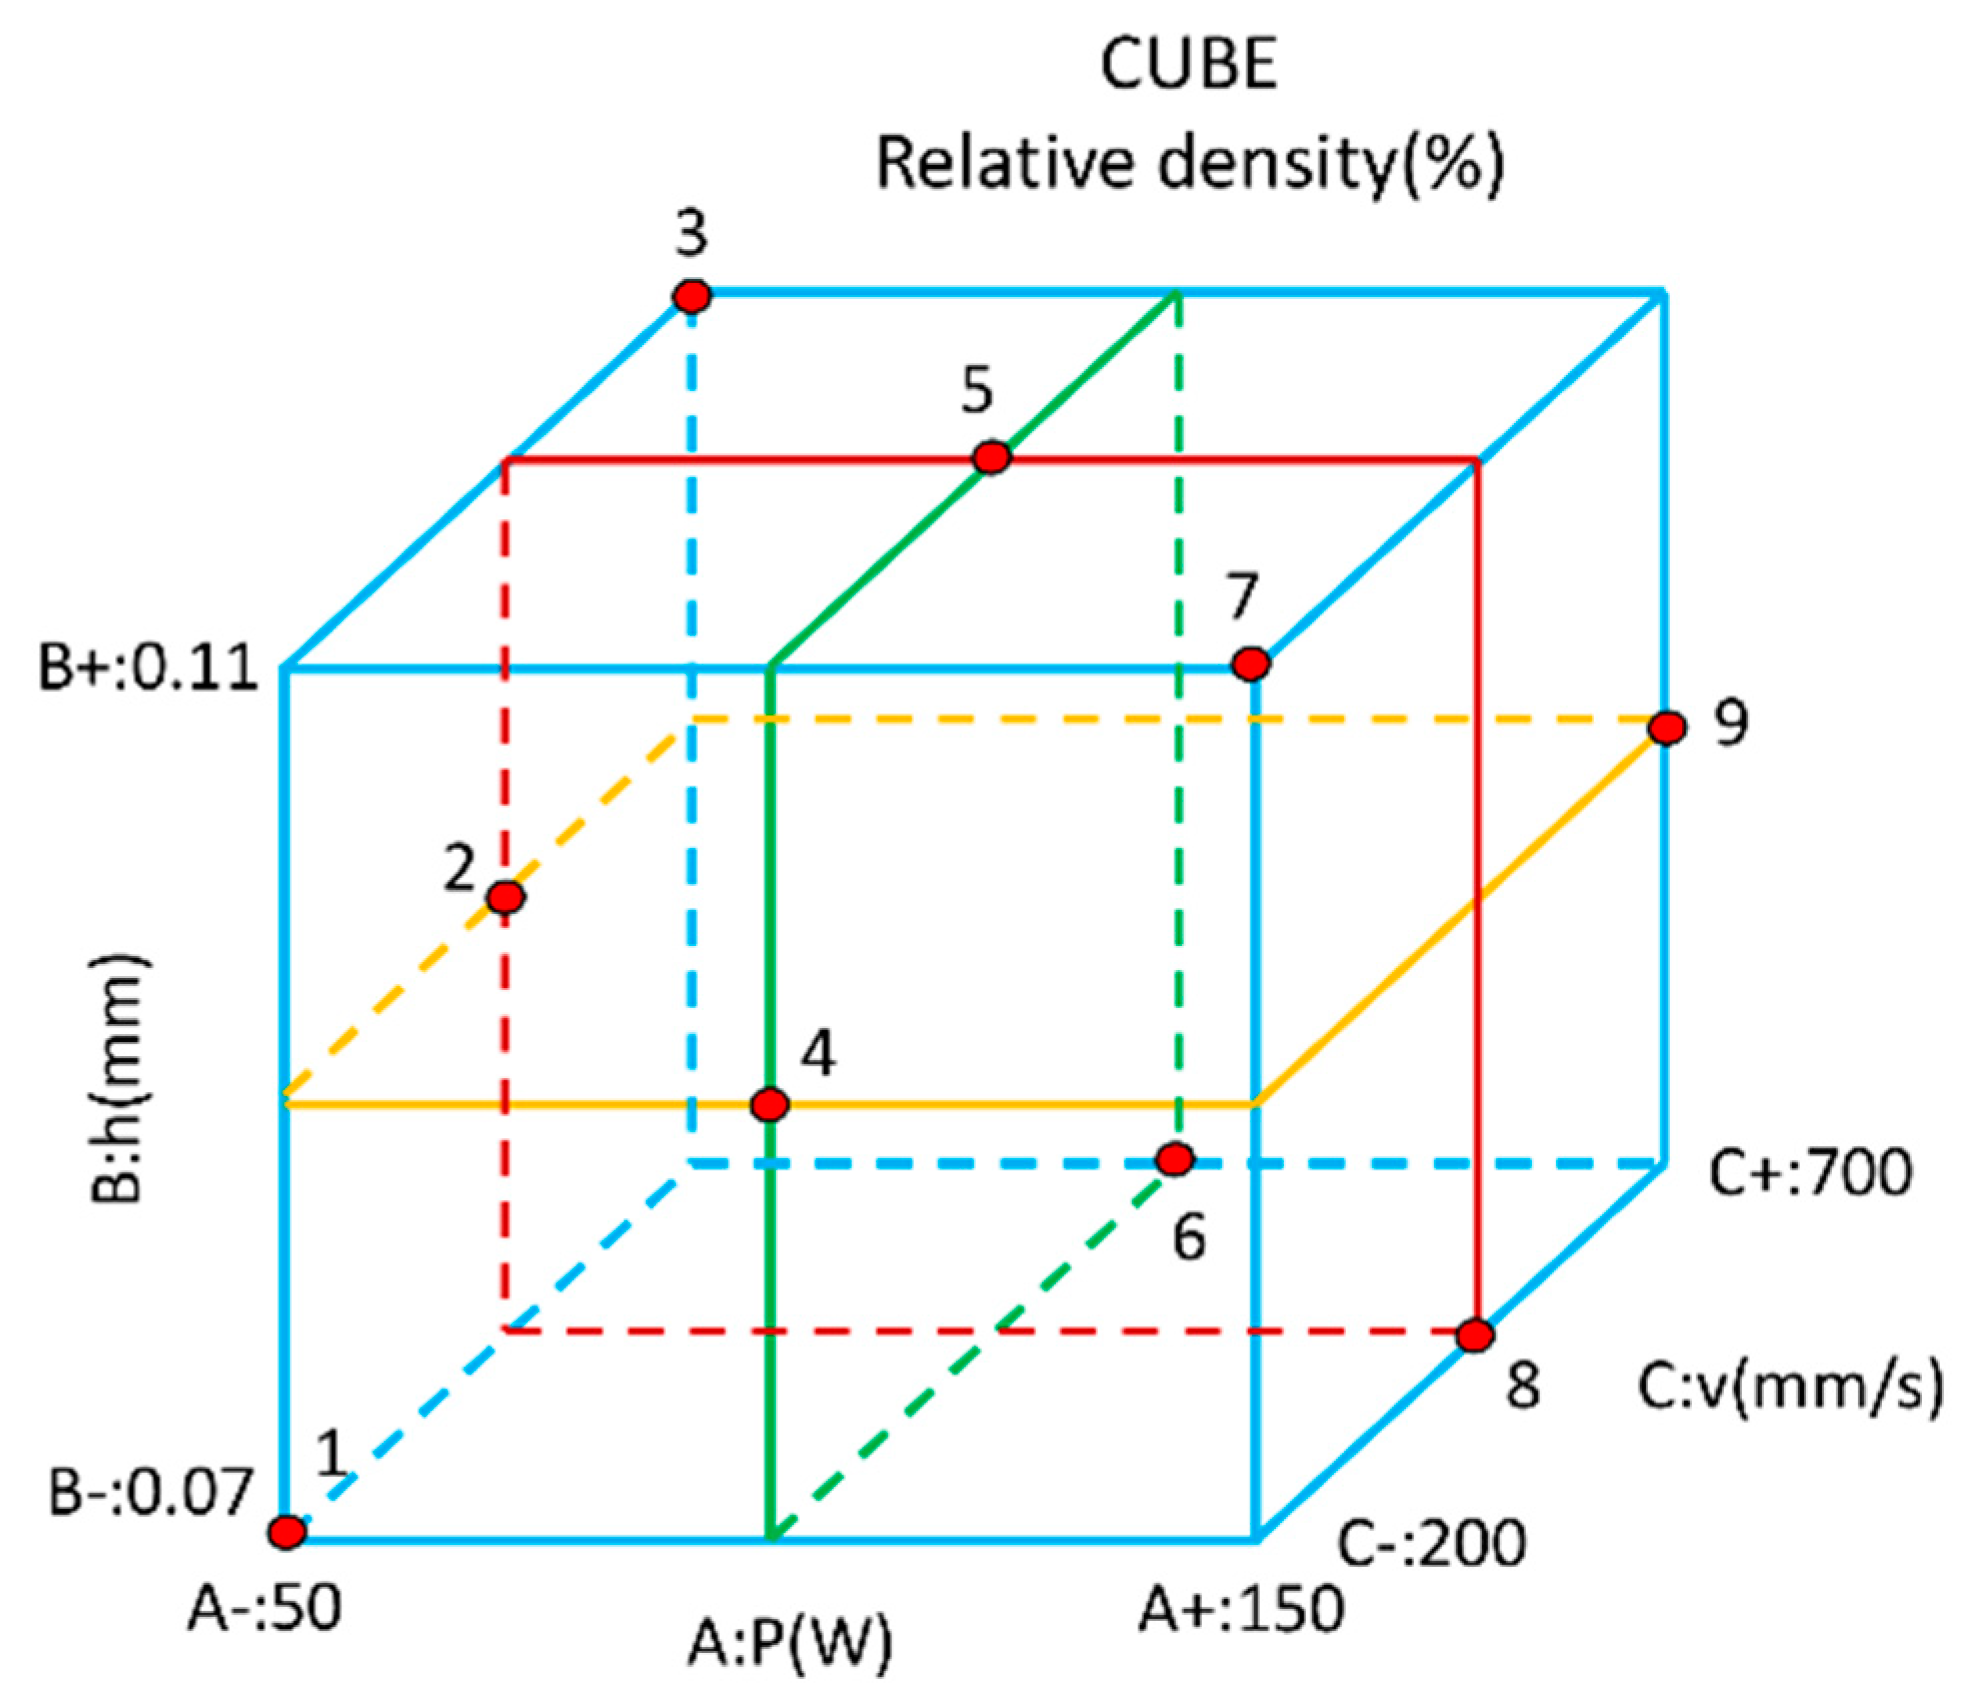
The Taguchi analysis method uses orthogonal tables of experimental design theory to study a large number of variables in small experiments. Three levels of the three chosen processing parameters are used in the tests. As depicted in the cube in
Figure 3, each level represents a plane, and there are 9 planes for all the 3 processing parameters. The cube has 27 sets of test points. The parameter factors and design levels of the orthogonal test are shown in
Table 1, and the printed layer thickness is selected to be 30 µm [
28]. The size of the sample prepared by the SLM process was about 10 × 10 × 9 mm. The relative density of the sample was measured by Archimedes principle. As we aim to obtain the parameters that yield maximum relative density, we chose the "Large characteristic" standard in Taguchi analysis method to calculate the Signal to Noise Ratio (SNR). The SNR formula is shown in Equation (1), where y is the result of the relative density test and n is the number of experiments. The calculation results are shown in
Table 2.
It can be seen from
Table 2 that the signal-to-noise ratio of the test no. 9 is the largest, so the no. 9 test scheme is the optimal set of parameters, and the corresponding optimal process parameters are:
P = 150 W,
v = 700 mm/s,
h = 0.09 mm.
Orthogonal tests often use the analysis of variance method to evaluate the error, and the results are summarized in
Table 3.
Where T is the sum of SNR; ( are the sum of SNR of each level in each column, () are their average values; R is the range of each column; is the synthesis of the sum of squared fluctuations of SNR; S is the synthesis of the sum of squared fluctuations of SNR in each column.
SNR analysis of variance:
Calculate the degrees of freedom between the factors in Equation (2)
where,
r is the number of factors,
p is the number of levels,
is the degree of freedom between factors.
Calculate the degrees of freedom of the error in Equation (3)
where,
is the degree of freedom of the error.
Calculate the degree of freedom of the total fluctuation in Equation (4)
where,
is the degree of freedom of the total fluctuation.
Calculate the variance of the error in Equation (5)
where,
is the variance of the error,
is the sum of the squared fluctuations of the error.
Calculate the power fluctuation and contribution rate in Equation (6)
where,
is the fluctuation of power,
is the contribution rate of power.
Calculate the speed fluctuation and contribution rate in Equation (7)
where,
is the fluctuation of speed,
is the contribution rate of speed.
Calculate the spacing fluctuation and contribution rate in Equation (8)
where,
is the fluctuation of spacing,
is the contribution rate of spacing.
It can be seen from the calculation results each of the parameters have a different effect on the relative density. The laser power has the greatest influence on the relative density of the fabricated part followed by the scan spacing and the scan speed.
The relation between the various process parameters is given as Equation (9), where,
P is the laser power in W;
v is the laser scanning speed in mm/s;
h is the laser scanning pitch in mm, and
E is the volume energy density in J/mm
2 [
29].
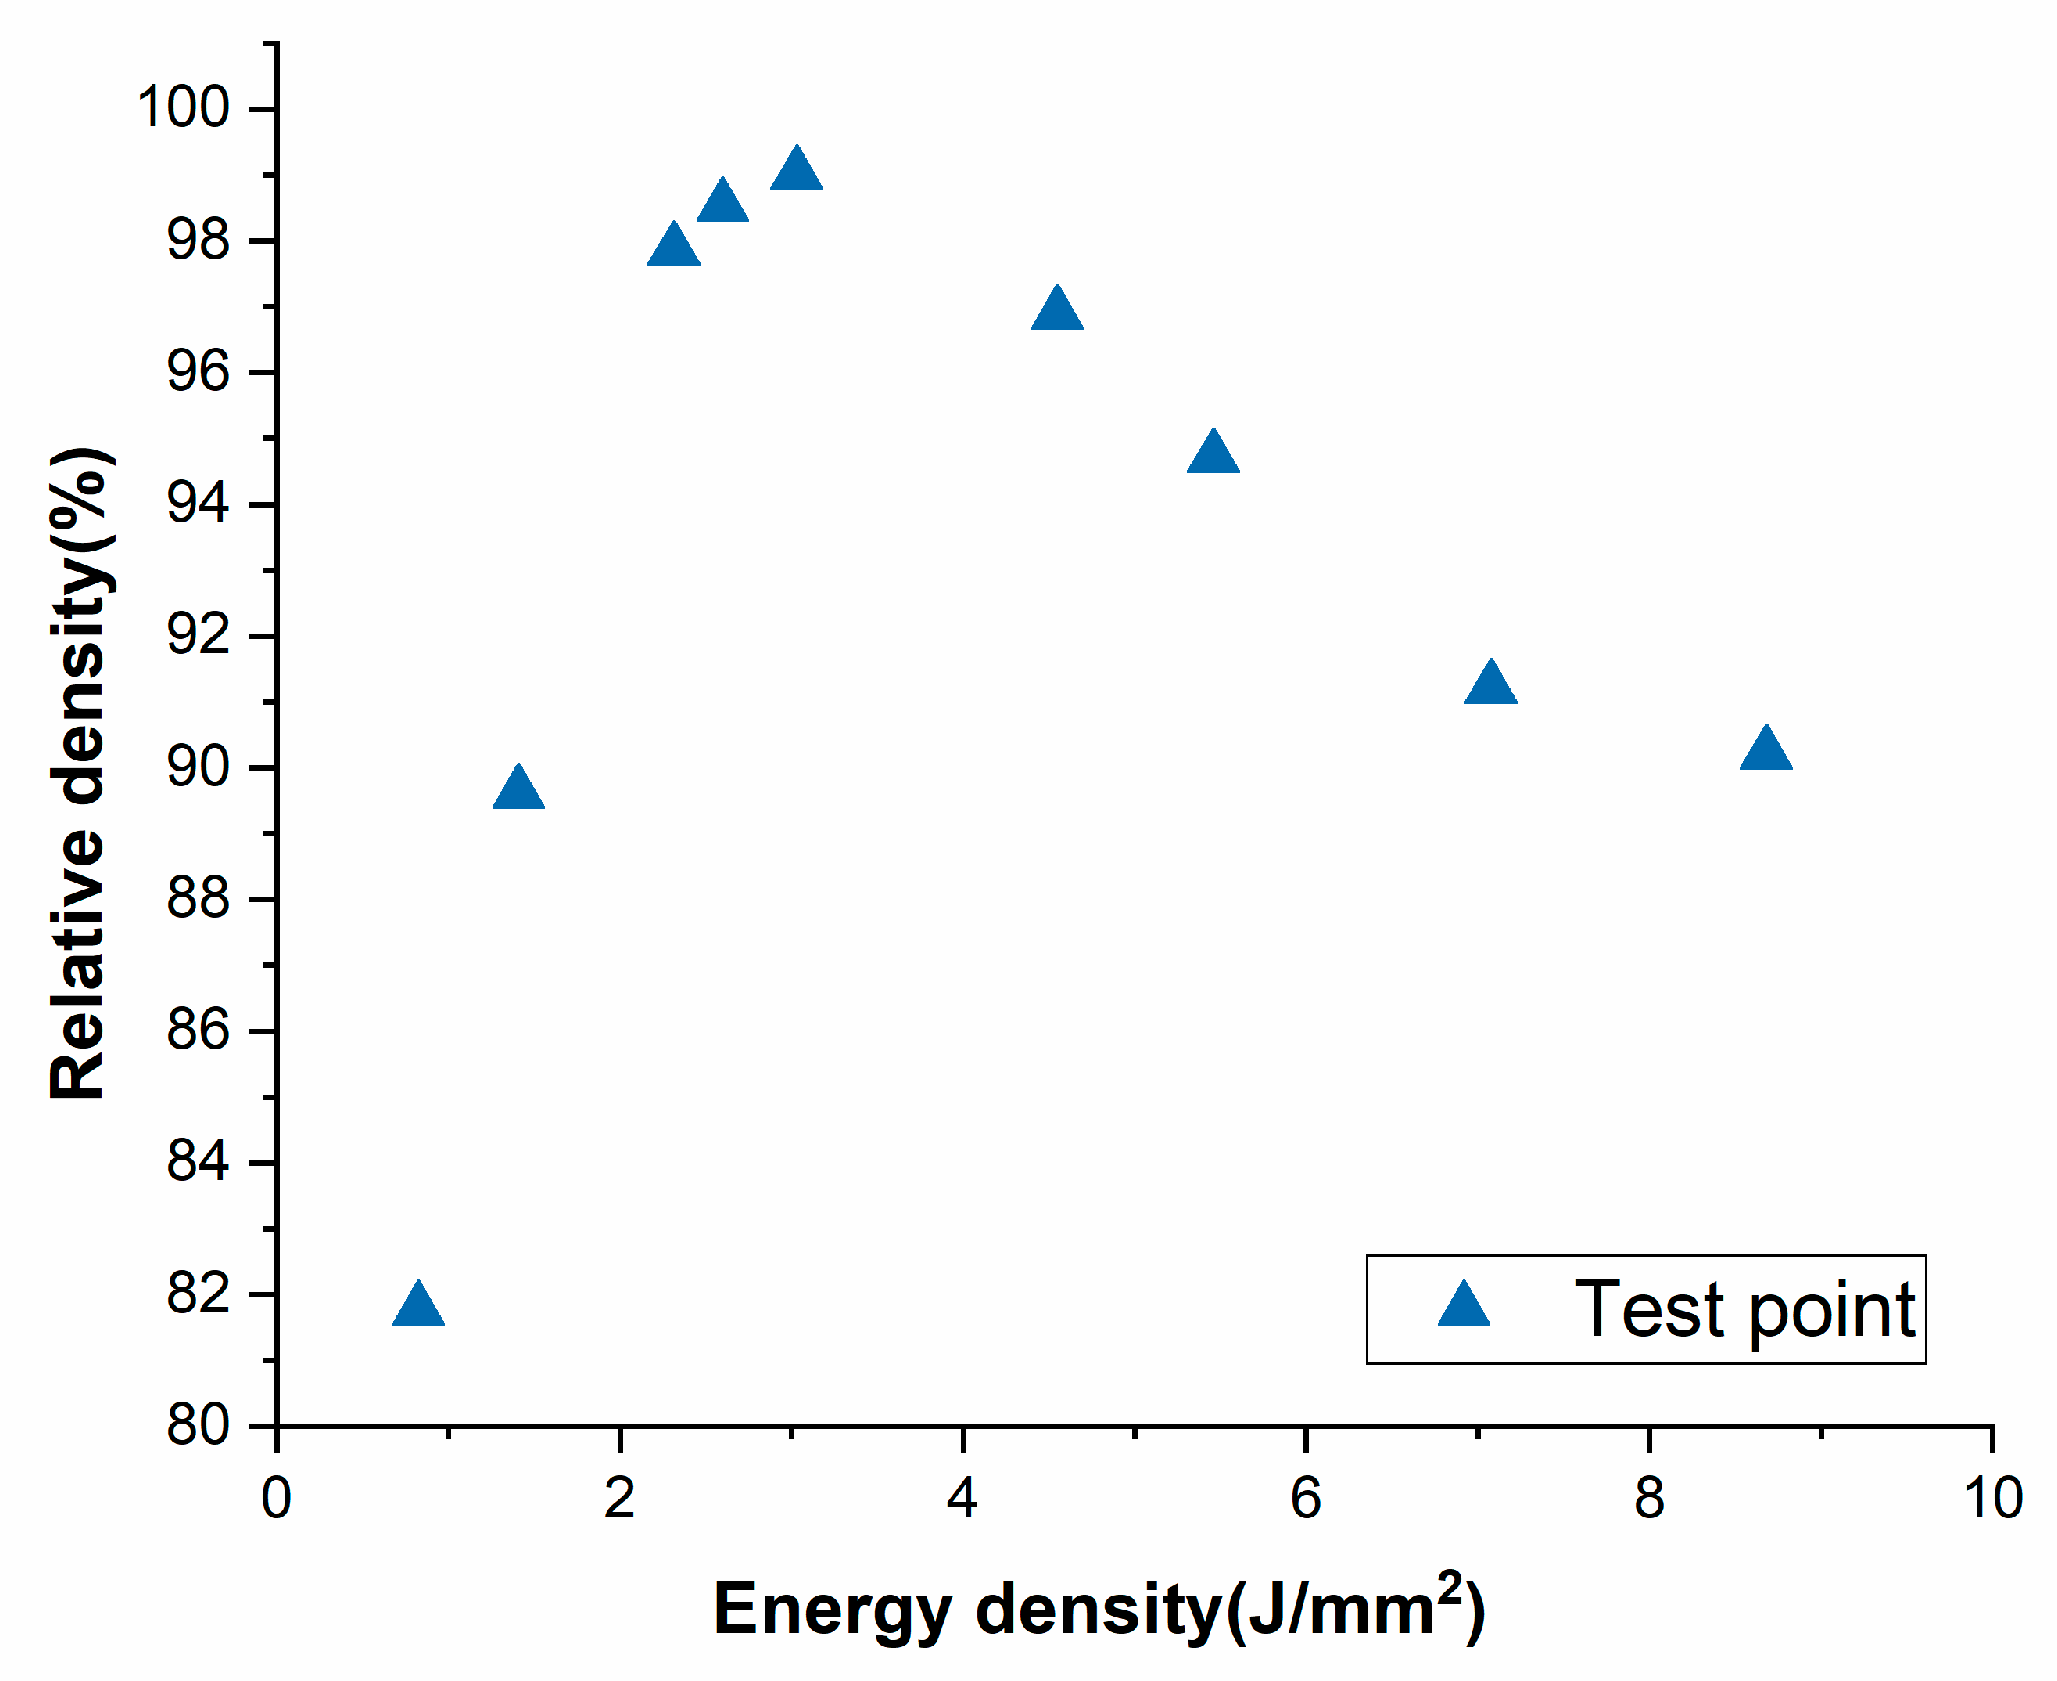
The relationship between the laser energy density and the relative density is plotted in
Figure 4. The relative density increases first and then decreases with the increase of energy density, and the relative density of components can reach up to 99.01% while the minimum relative density is 81.77%. The reason why the relative density does not reach 100% may be that different defects still exist inside the component, such as holes and cracks. Therefore, research on process parameters and other factors that affect the density of molded parts is very important.
2.4. Material Properties Test of 316L Stainless Steel
The standard dog bone tensile specimens were fabricated employing the process parameters (
P = 150 W,
v = 700 mm/s,
h = 0.09 mm) that produced highest relative density. The geometry and dimensions of the standard test specimens is provided in
Figure 5, where
d0 = 10 mm,
L0 = 10 mm,
do = 100 mm,
Lt = 180 mm, transition arc radius
r = 10 mm ≥ 0.75
d0. Three specimens were fabricated for conducting the tensile test, and the average values of the mechanical properties were taken as the representative values.
The mechanical testing is conducted using the WDW-600E microcomputer-controlled electronic universal testing machine produced by Shenzhen San-si Vertical and Horizontal Technology Co., Ltd (Shenzhen, China). The tensile test is carried out in accordance with GB/T228.1-2010 at room temperature with a displacement rate 0.5 mm/min. An extensometer is used to measure the longitudinal strain of the specimen and the measurements in the elastic regime are used to evaluate the Young’s modulus. The tensile fracture of the specimen was observed using SEM. The hardness test is carried out using Digi-Rock DR3 Rockwell hardness tester produced by Dongguan Zhong-wang Precision Instrument Co., Ltd. (Dongguan, China). The hardness tests were conducted according to the GBT230.1-2009 metal Rockwell hardness test method.
The standard test piece fabricated by SLM is anisotropic, and defects are likely to occur at the boundary of the molten pool [
30,
31,
32,
33,
34,
35]. The solid solution and aging treatment can eliminate the defects at the boundary of the molten pool, and thus improve the tensile strength. Besides this, due to the increase of austenite after high temperature treatment, a large amount of carbides is dissolved into the austenite, which increases the toughness of the metal [
36,
37,
38]. In this study, the solid solution temperature is 1050 °C and the time is 30 minutes, followed by aging treatment. The aging treatment time is performed for 24 hours at a temperature of 750 °C [
36,
37,
38]. The average values of the mechanical properties are summarized in
Table 4. The results show that the tensile strength of 316L stainless steel fabricated by SLM under the optimal process parameters can reach 637.80 MPa, the elongation at fracture can reach 32.10%, and the Rockwell hardness is 68.3 HRB. The tensile strength is 41.73% higher, the elongation at fracture is 19.75% lower, and the Rockwell hardness is 24.1% lower than the values prescribed by ASTM standard for casted specimens.
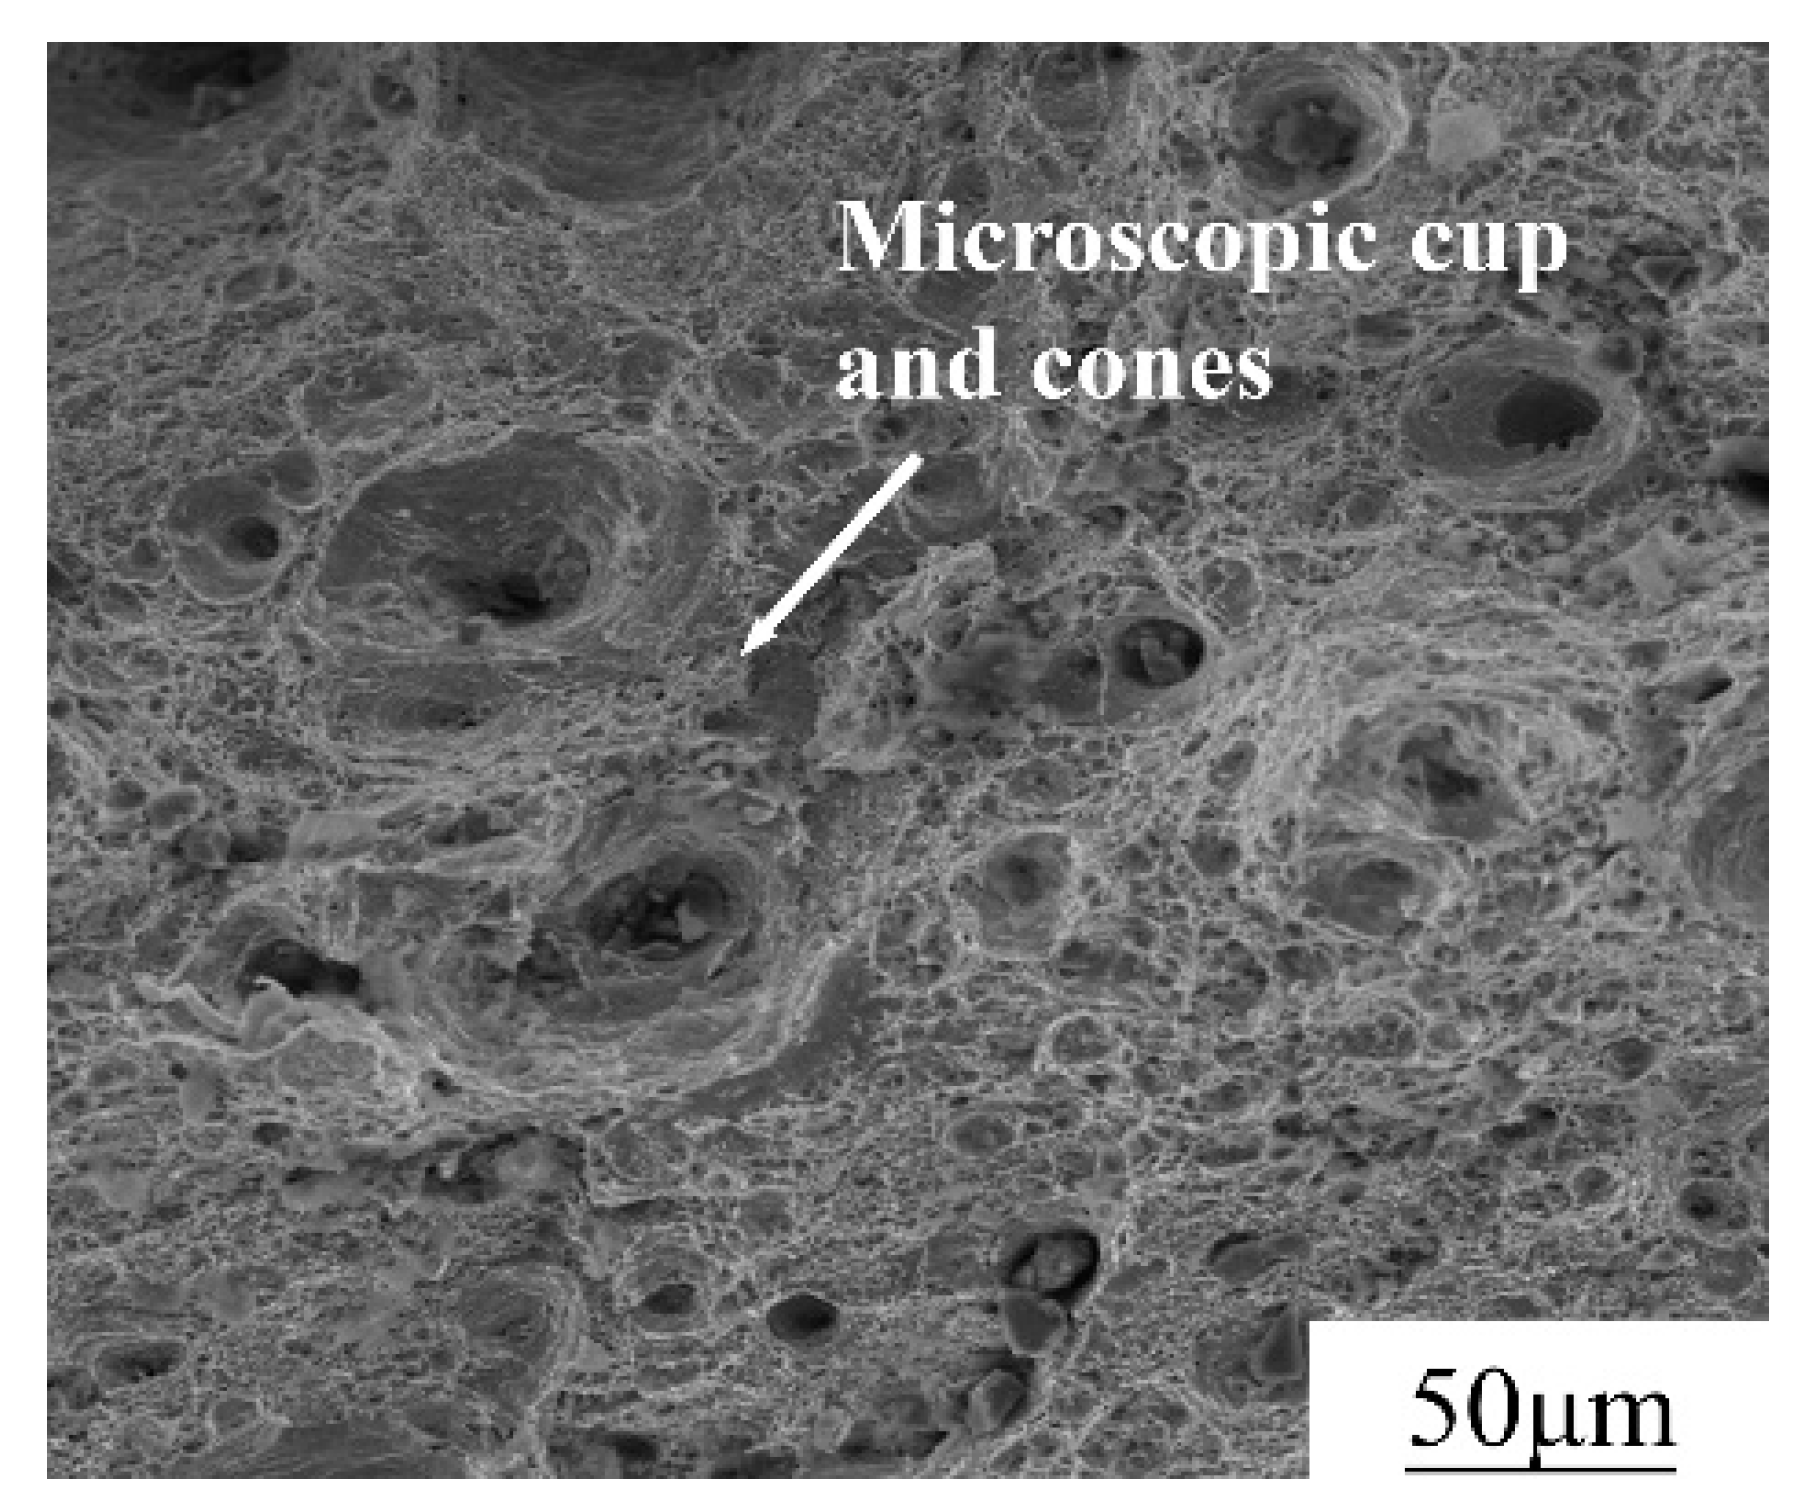
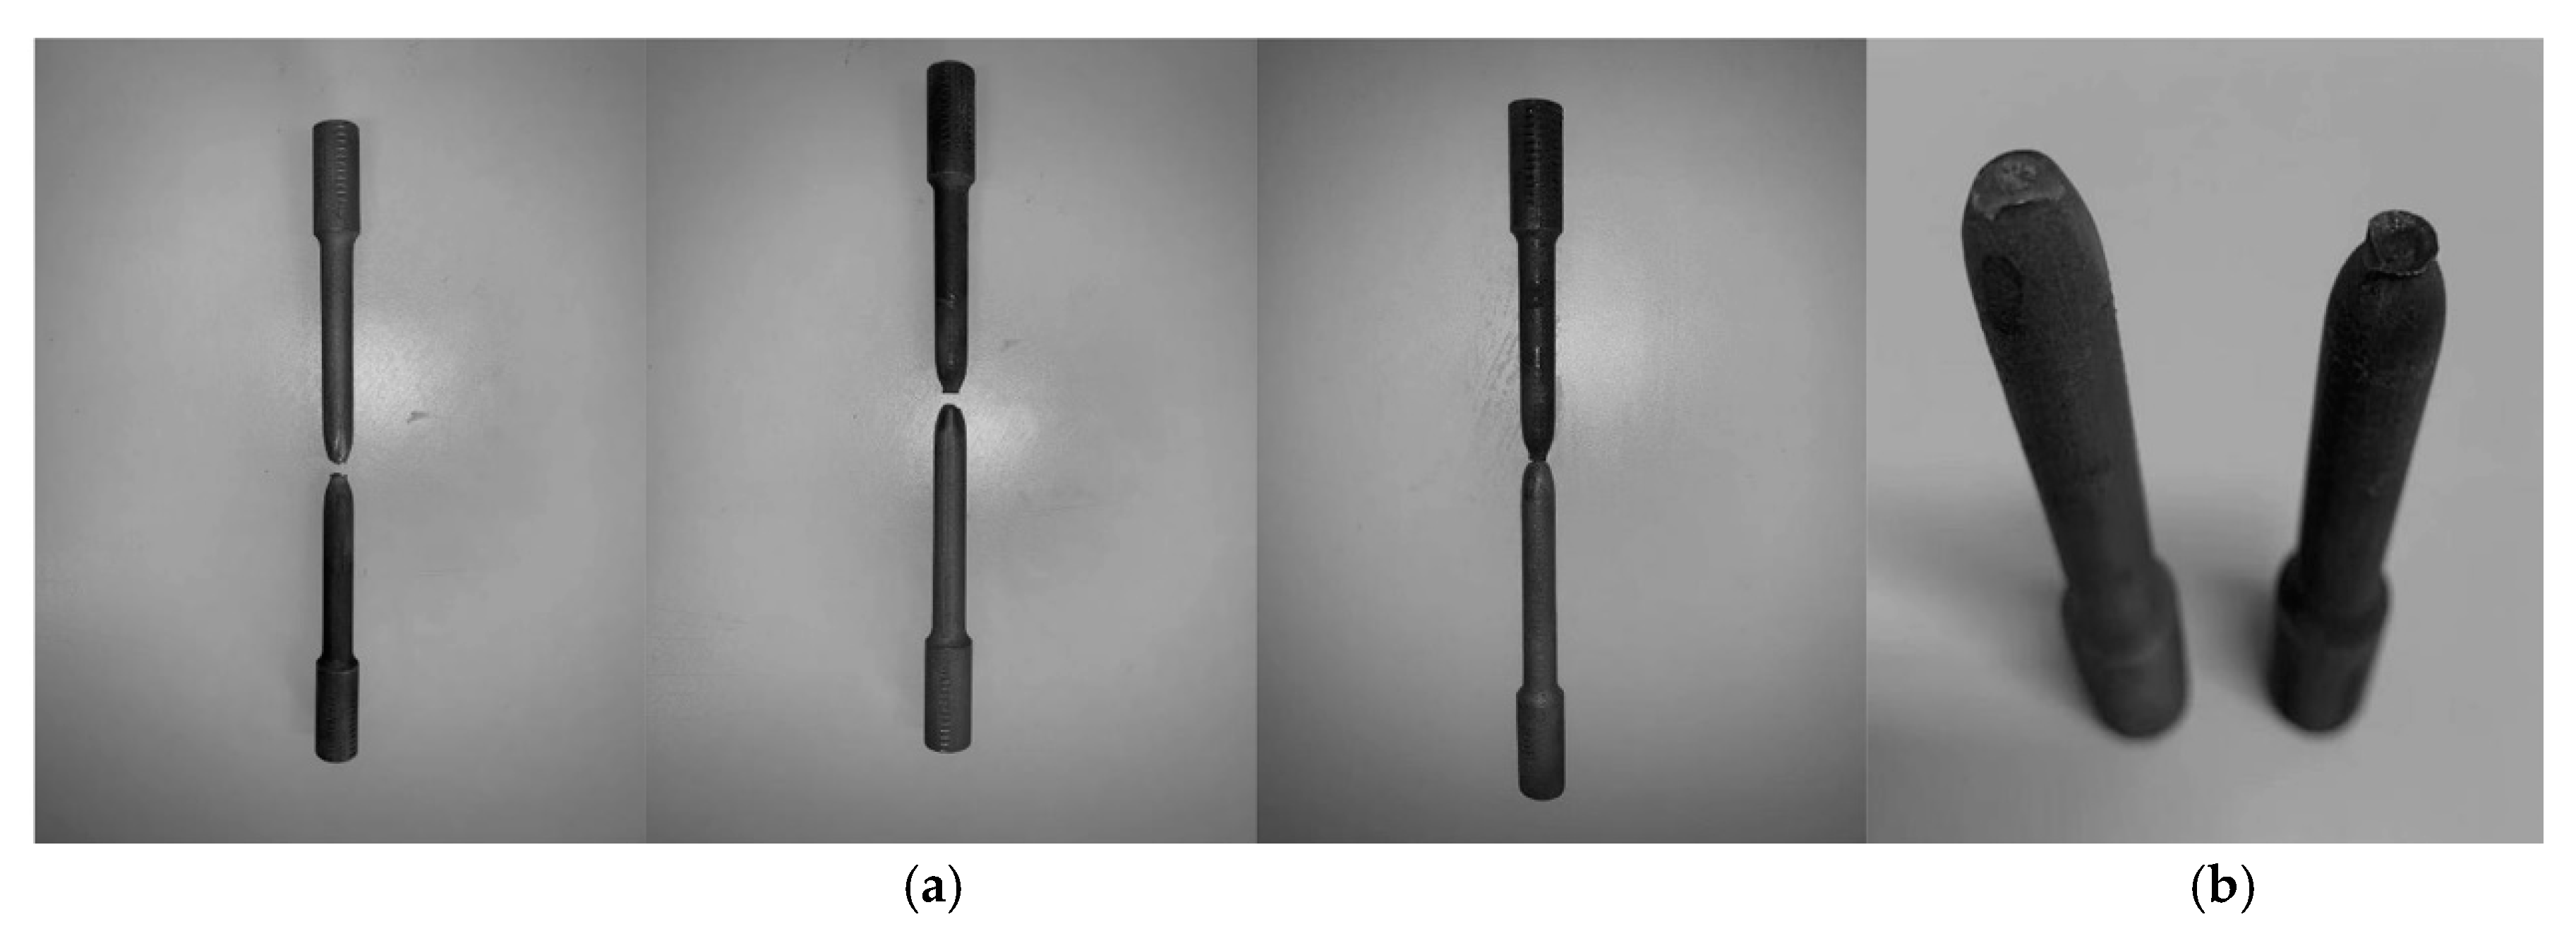
Figure 6 shows the fracture morphology of the tensile specimens. The elongation of 316L stainless steel at tensile fracture is 32.1%, which indicates that the plasticity of the fabricated parts is suitable for engineering applications. From fracture morphology, it can be found that there are a large number of microscopic cup and cones. Since the microscopic cup and cones are indicative of ductile fracture, 316L stainless steel piece is ductile fracture. During the tensile test, all tensile specimens showed significant necking. As shown in
Figure 7, the cross-sectional area of the test piece decreased with the increase of the tensile force.
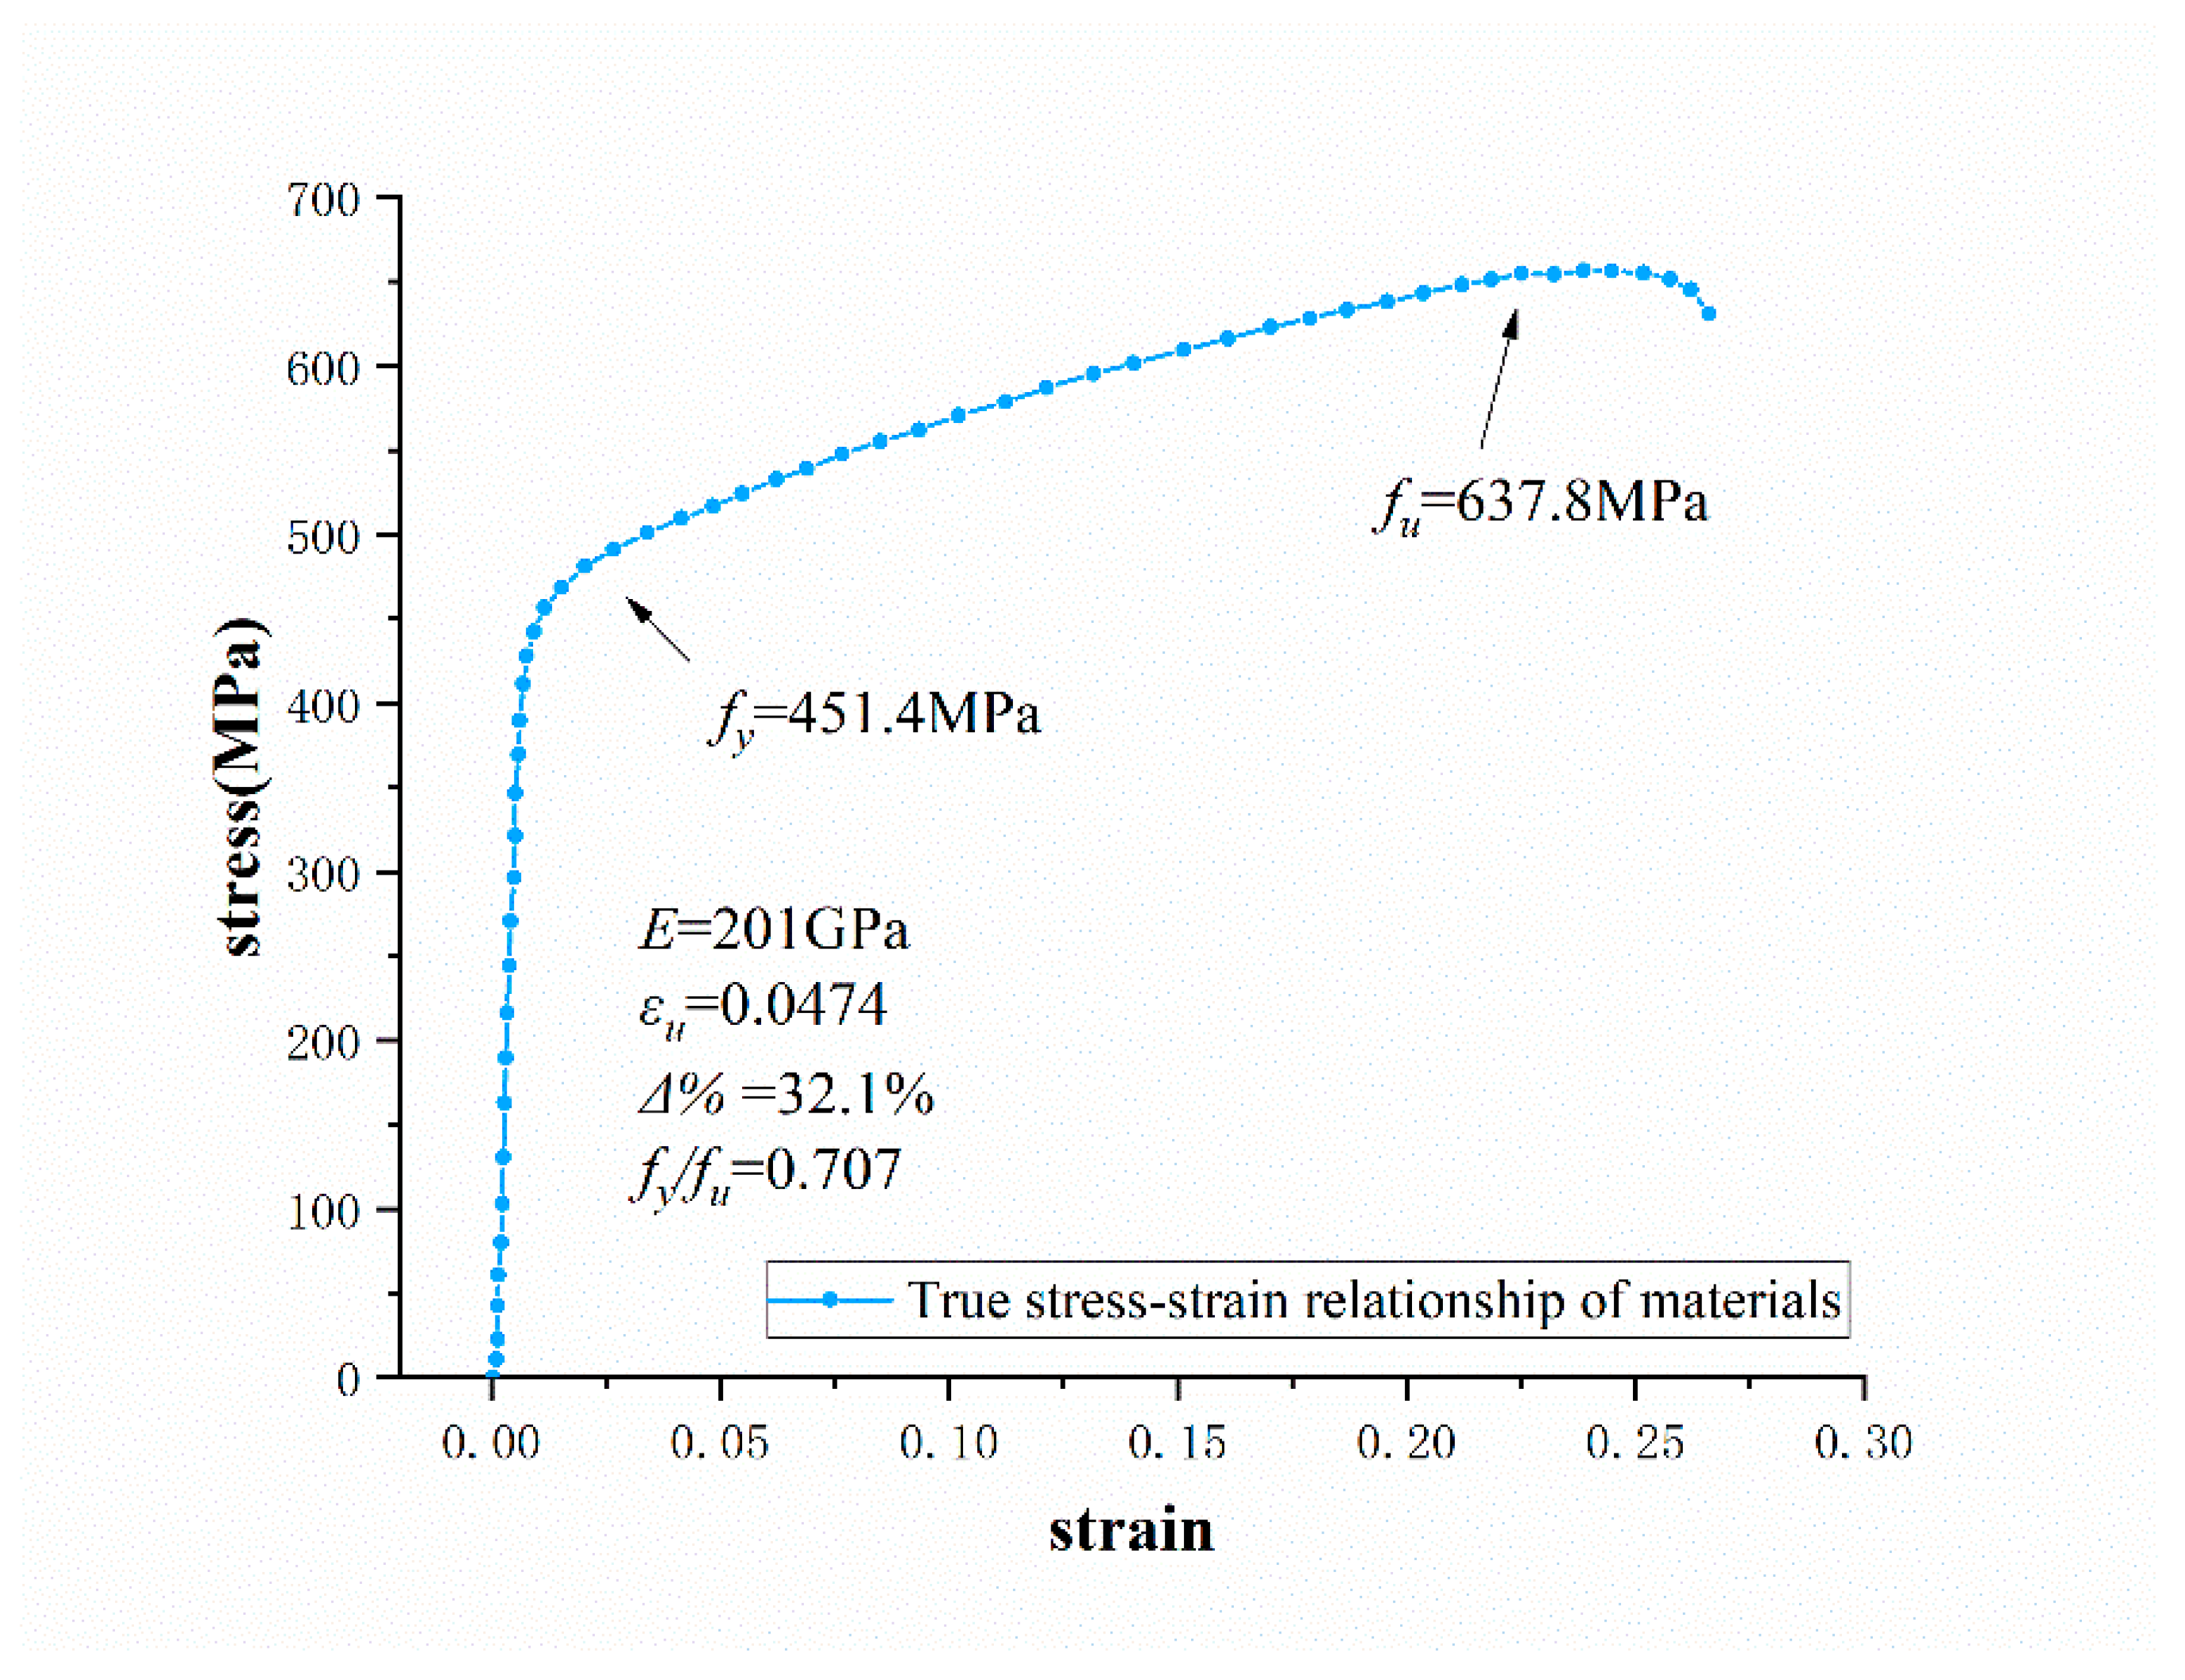
The stress–strain curve of the post-treated standard tensile test piece is shown in
Figure 8.
E is the elastic modulus of the 3D printed stainless steel 316L;
Δ% is the elongation at fracture;
is the ultimate strain;
is the yield strength and
is the ultimate tensile strength. The material constitutive model in the finite element analysis will be determined based on the true stress–strain relationship of the sample.


