Biotribology of Synovial Cartilage: A New Method for Visualization of Lubricating Film and Simultaneous Measurement of the Friction Coefficient


Abstract
:1. Introduction
2. Materials and Methods
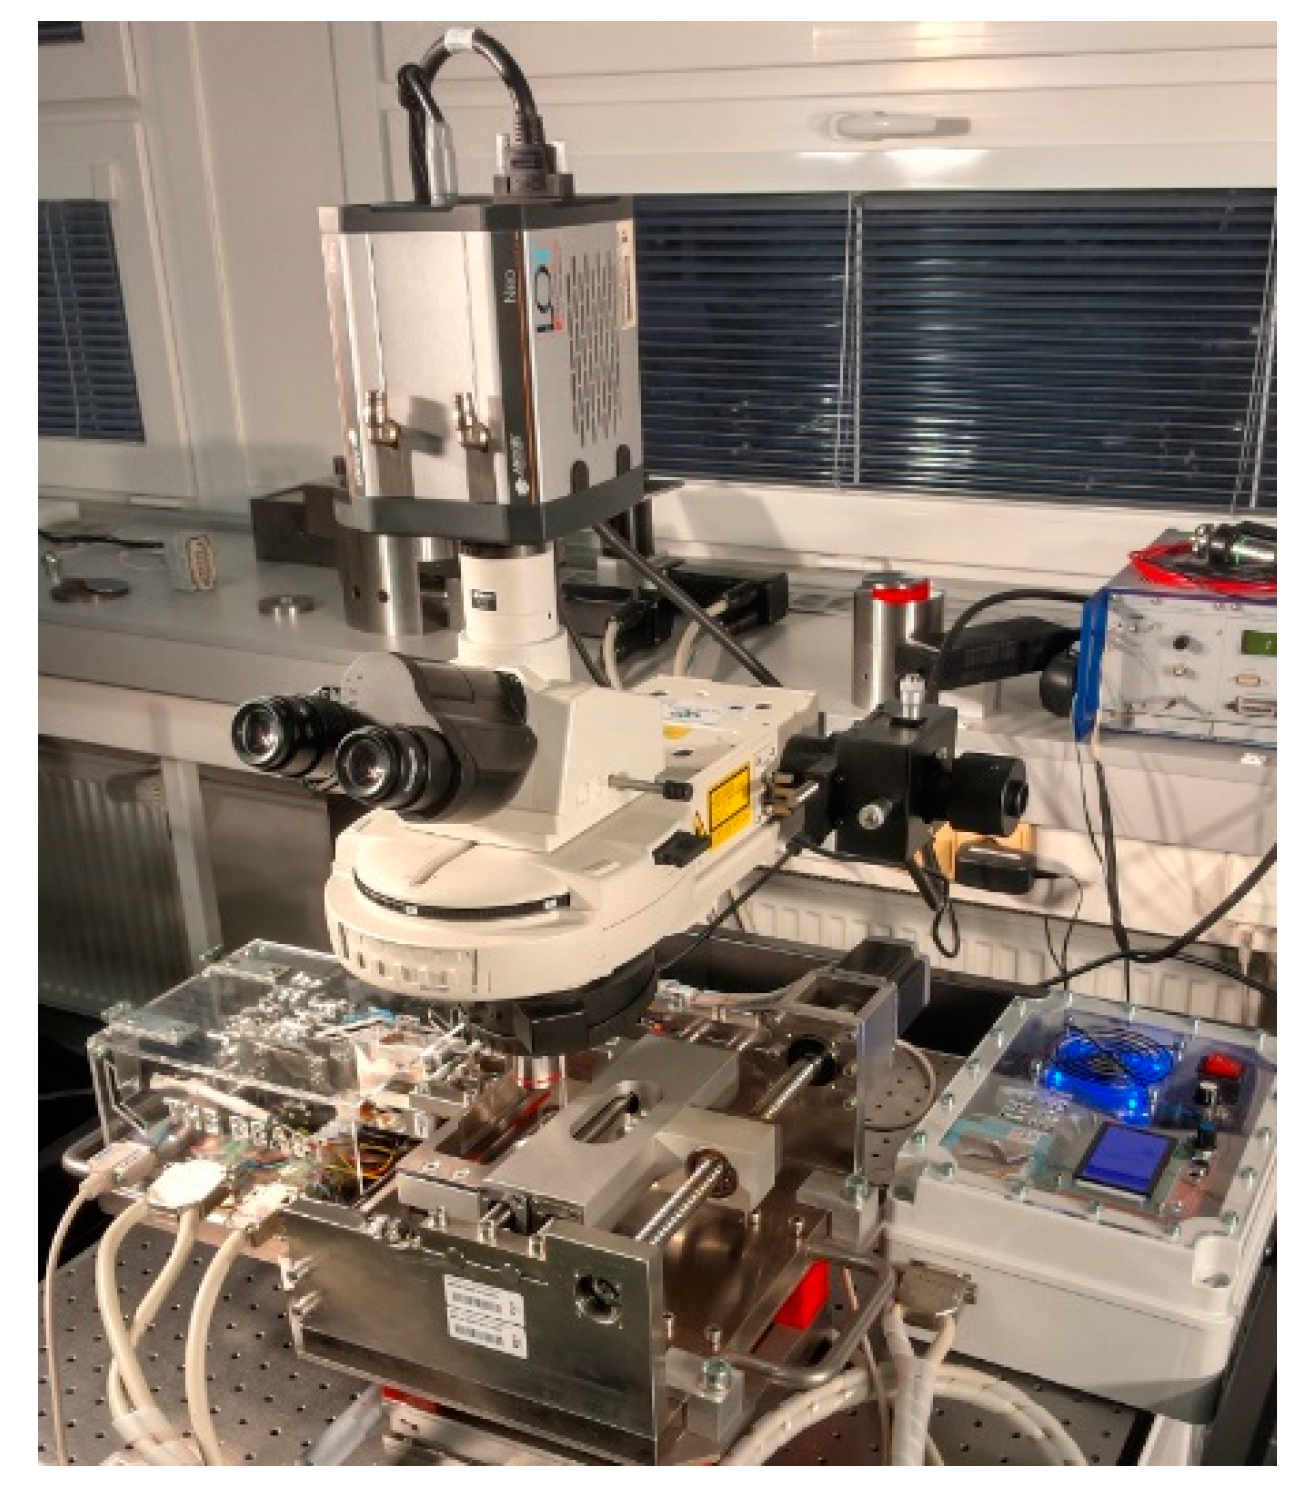
2.1. Experimental Device
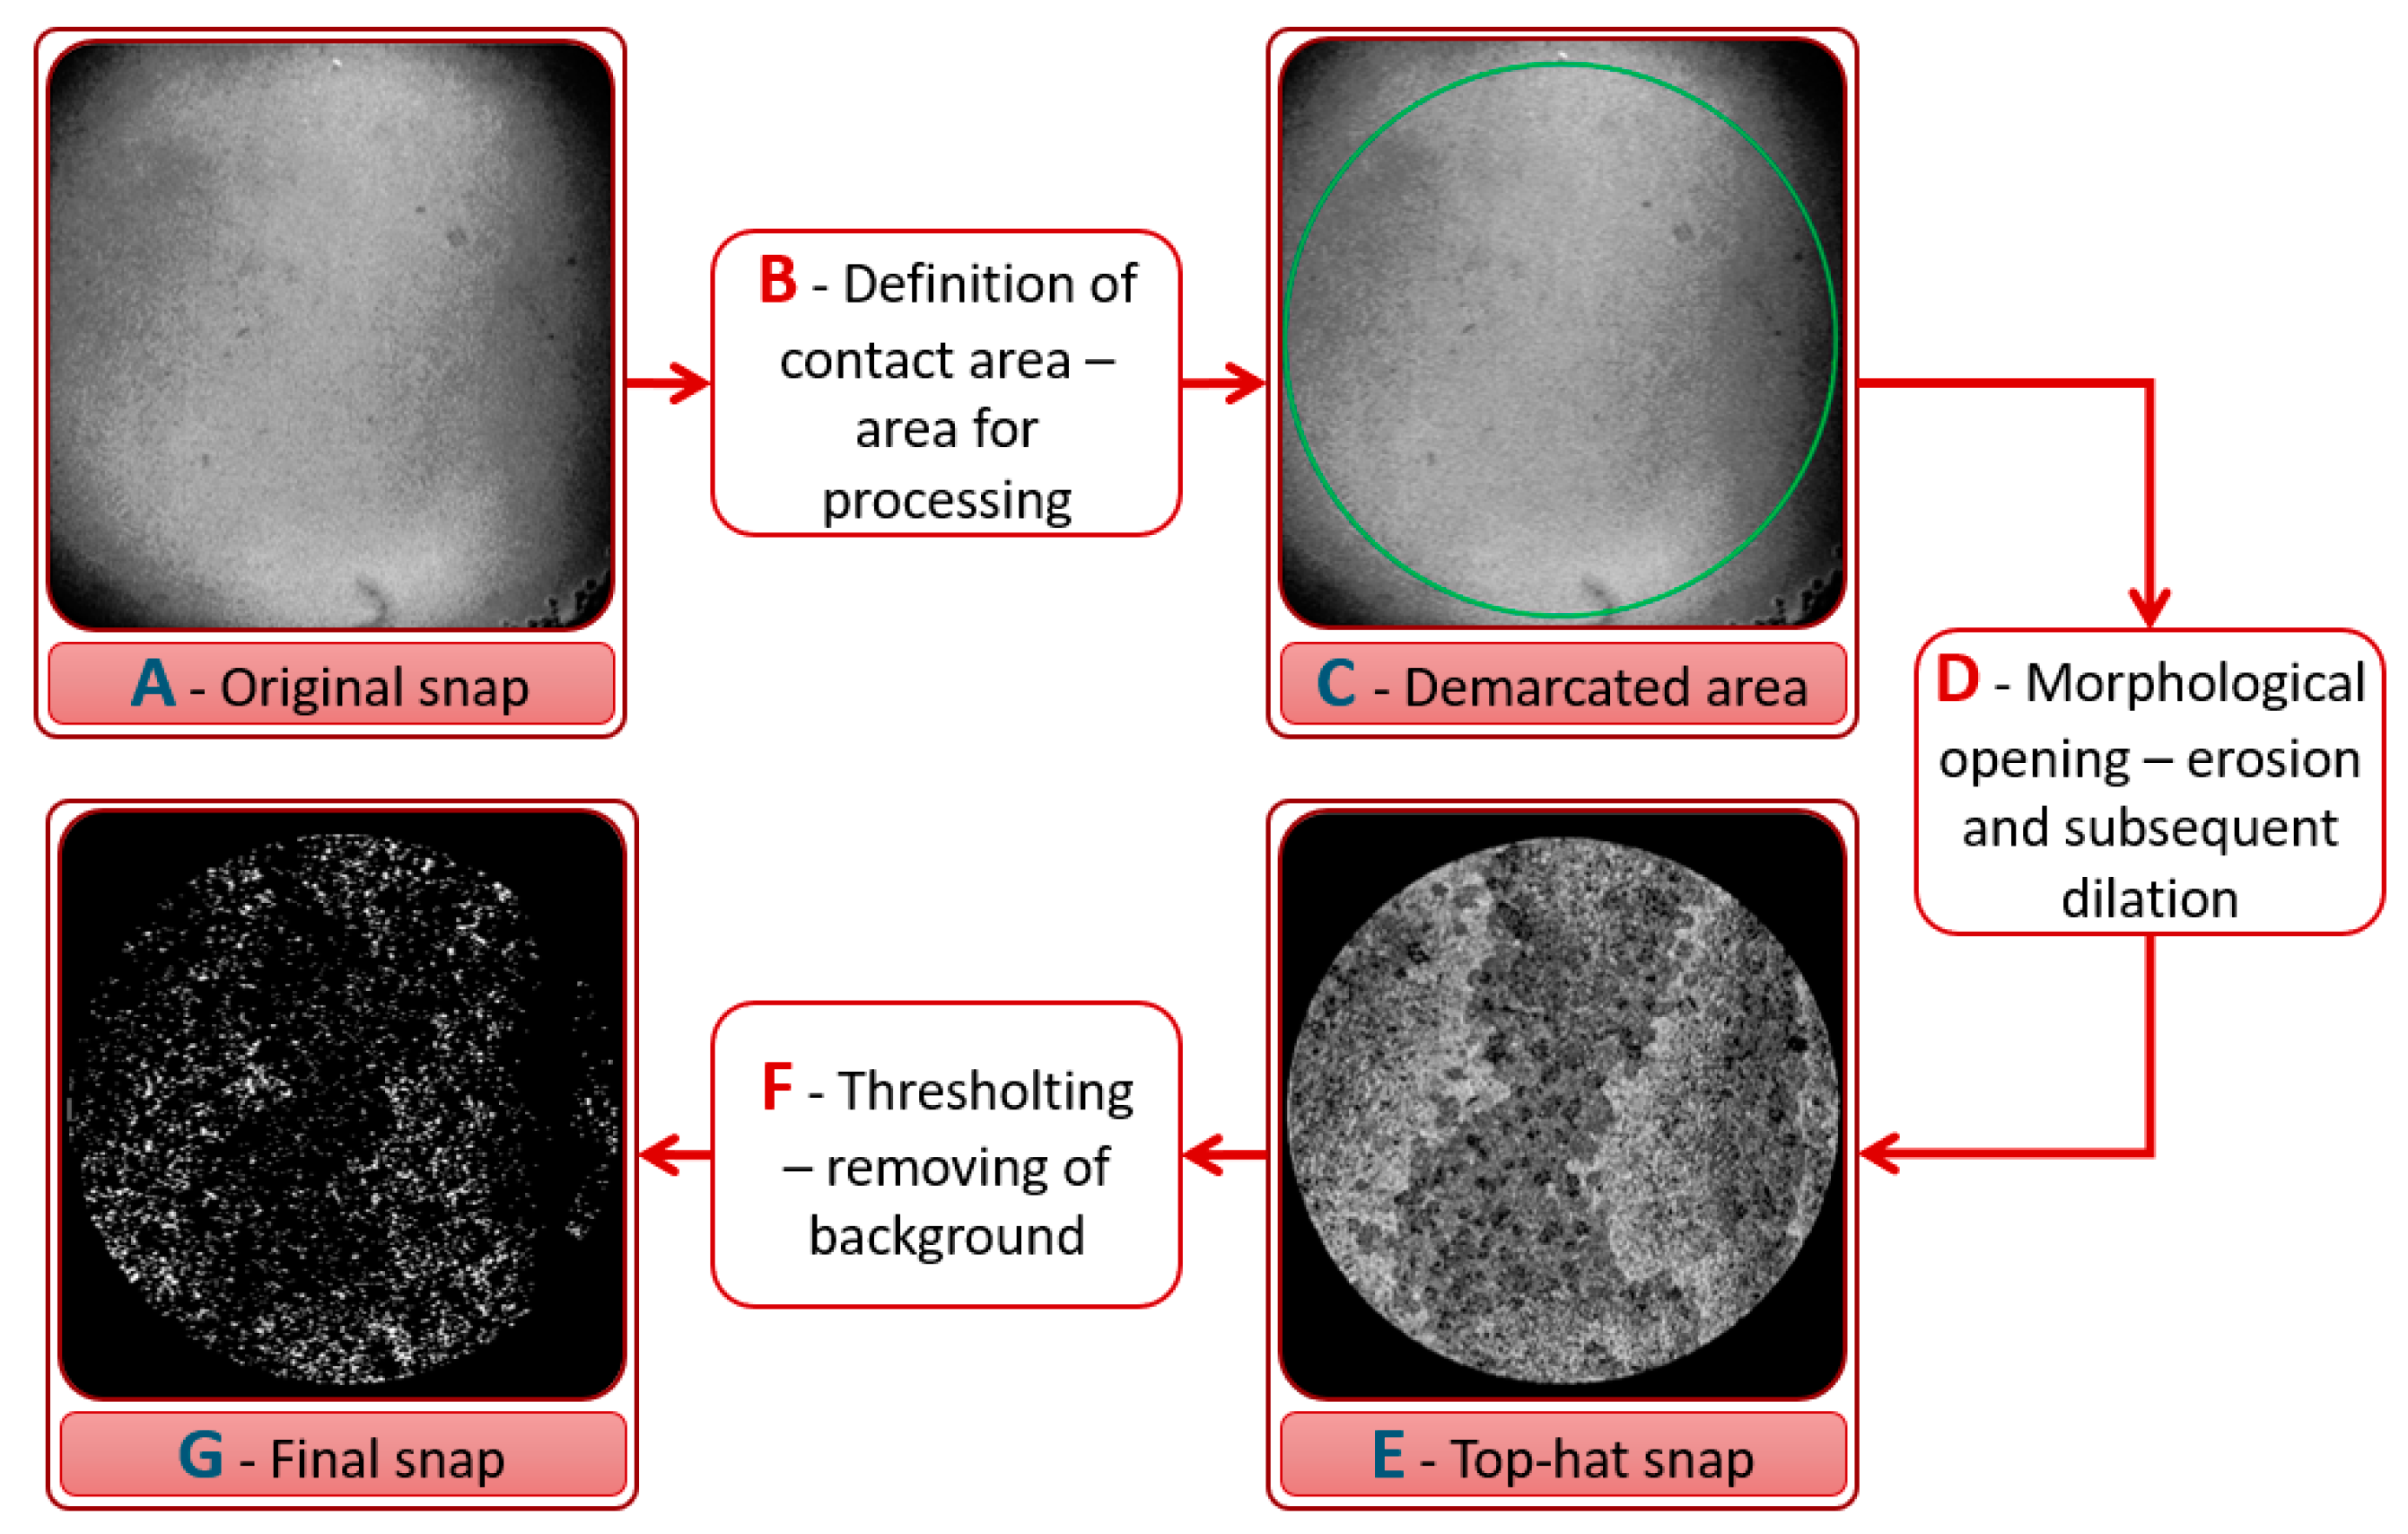
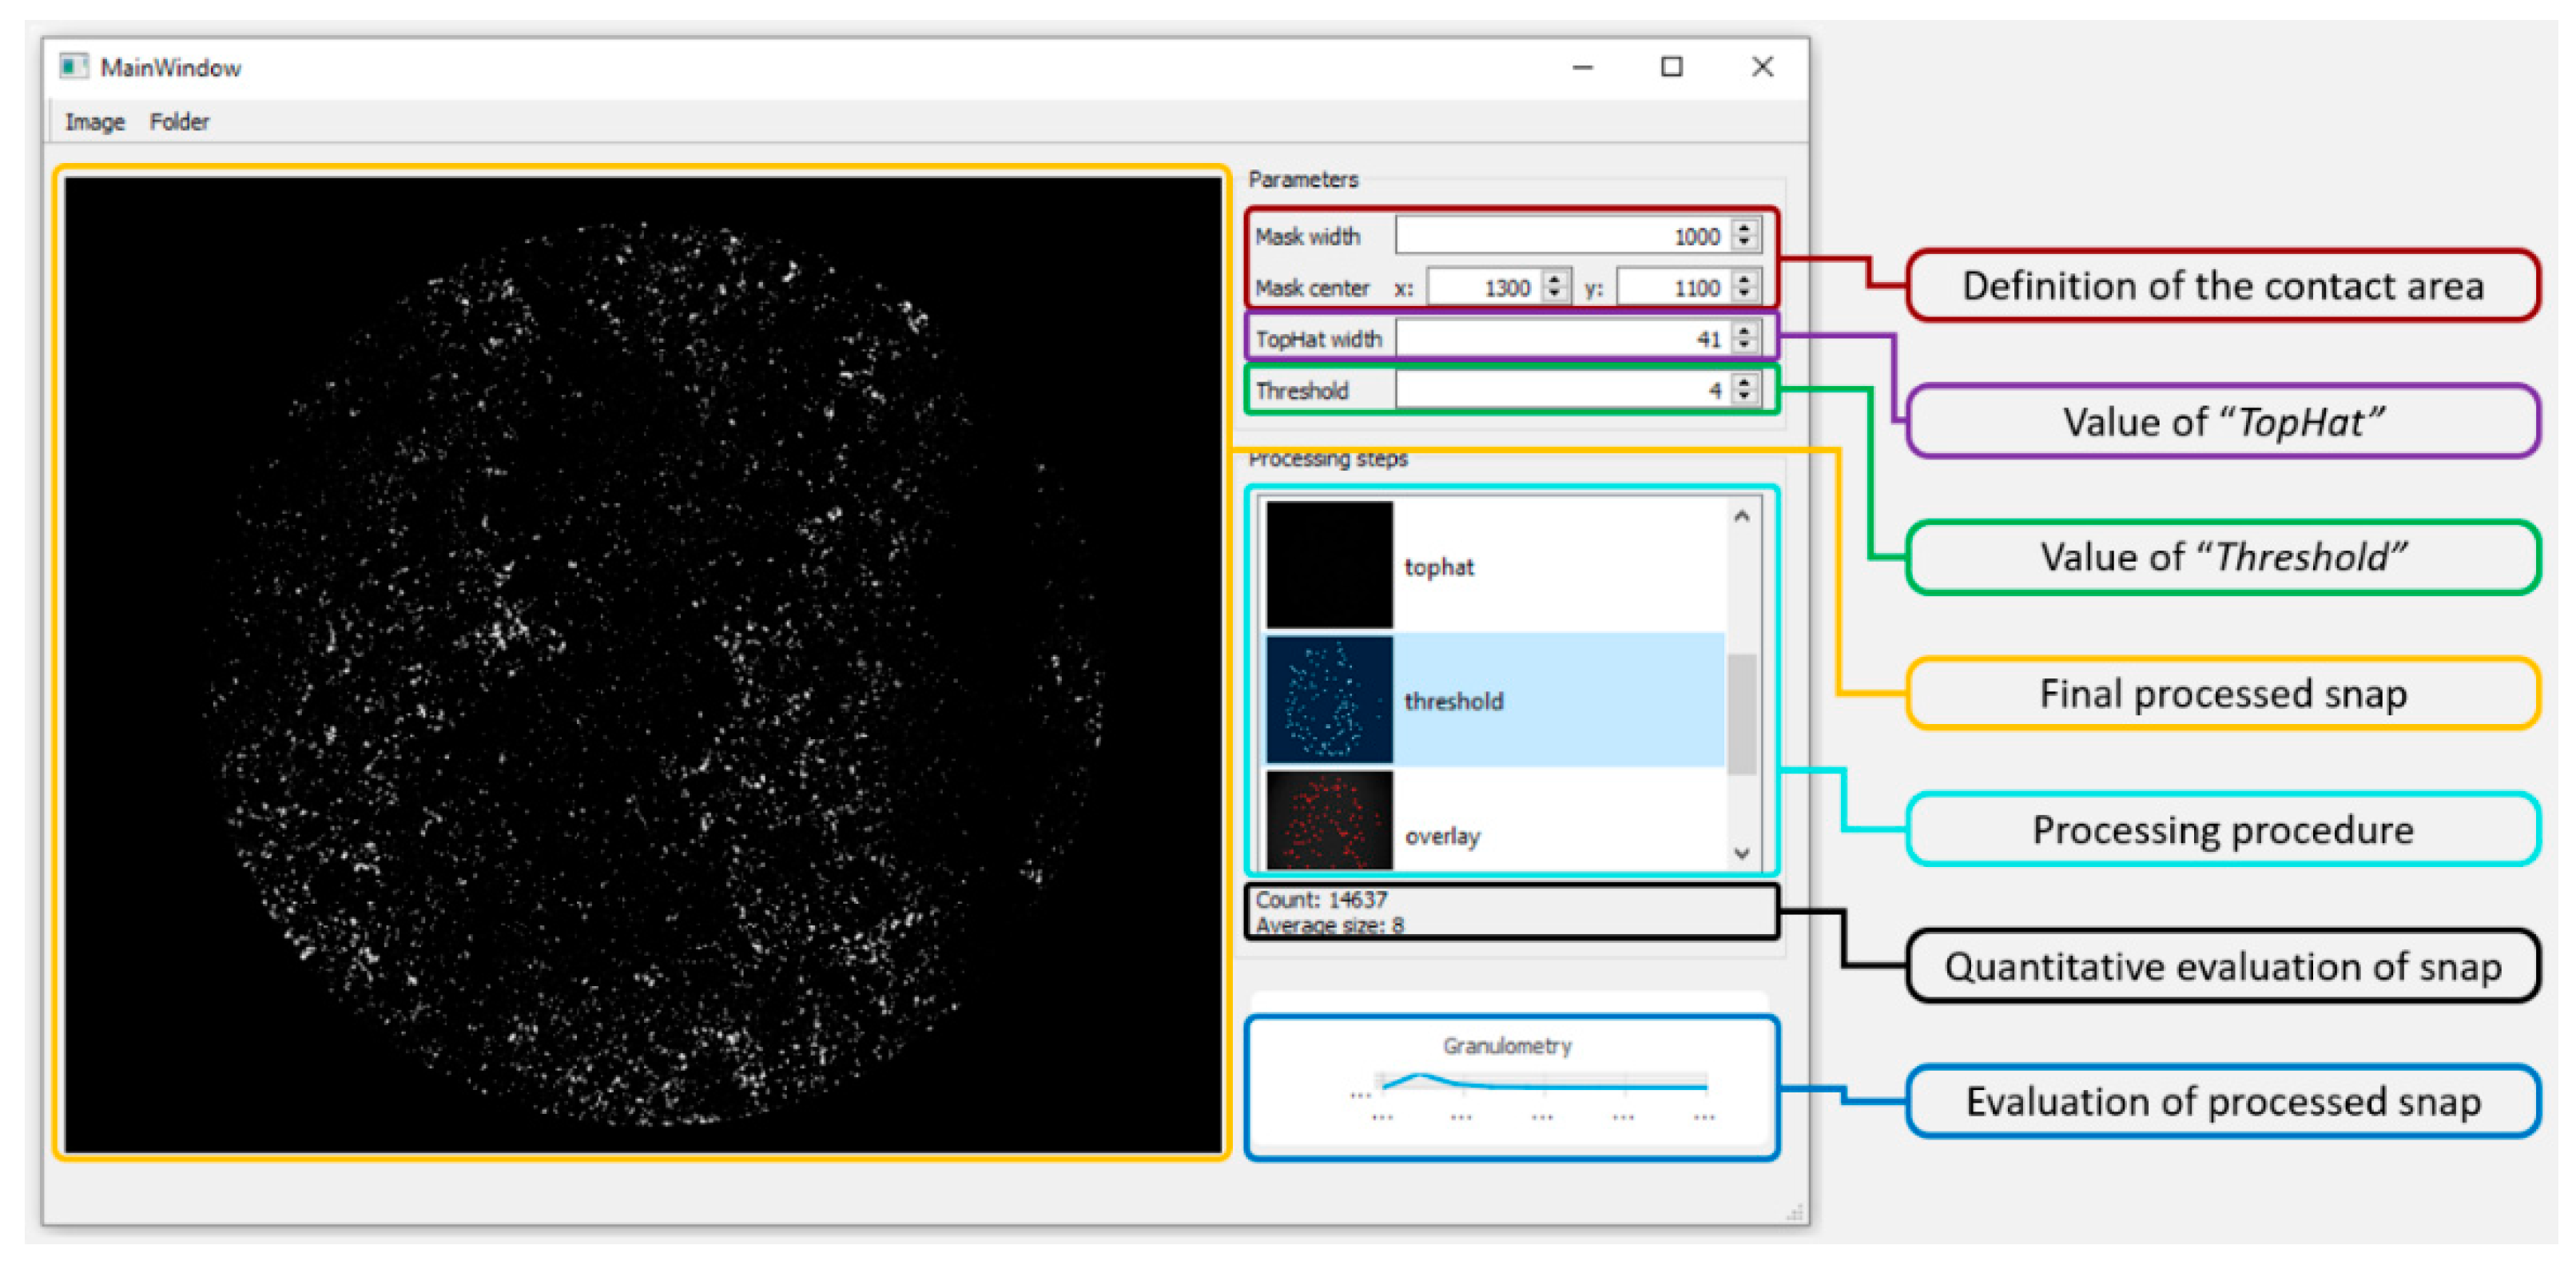
2.2. Experimental Method: Fluorescence Microscopy
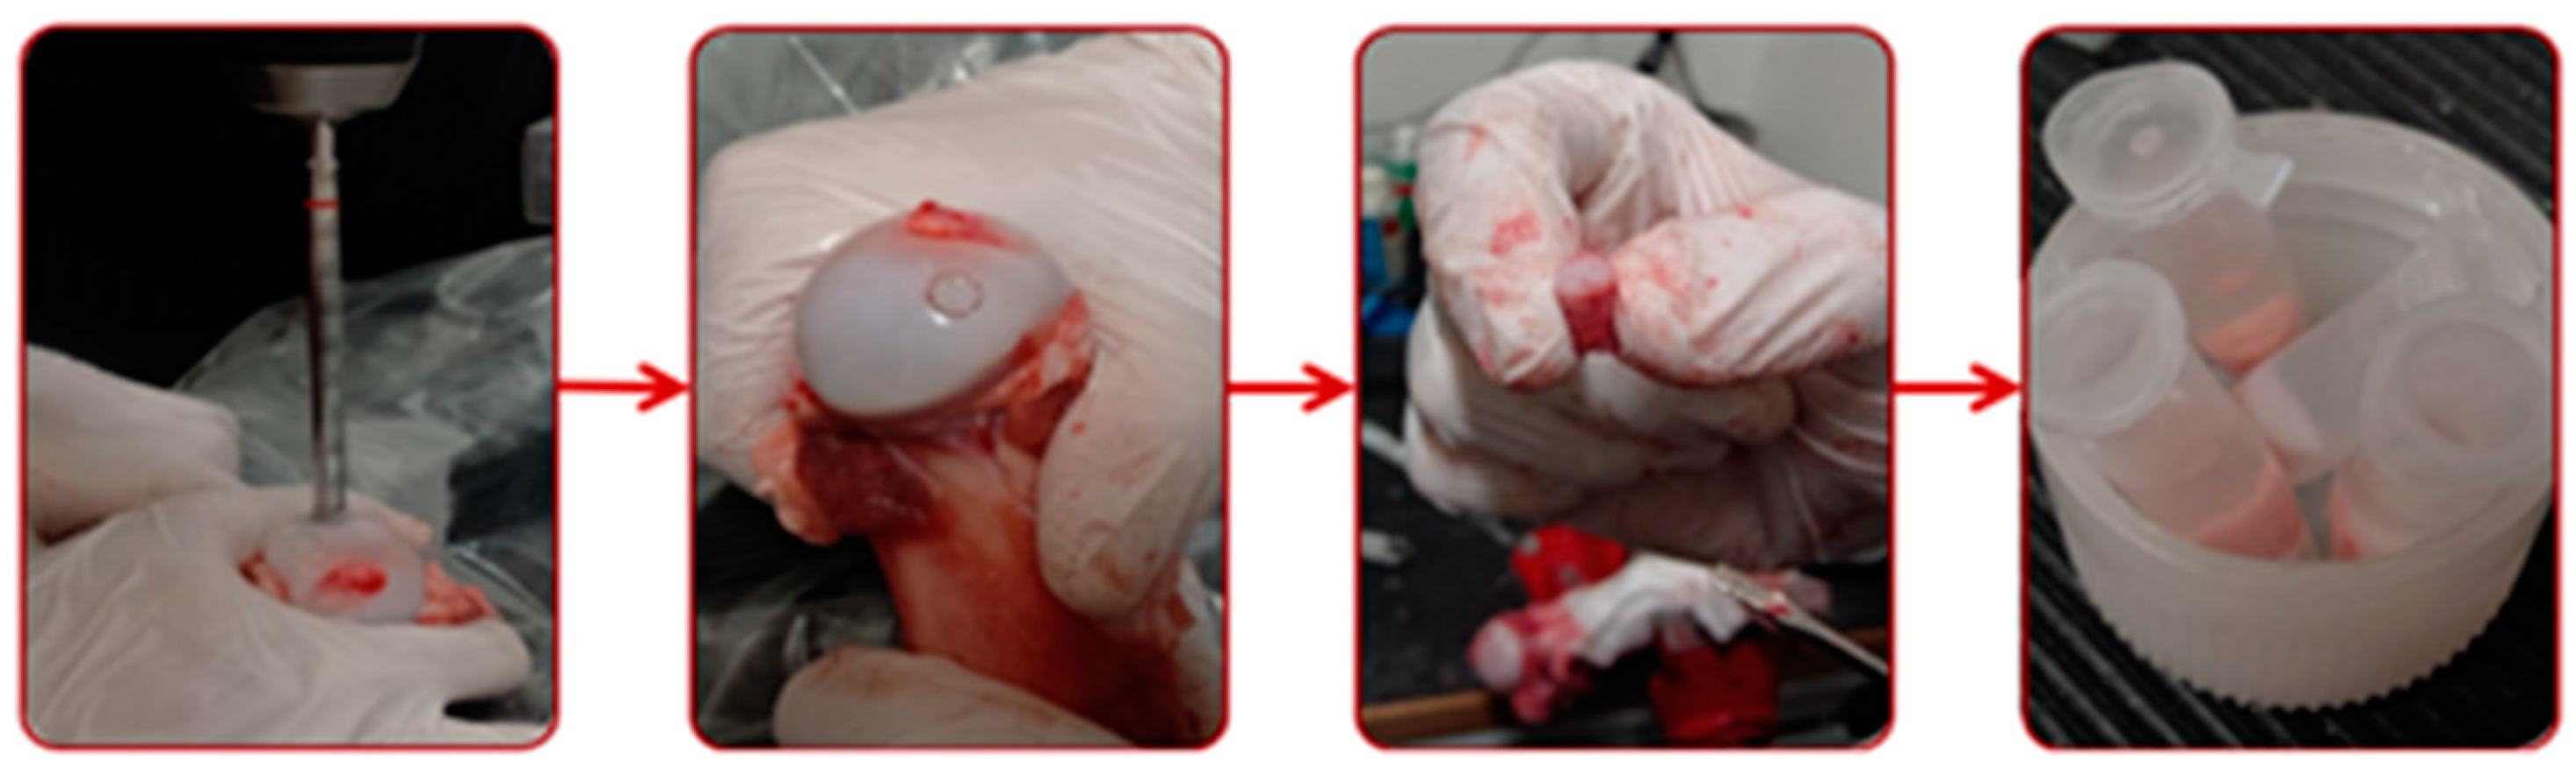
2.3. Specimens and Lubricants
2.4. Methodology and Conditions
3. Results and Discussion
3.1. Verification and Calibration of the Method
3.2. Friction and Lubrication in Cartilage Contact
3.3. Methodology and its limits
4. Conclusions
Author Contributions
Funding
Acknowledgments
Conflicts of Interest
References
- Walker-Bone, K.; Javaid, K.; Arden, N.; Cooper, C. Regular review: Medical management of osteoarthritis. BMJ 2000, 321, 936–940. [Google Scholar] [CrossRef] [PubMed]
- Pendleton, A.; Arden, N.; Dougados, M.; Doherty, M.; Bannwarth, B.; Bijlsma, J.W.J.; Cluzeau, F.; Cooper, C.; Dieppe, P.A.; Günther, K.-P.; et al. EULAR recommendations for the management of knee osteoarthritis: Report of a task force of the Standing Committee for International Clinical Studies Including Therapeutic Trials (ESCISIT). Ann. Rheum. Diseases 2000, 59, 936–944. [Google Scholar] [CrossRef] [PubMed] [Green Version]
- Lewis, G. Polyethylene wear in total hip and knee arthroplasties. J. Biomed. Mater. Res. 1997, 38, 55–75. [Google Scholar] [CrossRef]
- Kurtz, S.M.; Muratoglu, O.K.; Evans, M.; Edidin, A.A. Advances in the processing, sterilization, and crosslinking of ultra-high molecular weight polyethylene for total joint arthroplasty. Biomaterials 1999, 20, 1659–1688. [Google Scholar] [CrossRef]
- Schmalzried, T.P.; Kwong, L.M.; Jasty, M.; Sedlacek, R.C.; Haire, T.C.; O’Connor, D.O.; Bragdon, C.R.; Kabo, J.M.; Malcolm, A.J.; Harris, W.H. The mechanism of loosening of cemented acetabular components in total hip arthroplasty. Analysis of specimens retrieved at autopsy. Clin. Orthop. Relat. Res. 1992, 274, 60–78. [Google Scholar]
- Piconi, C.; Maccauro, G.; Muratori, F.; Del Prever, E.B. Alumina and Zirconia Ceramics in Joint Replacements. J. Appl. Biomater. Biomech. 2003, 1, 19–32. [Google Scholar]
- Balazs, E.A.; Denlinger, J.L. Viscosupplementation: A new concept in the treatment of osteoarthritis. J. Rheumatol. 1993, 39, 3–9. [Google Scholar]
- Laurent, C. Biology and Medical Applications of Hyaluronan and Its Derivatives. Wenner Gren Symp. Ser. 1998, 72, 3. [Google Scholar]
- Weiss, C.; Band, P. Basic principles underlying the development of viscosupplementation for the treatment of osteoarthritis. JCR J. Clin. Rheumatol. 1999, 5.6, S2–S11. [Google Scholar]
- Rutjes, A.W.S.; Jüni, P.; da Costa, B.R.; Trelle, S.; Nüesch, E.; Reichenbach, S. Viscosupplementation for Osteoarthritis of the Knee. Ann. Int. Med. 2012, 157, 180–191. [Google Scholar] [CrossRef]
- Jevsevar, D.; Donnelly, P.; Brown, G.A.; Cummins, D.S. Viscosupplementation for Osteoarthritis of the Knee. J. Bone Joint Surg. Am. Vol. 2015, 97, 2047–2060. [Google Scholar] [CrossRef]
- Bannuru, R.R.; Vaysbrot, E.E.; Sullivan, M.C.; McAlindon, T.E. Relative efficacy of hyaluronic acid in comparison with NSAIDs for knee osteoarthritis: A systematic review and meta-analysis. Semin. Arthr. Rheum. 2014, 43, 593–599. [Google Scholar] [CrossRef]
- Arrich, J.; Piribauer, F.; Mad, P.; Schmid, D.; Klaushofer, K.; Müllner, M. Intra-articular hyaluronic acid for the treatment of osteoarthritis of the knee: Systematic review and meta-analysis. Can. Med. Assoc. J. 2005, 172, 1039–1043. [Google Scholar] [CrossRef] [Green Version]
- Jahn, S.; Seror, J.; Klein, J. Lubrication of Articular Cartilage. Ann. Rev. Biomed. Eng. 2016, 18, 235–258. [Google Scholar] [CrossRef]
- Wright, V.; Dowson, D. Lubrication and cartilage. J. Anat. 1976, 121, 107–118. [Google Scholar]
- Eleswarapu, S.V.; Leipzig, N.D.; Athanasiou, K.A. Gene expression of single articular chondrocytes. Cell Tissue Res. 2006, 327, 43–54. [Google Scholar] [CrossRef]
- Almarza, A.J.; Athanasiou, K.A. Design Characteristics for the Tissue Engineering of Cartilaginous Tissues. Ann. Biomed.Eng. 2004, 32, 2–17. [Google Scholar] [CrossRef]
- Knobloch, T.J.; Madhavan, S.; Nam, J.; Agarwal, S., Jr.; Agarwal, S. Regulation of Chondrocytic Gene Expression by Biomechanical Signals. Crit. Rev. Eukaryot. Gene Expr. 2008, 18, 139–150. [Google Scholar] [CrossRef] [Green Version]
- Mow, V.C.; Ratcliffe, A.; Robin Poole, A. Cartilage and diarthrodial joints as paradigms for hierarchical materials and structures. Biomaterials 1992, 13, 67–97. [Google Scholar] [CrossRef]
- Fitzgerald, J.B.; Jin, M.; Grodzinsky, A.J. Shear and Compression Differentially Regulate Clusters of Functionally Related Temporal Transcription Patterns in Cartilage Tissue. J. Biological Chem. 2006, 281, 24095–24103. [Google Scholar] [CrossRef] [Green Version]
- Dunn, W.; DuRaine, G.; Reddi, A.H. Profiling microRNA expression in bovine articular cartilage and implications for mechanotransduction. Arthr. Rheum. 2009, 60, 2333–2339. [Google Scholar] [CrossRef]
- Becerra, J.; Andrades, J.A.; Guerado, E.; Zamora-Navas, P.; López-Puertas, J.M.; Reddi, A.H. Articular Cartilage: Structure and Regeneration. Tissue Eng. Part B Rev. 2010, 16, 617–627. [Google Scholar] [CrossRef]
- Quinn, T.M.; Hunziker, E.B.; Häuselmann, H.-J. Variation of cell and matrix morphologies in articular cartilage among locations in the adult human knee. Osteoarthr. Cartil. 2005, 13, 672–678. [Google Scholar] [CrossRef] [Green Version]
- Darling, E.M.; Athanasiou, K.A. Rapid phenotypic changes in passaged articular chondrocyte subpopulations. J. Orthop. Res. 2005, 23, 425–432. [Google Scholar] [CrossRef]
- Blewis, M.E.; Nugent-Derfus, G.E.; Schmidt, T.A.; Schumacher, B.L.; Sah, R.L. A model of synovial fluid lubricant composition in normal and injured joints. Eur. Cells Mater. 2007, 13, 26–39. [Google Scholar] [CrossRef]
- Swann, D.A.; Silver, F.H.; Slayter, H.S.; Stafford, W.; Shore, E. The molecular structure and lubricating activity of lubricin isolated from bovine and human synovial fluids. Biochem. J. 1985, 225, 195–201. [Google Scholar] [CrossRef]
- Schmid, T.M.; Su, J.-L.; Lindley, K.M.; Soloveychik, V.; Madsen, L.; Block, J.A.; Kuettner, K.E.; Schumacher, B.L. Superficial zone protein (SZP) is an abundant glycoprotein in human synovial fluid with lubricating properties. In The Many Faces of Osteoarthritis; Birkhäuser Basel: Basel, Switzerland, 2002; pp. 159–161. ISBN 978-3-0348-9450-0. [Google Scholar]
- Ogston, A.G.; Stanier, J.E. The physiological function of hyaluronic acid in synovial fluid; viscous, elastic and lubricant properties. J. Physiol. 1953, 119, 244–252. [Google Scholar] [CrossRef]
- Schwarz, I.M.; Hills, B.A. Surface-active phospholipid as the lubricating component of lubricin. Rheumatology 1998, 37, 21–26. [Google Scholar] [CrossRef] [Green Version]
- Athanasiou, K.A.; Rosenwasser, M.P.; Buckwalter, J.A.; Malinin, T.I.; Mow, V.C. Interspecies comparisons of in situ intrinsic mechanical properties of distal femoral cartilage. J. Orthop. Res. 1991, 9, 330–340. [Google Scholar] [CrossRef]
- Nečas, D.; Vrbka, M.; Urban, F.; Křupka, I.; Hartl, M. The effect of lubricant constituents on lubrication mechanisms in hip joint replacements. J. Mech. Behav. Biomed. Mater. 2016, 55, 295–307. [Google Scholar] [CrossRef]
- Nečas, D.; Vrbka, M.; Galandáková, A.; Křupka, I.; Hartl, M. On the observation of lubrication mechanisms within hip joint replacements. Part I: Hard-on-soft bearing pairs. J. Mech. Behav. Biomed. Mater. 2019, 89, 237–248. [Google Scholar] [CrossRef] [PubMed]
- Qin, L.; Feng, X.; Hafezi, M.; Zhang, Y.; Guo, J.; Dong, G.; Qin, Y. Investigating the tribological and biological performance of covalently grafted chitosan coatings on Co–Cr–Mo alloy. Tribol. Int. 2018, 127, 302–312. [Google Scholar] [CrossRef]
- Rennie, A.C.; Dickrell, P.L.; Sawyer, W.G. Friction coefficient of soft contact lenses: Measurements and modeling. Tribol. Lett. 2005, 18, 499–504. [Google Scholar] [CrossRef]
- Yarimitsu, S.; Nakashima, K.; Sawae, Y.; Murakami, T. Influences of lubricant composition on forming boundary film composed of synovia constituents. Tribol. Int. 2009, 42, 1615–1623. [Google Scholar] [CrossRef]
- Khan, I.M.; Francis, L.; Theobald, P.S.; Perni, S.; Young, R.D.; Prokopovich, P.; Conlan, R.S.; Archer, C.W. In vitro growth factor-induced bio engineering of mature articular cartilage. Biomaterials 2013, 34, 1478–1487. [Google Scholar] [CrossRef] [Green Version]
- Anat, J. The Function of Intra-Articular Fibrocartilages, with Special Reference to the Knee and Inferior Radio-Ulnar Joints. J. Anat. 1932, 66, 210–227. [Google Scholar]
- Teeple, E.; Elsaid, K.A.; Fleming, B.C.; Jay, G.D.; Aslani, K.; Crisco, J.J.; Mechrefe, A.P. Coefficients of friction, lubricin, and cartilage damage in the anterior cruciate ligament-deficient guinea pig knee. J. Orthop. Res. 2008, 26, 231–237. [Google Scholar] [CrossRef] [Green Version]
- Hills, B.A. Oligolamellar lubrication of joints by surface active phospholipid. J. Rheumatol. 1989, 16, 82–91. [Google Scholar]
- Radin, E.L.; Swann, D.A.; Weisser, P.A. Separation of a Hyaluronate-free Lubricating Fraction from Synovial Fluid. Nature 1970, 228, 377–378. [Google Scholar] [CrossRef]
- Swann, D.A.; Bloch, K.J.; Swindell, D.; Shore, E. The lubricating activity of human synovial fluids. Arthr. Rheum. 1984, 27, 552–556. [Google Scholar] [CrossRef]
- McCutchen, C.W. The frictional properties of animal joints. Wear 1962, 5, 1–17. [Google Scholar] [CrossRef]
- McCutchen, C.W. Mechanism of Animal Joints: Sponge-hydrostatic and Weeping Bearings. Nature 1959, 184, 1284–1285. [Google Scholar] [CrossRef]
- Ikeuchi, K. Origin and future of hydration lubrication. Proc. Inst. Mech. Eng. J. Eng. Tribol. 2007, 221, 301–305. [Google Scholar] [CrossRef]
- Klein, J. Hydration lubrication. Friction 2013, 1, 1–23. [Google Scholar] [CrossRef] [Green Version]
- Murakami, T.; Higaki, H.; Sawae, Y.; Ohtsuki, N.; Moriyama, S.; Nakanishi, Y. Adaptive multimode lubrication in natural synovial joints and artificial joints. Proc. Inst. Mech. Eng. Part H J. Eng. Med. 2006, 212, 23–35. [Google Scholar] [CrossRef] [PubMed]
- Murakami, T. Importance of adaptive multimode lubrication mechanism in natural and artificial joints. Proc. Inst. Mech. Eng. J. Eng. Tribol. 2012, 226, 827–837. [Google Scholar] [CrossRef]
- Murakami, T.; Yarimitsu, S.; Sakai, N.; Nakashima, K.; Yamaguchi, T.; Sawae, Y. Importance of adaptive multimode lubrication mechanism in natural synovial joints. Tribol. Int. 2017, 113, 306–315. [Google Scholar] [CrossRef]
- Forsey, R.W.; Fisher, J.; Thompson, J.; Stone, M.H.; Bell, C.; Ingham, E. The effect of hyaluronic acid and phospholipid based lubricants on friction within a human cartilage damage model. Biomaterials 2006, 27, 4581–4590. [Google Scholar] [CrossRef]
- Wu, T.; Gan, X.-Q.; Cai, Z.-B.; Zhu, M.-H.; Qiao, M.-T.; Yu, H.-Y. The lubrication effect of hyaluronic acid and chondroitin sulfate on the natural temporomandibular cartilage under torsional fretting wear. Lubr. Sci. 2015, 27, 29–44. [Google Scholar] [CrossRef]
- Merkher, Y.; Sivan, S.; Etsion, I.; Maroudas, A.; Halperin, G.; Yosef, A. A rational human joint friction test using a human cartilage-on-cartilage arrangement. Tribol. Lett. 2006, 22, 29–36. [Google Scholar] [CrossRef]
- Caligaris, M.; Ateshian, G.A. Effects of sustained interstitial fluid pressurization under migrating contact area, and boundary lubrication by synovial fluid, on cartilage friction. Osteoarthr. Cartil. 2008, 16, 1220–1227. [Google Scholar] [CrossRef] [PubMed] [Green Version]
- Cilingir, A.C. Effect of rotational and sliding motions on friction and degeneration of articular cartilage under dry and wet friction. J. Bionic Eng. 2015, 12, 464–472. [Google Scholar] [CrossRef]
- Li, F.; Wang, A.; Wang, C. Analysis of friction between articular cartilage and polyvinyl alcohol hydrogel artificial cartilage. J. Mater. Sci. Mater. Med. 2016, 27, 87. [Google Scholar] [CrossRef] [PubMed]
- Furmann, D.; Nečas, D.; Rebenda, D.; Čípek, P.; Vrbka, M.; Křupka, I.; Hartl, M. The Effect of Synovial Fluid Composition, Speed and Load on Frictional Behaviour of Articular Cartilage. Materials 2020, 13, 1334. [Google Scholar] [CrossRef] [PubMed] [Green Version]
- Stachowiak, G.W.; Batchelor, A.W.; Griffiths, L.J. Friction and wear changes in synovial joints. Wear 1994, 171, 135–142. [Google Scholar] [CrossRef]
- McCann, L.; Udofia, I.; Graindorge, S.; Ingham, E.; Jin, Z.; Fisher, J. Tribological testing of articular cartilage of the medial compartment of the knee using a friction simulator. Tribol. Int. 2008, 41, 1126–1133. [Google Scholar] [CrossRef]
- Katta, J.; Jin, Z.; Ingham, E.; Fisher, J. Effect of nominal stress on the long term friction, deformation and wear of native and glycosaminoglycan deficient articular cartilage. Osteoarthr. Cartil. 2009, 17, 662–668. [Google Scholar] [CrossRef] [Green Version]
- Chan, S.M.T.; Neu, C.P.; Komvopoulos, K.; Reddi, A.H. The role of lubricant entrapment at biological interfaces: Reduction of friction and adhesion in articular cartilage. J. Biomech. 2011, 44, 2015–2020. [Google Scholar] [CrossRef]
- Moore, A.C.; Burris, D.L. New Insights Into Joint Lubrication. Tribol. Lubr. Technol. 2016, 72, 26–30. [Google Scholar]
- Čípek, P.; Rebenda, D.; Nečas, D.; Vrbka, M.; Křupka, I.; Hartl, M. Visualization of Lubrication Film in Model of Synovial Joint. Tribol. Ind. 2019, 41, 387–393. [Google Scholar] [CrossRef]
- Čípek, P.; Rebenda, D.; Nečas, D.; Vrbka, M.; Křupka, I. Development of reciprocating tribometer for testing synovial joint. In Proceedings of the Engineering Mechanics, Svratka, Czech Republic, 14–17 May 2018; pp. 169–172. [Google Scholar]
- Lakowicz, J.R. Principles of Fluorescence Spectroscopy, 3rd ed.; Springer: New York, NY, USA, 2006; ISBN 978-0387-31278-1. [Google Scholar]
- Northwood, E.; Fisher, J. A multi-directional in vitro investigation into friction, damage and wear of innovative chondroplasty materials against articular cartilage. Clin. Biomech. 2007, 22, 834–842. [Google Scholar] [CrossRef] [PubMed]
- Pickard, J.E.; Fisher, J.; Ingham, E.; Egan, J. Investigation into the effects of proteins and lipids on the frictional properties of articular cartilage. Biomaterials 1998, 19, 1807–1812. [Google Scholar] [CrossRef]
- Hodge, W.A.; Fijan, R.S.; Carlson, K.L.; Burgess, R.G.; Harris, W.H.; Mann, R.W. Contact pressures in the human hip joint measured in vivo. Proc. Natl. Acad. Sci. USA 1986, 83, 2879–2883. [Google Scholar] [CrossRef] [PubMed] [Green Version]
- Mow, V.C.; Kuei, S.C.; Lai, W.M.; Armstrong, C.G. Biphasic Creep and Stress Relaxation of Articular Cartilage in Compression: Theory and Experiments. J. Biomech. Eng. 1980, 102, 73–84. [Google Scholar] [CrossRef] [PubMed]
- Vala, H.J.; Baxi, A. A review on Otsu image segmentation algorithm. Int. J. Adv. Res. Comput. Eng. Technol. 2013, 2, 387–389. [Google Scholar]
- Acharya, T.; Ray, A.K. Image Processing: Principles and Applications; John Wiley: Hoboken, NJ, USA, 2005; ISBN 978-0-471-71998-4. [Google Scholar]
- Vincent, L. Morphological Area Openings and Closings for Grey-scale Images. In Shape in Picture; Springer: Berlin/Heidelberg, Germany, 1994; pp. 197–208. ISBN 978–3-642-08188-0. [Google Scholar]
- Greene, G.W.; Zappone, B.; Zhao, B.; Söderman, O.; Topgaard, D.; Rata, G.; Israelachvili, J.N. Changes in pore morphology and fluid transport in compressed articular cartilage and the implications for joint lubrication. Biomaterials 2008, 29, 4455–4462. [Google Scholar] [CrossRef]
- McNary, S.M.; Athanasiou, K.A.; Reddi, A.H. Engineering Lubrication in Articular Cartilage. Tissue Eng. Part B Rev. 2012, 18, 88–100. [Google Scholar] [CrossRef] [Green Version]
- Chan, S.M.T.; Neu, C.P.; DuRaine, G.; Komvopoulos, K.; Reddi, A.H. Tribological altruism: A sacrificial layer mechanism of synovial joint lubrication in articular cartilage. J. Biomech. 2012, 45, 2426–2431. [Google Scholar] [CrossRef]
- Chan, S.M.T.; Neu, C.P.; DuRaine, G.; Komvopoulos, K.; Reddi, A.H. Atomic force microscope investigation of the boundary-lubricant layer in articular cartilage. Osteoarth. Cartil. 2010, 18, 956–963. [Google Scholar] [CrossRef] [Green Version]
- Karran, E.H.; Young, T.J.; Markwell, R.E.; Harper, G.P. In vivo model of cartilage degradation—Effects of a matrix metalloproteinase inhibitor. Ann. Rheum. Diseases 1995, 54, 662–669. [Google Scholar] [CrossRef] [Green Version]
- Ramsey, D.K.; Wretenberg, P.F. Biomechanics of the knee: Methodological considerations in the in vivo kinematic analysis of the tibiofemoral and patellofemoral joint. Clin. Biomech. 1999, 14, 595–611. [Google Scholar] [CrossRef]
- Sahara, W.; Sugamoto, K.; Murai, M.; Tanaka, H.; Yoshikawa, H. 3D kinematic analysis of the acromioclavicular joint during arm abduction using vertically open MRI. J. Orthop. Res. 2006, 24, 1823–1831. [Google Scholar] [CrossRef] [PubMed]


| Lubricant | Albumin (mg/mL) | ϒ-globulin (mg/mL) | HA (mg/mL) | Labelled Component |
|---|---|---|---|---|
| Model Synovial Fluid 1 | 20 | 3.6 | 2.5 | Albumin |
| Model Synovial Fluid 2 | 20 | 3.6 | 2.5 | ϒ-globulin |
| Calibration Fluid 1 | 20 | - | - | Albumin |
| Load | Contact Pressure | Velocity | Stroke | Total Distance | Number of Cycles | Duration | Temperature |
|---|---|---|---|---|---|---|---|
| 10 N | 0.8 MPa | 10 mm/s | 20 mm | 1200 mm | 60 | approximately 4.5 min | 37 °C |
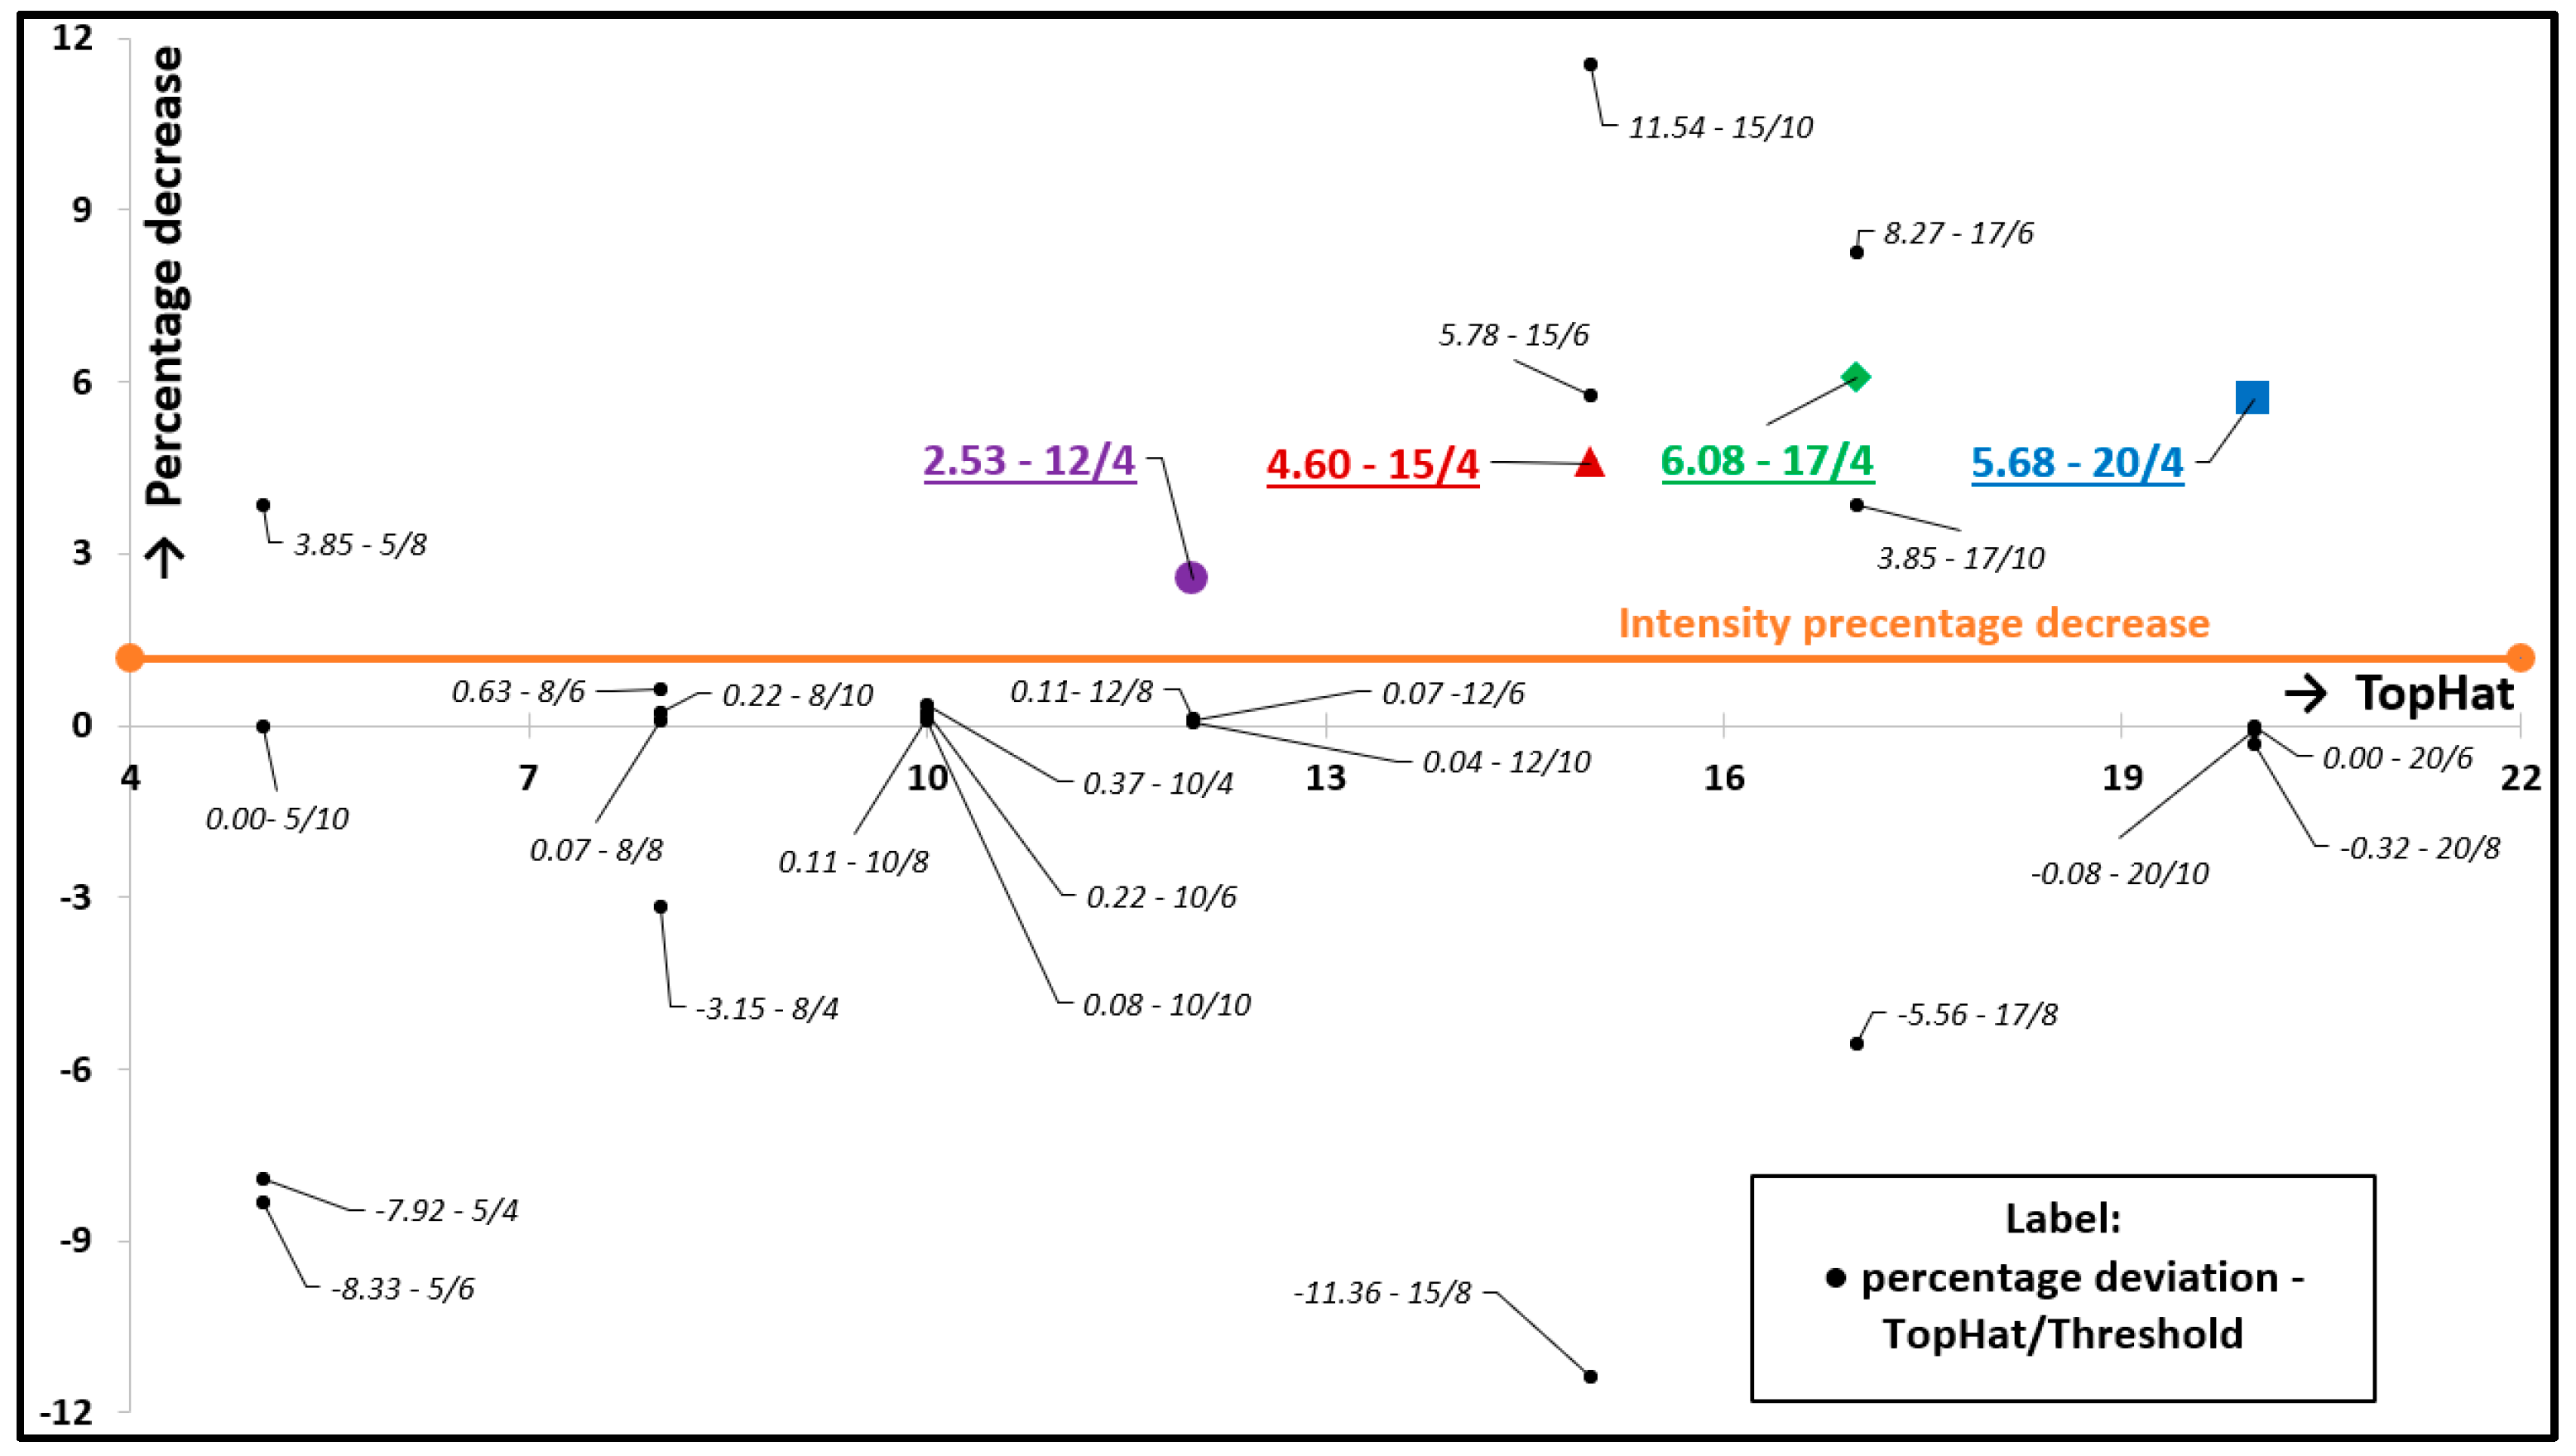
| Lubricant | Mask Radius (pixel) | Contact Center x/y (pixel) | Top Hat | Threshold | Labelled Component | Fluorescence Filter |
|---|---|---|---|---|---|---|
| Model Synovial Fluid 1 | 1000 | 1300/1100 | 15 | 4 | Albumin | TRITC |
| Model Synovial Fluid 2 | 1000 | 1300/1100 | 13 | 4 | ϒ-globulin | FITC |
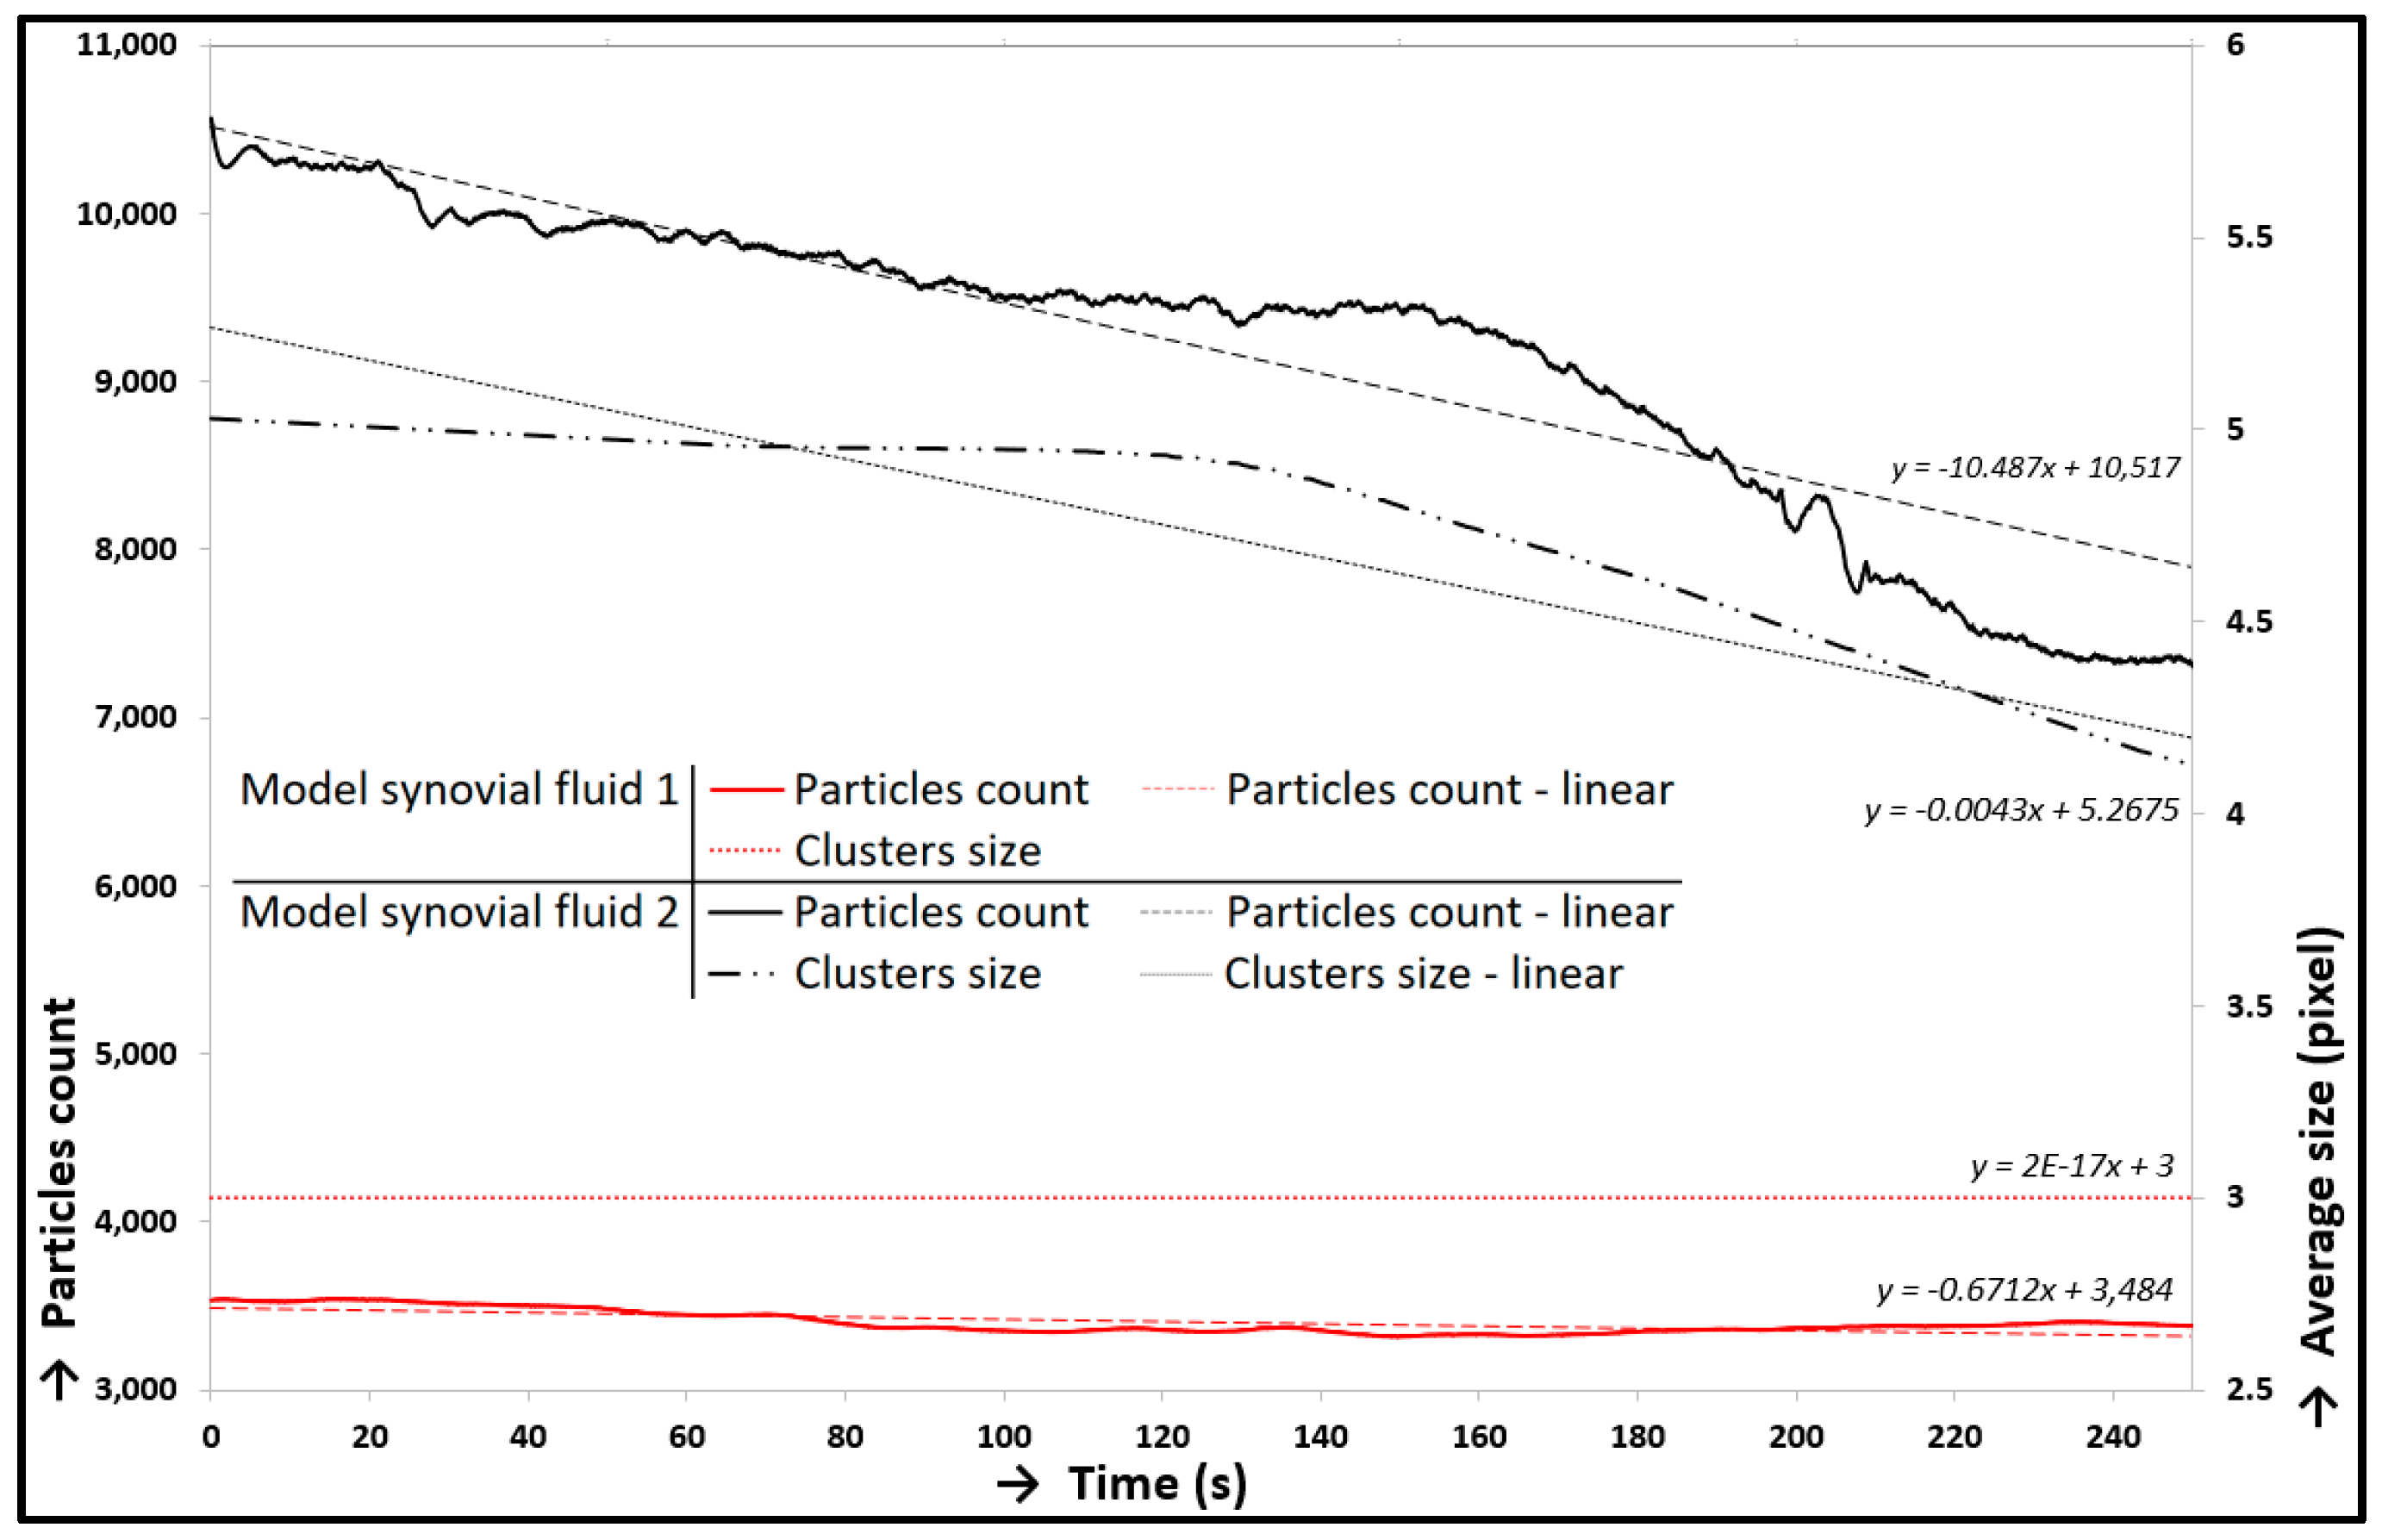
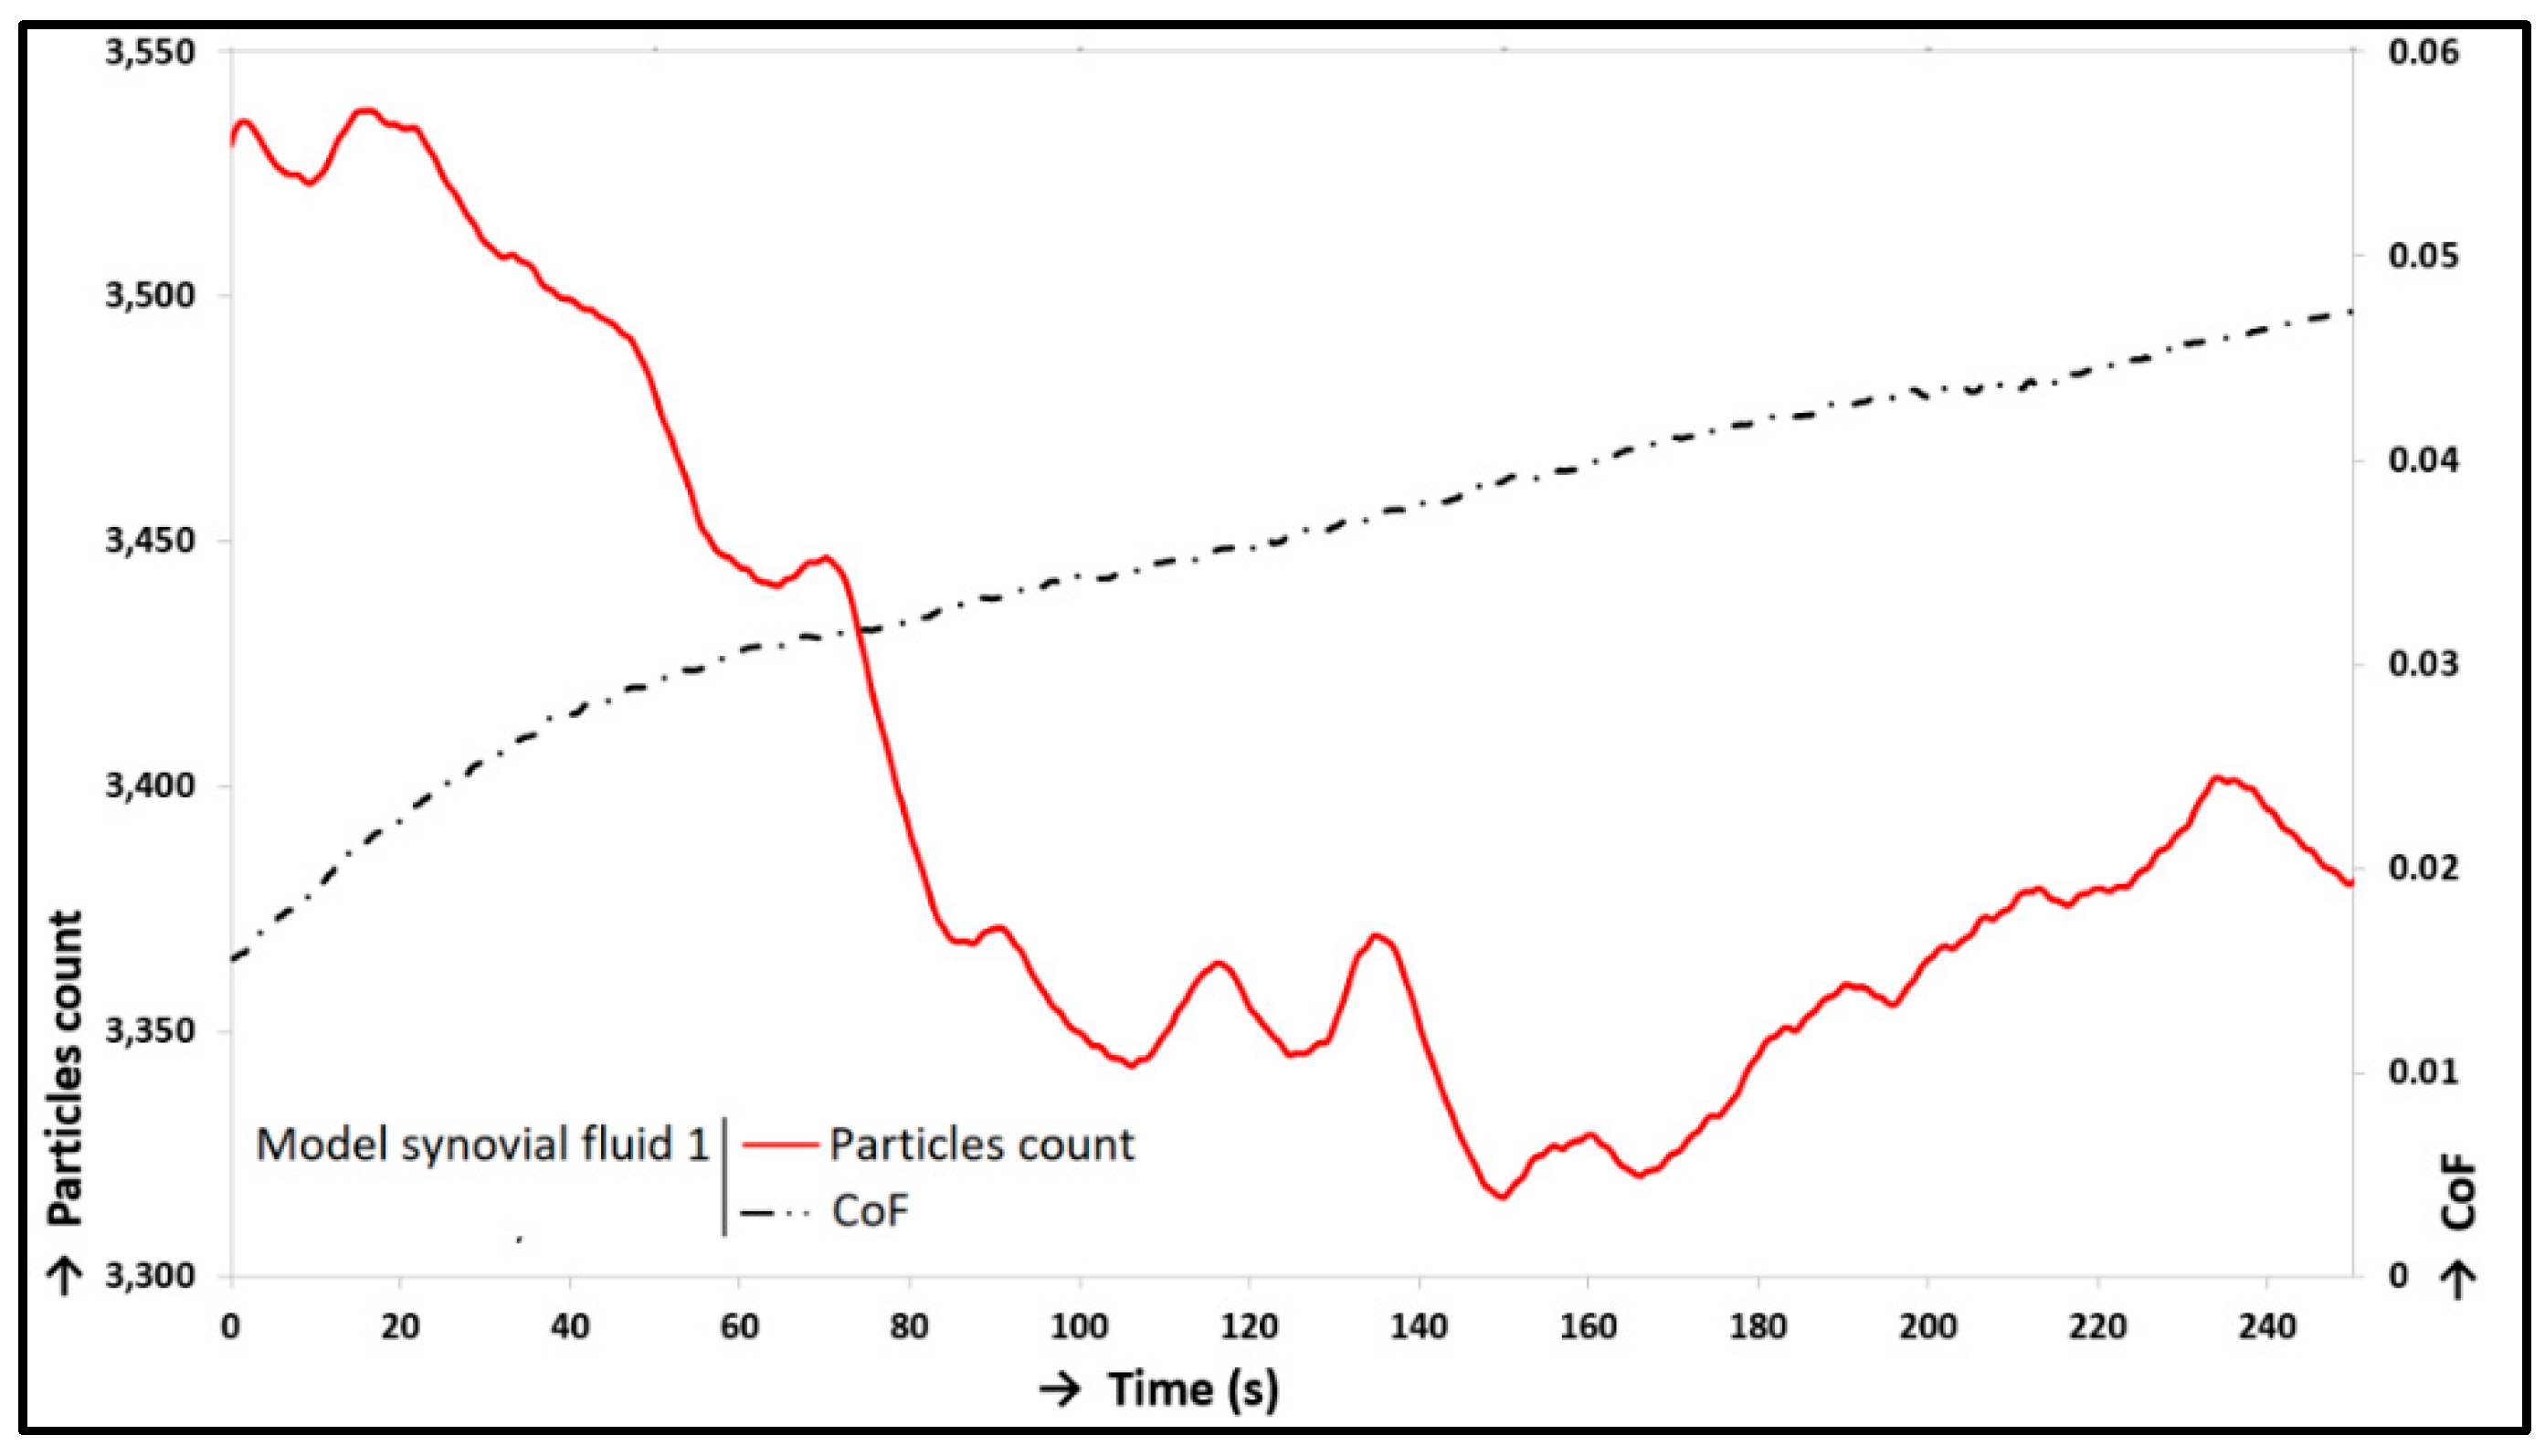
| Lubricant | Deviation of CoF | Deviation of Particle Count |
|---|---|---|
| Model Synovial Fluid 1 | 61.55%-Increase | 3.73%-Decrease |
| Model Synovial Fluid 2 | 56.96%-Increase | 23.33%-Decrease |
© 2020 by the authors. Licensee MDPI, Basel, Switzerland. This article is an open access article distributed under the terms and conditions of the Creative Commons Attribution (CC BY) license (http://creativecommons.org/licenses/by/4.0/).
Share and Cite
Čípek, P.; Vrbka, M.; Rebenda, D.; Nečas, D.; Křupka, I. Biotribology of Synovial Cartilage: A New Method for Visualization of Lubricating Film and Simultaneous Measurement of the Friction Coefficient. Materials 2020, 13, 2075. https://doi.org/10.3390/ma13092075
Čípek P, Vrbka M, Rebenda D, Nečas D, Křupka I. Biotribology of Synovial Cartilage: A New Method for Visualization of Lubricating Film and Simultaneous Measurement of the Friction Coefficient. Materials. 2020; 13(9):2075. https://doi.org/10.3390/ma13092075
Chicago/Turabian StyleČípek, Pavel, Martin Vrbka, David Rebenda, David Nečas, and Ivan Křupka. 2020. "Biotribology of Synovial Cartilage: A New Method for Visualization of Lubricating Film and Simultaneous Measurement of the Friction Coefficient" Materials 13, no. 9: 2075. https://doi.org/10.3390/ma13092075
APA StyleČípek, P., Vrbka, M., Rebenda, D., Nečas, D., & Křupka, I. (2020). Biotribology of Synovial Cartilage: A New Method for Visualization of Lubricating Film and Simultaneous Measurement of the Friction Coefficient. Materials, 13(9), 2075. https://doi.org/10.3390/ma13092075