Article

Self-Supported Reduced Graphene Oxide Membrane and Its Cu2+ Adsorption Capability

1
College of Textile and Clothing Engineering, Soochow University, Suzhou 215006, China
2
School of Textiles and Materials, Xi’an Polytechnic University, Xi’an 710048, China
3
Jiangsu College of Engineering and Technology, Nantong 226014, China
*
Authors to whom correspondence should be addressed.
These authors contributed equally to this work.
Materials 2021, 14(1), 146; https://doi.org/10.3390/ma14010146
Submission received: 28 October 2020 / Revised: 24 December 2020 / Accepted: 28 December 2020 / Published: 31 December 2020

Abstract

:
Graphene stratiform membrane materials have been recently applied to heavy metal removal in aqueous systems via adsorption due to their high mechanical strength, chemical stability, and other properties. We applied reduced graphene oxide (rGO) alone as an adsorbent to remove heavy metal ions from wastewater. Self-supported rGO membrane was prepared using a green reduction method with sodium hydrosulfite. We used the Raman spectra to observe the structure of the rGO membrane. The morphology of the self-supported membrane was measured by a scanning electron microscope. The Cu2+ adsorption performance was measured in terms of pH, reaction time, metal ion concentration, and temperature. The maximum Cu2+ adsorption capacity of the rGO membrane was found to be 149.25 mg/g. The adsorption process followed a pseudo-second-order kinetic model, and adsorption isotherms were simulated by the Freundlich model.

1. Introduction

Heavy metals are mainly found in industrial wastewater. Determining the effluent status has become increasingly complex due to industrial development. To mitigate negative impacts on the environment, the emissions of toxic substances into natural water must be controlled [1]. However, heavy metals have low biodegradability and remain stable in the environment, which causes significant harm to human health and the environment [2,3]. Copper and its derivatives, which could be considered as the most common heavy metals in wastewater, are widely used in plating baths, pigments, and fertilizers. The accumulation of Cu2+ in the human body could cause skin, pancreatic, heart, and brain diseases, so the removal of copper and its derivatives is vital. Effluent treatment methods for copper include electrochemical, membrane filtration, chemical oxidation, photocatalytic degradation, and adsorption [4]. Of these techniques, adsorption technology is considered the most effective as well as being low cost and practical [5].
Graphene has been widely used in various fields due to its the excellent conductivity, thermal conductivity, transmittance, and adsorption, which are attributed to its unique two-dimensional single-carbon atomic layer nanostructure [6,7]. As new-generation adsorbents, graphene-based materials have been investigated for the treatment of water in the environment due to their high adsorption affinity, open-up layer morphology, and high hydrophobic surface area [8]. Membrane technologies play an important role in environmental protection [9,10,11]. Single-atom-thick graphene membranes were confirmed to be impermeable to atoms [12]. Graphene oxide (GO), a graphene derivative, acts as a bridge for the preparation of graphene films [13,14,15]. Graphene-based films are generally built by thickness reduction passages, which could provide the mass transfer needed to maximize permeability [16].
Reduced graphene oxide (rGO) is usually achieved using chemical reducing agents (such as amino acids, oxalic acid, D-glucose, and tea polyphenols), heat treatment, and microwave and electrochemical methods [17]. rGO has not been used alone as an adsorbent to remove heavy metal ions from polluted water [18].
The purpose of this work was to study the Cu2+ adsorption properties of a self-supported rGO membrane in an aqueous system. The green reduction ability of the GO membrane and the optimum conditions of Cu2+ adsorption were determined by experiments. Cu2+ adsorption was analyzed using kinetics, isotherms, and thermodynamics on the rGO membrane. It was found that rGO membrane can be used to remove Cu2+ in polluted water.

2. Experimental Section

2.1. Materials

Graphite, sodium nitrate, and copper sulfate pentahydrate were purchased from Aladdin (Shanghai, China). Sulfuric acid (98%) and hydrochloric acid (36%) were supplied by Qiangsheng Functional Chemistry Co. Ltd. (Suzhou, China). Potassium permanganate (analytical reagent (AR)) was purchased from Chinese Medicine Group Chemical Reagent Co. Ltd. (Shanghai, China). Hydrogen peroxide (AR) was supplied by Lingfeng Chemical Reagent Co. Ltd. (Shanghai, China). Sodium hydroxide (guarantee reagent) was purchased from Yonghua Chemical Science and Technology Co. Ltd. (Suzhou, China). Sodium hydrosulfite was from Adamas (Shanghai, China).

2.2. GO Synthesis

The modified Hummer’s method was used for synthesis of graphene oxide by graphite [19,20,21]. The whole system was stirred throughout the preparation process. First, 46 mL concentrated sulfuric acid was placed in a beaker. In an ice bath, 1 g of graphite and 1 g of sodium nitrate were added to the concentrated sulfuric acid, and 6 g of potassium permanganate was gradually added. After 30 min, the system was heated to 35 °C for 1 h. Subsequently, 80 mL of deionized water was added and heated to 95 °C for 30 min. Then, 12 mL of 30% hydrogen peroxide solution and 200 mL of deionized water was added. After washing with 5% hydrochloric acid once or twice, the mixture was rinsed with deionized water. After centrifuging, the GO was dried at 50 °C for 24 h in a blast dryer.

2.3. Preparation of the rGO Membrane

Adequate dispersal of the GO solution was achieved using 0.25 g of dried GO powder and 500 mL ultrasonic distilled water. This homogeneous solution was filtered using a vacuum filter with cellulose acetate membrane. The membrane was peeled after desiccation for one night at room temperature. The mass of the prepared GO membrane was 7.96 g·m−2. The GO membrane was reduced with sodium hydrosulfite as the reductant [20,21,22]. After studying the reduction conditions, each sheet of GO membrane was immersed in 100 mL of 40 g·L−1 Na2S2O4 aqueous solution. The mixture was maintained at 80 °C for 50 min. To remove excessive reducing agent, the membrane was washed with deionized water several times. Finally, the rGO membrane was dried at 50 °C for 120 min.

2.4. Raman Spectrum Analysis

The Raman spectra (LabSpec 6, HORIBA XploRA, Lille, France) were captured with a laser light wavelength of 532 nm incident in the range of 1000–3000 cm−1. The sample was used without any other treatment.

2.5. Morphology Analysis

The morphology of the rGO membrane was observed by a scanning electron microscope (SEM; FESEM, S-4800, Hitachi, Tokyo, Japan) after spraying the sample with gold. The thickness of the rGO film was measured by a O6223-01 digital outside micrometer (Aladdin Industrial Corporation, Shanghai, China).

2.6. Electrical Surface Resistance Analysis

The electrical surface resistance of the membrane was measured using a standard four-probe method using a digital four-probe tester.

2.7. Adsorption Experiment

A standard solution of 1 g·L−1 Cu2+ was prepared using copper sulfate pentahydrate. The pH value was adjusted with sodium hydroxide and hydrochloric acid. The iodine flasks containing 25 mL solution were shaken at a rotational speed of 120 rpm using an incubator shaker in the Cu2+ batch adsorption experiments.
Next, 6 mg of adsorption membrane was added to 100 mg·L−1 (ppm) Cu2+ solution for different durations (10, 20, 40, 60, 120, 180, 240, 300, 360, 420, and 480 min) at an initial pH of 6 and constant temperature of 25 °C. This adsorption membrane was shaken in different initial concentrations of Cu2+ solution (50, 75, 100, and 125 ppm) for 10, 20, 40, 60, 120, 180, and 240 min with the temperature maintained at 25 °C.
The initial pH value of the 100 ppm Cu2+ solution was adjusted from 2 to 6. Then, 6 mg film was used for adsorption for 180 min at 25 °C. The 6 mg adsorption membrane was shaken in different initial concentrations of Cu2+ solutions (50, 75, 100, 125, and 150 ppm) at different temperatures (25, 30, and 35 °C) at pH 6 for 240 min to obtain the isotherms.
The Cu2+ concentration was determined using inductively coupled plasma emission spectrum (ICP-OES, Icap6300, Waltham, MA, USA). The ICP-OES result provided the concentration of the residual Cu2+ in the solution after adsorption. The adsorption capacity of Cu2+ adsorption (qe) and the percentage of removal (Re) were calculated as follows:
q e = ( C 0 C e ) V W
R e = C 0 C e C 0 × 100 %
where the initial and equilibrium concentration of Cu2+ are expressed by C0 and Ce (mg∙L−1), respectively; the volume of the Cu2+ aqueous solution and the weight of the adsorbent membrane are indicated by V (L) and W (g), respectively.

3. Results and Discussion

3.1. Reduction of GO Membrane

Many methods have been used to reduce graphene oxide, amongst which Na2S2O4 could be regarded as a better reducing agent in chemical reduction methods [23]. Considering its low price and environmental friendliness, Na2S2O4 has the potential to effectively manufacture rGO membranes.
The effect of Na2S2O4 concentration on electrical surface resistance was investigated (Table 1). The low-concentration Na2S2O4 (10 g·L−1) solution could not provide higher conductivity because it did not sufficiently lessen the oxygen-containing groups of GO to convert them into complete graphene. The electrical surface resistance of the rGO membrane constantly decreased from 480 to 370 Ω·cm−1 with increasing Na2S2O4 concentration from 20 to 40 g·L−1. However, the electrical surface resistance of the membrane increased at a Na2S2O4 concentration of 50 g·L−1. The smallest value of surface resistance was observed at 40 g·L−1.
Electrical surface resistance was studied with different reduction times. The data indicated that the electrical surface resistance decreased from 798.2 to 413.1 Ω·cm−1 (conductivity increased) with increasing reaction time from 30 to 50 min (Figure 1a). With a reduction time from 60 to 70 min, the electrical surface resistance of the rGO membrane slightly increased from 472.6 to 501.4 Ω·cm−1, which may be due to over-reduction. With prolonging reduction time from 60 to 70 min, the reduction induced defects on the rGO membrane and inhibited charge transfer. Complete reduction of the GO membrane should be performed at 50 min to convert into an rGO membrane.
The influence of reducing temperature on conductivity was investigated (Figure 1b). The electrical surface resistance of the membrane constantly decreased from 299.83 to 147.98 Ω·cm−1 with increasing reaction temperature from 50 to 80 °C. However, the electrical surface resistance grew slightly due to over-reduction when the temperature was 90 °C. Therefore, the highest conductivity response was observed at 80 °C. The optimum conditions of reduction were 50 min, 80 °C, and 40 g·L−1. The optimum conditions were sufficient for complete reduction of the GO membrane.

3.2. Characterization of the rGO Membrane

Self-supported rGO membrane was prepared by the reduction of GO film (Figure 2a). The rGO membrane was black and shiny. The SEM image showed the cross section of the rGO membrane and illustrated the interlayer space structure of the rGO membrane (Figure 2b). After reduction of the GO film, the mass of the rGO membrane was 6 mg and the thickness was 4.4 µm, which was indirectly proven by the cross-sectional image of the rGO membrane. Its flexibility is shown in Figure 2c.
The Raman spectra of the rGO membrane was characterized by a G band at 1566 cm−1 and a D band at 1335 cm−1 (Figure 3). The important characteristic G peak of graphene was caused by the in-plane vibration of sp2 carbon atoms. Figure 3 shows the existence of rGO due to the overall stronger absorption intensity of rGO. The D or G peak showed stronger intensity on the rGO membrane. The strength ratio (ID/IG) of the D and G peaks indirectly illustrated the disorder and defects of folds, edges, and pores. The D peak being stronger than the G peak indicated that the rGO membrane produced structure defects during the reduction process. Therefore, the reduction method is in agreement with the results of other common effective reduction methods.

3.3. Cu2+ Adsorption Performance of the rGO Membrane

3.3.1. Effect of Contact Time

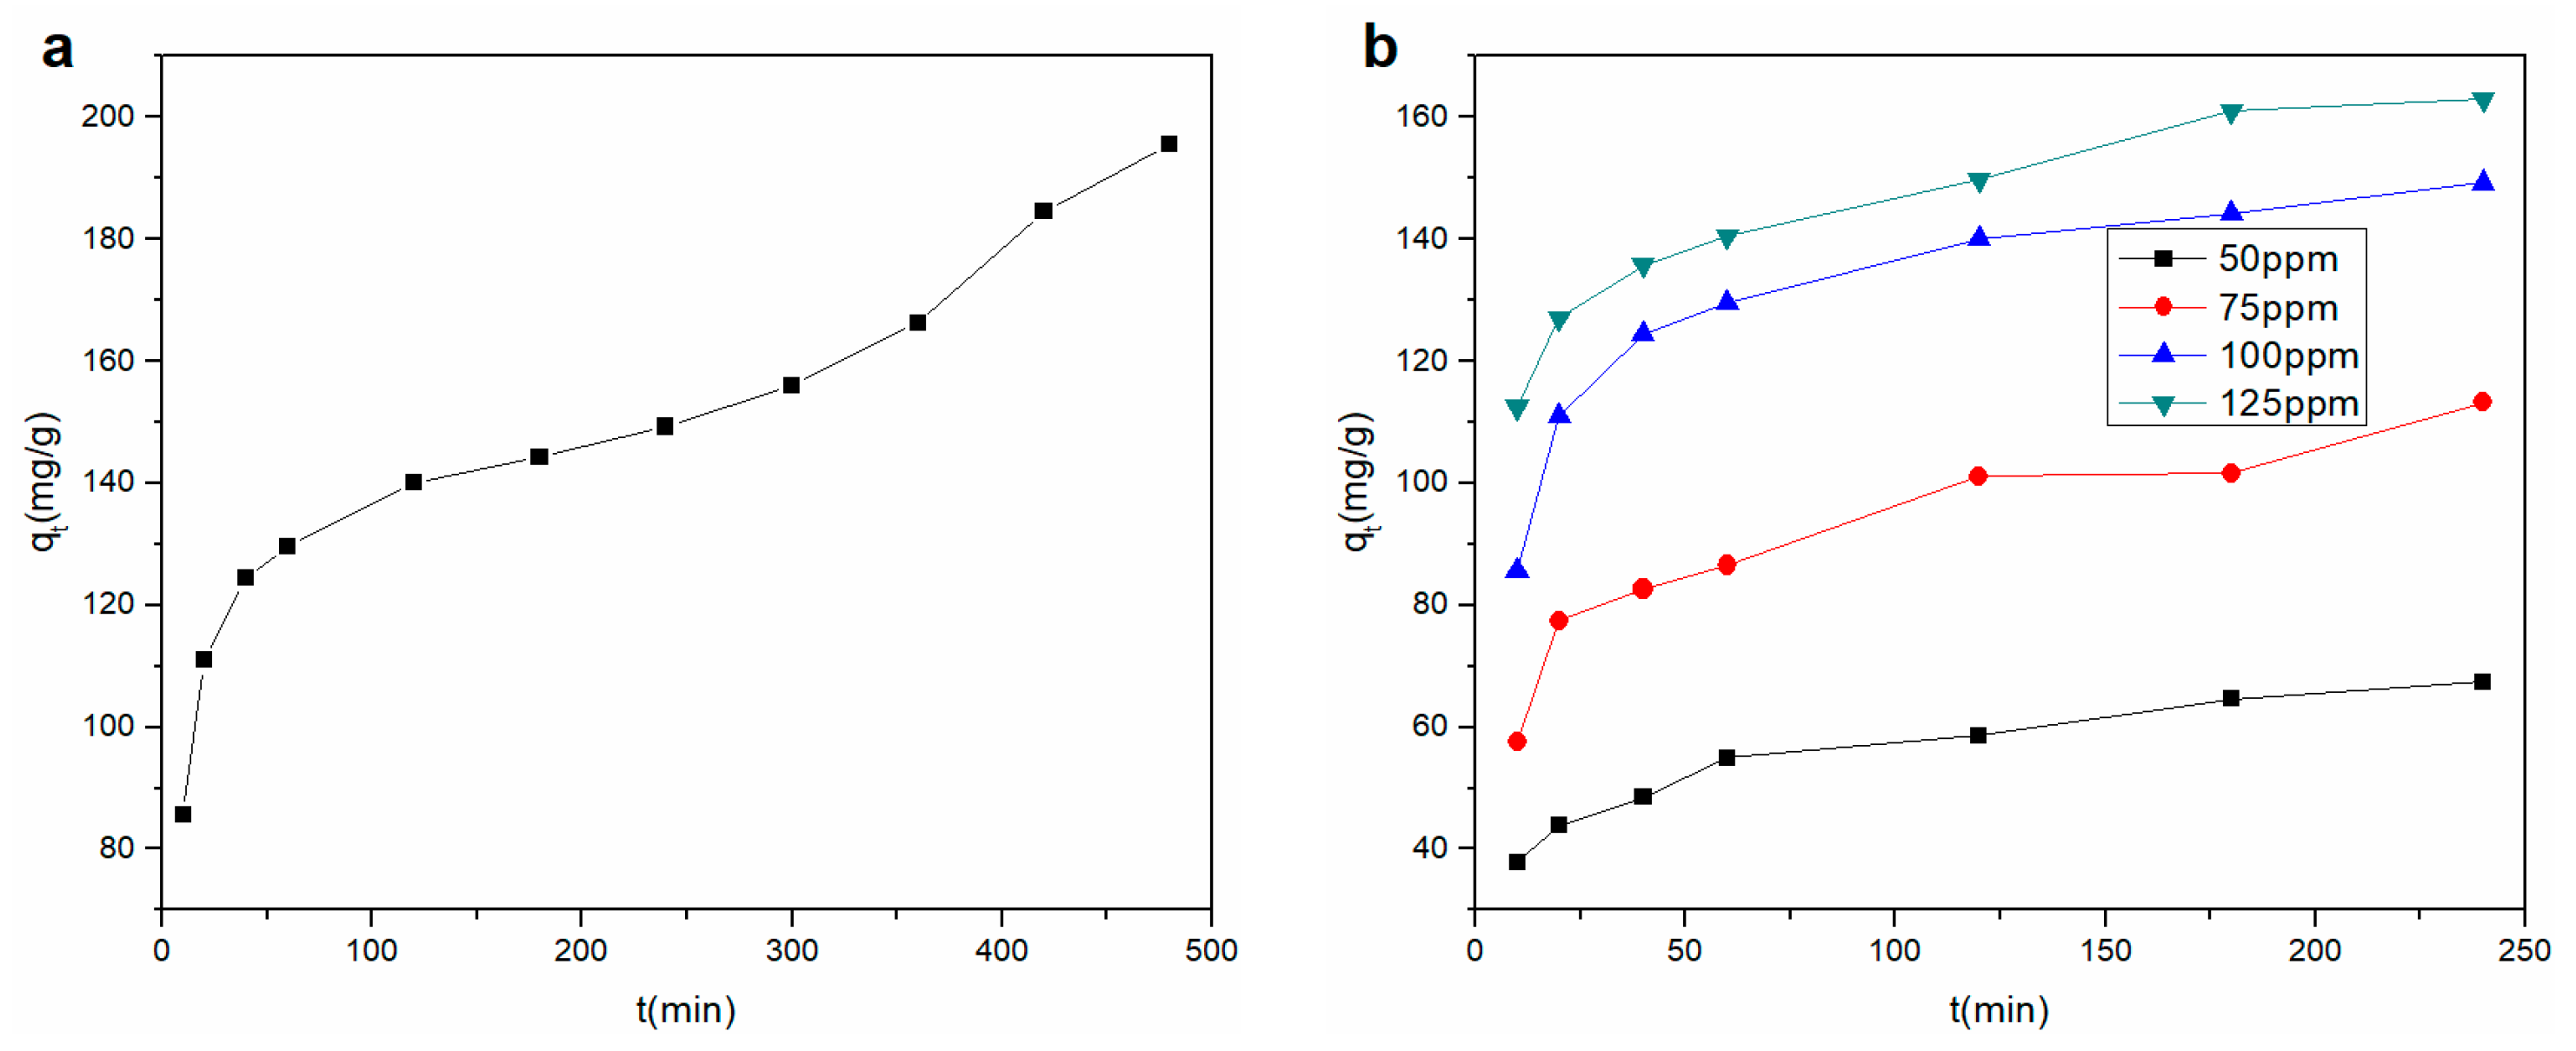
The effect of contact time on the Cu2+ adsorption of the rGO membrane is shown at 100 ppm in Figure 4a. The highest Cu2+ adsorption rate appeared in the first 60 min. The amount of Cu2+ adsorbed onto the rGO membrane linearly increased with an increase in contact time, which might be due to the strong influence of the charges on membrane selectivity [20]. After 60 min, the adsorption quantity of Cu2+ grew briefly, and then the adsorption capacity increased smoothly with increasing time. The adsorption amount did not significantly increase following further increase in contact time, which might be the reason for the decrease in the driving force. Through the above analysis, the optimal balance time was chosen as 240 min for subsequent experiments. The maximum Cu2+ adsorption capacity of the rGO membrane was 149.25 mg/g; compared to the adsorption capacity of other adsorbents [24,25,26,27], the capacity of the rGO prepared in this work was greater (Table 2). The promotion of adsorption could be attributed to the layer structure of the rGO film, which provided an inner layer pass road. Therefore, Cu2+ ions could effectively pass through the layers and adsorbed by the surface of the rGO.
The removal of Cu2+ by the membrane was investigated under four initial concentrations, and the results are depicted in Figure 4b. The adsorption rate was exceedingly high in the first 20 min, and the same trend in the adsorption properties with different initial concentrations was found with the change in contact time. The adsorption properties were also promoted with increasing initial concentration.

3.3.2. Effect of Initial pH

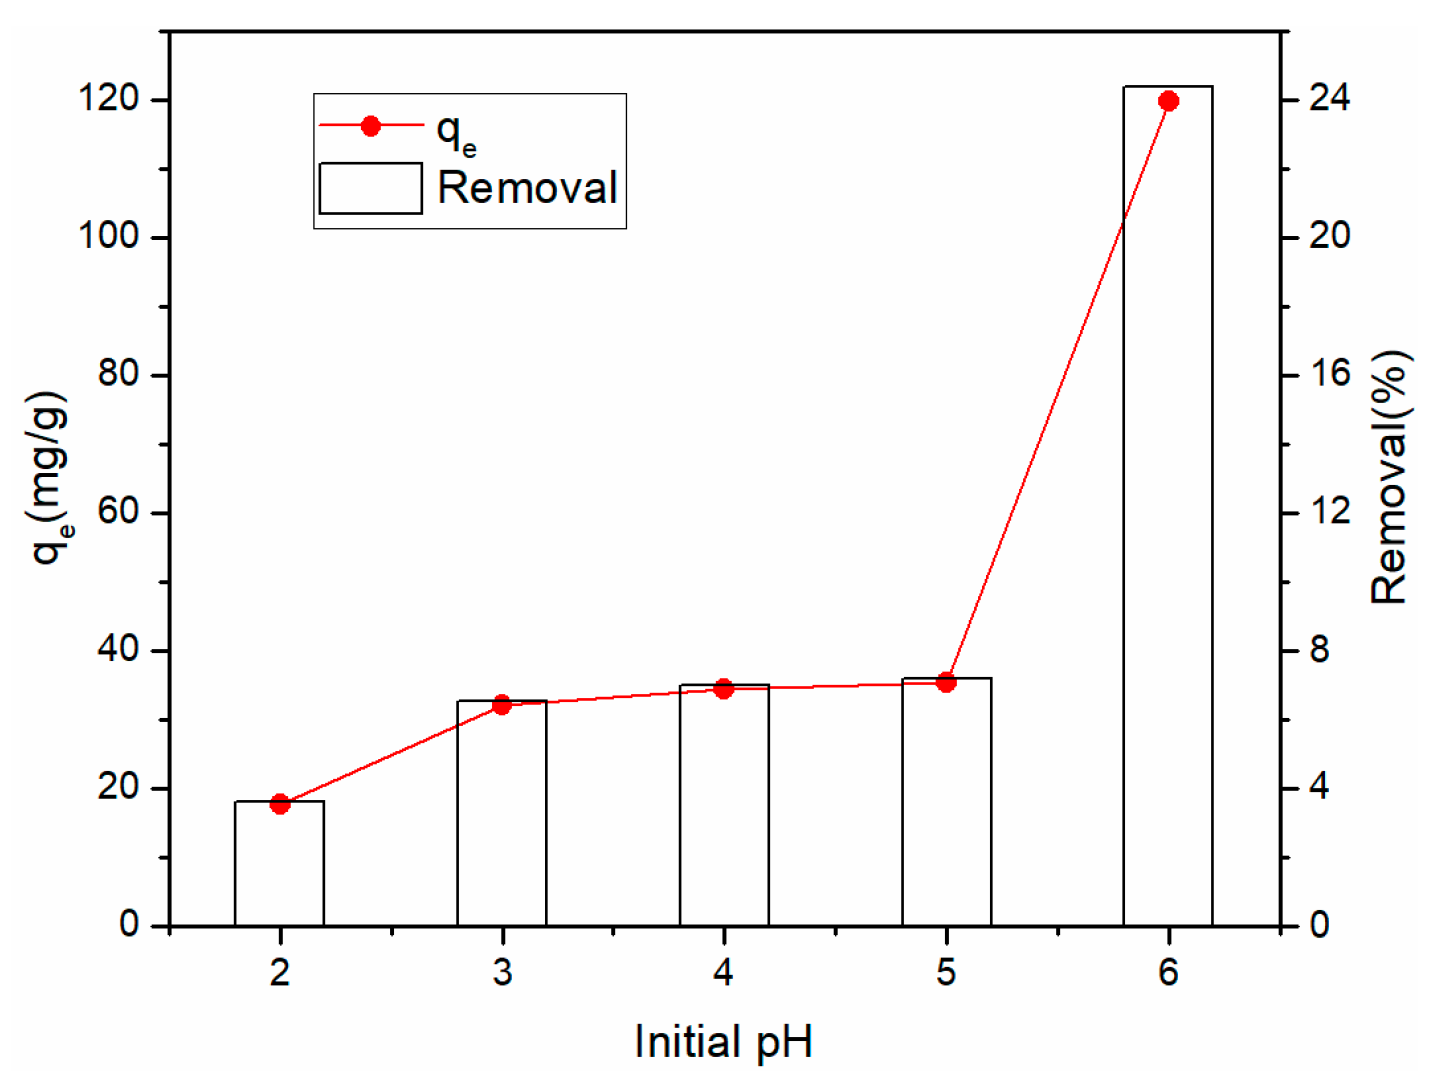
Figure 5 demonstrates the impact of pH on the adsorption capacity and removal of Cu2+ of the rGO membrane. To avoiding precipitation, when pH was changed from 2 to 6, the adsorption of Cu2+ increased from 17.67 to 119.67 mg·g−1. The pH strongly affected Cu2+ adsorption by the rGO membrane. As the pH level increased, the removal efficiency increased from 3.59% to 24.37%. The adsorption capacity was maximum at pH 6, which might be due to the electronegativity of graphene in water, which can be absorbed by the action of positive and negative charges.

3.3.3. Adsorption Kinetic Study

Cu2+ adsorption kinetic models were analyzed to investigate the mechanism of the rGO membrane adsorption process. Changes in adsorption with time were quantified using a suitable kinetic model. The mechanism was interpreted by comparing the ability of the pseudo-first-order and pseudo-second-order models to fit the experimental data. The equations of the pseudo-first-order and pseudo-second-order kinetic models are expressed as follows [28,29]:
log ( q e q t ) = log q e k 1 2.303 t
t q t = 1 k 2 q e 2 + 1 q e t
where qe and qt are the amount of Cu2+ adsorbed on the rGO membrane at equilibrium time and contact time (mg·g−1), respectively; k1 (min−1) and k2 (g (mg min)−1) are the rate constants of the pseudo-first-order and pseudo-second-order models, respectively.
The fitted curves for the pseudo-first-order and pseudo-second-order kinetic models are presented in Figure 6. The kinetic parameters are listed in Table 3 for Cu2+ adsorption on the rGO membrane at four initial concentrations. The lowest coefficient obtained by the pseudo-second-order model was 0.9929, which was better than the coefficient of the pseudo-first-order model. The experimental qe value was close to the calculated qe2 in the pseudo-second-order model, but qe was significantly different from the calculated qe1 value in the pseudo-first-order model. Therefore, the adsorption process was more accurately captured by the pseudo-second-order model. The adsorption process was mainly chemisorption.
Hydrolysis, flocculation, and ion exchange may lead to the adsorption of heavy metals by carbon-based materials, that is, the adsorption of Cu2+ onto the rGO membrane is the result of the chemical reaction between the negative charge on the membrane surface and the positive metal ions as well as the electrostatic interaction. The graphene surface is negatively charged, which enables efficient removal of cationic contaminants [30]. To further study the internal action during the adsorption process, the intraparticle diffusion model [31] was applied:
q t = k p i t 1 2 + c i
where kpi is the rate coefficient of intraparticle diffusion (mg·g−1·min−1/2), and ci is the thickness of the boundary layer that is constantly affected. The values of kpi and ci are calculated by the slope and intercept of qt vs. t1/2, respectively. The larger the ci value, the greater the boundary layer effect.
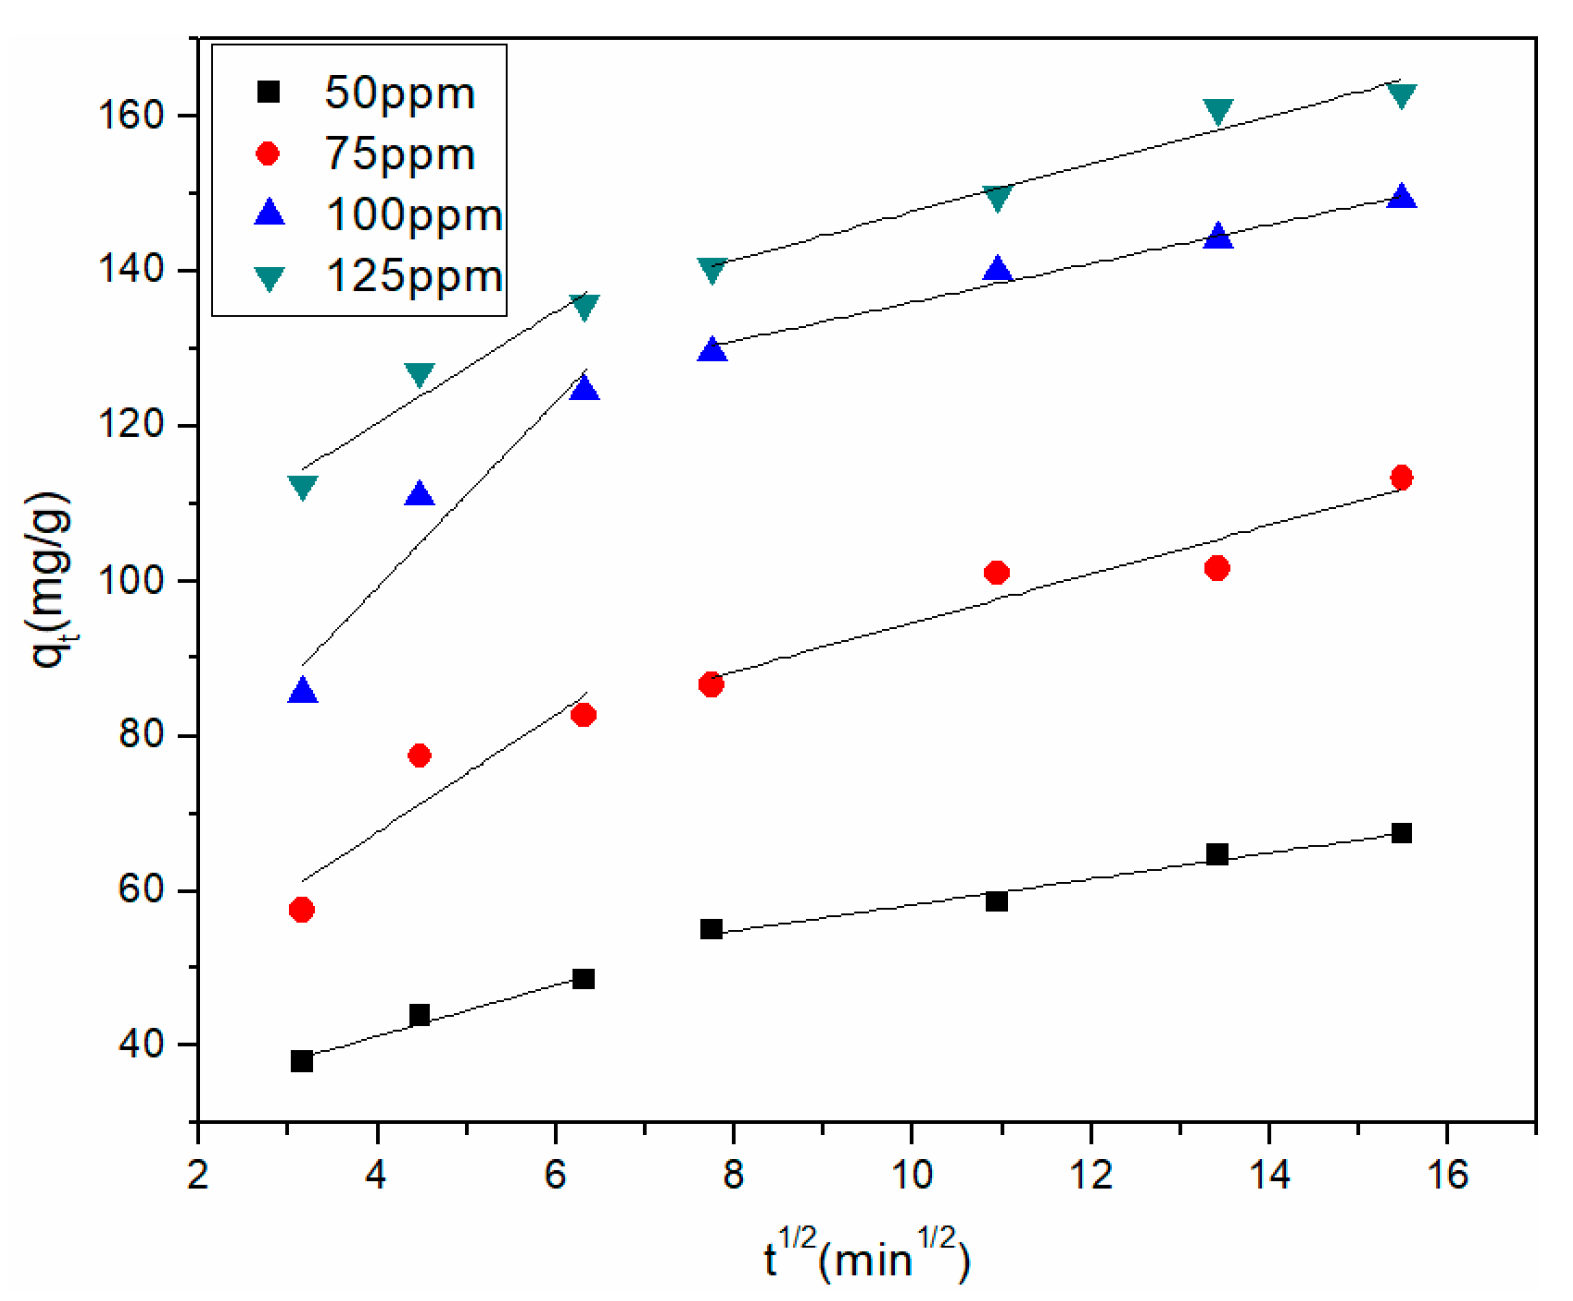
The mass transfer action of Cu2+ adsorption was examined using the intraparticle diffusion model on the rGO membrane. Figure 7 plots qt vs. t1/2 at four initial concentrations. The parameters are listed in Table 4 for intraparticle diffusion. Two related lines fitted by data points describe the external diffusion and intraparticle diffusion in the plot of qt vs. t1/2. For the four different initial Cu2+ concentrations, kp2 was lower than kp1, and c1 was smaller than c2, which illustrated that the removal rate of Cu2+ was faster in the beginning. The first process occurred during the first 40 min. The instantaneous diffusion stage was indicated by the large amount of Cu2+ being rapidly adsorbed by the rGO membrane. The second process occurred during 80–240 min, where the rate of adsorption was controlled by intraparticle diffusion. The intraparticle diffusion rate gradually decreased and gradually attained equilibrium due to the accumulation of Cu2+ adsorbed on the exterior surface.

3.3.4. Adsorption Thermodynamic Study

The change in temperature is important in the adsorption process. Figure 8a shows the effect of initial concentration in the range of 50 to 150 ppm on Cu2+ adsorption at three different temperatures. The adsorption capacity of Cu2+ increased with the increase in initial concentration, which might be due to the diffusion rate of Cu2+ increasing with temperature.
The models of adsorption isotherm were used to depict the reactivity of the adsorbate and adsorbent during the adsorption process. The Freundlich and Temkin isotherm models were applied to fit the experimental data at three different temperatures. The Freundlich isotherm is often used assuming heterogeneous multilayer adsorption. The Freundlich model is generally indicated as follows [32]:
ln q e = 1 n ln C e + ln K F
where KF and n are the Freundlich constants of the adsorption capacity and intensity, respectively. The adsorption capacity and the concentration of heavy metal are qe (mg·g−1) and Ce (mg·L−1) in solutions, respectively. When the value of 1/n is less than 1, the Langmuir isotherm hypothesis is tenable; conversely, cooperative action is indicated in adsorption.
The Temkin isotherm assumes that binding energy is uniformly distributed at maximum binding energy during adsorption. The heat of adsorption decreases linearly due to adsorbent−adsorbate interactions with coverage of all the molecules in the layer in this model [33,34]. The Temkin model is commonly expressed as follows:
q e = B ln K T + B ln C e
where B = RT/b; R (8.314 J·mol−1·K−1) is the universal gas constant; the absolute temperature and the Temkin isotherm constant are expressed by T (K) and b, respectively; B and the heat of adsorption are related. The maximum binding energy is represented by KT in the equilibrium binding constant.
The fitted curves are presented in Figure 8b,c for the two isotherm models, the parameters of which are listed in Table 5. The value of 1/n was greater than 1 in the Freundlich model coefficient, indicating cooperative adsorption for the multilayer adsorption process. The adsorption of the experiment conformed to the Freundlich adsorption isotherm model. Comparing the regression coefficient (R2) values of Freundlich and Temkin adsorption isotherms, the Freundlich adsorption isotherm more accurately reflected the Cu2+ adsorption process on the rGO membrane. Therefore, the Freundlich adsorption isotherm was more suitable. The Cu2+ adsorption process on the rGO membrane involved diffusion and intraparticle diffusion per our thermodynamics research.

4. Conclusions

Self-supported rGO membrane with interlayer space structure was prepared using a green reduction method with sodium hydrosulfite. The optimum reduction conditions were 50 min, 80 °C, and 40 g·L−1 reduction solution. The Raman spectra proved the existence of rGO, and the SEM image illustrated the structure of the interlayer spaces. The Cu2+ adsorption on rGO membrane was strongly dependent on pH and time. Kinetic research of Cu2+ agreed with the pseudo-second-order kinetic model, and the adsorption isotherm was consistent with the Freundlich model. The rGO membrane could effectively remove Cu2+ in aqueous solution. The adsorption mechanism was chemisorption. Therefore, self-supported rGO film shows promise as an adsorption material for the removal of heavy metal ions for the treatment of polluted water due to its easy synthesis, low cost, and convenient separation, playing an important role in environmental remediation.

Author Contributions

Methodology, Y.Y.; validation, Z.W.; formal analysis, Y.Y. and Z.W.; writing—original draft preparation, Y.Y. and Z.W.; writing—review and editing, Z.W., R.S. and G.W.; project administration, Z.C., M.L. and X.Z.; funding acquisition, G.W., Z.C., M.L. and X.Z.; supervision, M.Y. and G.W. All authors have read and agreed to the published version of the manuscript.

Funding

This work was funded by the Jiangsu Advanced Textile Engineering Technology Center of Jiangsu College of Engineering and Technology, China (Grant No. XJFZ/2018/06).

Data Availability Statement

No new data were created or analyzed in this study. Data sharing is not applicable to this article.

Conflicts of Interest

The authors declare that they have no conflict of interest.

References

  1. Shannon, M.A.; Bohn, P.W.; Elimelech, M.; Georgiadis, J.G.; Marinas, B.J.; Mayes, A.M. Science and technology for water purification in the coming decades. Nature 2008, 452, 301–310. [Google Scholar] [CrossRef] [PubMed]
  2. Zheng, S.K.; Li, X.F.; Zhang, X.Y.; Wang, W.; Yuan, S.L. Effect of inorganic regenerant properties on pharmaceutical adsorption and desorption performance on polymer anion exchange resin. Chemosphere 2017, 182, 325–331. [Google Scholar] [CrossRef] [PubMed]
  3. Tan, J.Z.; Nursam, N.M.; Xia, F.; Sani, M.A.; Li, W.; Wang, X.D.; Caruso, R.A. High-performance coral reef-like carbon Nitrides: Synthesis and application in photocatalysis and heavy metal ion adsorption. ACS Appl. Mater. Interfaces 2017, 9, 4540–4547. [Google Scholar] [CrossRef]
  4. Awual, M.R. A novel facial composite adsorbent for enhanced copper (II) detection and removal from waste water. Chem. Eng. J. 2015, 266, 368–375. [Google Scholar] [CrossRef]
  5. Yi, X.F.; Sun, F.L.; Han, Z.H.; Han, F.H.; He, J.R.; Ou, M.R.; Gu, J.; Xu, X. Graphene oxide encapsulated polyvinyl alcohol/sodium alginate hydrogel microspheres for Cu (II) and U (VI) removal. Ecotoxicol. Environ. Saf. 2018, 158, 309–318. [Google Scholar] [CrossRef]
  6. Rohini, R.; Katti, P.; Bose, S. Tailoring the interface in graphene/thermoset polymer composites: A critical review. Polymer 2015, 70, A17–A34. [Google Scholar] [CrossRef]
  7. Ersan, G.; Apul, O.G.; Perreault, F.; Karanfil, T. Adsorption of organic contaminants by graphene nanosheets: A review. Water Res. 2017, 126, 385–398. [Google Scholar] [CrossRef]
  8. Gin, D.L.; Noble, R.D. Designing the next generation of chemical separation membranes. Science 2011, 332, 674–676. [Google Scholar] [CrossRef]
  9. Logan, B.E.; Elimelech, M. Membrane-based processes for sustainable power generation using water. Nature 2012, 488, 313–319. [Google Scholar] [CrossRef]
  10. Karan, S.; Jiang, Z.; Livingston, A.G. Sub–10 nm polyamide nanofilms with ultrafast solvent transport for molecular separation. Science 2015, 348, 1347–1351. [Google Scholar] [CrossRef]
  11. Gugliuzza, A.; Politano, A.; Drioli, E. The advent of graphene and other two-dimensional materials in membrane science and technology. Curr. Opin. Chem. Eng. 2017, 16, 78–85. [Google Scholar] [CrossRef]
  12. Bunch, J.S.; Verbridge, S.S.; Alden, J.S.; van der Zande, A.M.; Parpia, J.M.; Craighead, H.G.; McEuen, P.L. Impermeable atomic membranes from graphene sheets. Nano Lett. 2008, 8, 2458–2462. [Google Scholar] [CrossRef] [PubMed] [Green Version]
  13. Miculescu, M.; Thakur, V.K.; Miculescu, F.; Voicu, S.I. Graphene-based polymer nanocomposite membranes: A review. Polym. Adv. Technol. 2016, 27, 844–859. [Google Scholar] [CrossRef]
  14. Sun, C.Z.; Wen, B.Y.; Bai, B.F. Recent advances in nanoporous graphene membrane for gas separation and water purification. Sci. Bull. 2015, 60, 1807–1823. [Google Scholar] [CrossRef] [Green Version]
  15. Tan, P.; Sun, J.; Hu, Y.; Fang, Z.; Bi, Q.; Chen, Y.; Cheng, J. Adsorption of Cu2+, Cd2+ and Ni2+ from aqueous single metal solutions on graphene oxide membranes. J. Hazard. Mater. 2015, 297, 251–260. [Google Scholar] [CrossRef]
  16. Liu, Z.; Wang, W.; Ju, X.J.; Xie, R.; Chu, L.Y. Graphene-based membranes for molecular and ionic separations in aqueous environments. Chin. J. Chem. Eng. 2017, 25, 1598–1605. Available online: https://kns.cnki.net/KCMS/detail/detail.aspx?dbcode= CJFD&filena me =ZHGC201711006 (accessed on 15 November 2017). [CrossRef]
  17. Nhlane, D.; Richards, H.; Etale, A. Facile and green synthesis of reduced graphene oxide for remediation of Hg(II)-contaminated water. Mater. Today Proc. 2020, in press. [Google Scholar] [CrossRef]
  18. Ghorbani, M.; Seyedin, O.; Aghamohammadhassan, M. Adsorptive removal of lead (II) ion from water and wastewater media using carbon-based nanomaterials as unique sorbents: A review. J. Environ. Manag. 2020, 254, 109814. [Google Scholar] [CrossRef]
  19. Tang, X.; Tian, M.; Qu, L.; Zhu, S.; Guo, X.; Han, G.; Sun, K.; Hu, X.; Wang, Y.; Xu, X. Functionalization of cotton fabric with graphene oxide nanosheet and polyaniline for conductive and UV blocking properties. Synth. Met. 2015, 202, 82–88. [Google Scholar] [CrossRef]
  20. Hussain, S.; Yorucu, C.; Ahmed, I.; Hussain, R.; Chen, B.; Khan, M.B.; Siddique, N.A.; Rehman, I.U. Surface modification of aramid fibres by graphene oxide nano-sheets for multiscale polymer composites. Surf. Coat. Technol. 2014, 258, 458–466. [Google Scholar] [CrossRef]
  21. Shateri-Khalilabad, M.; Yazdanshenas, M.E. Fabricating electroconductive cotton textiles using graphene. Carbohydr. Polym. 2013, 96, 190–195. [Google Scholar] [CrossRef]
  22. Molina, J.; Fernández, J.; Fernandes, M.; Souto, A.P.; Esteves, M.; Bonastre, J.; Cases, F. Plasma treatment of polyester fabrics to increase the adhesion of reduced graphene oxide. Synth. Met. 2015, 202, 110–122. [Google Scholar] [CrossRef]
  23. Mi, X.; Huang, G.B.; Xie, W.S.; Wang, W.; Liu, Y.; Gao, J.P. Preparation of graphene oxide aerogel and its adsorption for Cu2+ ions. Carbon 2012, 50, 4856–4864. [Google Scholar] [CrossRef]
  24. Ahmad, S.; Ahmad, A.; Khan, S.; Ahmad, S.; Khan, I.; Zada, S.; Fu, P. Algal extracts based biogenic synthesis of reduced graphene oxides(rGO) with enhanced heavy metals adsorption capability. J. Ind. Eng. Chem. 2019, 72, 117–124. [Google Scholar] [CrossRef]
  25. Fu, W.; Huang, Z. Magnetic dithiocarbamate functionalized reduced graphene oxide for the removal of Cu(II), Cd(II), Pb(II), and Hg(II) ions from aqueous solution: Synthesis, adsorption, and regeneration. Chemosphere 2018, 209, 449–456. [Google Scholar] [CrossRef]
  26. Zeng, T.; Yu, Y.; Li, Z.; Zuo, J.; Kuai, Z.; Jin, Y.; Wang, Y.; Wu, A.; Peng, C. 3D MnO2 nanotubes@reduced graphene oxide hydrogel as reusable adsorbent for the removal of heavy metal ions. Mater. Chem. Phys. 2019, 231, 105–108. [Google Scholar] [CrossRef]
  27. Ranjith, K.S.; Manivel, P.; Rajendrakumar, R.T.; Uyar, T. Multifunctional ZnO nanorod-reduced graphene oxide hybrids nanocomposites for effective water remediation: Effective sunlight driven degradation of organic dyes and rapid heavy metal adsorption. Chem. Eng. J. 2017, 325, 588–600. [Google Scholar] [CrossRef] [Green Version]
  28. Ho, Y.S.; McKay, G. Pseudo-second order model for sorption processes. Process Biochem. 1999, 34, 451–465. [Google Scholar] [CrossRef]
  29. Figaro, S.; Avril, J.P.; Brouers, F.; Ouensanga, A.; Gaspard, S. Adsorption studies of molasse’s wastewaters on activated carbon: Modelling with a new fractal kinetic equation and evaluation of kinetic models. J. Hazard. Mater. 2009, 161, 649–656. [Google Scholar] [CrossRef]
  30. Nupearachchi, C.N.; Mahatantila, K.; Vithanage, M. Application of graphene for decontamination of water; Implications for sorptive removal. Groundw. Sustain. Dev. 2017, 5, 206–215. [Google Scholar] [CrossRef]
  31. Wang, H.; Liu, Y.G.; Zeng, G.M.; Hu, X.J.; Hu, X. Grafting of β-cyclodextrin to magnetic graphene oxide via ethylenediamine and application for Cr (VI) removal. Carbohydr. Polym. 2014, 113, 166–173. [Google Scholar] [CrossRef] [PubMed]
  32. Repo, E.; Warchol, J.K.; Kurniawana, T.A.; Sillanpaa, M.E.T. Adsorption of Co (II) and Ni (II) by EDTA- and/or DTPA-modified chitosan: Kinetic and equilibrium modeling. Chem. Eng. J. 2010, 161, 73–82. [Google Scholar] [CrossRef]
  33. Kim, Y.; Kim, C.; Choi, I.; Rengaraj, S.; Yi, J. Arsenic Removal Using Mesoporous Alumina Prepared via a Templating Method. Environ. Sci. Technol. 2004, 38, 924–931. [Google Scholar] [CrossRef] [PubMed]
  34. Temkin, M.J.; Pyzhev, V. Kinetic of ammonia synthesis on promoted iron Catalysts. Acta Physicochim. URSS 1940, 12, 217–222. [Google Scholar]
Figure 1. Effect of (a) reaction time of reduction agent (50 °C, 40 g·L−1) and (b) reduction temperature (concentration = 40 g·L−1; reduction time = 50 min) on electrical surface resistance of the rGO membrane.
Materials 14 00146 g001
Figure 2. Morphology pictures. (a,c) Digital images of the self-supported rGO membrane; (b) SEM image of the cross section.
Materials 14 00146 g002
Figure 3. Raman spectra of the rGO membrane.
Materials 14 00146 g003
Figure 4. Effect of contact time for (a) Cu2+ adsorption onto the rGO membrane (b) with four different concentrations.
Materials 14 00146 g004
Figure 5. Effect of pH on the removal and adsorption of Cu2+.
Materials 14 00146 g005
Figure 6. (a) Pseudo-first-order and (b) pseudo-second-order kinetic model for Cu2+ adsorption onto the rGO membrane.
Materials 14 00146 g006
Figure 7. Intraparticle diffusion model of Cu2+ adsorption by the rGO membrane.
Materials 14 00146 g007
Figure 8. (a) Adsorption isotherms of Cu2+ on rGO membrane at different temperatures; (b) Freundlich and (c) Temkin isotherms for adsorption of Cu2+.
Materials 14 00146 g008
Table 1. The effect of different concentrations of Na2S2O4 solution on the electrical surface resistance of the reduced graphene oxide (rGO) membrane (temperature = 50 °C; reduction time = 50 min).
Concentration of Na2S2O4 (g∙L−1)Electrical Surface Resistance (Ω∙cm−1)
105 × 104
20480
30410
40370
50560
Table 2. Comparison of Cu2+ adsorption of rGO with other adsorbents.
AdsorbentAdsorption Capacity
(mg·g−1)
Adsorption ConditionsReference
pHTime
(h)
C0
(ppm)
N-rGO9179100[24]
A-rGO74
J-rGO93
rGO-PDTC/Fe3O4113.6466100[25]
MnO2 nanotubes@rGO121.5512200[26]
ZnO nanorod-rGO67.396210[27]
rGO149.2564100this work
Table 3. Kinetic parameters for adsorption of Cu2+ onto the rGO membrane. qe (mg·g−1) and qt (mg·g−1) are the amount of Cu2+ adsorbed on the rGO membrane at equilibrium time and contact time, respectively; k1 (min−1) and k2 (g (mg min)−1) are the rate constants of the pseudo-first-order and pseudo-second-order models, respectively.
Kinetic ModelParameter50 ppm75 ppm100 ppm125 ppm
Pseudo-first-orderqe1 (mg·g−1)31.3146.9852.0654.93
k1 (min−1)1.27 × 10−20.88 × 10−21.38 × 10−21.49 × 10−2
R20.95790.86350.94430.9494
Pseudo-second-orderqe2 (mg·g−1)69.98115.47153.14166.94
k2 (g·mg−1·min−1)0.98 × 10−30.60 × 10−30.71 × 10−30.70 × 10−3
R20.99570.99290.99940.9984
qe (mg·g−1) 67.43113.25149.25163.00
Table 4. Fitting parameters of intraparticle diffusion model of Cu2+ adsorption.
Concentration
(ppm)
Parameters
Stage 1Stage 2
kp1c1(R1)2kp2c2(R2)2
503.3028.040.94301.6841.440.9649
757.6037.180.66413.1463.180.8781
10011.9851.280.85422.49111.020.9736
1257.1891.680.88683.09116.760.9496
Table 5. Constants of two isotherm models for Cu2+ adsorption by the rGO membrane.
Isotherm ModelConstants25 °C30 °C35 °C
FreundlichkF (mg·g−1 (L·mg−1)−1/n)1.691.460.82
1/n1.021.061.15
R20.98090.98340.9887
TemkinKT (L·mg−1)0.03220.03160.0295
B126.29149.51183.31
R20.94940.97780.9762
Publisher’s Note: MDPI stays neutral with regard to jurisdictional claims in published maps and institutional affiliations.