Article

Determination of Phase Transition and Critical Behavior of the As-Cast GdGeSi-(X) Type Alloys (Where X = Ni, Nd and Pr)

1
Department of Physics, Częstochowa University of Technology, Armii Krajowej 19, 42-200 Częstochowa, Poland
2
Department of Mechanics, Materials and Biomedical Engineering, Wrocław University of Science and Technology, Smoluchowskiego 25, 50-370 Wrocław, Poland
*
Author to whom correspondence should be addressed.
Materials 2021, 14(1), 185; https://doi.org/10.3390/ma14010185
Submission received: 5 December 2020 / Revised: 23 December 2020 / Accepted: 23 December 2020 / Published: 4 January 2021

Abstract

:
The aim of the paper is to present a study of the magnetocaloric effect and the nature of phase transition in the Gd80Ge15Si5 (S1), Gd75Ge15Si5Ni5 (S2), Gd75Ge15Si5Pr5 (S3) and Gd75Ge15Si5Nd5 (S4) alloys. The magnetic entropy changes determined for studied samples, under external magnetic field ~3T, were 11.91, 12.11, 5.08 and 4.71 J/(kg K) for S1, S2, S3 and S4, respectively. The values of refrigerant capacity (under ~3T) were 164, 140, 160 and 140 J/kg for S1, S2, S3 and S4, respectively. The first order phase transition was detected for samples S1 and S2, while specimens S3 and S4 manifested the second order phase transition at the Curie point (TC). The analysis of temperature evolution of the exponent n (ΔSM = C·(Bmax)n) showed the validity of this method in detecting either the first or the second order phase transition and the structural transition. The analysis of critical behavior was carried out for samples S3 and S4. The critical exponents and precise TC values were calculated. The ascertained critical exponents were used to determine the theoretical value of the exponent n, which corresponded well with experimental result.

1. Introduction

Magnetic materials revealing the magnetocaloric effect (MCE) have been intensively studied for over 20 years. The great interest in magnetocaloric materials (MCMs) was started in 1997 after the discovery of a giant MCE in the Gd5Si2Ge2 alloy by Pecharsky and Gschneidner Jr. [1]. The Gd5Ge2Si2 alloy and pure Gd showed a trend of development of MCMs. For more than two decades, many MCMs were produced, such as La(Fe,Si)13-type alloys [2,3], manganites [4,5], Heusler alloys [6,7,8] and many others. Magnetocaloric properties of mentioned alloys are characterized by the first or the second order phase transition (FOPT, SOPT). MCMs manifesting FOPT have a higher degree of both the magnetic entropy change ΔSM and the adiabatic temperature change ΔTad, related to the former value, than materials with SOPT. However, the main advantage of materials with SOPT is the working temperature range. Law and coworkers [9] were of the opinion that an ideal MCM should lay at the borderline between FOPT and SOPT materials. They presented an original approach to the determination of the phase transition based on magnetocaloric data. Hasiak [10] presented results of magnetocaloric measurements for the as-cast GdSiGe alloys modified with Ni and Ce. In our previous work [11], the critical behavior of the GdSiGeCe alloy was studied and the values of critical exponents for the Ce-doped alloy were found to be β = 0.376, γ = 1.032 and δ = 3.385. They were determined using the Kouvel–Fisher technique [12].
The present paper aims to bring forward a study of the character of transition in the GdGeSi-X-type alloys (where X = Pr, Nd, Ni) based on temperature dependences of the exponent n (ΔSMmax = C(Bmax)n). Moreover, for samples revealing SOPT, the Kouvel–Fisher analysis was applied in order to determine critical exponents, and a theoretical value of the exponent n was calculated.

2. Materials and Methods

Samples of nominal composition Gd80Ge15Si5, Gd75Ge15Si5Ni5, Gd75Ge15Si5Pr5 and Gd75Ge15Si5Nd5 (wt.%) were prepared by arc-melting of high purity constituent elements under low pressure of the Ar atmosphere. Samples in the form of tablets with a mass of about 10 g were remelted ten times in order to ensure their homogeneity. In order to compensate evaporation of Gd, an excess amount of 5wt.% of the element was applied. The chemical composition of the produced materials was checked by a scanning electron microscope (SEM, Quanta 250, FEI, Hillsboro, OR, USA) equipped with an energy dispersive X-ray spectroscopy (EDS) detector working in secondary electrons (SE) mode [10,13]. The structure was examined by X-ray diffraction using a Bruker D8 Advance diffractometer (Bruker AXS Gmbh, Karlsruhe, Baden-Wurtemberg, Germany) equipped with a Cu tube and a semiconductor LynxEye detector. According to EDS and X-ray examinations, the chemical composition of the studied samples is close to nominal, and the structure is single-phase. Magnetic measurements were carried out using a Quantum Design VersaLab (Quantum Design, San Diego, CA, USA) cryogen-free vibrating sample magnetometer working in a wide range of temperatures and in magnetic fields up to ~3T. An investigation of phase transition in GdGeSi-based alloys was performed by taking measurements of specific heat capacity versus temperature at zero external magnetic fields within a two-tau model with help of a Physical Properties Measurement System (PPMS) (Quantum Design).
The magnetocaloric effect was investigated indirectly on the basis of field dependences of magnetization recorded over a wide range of temperatures. In order to calculate ΔSM, the thermomagnetic Maxwell’s relation was used [14]:
Δ S M ( T , Δ H ) = μ 0 0 H ( M ( T , H ) T ) H d H
where T, μ0, H and M are temperature, magnetic permeability, magnetic field strength and magnetization, respectively.
The magnetocaloric characterization of studied samples was supplemented by calculations of refrigeration capacity, according to the following relation [15]:
R C ( δ T , H M A X ) = T c o l d T h o t Δ S M ( T , H M A X ) d T ,
where RC is refrigerant capacity, δT = ThotTcold is the temperature range of the thermodynamic cycle (δT corresponds to the full width at half maximum of magnetic entropy change peak), and HMAX is the maximum value of the external magnetic field.
The analysis of phase transition was carried out using Arrott plots and the temperature dependence of the exponent n. The exponent n was found using Franco et al.’s phenomenological relation describing the field dependence of the magnetic entropy change written in the following form [16,17]:
Δ S M max = C ( B M A X ) n ,
where C is a proportionality constant depending on temperature, and n is the exponent related to the magnetic state of the material.
Świerczek [18] proposed a simple modification of the relation (3), which allows determining the exponent n in a direct way:
ln Δ S M max = ln C + n ln ( B max ) .
Linear regression of Equation (4) allowed finding out the exponent n directly from the slope of a straight line. The correlation coefficient ascertained during the present studies was 0.998 or higher.
The critical exponents for samples doped by Pr and Nd were determined using the Kouvel–Fisher technique [19].

3. Results and Discussions

The temperature dependence of heat capacity for the as-cast Gd80Ge15Si5, Gd75Ge15Si5Ni5, Gd75Ge15Si5Pr5 and Gd75Ge15Si5Nd5 (wt.%) alloys measured without an external magnetic field is presented in Figure 1. The Gd80Ge15Si5 and Gd75Ge15Si5Ni5 samples show the well-seen λ shape structural transition corresponding to the first order phase transition (FOPT) with the maxima at either 256 K or 225 K, respectively. For the Pr- and Nd-containing samples, the wide maxima within the temperature range of 220–280 K were observed. Decomposition of these curves within the mentioned temperature range leads to the distinction of three components with their maxima at different temperature values. This behavior seems to be related to the multiphase structure of the Gd75Ge15Si5Pr5 and Gd75Ge15Si5Nd5 alloys.
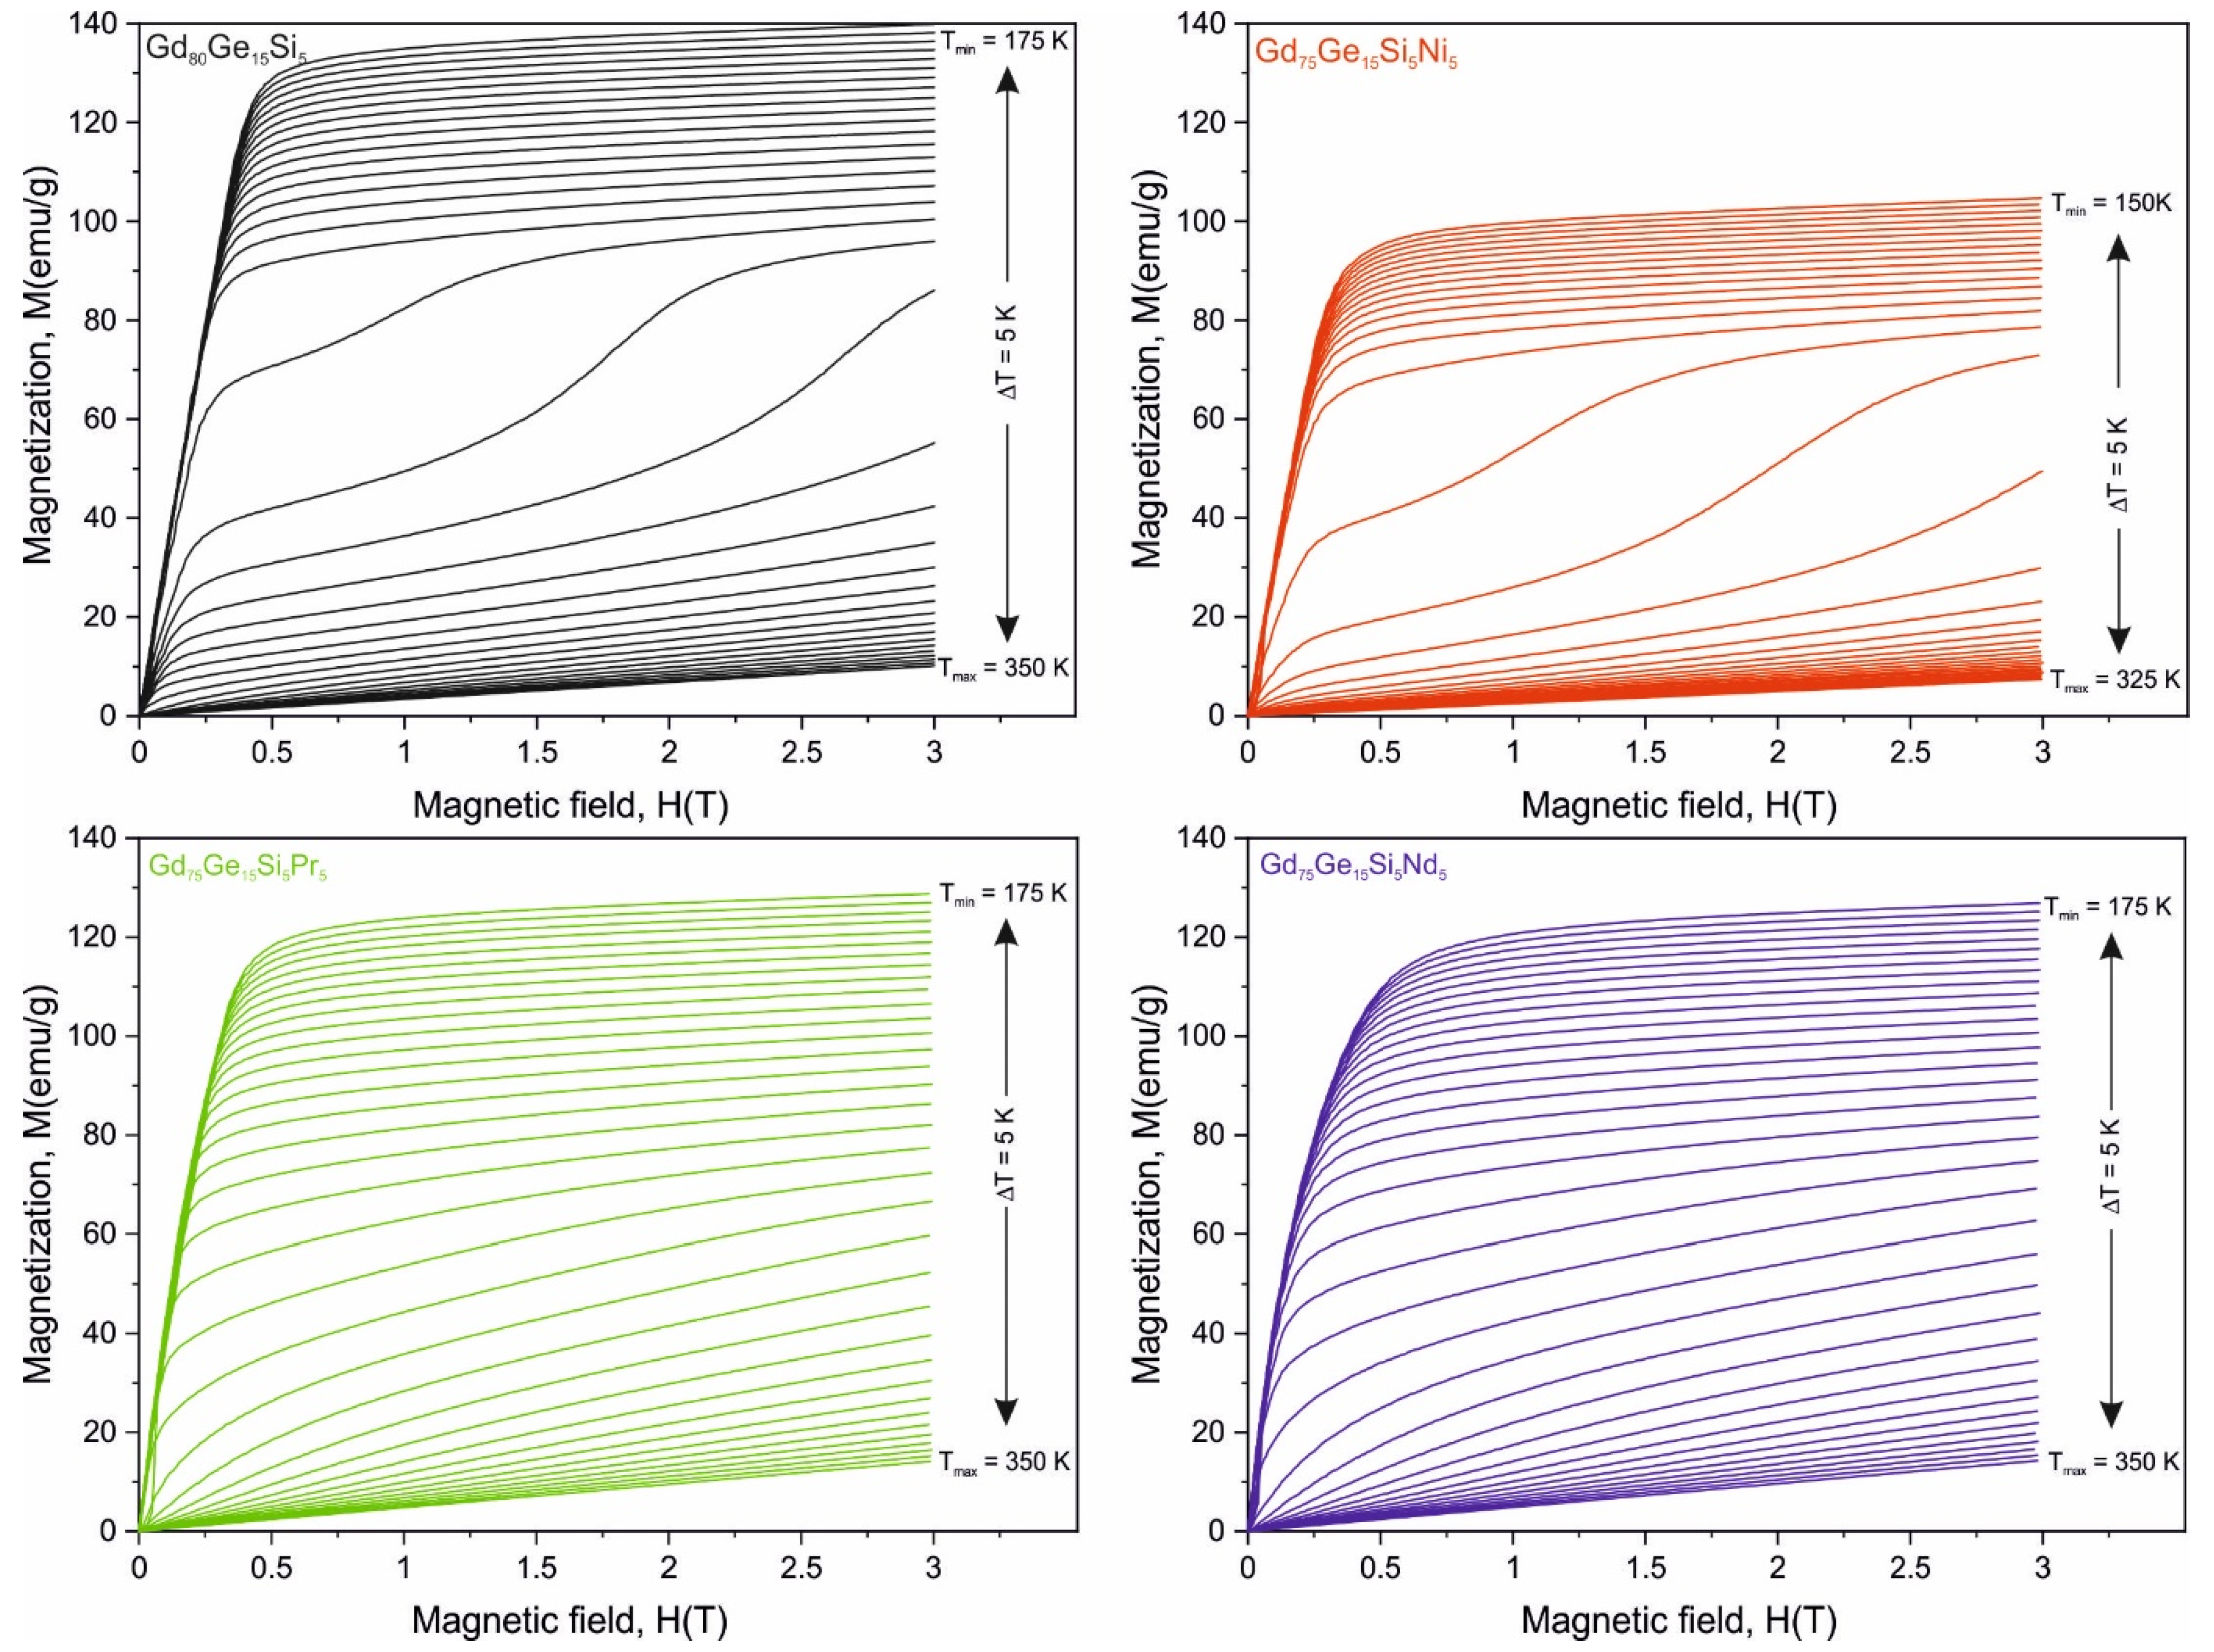
The isothermal magnetization curves M(H) recorded for all investigated alloys in the vicinity of the Curie temperature (TC) specific for each alloy (within the temperature range TC ± 50 K) with the step of 5 K for external magnetic fields up to 3 T are shown in Figure 2. All these M(H) curves show typical ferromagnetic character below TC, whereas only the linear dependence on temperature, distinctive for the paramagnetic state, was observed above the Curie point. It can be easily seen, however, that the Gd80Ge15Si5 and Gd75Ge15Si5Ni5 samples show different M(H) behavior in the vicinity of the Curie point than the samples with the addition of Pr and Ni. The surface area between two adjacent curves recorded with the step of T = 5 K for either the Gd80Ge15Si5 or the Gd75Ge15Si5Ni5 alloy near TC is several times larger than the corresponding one obtained for the samples containing either Pr or Nd. This behavior is strictly related to the occurrence of the first order phase transition in the formerly mentioned pair of alloys, which is also confirmed in Figure 1. The M(H) data together with results presented in Figure 1 clearly suggest that the Gd75Ge15Si5Pr5 and Gd75Ge15Si5Nd5 alloys close to Curie point show the second order phase transition.
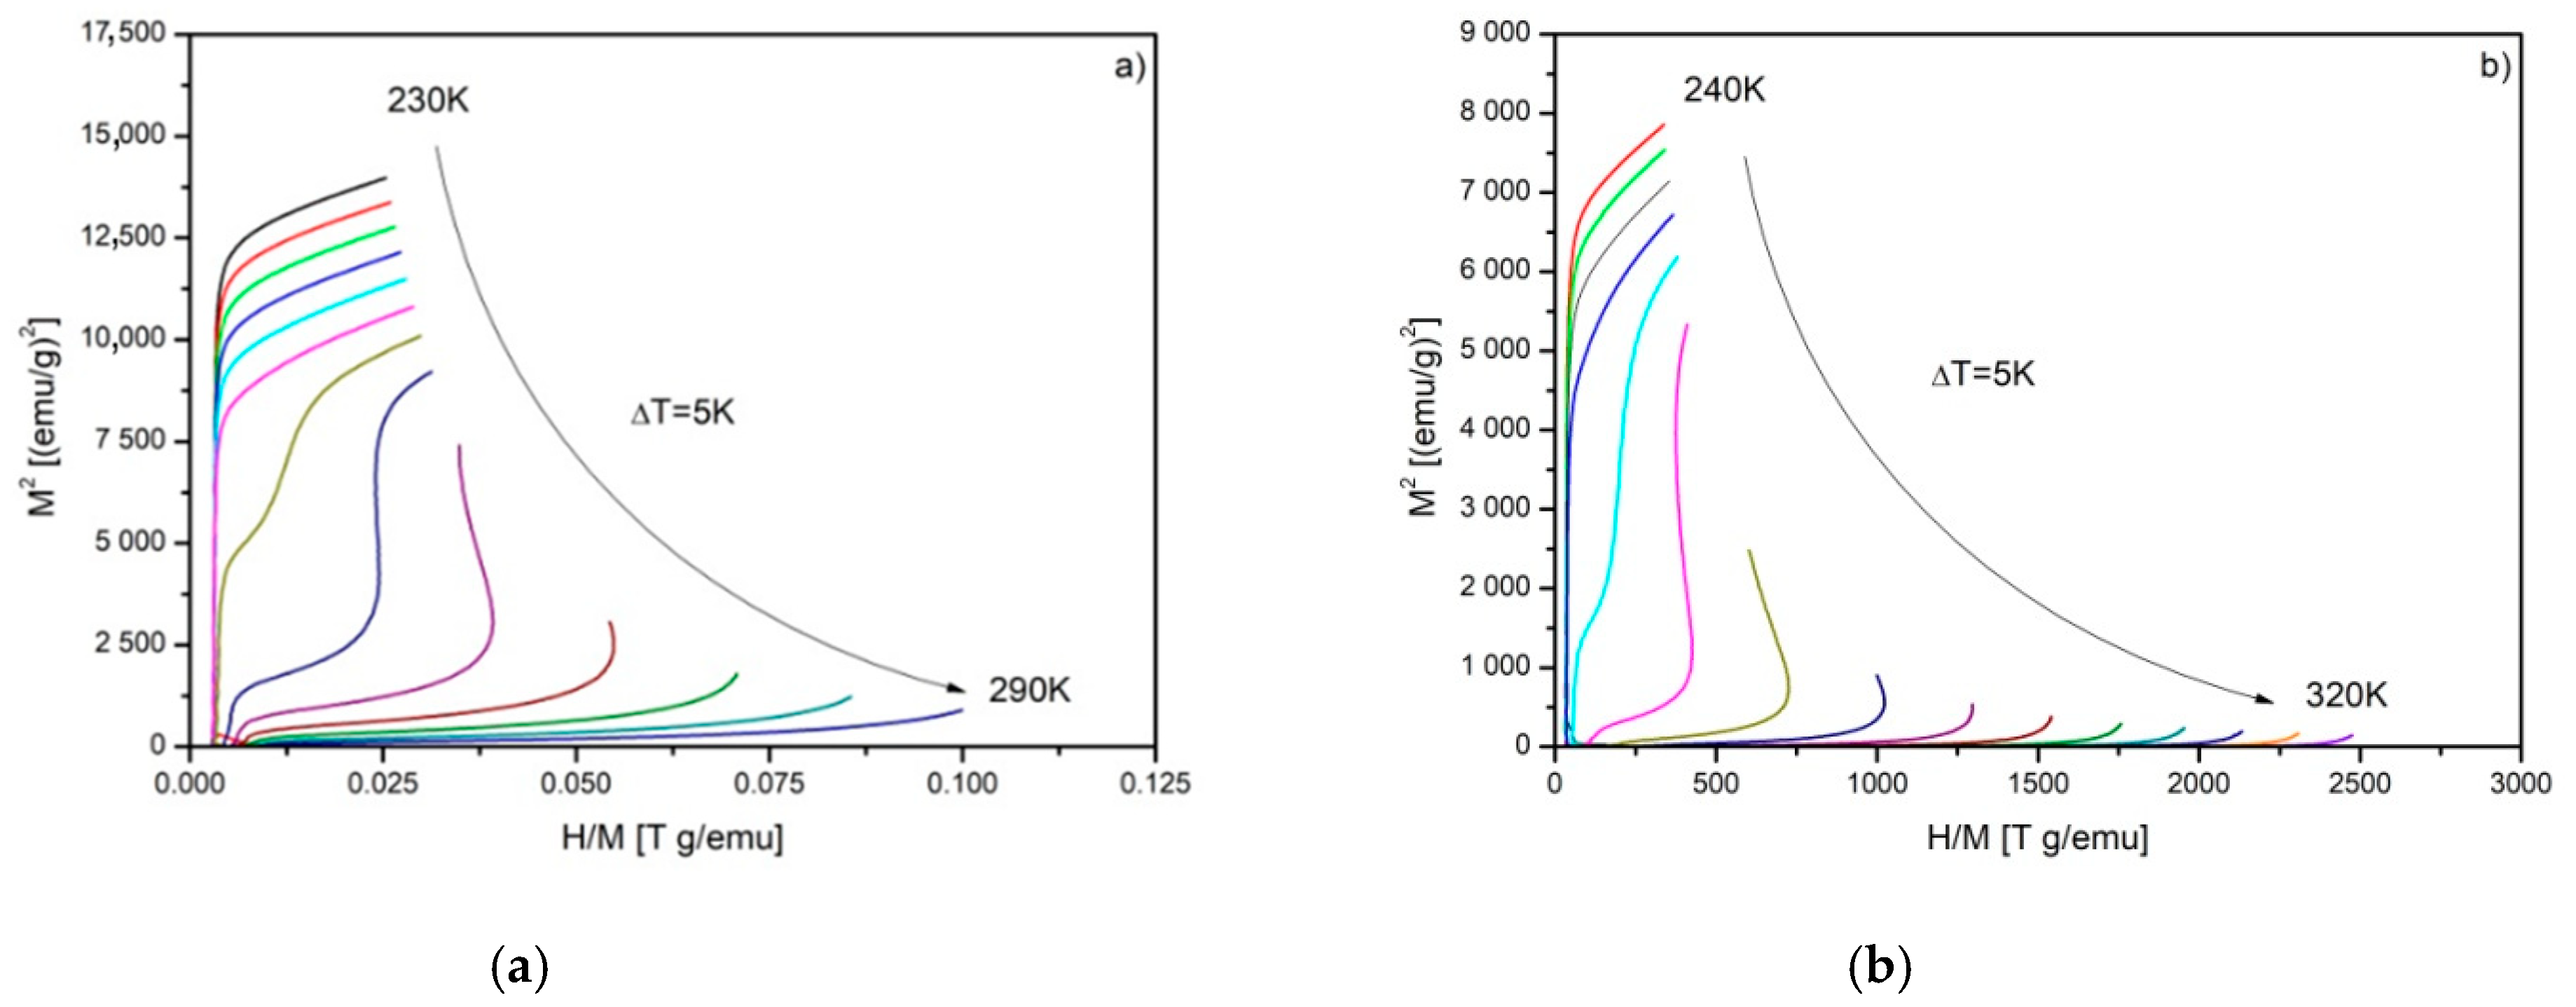
The ΔSM vs. T curves calculated for Gd80Ge15Si5, Gd75Ge15Si5Ni5, Gd75Ge15Si5Pr5 and Gd75Ge15Si5Nd5 are depicted in Figure 3. The ΔSM curves obtained for Gd80Ge15Si5 and Gd75Ge15Si5Ni5 alloys were presented previously elsewhere [10]; however, they are mentioned here once more for the purpose of further analysis. The highest values of ΔSM were achieved for Gd80Ge15Si5 and Gd75Ge15Si5Ni5 alloys, and they were equal to 11.91 and 12.11 J/kg·K, respectively. The characteristic asymmetric shape, typical for materials with FOPT, can be noticed in Figure 3a,b. The “caret” shape was detected in the case of other samples, being a marker of SOPT. The values of ΔSM and RC are collected in Table 1. It is clearly seen that the values of the RC revealed for all studied materials are almost the same. In order to start the analysis of the nature of phase transitions, the Arrott plots were constructed for all specimens (Figure 4).
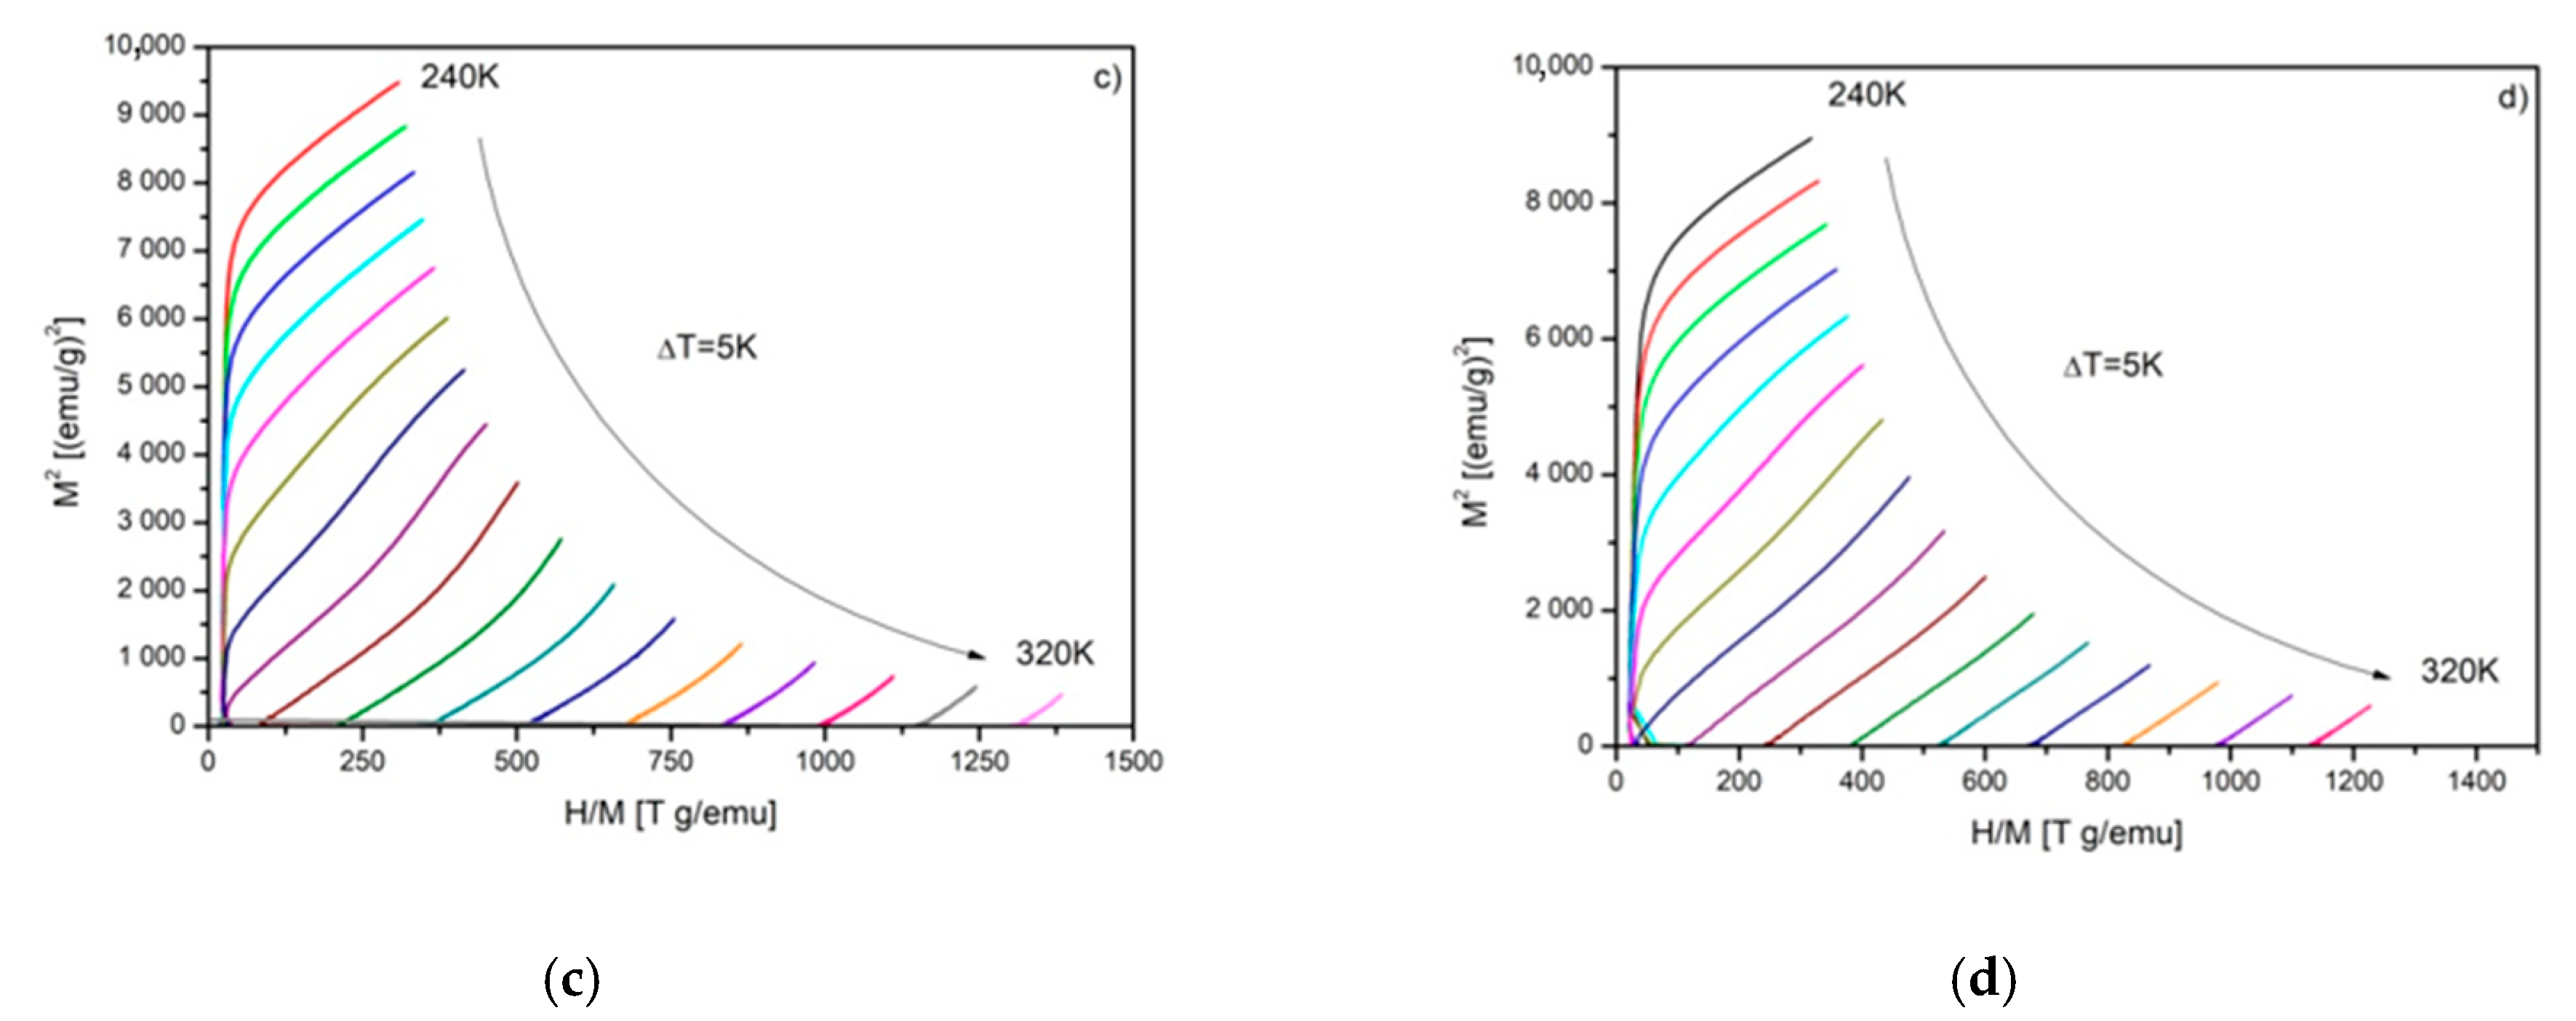
The Banerjee criterion [19] of the nature of phase transition based on the slope of Arrott plots provides the preliminary interpretation of results. The Gd80Ge15Si5 and Gd75Ge15Si5Ni5 alloy samples manifest the FOPT in the vicinity of the Curie temperature TC, due to the characteristic “s-shape” of the Arrott plots in that temperature region. In the case of samples doped with Pr and Nd, a monotonic increase is observed. The positive slope of the Arrott plots depicted in Figure 4c,d suggests an occurrence of the SOPT in these samples.
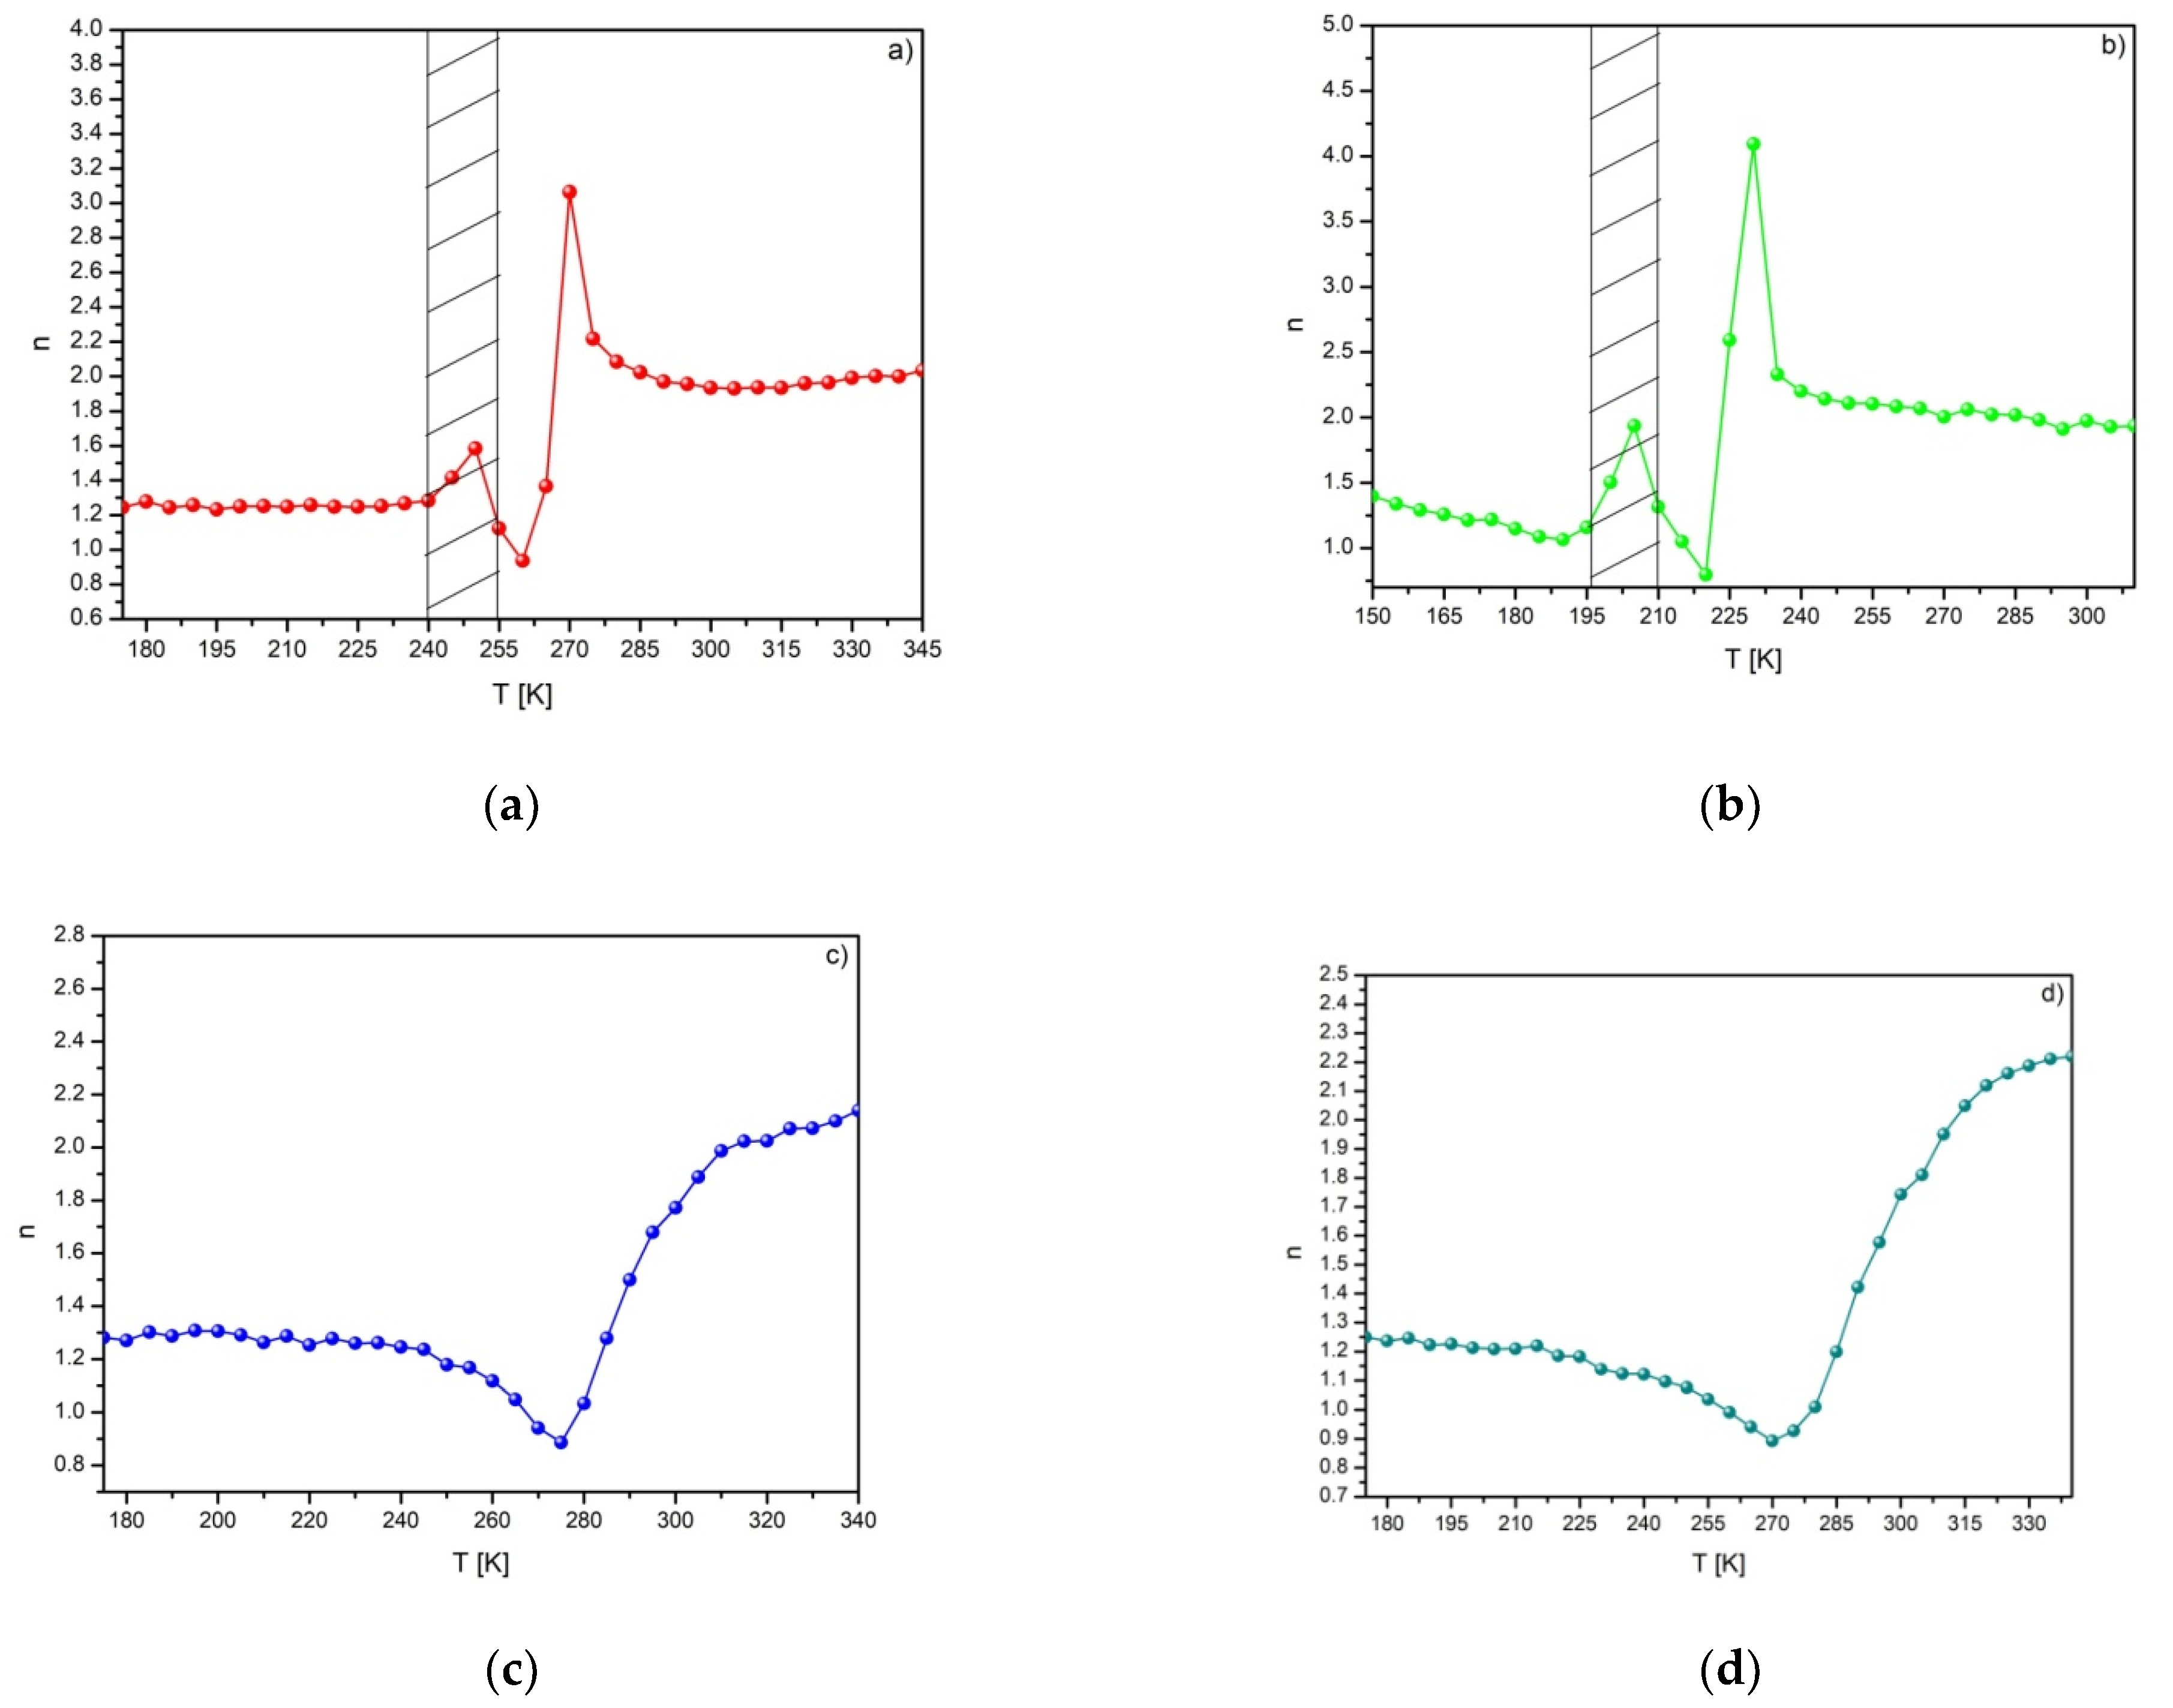
Further analysis based on the temperature dependence of the exponent n was determined from Equation (3). The n vs. T curves are shown in Figure 5. As was shown in [16,17], the value of the exponent n is strongly dependent on the magnetic state of the sample. Provided that materials obey the Curie–Weiss law, the exponent n takes the value of either 1 or 2 for either the ferro- or the paramagnetic state, respectively. At the Curie point, however, the exponent n is related with values of critical exponents, according to the following relation [16,17]:
n = 1 + 1 δ ( 1 1 β )
where β and δ are critical exponents.
Taking into account the critical exponents delivered by Landau mean field theory (β = 0.5, γ = 1, δ = 3) and the Relation (5), n equals to 2/3. It is worth remembering that the mean field theory describes materials with SOPT. However, Law and coworkers showed different behavior of the temperature evolution of the exponent n [9]. They demonstrated, on the basis of the Bean–Rodbell model, that it is possible to identify not only the SOPT, but also the FOPT and the structural transformation. They reported the characteristic peak just before the Curie point for the Ni-Mn-In-Co Heusler alloy and related it to the martensitic-austenitic transition. The temperature dependences of the exponent n found for the Gd80Ge15Si5 and the Gd75Ge15Si5Ni5 alloys reveal the characteristic jump of the exponent n in the vicinity of the TC and the similar characteristic peak before the TC. It can be related to the transformation from monoclinic to orthorhombic structure induced in the GdGeSi-type alloys by the magnetic field [20].
The observed peak values of the exponent n (marked by the dashed area in Figure 5a,b) correspond to the structural transition. The temperature behavior of exponent n in the case of specimens modified by Pr and Nd is typical for materials with SOPT (Figure 5c,d). The values of the exponent calculated in the vicinity of the TC are 0.8863 and 0.8933 for Gd80Ge15Pr5 and Gd75Ge15Si5Nd5 alloys, respectively.
The confirmation of the occurrence of the SOPT in both the Gd75Ge15Si5Pr5 and the Gd75Ge15Si5Nd5 alloy samples allowed conducting research on the critical phenomena in the region of magnetic phase transition. The Arrott plots presented in Figure 4c,d are almost straight lines. These data (Arrott plots) and linear regression were used for the determination of both the spontaneous magnetization MS and the inverse susceptibility 1/χ.
The SOPT is described by a system of critical exponents. The evolution of spontaneous magnetization MS, inverse susceptibility 1/χ and isothermal magnetization at TC are strongly related to critical exponents β, γ and δ, respectively. These relations in the mathematical form are as follows [21]:
M S ( T ) = M 0 ( ε ) β ,   ε < 0 ,   T < T C ,
χ 0 ( T ) 1 = ( H 0 M 0 ) ε γ ,   ε > 0 ,   T > T C ,
M = D H 1 δ ,   ε = 0 ,   T = T C ,
where ε = (TTC)/TC means the reduced temperature, M0, H0 and D are critical amplitudes, H is the applied field and M is magnetization.
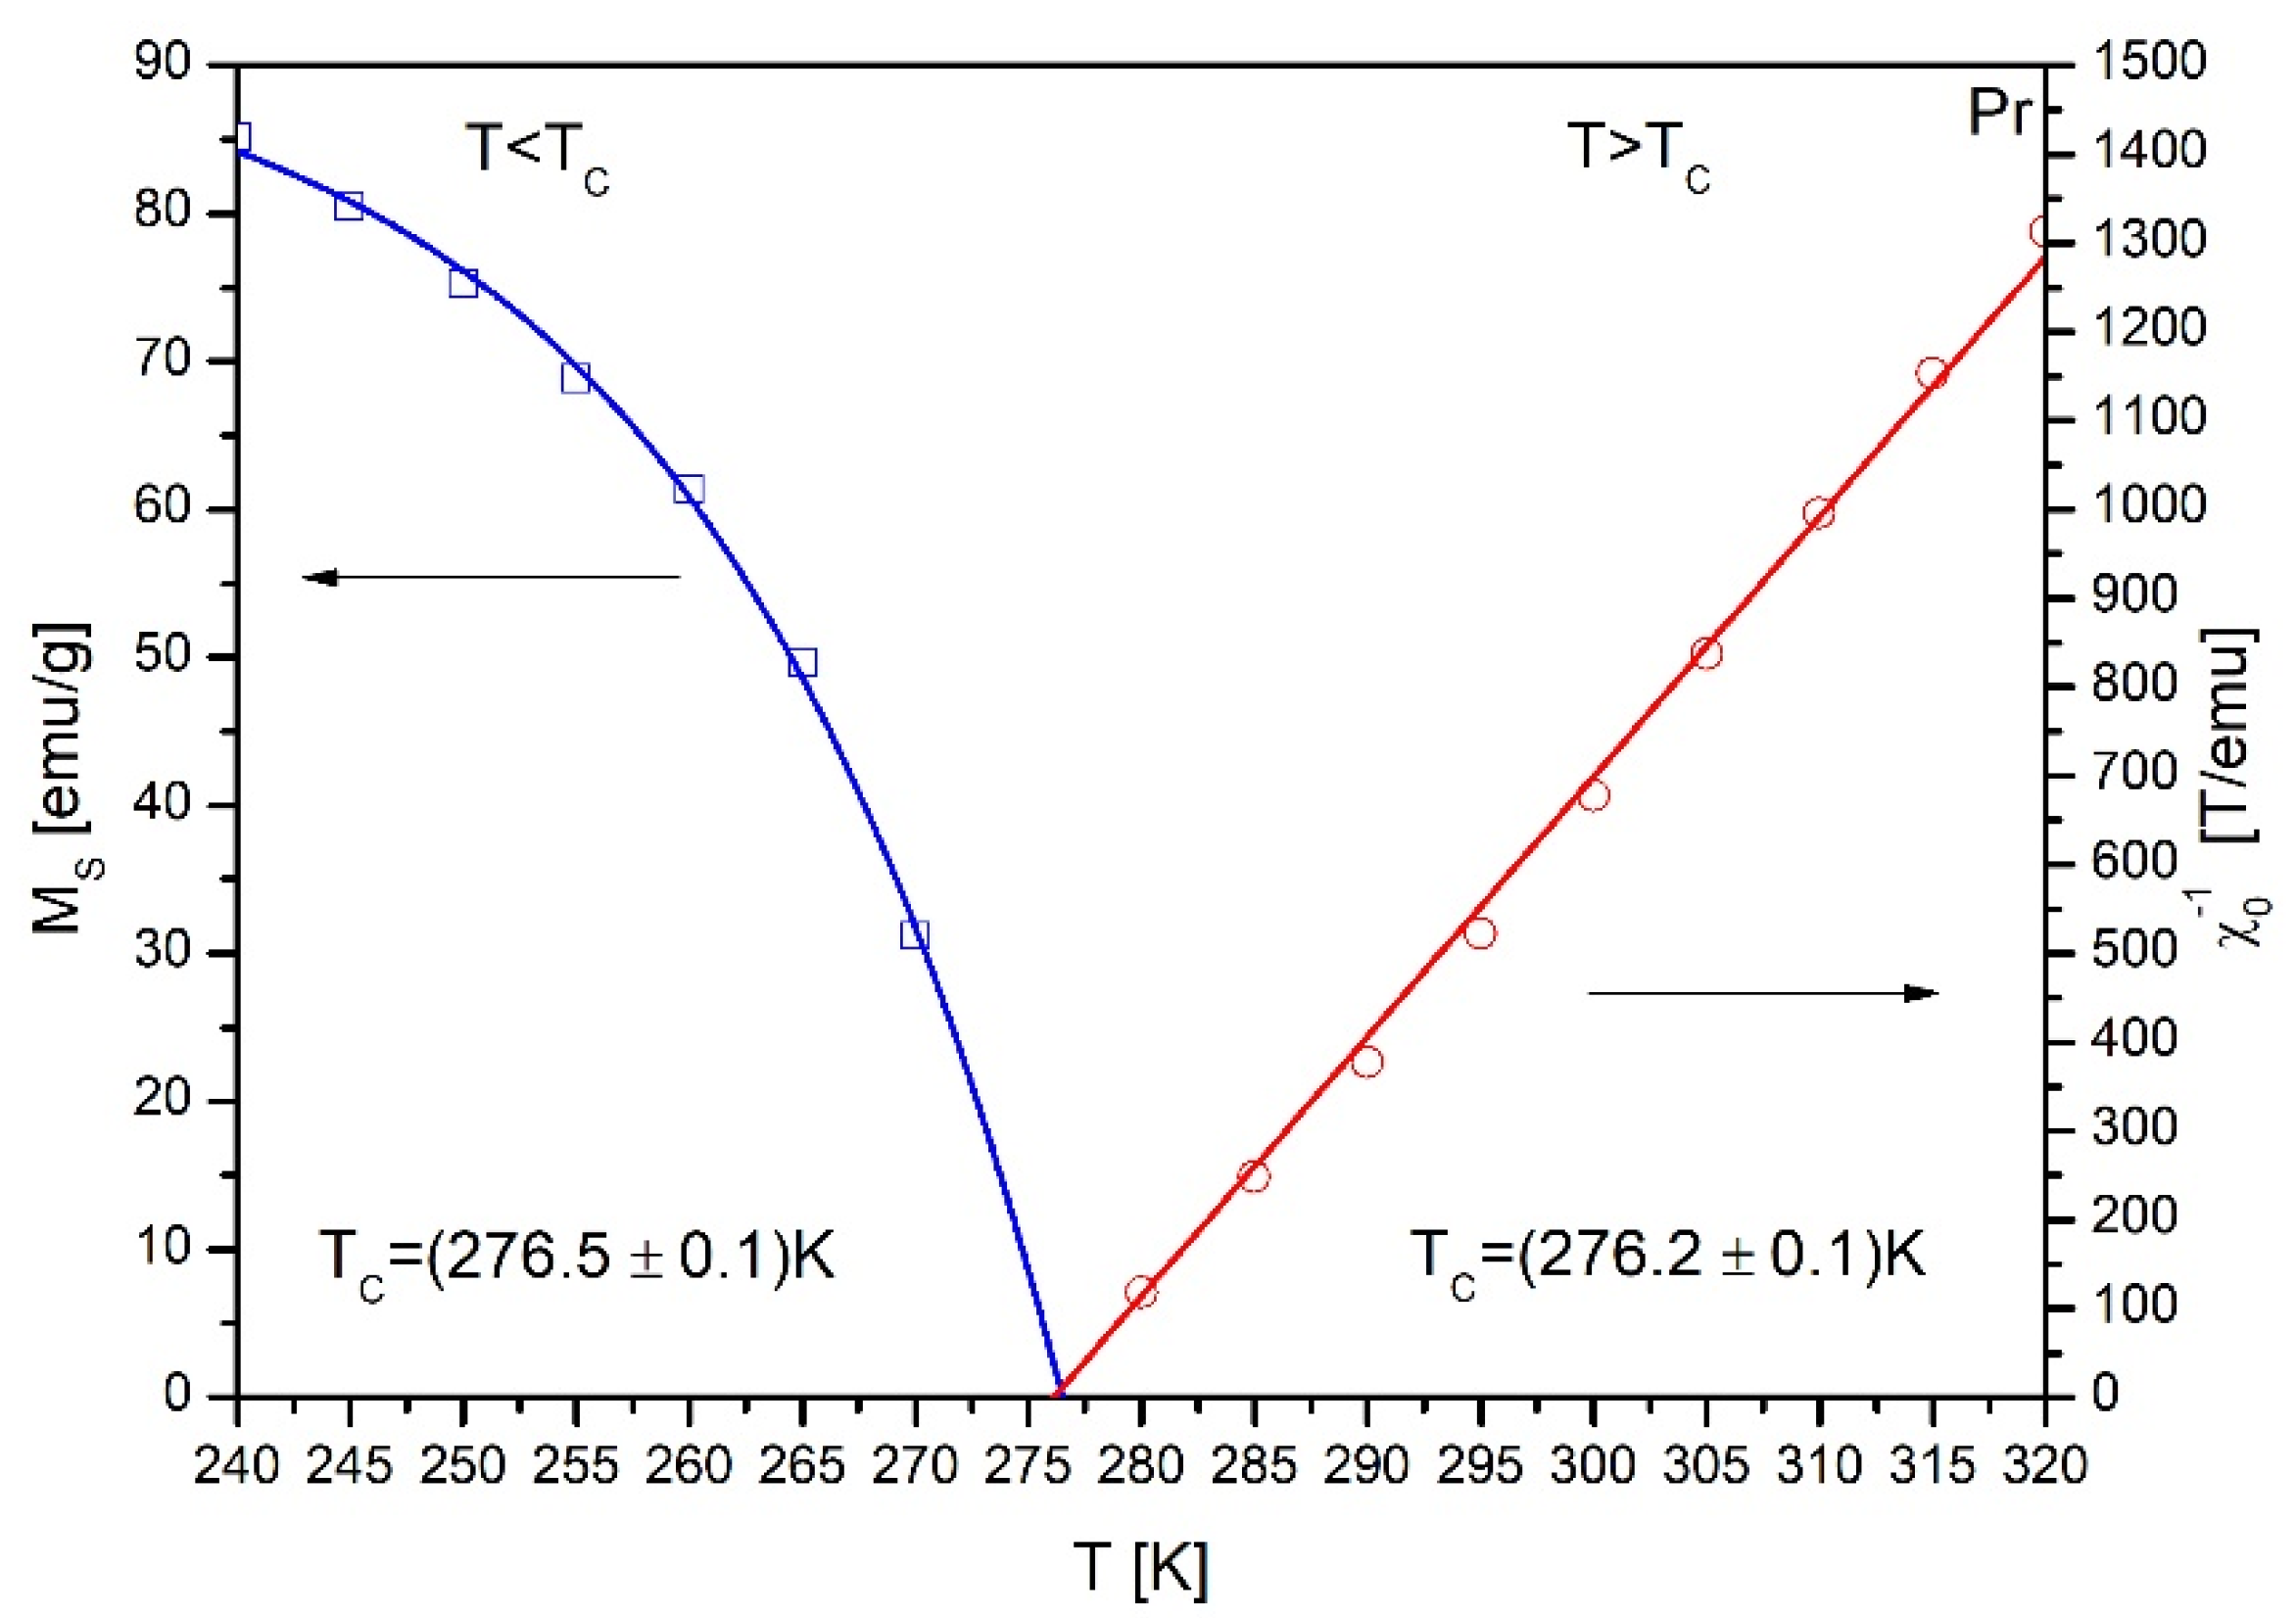
The linear extrapolation of the M2 vs. 1/χ isotherms allowed determining both the spontaneous magnetization MS and the inverse initial susceptibility 1/χ. The temperature dependences of MS and 1/χ are shown in Figure 6. These plots allowed us to determine a more precise value of the Curie temperature, which equals to either 276.5 or 276.2K for either T < TC or T > TC range, respectively.
Kouvel and Fisher [12] proposed a method for calculation of the critical exponents based on a simple modification of Relations (6) and (7). According to the Kouvel–Fisher technique, these equations were rewritten in the following form:
M S ( T ) d M S ( T ) d T = T T C β ,
χ 0 1 ( T ) d χ 0 1 ( T ) d T = T T C γ .
Such simple linearization with slopes 1/β and 1/γ allowed revealING values β and γ by linear fitting of Kouvel–Fisher plots (Figure 7). Moreover, these plots delivered the most precise information about the Curie temperature.
The values of critical exponents β and γ determined by Kouvel-Fisher plots were equal to 0.353 and 1.174, respectively. Such results correspond well with critical exponents delivered by other researchers [11,22,23].
The last critical exponent δ was calculated from the Widom scaling relation [24]:
δ = 1 + γ β .
Inserting the already calculated values of β and γ to Equation (11), one can find δ to be 4.326. Independently, the value of δ was also determined using Equation (8) rewritten in the following form:
ln M = ln D + 1 δ ln H .
The field dependence of magnetization (M vs. H) in the vicinity of TC in the log–log scale is depicted in Figure 8. Since the Curie temperature determined by Kouvel–Fisher plots was found to be 276.2 K, the curve recorded at 275 K was selected for analysis as the closest approximation. The linear fitting delivered information about δ being equal to 4.252. Such a value corresponds well with the one calculated from the Widom relation.
The validation of calculated critical exponents (β, γ and δ) was performed using the magnetic equation of state [25]:
M ( H , ε ) = ε β f ± ( H ε β + γ ) ,
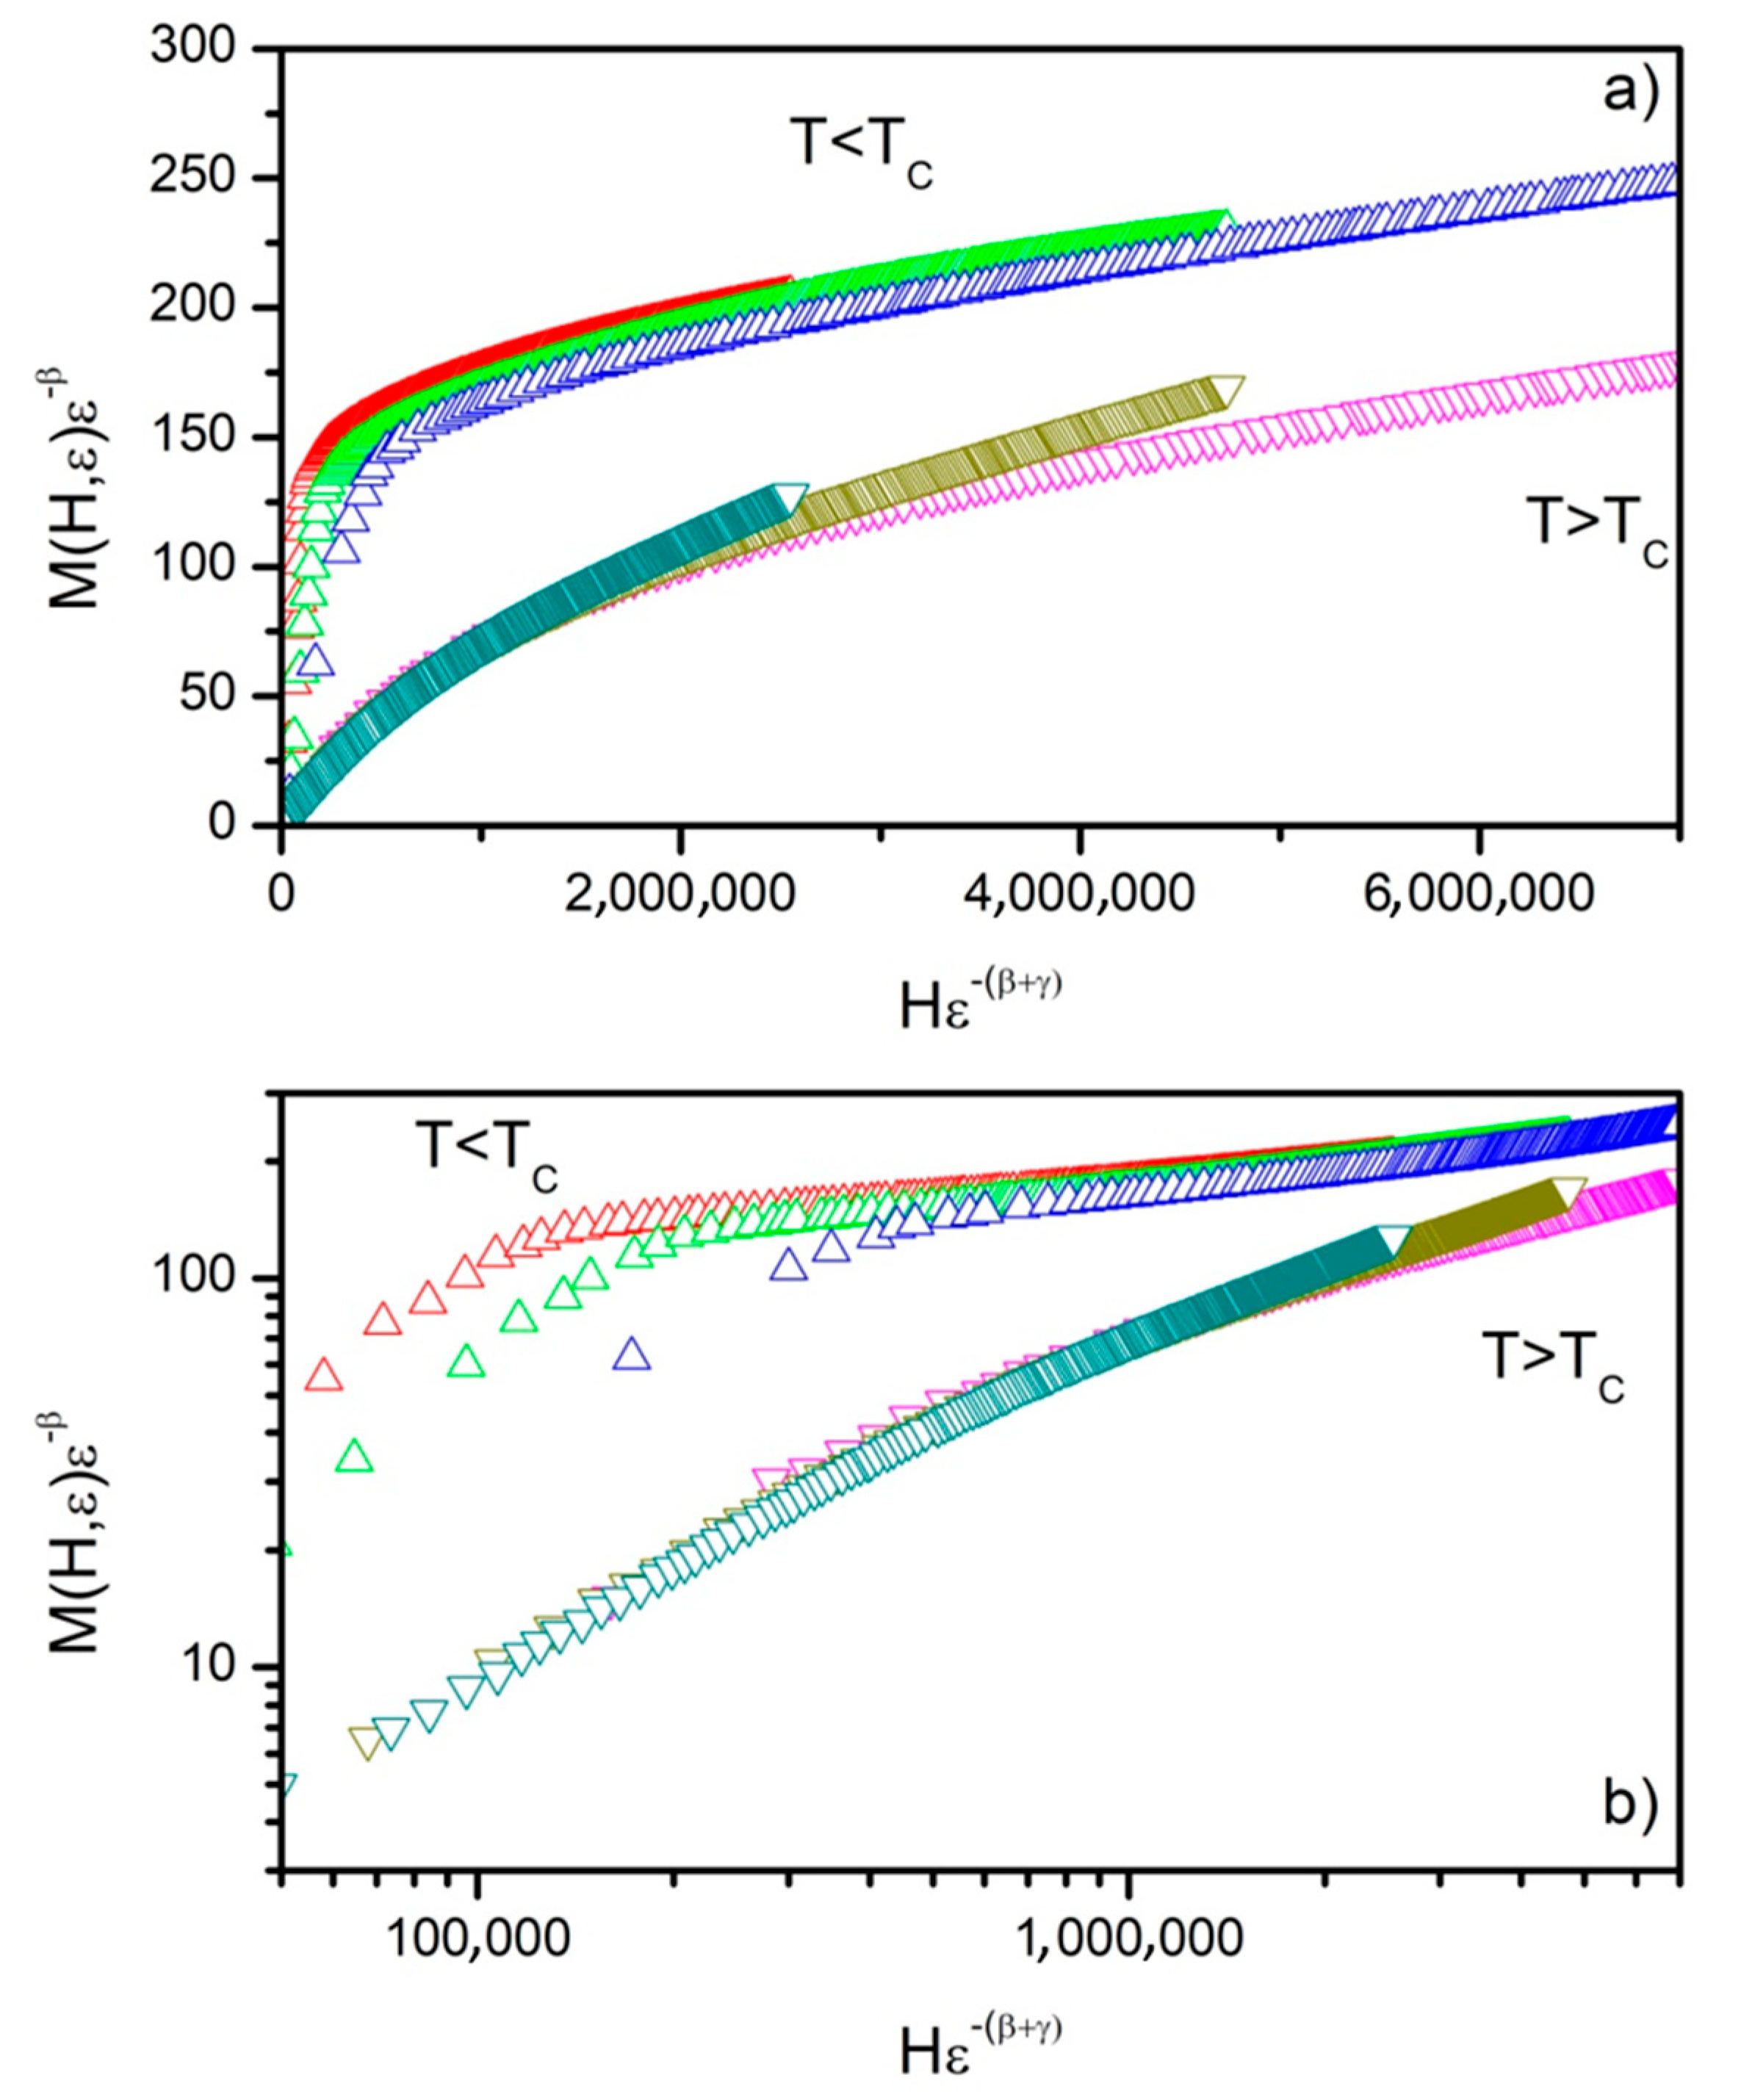
where f± are regular functions, f+ being the one valid for the paramagnetic region (T > TC), while f holds for the ferromagnetic one (T < TC). Formula (13) expresses the dependence between M(H,ε) ε−β and H ε−(β + γ) in the form of two curves. One of them is observed for temperature values lower than TC (ferromagnetic state) and the second one for temperature values higher than TC (paramagnetic state). According to Equation (13), the M vs. H data should collapse into two independent universal curves. The calculated critical exponents were used to construct the M vs. H plots depicted in Figure 9a. It can be noticed that the curves recorded for temperature values beneath the Curie point actually collapse into one universal curve, while the ones achieved for temperature values exceeding the TC collapse into the second one. The same data are depicted in the log–log scale in Figure 9b.
Such behavior confirms the validity of the determined critical exponents and proves that the Curie point is dependable. The exponents are in good agreement with the scaling hypothesis. The same procedure was applied for data achieved for the Gd75Ge15Si5Nd5 alloy. The values of the calculated critical exponents are collected in Table 2.
Taking into account Relation (5) and the determined critical exponents, the theoretical value of the exponent n for the Gd75Ge15Si5Pr5 alloy was calculated. This theoretical value was determined in two ways: first on the basis of the experimentally found value of δ and then from the value delivered by Widom scaling relation, and it was found to be either 0.8716 or 0.8739, respectively. In the case of sample doped with Nd, the theoretical values of the exponent n are also collected in Table 2, along with the critical exponents reported by other authors, which were used to determine the theoretical value of the exponent n.
The critical exponent γ determined for the Gd75Ge15Si5Pr5 and Gd75Ge15Si5Nd5 alloys corresponds well with the mean field theory. In the case of β, its value is closer to β from the 3D-Heisenberg model. As in the case of results published previously for the Gd75Ge15Si5Ce5 alloy [11], it is difficult to distinguish which model correctly describes magnetism in the produced alloys. The value of the exponent n found for samples modified with either Pr or Nd is in agreement with values delivered by analysis of magnetocaloric data.

4. Conclusions

Investigations on the magnetocaloric effect and the nature of phase transition in the Gd80Ge15Si5, Gd75Ge15Si5Ni5, Gd75Ge15Si5Pr5 and Gd75Ge15Si5Nd5 alloys were described in the present paper. The highest magnetic entropy change of similar value was measured for the Gd80Ge15Si5 and Gd75Ge15Si5Ni5 alloys. Further, the occurrence of either the FOPT or the SOPT was detected in the investigated materials by means of heat capacity measurements, the Arrott plots and the techniques employing temperature dependences of the exponent n. The characteristic peaks in the n vs. T curves (constructed for the Gd80Ge15Si5 and the Gd75Ge15Si5Ni5 alloys) correspond with the structural transitions occurring in the vicinity of the Curie temperature. In the case of samples doped with Pr and Nd, the same techniques confirmed the occurrence of SOPT at the TC. These results were confirmed by investigations on temperature dependence of the heat capacity of the examined alloys. Then, the critical behavior in the vicinity of TC was studied, resulting in the precise values of the Curie point for each alloy and the values of critical exponents. Subsequently, the theoretical value of the exponent n was determined on the basis of calculated critical exponents. It was found to correspond well with the experiments.

Author Contributions

Conceptualization, P.G. and M.H.; methodology, P.G.; validation, P.G. and M.H.; formal analysis, P.G. and M.H.; investigation, P.G. and M.H.; writing—original draft preparation, P.G. and M.H.; writing—review and editing, P.G. and M.H.; visualization, P.G. and M.H.; supervision, P.G.; funding acquisition, P.G. All authors have read and agreed to the published version of the manuscript.

Funding

This research received no external funding.

Acknowledgments

P.G. would like to thank Jan Świerczek, the Head of Department of Physics Częstochowa University of Technology, for financial support.

Conflicts of Interest

The authors declare no conflict of interest.

References

  1. Pecharsky, V.K.; Gscheidner, K.A., Jr. Tunable magnetic regenerator alloys with a giant magnetocaloric effect for magnetic refrigeration from ~20 to 290 K. Appl. Phys. Lett. 1997, 70, 3299–3301. [Google Scholar] [CrossRef]
  2. Liu, X.B.; Altounian, Z. Effect of Co content on magnetic entropy change and structure of La(Fe1−xCox)11.4Si1.6. J. Magn. Magn. Mater. 2003, 264, 209–213. [Google Scholar] [CrossRef]
  3. Gębara, P.; Pawlik, P. Broadening of temperature working range in magnetocaloric La(Fe,Co,Si)13- based multicomposite. J. Magn. Magn. Mater. 2017, 442, 145–151. [Google Scholar] [CrossRef]
  4. Moran, O.; Gomez, A.; Supelano, I.; Parra, C.A.; Izquierdo, J.L. Assessment of the critical behavior near the FM to PM phase transition in nano-crystalline La0.7Ca0.3Mn1−xNixO3 (x=0, 0.02, 0.07, 0.1) samples synthesized by auto-combustion. J. Magn. Magn. Mater. 2019, 477, 22–26. [Google Scholar] [CrossRef]
  5. Samantaray, B.; Ravi, S.; Perumal, A. Critical behavior studies in ferromagnetic (Nd, K)–Mn–O compounds. J. Magn. Magn. Mater. 2010, 322, 3391–3395. [Google Scholar] [CrossRef]
  6. Leitao, V.B.; van der Haar, M.; Lefering, A.; Brück, E. Magnetic and Magnetocaloric Exploration of Fe rich (Mn,Fe)2(P,Ge). J. Magn. Magn. Mater. 2013, 344, 49–54. [Google Scholar] [CrossRef] [Green Version]
  7. Gębara, P.; Śniadecki, Z. Structure, magnetocaloric properties and thermodynamic modeling of enthalpies of formation of (Mn,X)-Co-Ge (X = Zr, Pd) alloys. J. All. Compd. 2019, 796, 153–159. [Google Scholar]
  8. Gębara, P.; Kutynia, K. Magnetocaloric Effect in Annealed (Mn,W)-Co-Ge Alloy. Acta Phys. Pol. A 2019, 135, 298–300. [Google Scholar]
  9. Law, J.Y.; Franco, V.; Moreno-Ramirez, L.M.; Conde, A.; Karpenkov, D.Y.; Radulov, I.; Skokov, K.P.; Gutfleisch, O. A quantitative criterion for determining the order of magnetic phase transitions using the magnetocaloric effect. Nat. Commun. 2018, 9, 2680. [Google Scholar] [CrossRef]
  10. Hasiak, M. Microstructure and magnetocaloric effect in as-quenched GdGeSi alloys with addition of Ni and Ce. Phys. Stat. Sol. A. 2016, 213, 1130–1137. [Google Scholar] [CrossRef]
  11. Gębara, P.; Hasiak, M. Investigation of Critical Behavior in Gd75Ge15Si5Ce5 Alloy. Acta Phys. Pol. A 2017, 131, 1232–1235. [Google Scholar] [CrossRef]
  12. Kouvel, J.S.; Fisher, M.E. Detailed Magnetic Behavior of Nickel Near its Curie Point. Phys. Rev. 1964, 136, A1626. [Google Scholar] [CrossRef]
  13. Hasiak, M. Microstructure and Thermomagnetic Properties of As-Quenched Gd75Ge15Si5Pr5 Alloy. Acta Phys. Pol. A 2018, 133, 684–687. [Google Scholar] [CrossRef]
  14. Pecharsky, V.K.; Gschneidner, K.A., Jr. Magnetocaloric effect and magnetic refrigeration. J. Magn. Magn. Mater. 1999, 200, 44–56. [Google Scholar] [CrossRef]
  15. Wood, M.E.; Potter, W.H. General analysis of magnetic refrigeration and its optimization using a new concept: Maximization of refrigerant capacity. Cryogenics 1985, 25, 667–683. [Google Scholar] [CrossRef]
  16. Franco, V.; Blazquez, J.S.; Conde, A. The influence of Co addition on the magnetocaloric effect of Nanoperm-type amorphous alloys. J. Appl. Phys. 2006, 100, 064307. [Google Scholar] [CrossRef]
  17. Franco, V.; Conde, C.F.; Conde, A.; Kiss, L.F. A constant magnetocaloric response in FeMoCuB amorphous alloys with different Fe/B ratios. J. Appl. Phys. 2007, 101, 093903. [Google Scholar] [CrossRef]
  18. Świerczek, J. Superparamagnetic behavior and magnetic entropy change in partially crystallized Fe–Mo–Cu–B alloy. Phys. Status Solidi A 2014, 211, 1567–1576. [Google Scholar] [CrossRef]
  19. Banerjee, S.K. On a generalised approach to first and second order magnetic transitions. Phys. Lett. 1964, 12, 16. [Google Scholar] [CrossRef]
  20. Brück, E. Developments in magnetocaloric refrigeration. J. Phys. D: Appl. Phys. 2005, 38, R381–R391. [Google Scholar]
  21. Fisher, M.E. The theory of equilibrium critical phenomena. Rep. Prog. Phys. 1967, 30, 615. [Google Scholar] [CrossRef]
  22. Deschizeax, M.N.; Delevey, G. Équation magnétique d’état du gadolinium au voisinage du point de Curie. J. Phys. France 1971, 32, 319. [Google Scholar] [CrossRef]
  23. Franco, V.; Conde, A.; Provenzano, V.; Shull, R.D. Scaling analysis of the magnetocaloric effect in Gd5Si2Ge1.9X0.1 (X=Al, Cu, Ga, Mn, Fe, Co). J. Magn. Magn. Mater. 2010, 322, 218. [Google Scholar] [CrossRef]
  24. Widom, B. Equation of State in the Neighborhood of the Critical Point. J. Chem. Phys. 1965, 43, 3898. [Google Scholar] [CrossRef]
  25. Arrott, A.; Noakes, J.E. Approximate Equation of State for Nickel Near Its Critical Temperature. Phys. Rev. Lett. 1967, 19, 786. [Google Scholar] [CrossRef]
  26. Kim, D.; Revaz, B.; Zink, B.L.; Hellman, F.; Rhyme, J.J.; Mitchell, J.F. Tricritical point and the doping dependence of the order of the ferromagnetic phase transition of La1−xCaxMnO3. Phys. Rev. Lett. 2002, 89, 227202. [Google Scholar] [CrossRef] [PubMed] [Green Version]
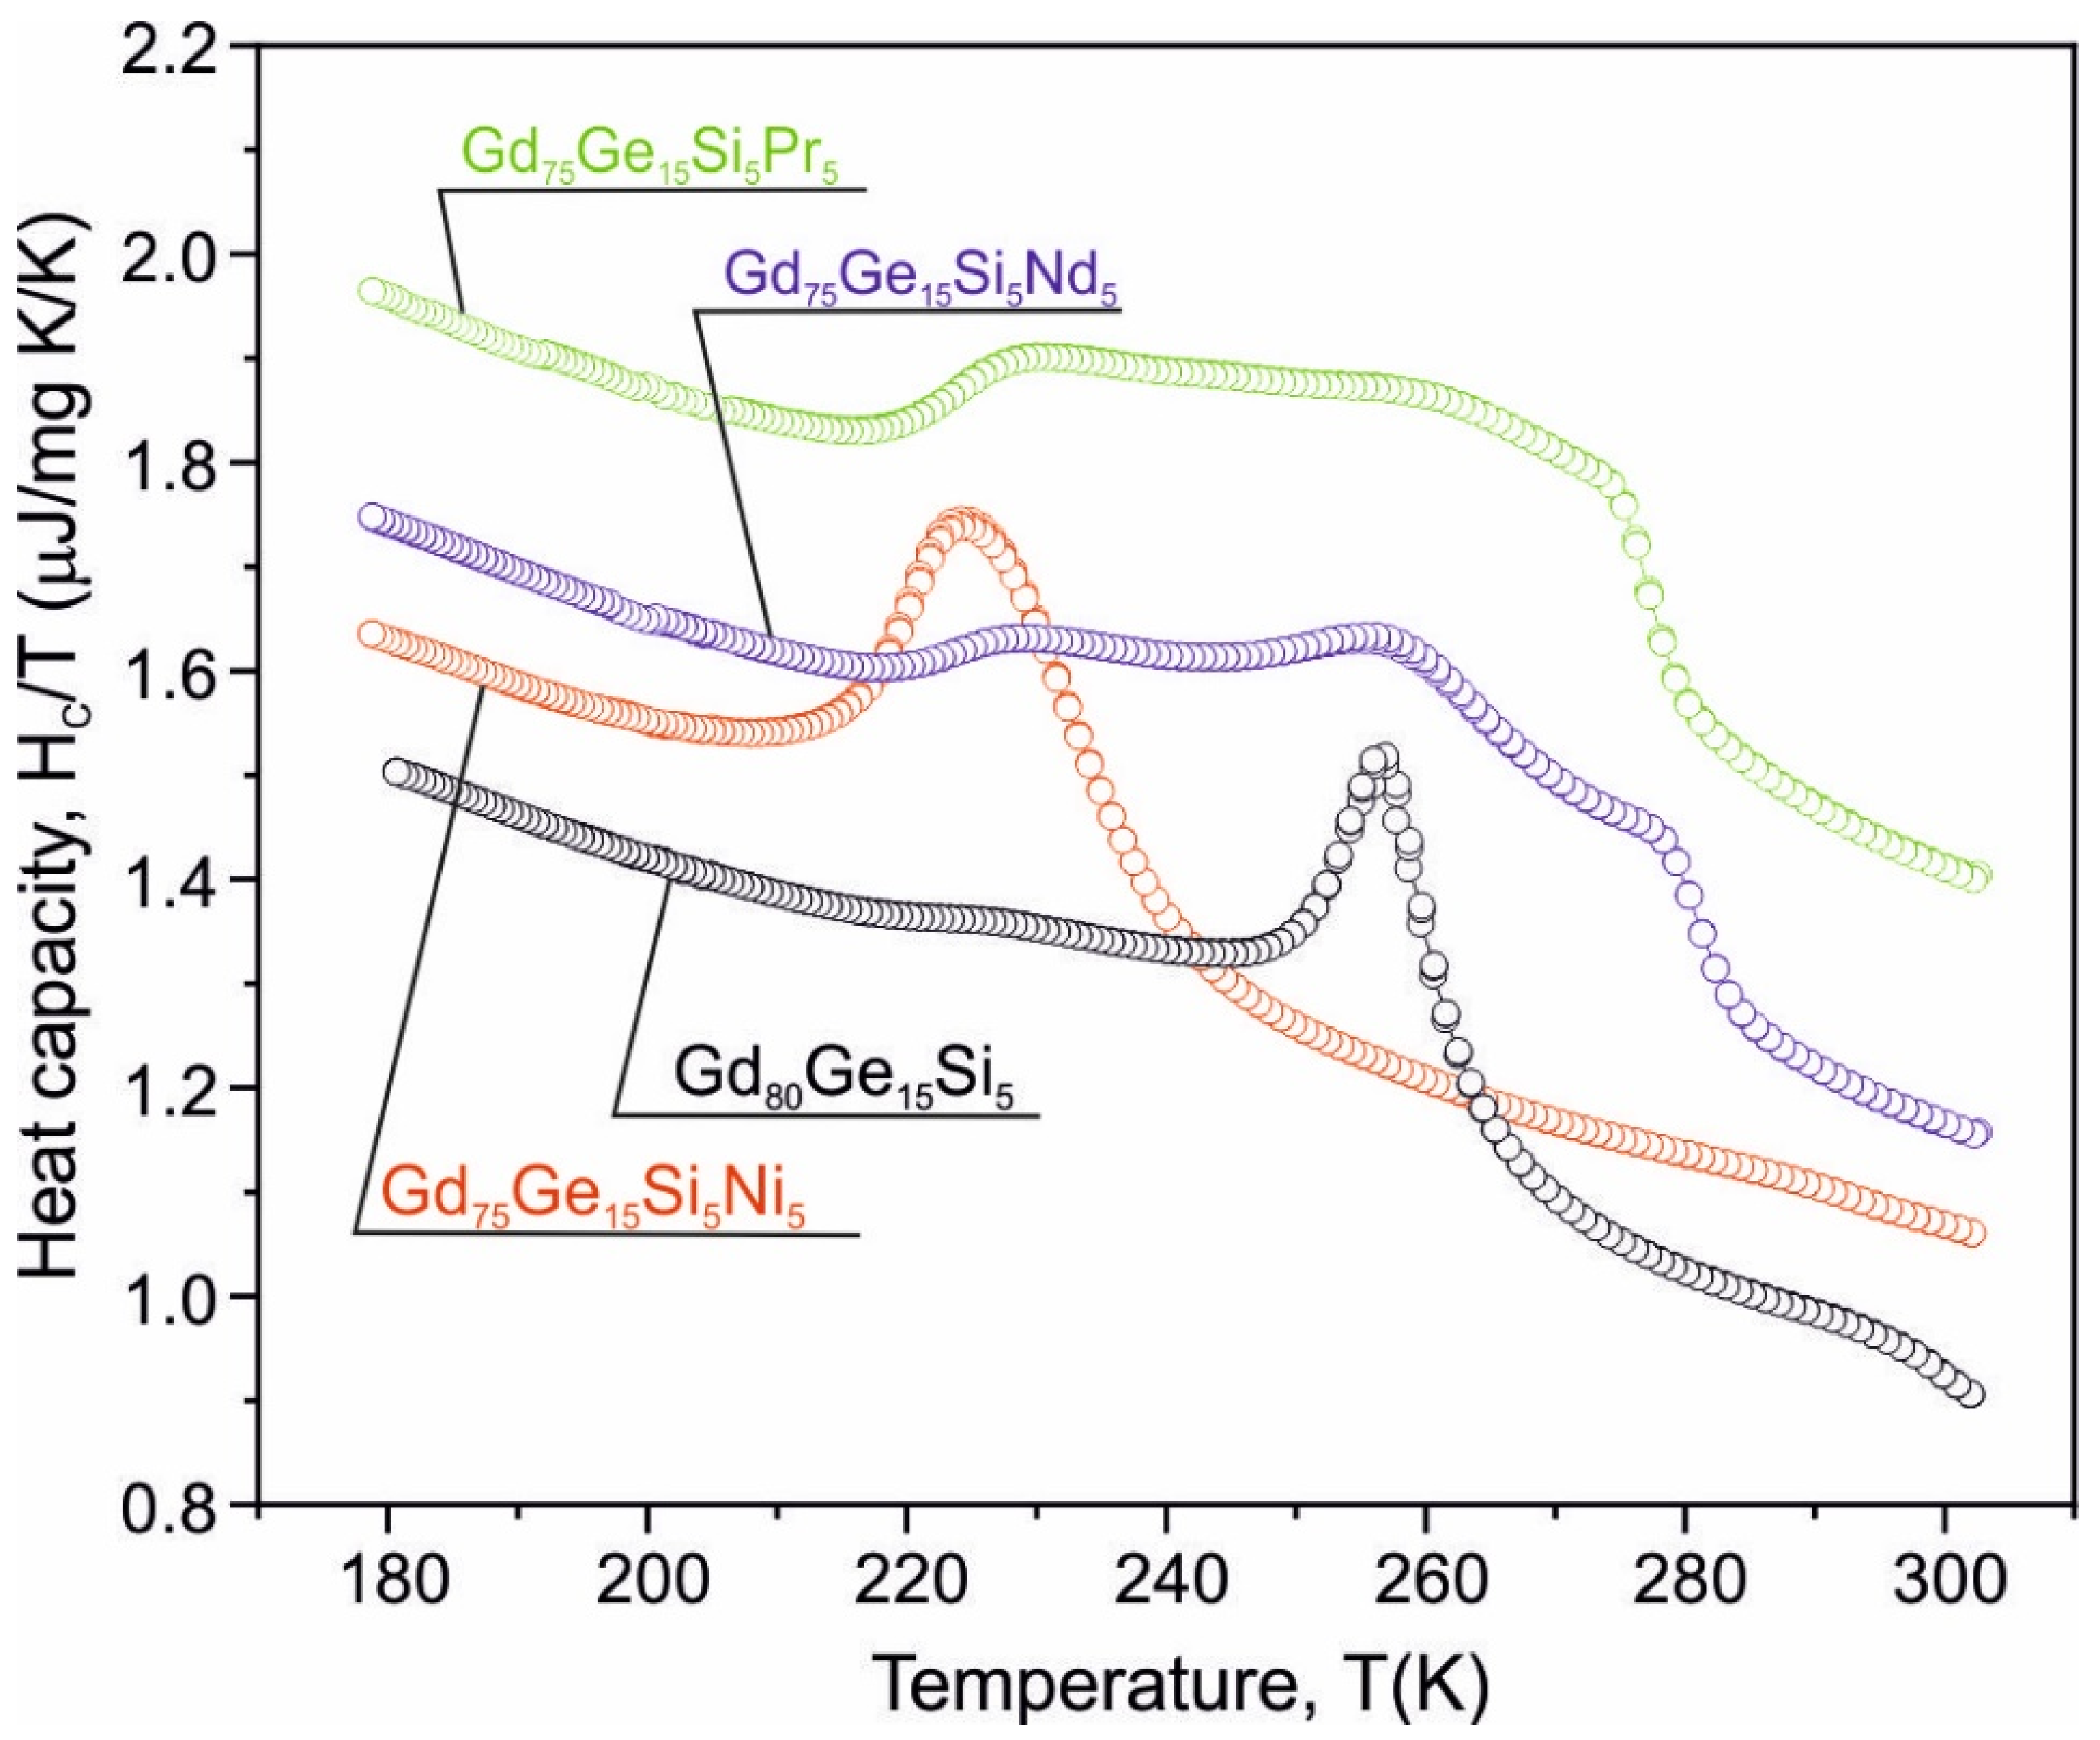
Figure 1. The heat capacity vs. temperature measured for the Gd80Ge15Si5, Gd75Ge15Si5Ni5 [10], Gd75Ge15Si5Pr5 [13] and Gd75Ge15Si5Nd5 alloys at zero external magnetic field.
Materials 14 00185 g001
Figure 2. The set of isothermal magnetization characteristics for Gd80Ge15Si5, Gd75Ge15Si5Ni5 [10], Gd75Ge15Si5Pr5 and Gd75Ge15Si5Nd5 alloys measured in the vicinity of the Curie point with the step of T = 5 K for maximum external magnetic field up to 3 (the same scale on all X and Y axes was used to show the difference in magnetization between the investigated samples).
Materials 14 00185 g002
Figure 3. The ΔSM vs. T curves calculated for: Gd80Ge15Si5 (a), Gd75Ge15Si5Ni5 (b) [10], Gd75Ge15Si5Pr5 (c) and Gd75Ge15Si5Nd5 (d) alloys.
Materials 14 00185 g003
Figure 4. The M2 vs. (H/M) isotherms (Arrott plots) constructed for Gd80Ge15Si5 (a), Gd75Ge15Si5Ni5 (b), Gd75Ge15Si5Pr5 (c) and Gd75Ge15Si5Nd5 (d) alloys.
Materials 14 00185 g004aMaterials 14 00185 g004b
Figure 5. The n vs. T curves found for Gd80Ge15Si5 (a), Gd75Ge15Si5Ni5 (b), Gd75Ge15Si5Pr5 (c) and Gd75Ge15Si5Nd5 (d) alloys.
Materials 14 00185 g005
Figure 6. The temperature dependences of the spontaneous magnetization MS and the inverse initial susceptibility χ0−1 of the as-cast Gd75Ge15Si5Pr5 alloy.
Materials 14 00185 g006
Figure 7. The Kouvel–Fisher plots for determination of β and γ in the Gd75Ge15Si5Pr5 alloy.
Materials 14 00185 g007
Figure 8. The field dependence H of magnetization M on a log–log scale recorded at 275 K for the as-quenched Gd75Ge15Si5Pr5 alloy. The blue line is the best linear fit according to Equation (12).
Materials 14 00185 g008
Figure 9. Scaling plots calculated for the Gd75Ge15Si5Pr5 alloy in as-cast state in a linear scale (a) and in a log–log scale (b).
Materials 14 00185 g009
Table 1. The values of ΔSM and RC calculated for the investigated alloys at selected values of magnetic field.
Alloyμ0H [T]-SM [J/(kg K)]RC [J/kg]
Gd80Ge15Si50.52.0516
15.0638
1.58.1860
210.71102
311.91164
Gd75Ge15Si5Ni50.52.0020
14.5438
1.57.1366
29.7884
312.11140
Gd75Ge15Si5Pr50.51.0522
11.9542
1.52.9872
23.77103
35.08160
Gd75Ge15Si5Nd50.50.9221
11.8652
1.52.5376
23.38108
34.71140
Table 2. Critical exponents, the Curie temperature and the exponent n calculated for the Gd75Ge15Si5Pr5 and Gd75Ge15Si5Nd5 alloys together with values delivered by theoretical models. Abbreviations W and TW mean “Widom scaling relation” and “this work”, respectively.
AlloyRef.βγδTC [K]nexpntheornW
Gd75Ge15Si5Pr5 =
Gd4.8Pr0.4Ge2.0Si1.8
TW0.3531.1744.252
4.326 (W)
276.2 ± 0.10.88630.87160.8739
Gd75Ge15Si5Nd5 =
Gd4.8Nd0.4Ge2.0Si1.8
TW0.3241.1194.167
4.456 (W)
277.6 ± 0.10.89330.88490.8924
Gd75Ge15Si5Ce5 =
Gd4.8Ce0.4Si2.0Ge1.8
[11]0.3761.0323.385
3.745 (W)
275.8-0.822 0.8214
pure Gd[22]0.3811.1964.139296-0.8513-
Gd5Si2Ge1.9Cu0.1[23]0.381.154.03--0.8479-
Gd5Si2Ge1.9Mn0.1[23]0.411.053.56--0.8047-
Gd5Si2Ge1.9Ga0.1[23]0.341.174.44--0.884-
Gd5Si2Ge1.9Al0.1[23]0.381.083.84--0.8403-
Mean-field[25]0.513--2/3-
3D-Heisenberg[25]0.3651.3864.797--0.8802-
3D-Ising[25]0.3251.244.82--0.9001-
Tricritical mean-field[26]0.2515--0.9333-
Publisher’s Note: MDPI stays neutral with regard to jurisdictional claims in published maps and institutional affiliations.