Article

Oscillatory Behaviour of Ni Supported on ZrO2 in the Catalytic Partial Oxidation of Methane as Determined by Activation Procedure

1
Chemistry Department, Sapienza University of Rome, P.le Aldo Moro 5, 00185 Rome, Italy
2
Institute for the Study of Nanostructured Materials (ISMN), National Research Council (CNR), Sapienza University of Rome, P.le Aldo Moro 5, 00185 Rome, Italy
3
Science Department, Roma Tre University, Via della Vasca Navale 79, 00146 Rome, Italy
4
Italian National Agency for New Technologies, Energy and Sustainable Economic Development (ENEA), Casaccia Research Centre, Via Anguillarese 301, 00123 Rome, Italy
*
Author to whom correspondence should be addressed.
Materials 2021, 14(10), 2495; https://doi.org/10.3390/ma14102495
Submission received: 31 March 2021 / Revised: 4 May 2021 / Accepted: 6 May 2021 / Published: 12 May 2021
(This article belongs to the Special Issue Oxide-Based Materials for Sustainable Catalytic Processes)

Abstract

:
Ni/ZrO2 catalysts, active and selective for the catalytic partial oxidation of methane to syngas (CH4-CPO), were prepared by the dry impregnation of zirconium oxyhydroxide (Zhy) or monoclinic ZrO2 (Zm), calcination at 1173 K and activation by different procedures: oxidation-reduction (ox-red) or direct reduction (red). The characterization included XRD, FESEM, in situ FTIR and Raman spectroscopies, TPR, and specific surface area measurements. Catalytic activity experiments were carried out in a flow apparatus with a mixture of CH4:O2 = 2:1 in a short contact time. Compared to Zm, Zhy favoured the formation of smaller NiO particles, implying a higher number of Ni sites strongly interacting with the support. In all the activated Ni/ZrO2 catalysts, the Ni–ZrO2 interaction was strong enough to limit Ni aggregation during the catalytic runs. The catalytic activity depended on the activation procedures; the ox-red treatment yielded very active and stable catalysts, whereas the red treatment yielded catalysts with oscillating activity, ascribed to the formation of Niδ+ carbide-like species. The results suggested that Ni dispersion was not the main factor affecting the activity, and that active sites for CH4-CPO could be Ni species at the boundary of the metal particles in a specific configuration and nuclearity.

Graphical Abstract

1. Introduction

The global energy demand is expected to rise by 30% between today and 2040. In this scenario, the use of natural gas as an energy source is expected to increase by 45% in the next 20 years, according to the World Energy Outlook 2017—International Energy Agency [1]. The conversion of natural gas, mainly constituted by methane, into highly valuable products has become challenging [1,2,3,4]. The catalytic conversion of methane to syngas is an attractive research area as syngas is a building block for valuable chemicals and liquid fuels [5,6,7]. The currently adopted large-scale process to produce syngas is CH4 steam reforming [8,9], which is energetically expensive due to its endothermic characteristics. Conversely, the catalytic partial oxidation of methane (CH4-CPO) is a valid alternative because it is mildly exothermic and can produce syngas in a ratio (H2/CO = 2) suitable for methanol or Fischer–Tropsch synthesis [5,6,7,10,11,12,13].
Catalytic systems based on noble (Rh, Pt and Ir) or nonnoble metals (Ni, Co and Fe) supported on various oxides have been studied for the CH4-CPO reaction [4,5,11,14]. By consensus, nickel supported on oxides is considered a promising catalyst owing to the high methane conversion, high CO and H2 selectivities and low cost [11,14,15,16,17,18,19,20], but it suffers from deactivation. Many studies have shown that deactivation arises from the sintering of Ni particles and/or coke deposition, both depending on metal particle and support features [11,14,21,22,23,24]. The choice of support is fundamental, as the metal–support interaction can favour the formation of peculiar active sites at the metal–support boundaries [25,26].
Zirconium oxide is widely used as a support because of its high thermal stability and characteristic textural properties that can be tailored according to different preparation methods and thermal treatments, yielding the formation of monoclinic, metastable tetragonal or mixed tetragonal-monoclinic ZrO2 phases [27,28,29]. Many papers have extensively investigated Ni-supported ZrO2 systems for syngas production focussing on the support preparation methods and on the deposition of Ni precursors to obtain metal particle sizes suitable for high catalytic performances and low carbon deposition [11,14,30,31,32,33,34,35,36]. By contrast, the effect of ZrO2 modifications on the metal dispersion and on the structure–activity relationship has not been clearly established thus far. Studies on the interaction between Ni clusters and ZrO2 polymorphs have reported that monoclinic ZrO2 performs better than tetragonal and cubic forms both for cluster dispersion and aggregation inhibition [37,38]. Furthermore, the effect of the activation procedures of catalyst precursors on the Ni metal particle features has not been deeply analysed, although it is generally recognised to affect the strength of the metal–support interaction [39].
In this paper, we studied the catalytic performances for the CH4-CPO of nickel-supported systems in which the support was ZrO2 in the monoclinic modification. The thermal stability of the monoclinic phase up to about 1400 K, able to prevent changes induced by the occurrence of hot spots during CH4-CPO reaction, and the chemical inertness between NiO and ZrO2 are expected to assure catalyst stability. Ni/ZrO2 catalysts were prepared by the impregnation of two different starting materials (a high-surface-area zirconium oxyhydroxide, Zhy, and a low-surface-area monoclinic zirconium oxide, Zm) and were activated following two different procedures (oxidation–reduction treatment, ox-red, or direct reduction treatment, red). The objective of this study was to clarify the effect of the starting material and of the reductive activation procedure on the nature of the active phase and on the catalytic behaviour. To this aim, we compared the catalytic behaviours and features of Ni/ZrO2 catalysts with those of bare monoclinic ZrO2 and of an unsupported Ni powder sample. Materials were characterized by various techniques, including atomic absorption spectroscopy (AAS), X-ray diffraction (XRD), specific surface area (BET method) and pore volume analysis, field-emission scanning electron microscopy (FESEM), temperature-programmed reduction (TPR), and in situ transmission Fourier-transform infrared (FTIR) and Raman spectroscopies. The correlation between the characterization and catalytic activity results allowed some hypotheses to be formulated on the active sites for the CH4-CPO and on the consequent oscillating catalytic behaviour.

2. Materials and Methods

2.1. Materials

Zirconium oxyhydroxide (Zhy) was prepared via precipitation from a ZrOCl2 solution with ammonia. After separation, the solid was washed with water until a Cl-negative test (no opalescence in the liquid after addition of AgNO3). The test was conducted on the washing water and on small portions of solid removed from the batch and dissolved in dilute HNO3. After washing, the solid was dried at 383 K for 24 h. A portion of this material was calcined at 1173 K (heating rate: 0.25 K·min−1) for 5 h, indicated as Zm (m stands for monoclinic).
NiO/ZrO2 catalyst precursors (about 2 or 5 Ni wt.%) were prepared by the dry impregnation of Zhy or Zm material with an Ni(NO3)2 aqueous solution, and they were dried at 383 K and subsequently calcined at 1173 K for 5 h; the heating rate was 0.25 K·min−1 for the Zhy-based samples and was 5.0 K·min−1 for those based on Zm. The adoption of such a slow heating ramp (0.25 K·min−1) for the Zhy-based samples was necessary to obtain crystalline ZrO2 with the highest possible surface area, avoiding a marked local increase in temperature due to the exothermicity of the crystallization process. NiO/ZrO2 catalyst precursors were stored in plastic vials at room temperature in air and were labelled as xNiO/Za, where x indicates the Ni content (Ni wt.%) and Za specifies the starting material used for the impregnation, Zhy or Zm.
Ni/ZrO2 catalysts were obtained by the in situ reduction of precursors following different activation procedures: (i) oxidation in a 5% O2/N2 flow up to 923 K for 1 h, purging with N2 up to 1073 K, and reduction in a 10% H2/N2 flow at 1073 K for 1 h (ox-red activation); (ii) direct reduction in a 10% H2/N2 flow up to 1073 K for 1 h (red activation). Samples were named xNi/Za (ox-red) and xNi/Za (red), respectively. The catalyst preparation procedures are sketched in Scheme 1.
Polycrystalline nickel oxide was obtained by the slow decomposition of Ni(CH3COO)2 in air at 1173 K (heating rate: 0.25 K·min−1) for 5 h.

2.2. Characterization

The Ni content of catalysts was determined by AAS (SpectrAA 220, Varian Australia Pty Ltd., Mulgrave, Australia). X-ray diffraction (XRD) patterns were obtained with a Philips PW 1729 diffractometer (Malvern Panalytical Ltd., Malvern, UK) using Cu Kα (Ni-filtered) radiation in a 2θ range of 10–70° (step size: 0.02°; time per step: 1.25 s). The mean crystallite diameter (d) was calculated by the Scherrer equation [40] as d = Kλ/βcosθ, where K is a shape constant equal to 0.9, λ is the X-ray wavelength used, and β is the effective linewidth (FWHM) of the observed X-ray reflection, obtained by a curve-fitting procedure after Warren’s correction for instrumental broadening and background subtraction.
Specific surface area (BET method) and textural properties were determined by the adsorption/desorption of N2 at 77 K using a Micromeritics ASAP 2010 Analyzer (Norcross, GA, USA) after sample outgassing at 473 K for 2 h via thermally controlled heating mantles, up to a residual pressure lower than 0.8 Pa. The pore distribution was determined by the BJH method [41] from the adsorption isotherm. The total pore volume was obtained by the rule of Gurvitsch [42]. The uncertainty was ±0.5 m2·g−1 for the specific surface area values and ±0.005 cm3·g−1 for the total pore volume values.
Field-emission scanning electron microscopy (FESEM) images were obtained by using an AURIGA Zeiss 405 HR-FESEM instrument (Oberkochen, Baden-Württemberg, Germany), equipped with an energy-dispersive X-ray spectroscopy (EDXS) Bruker apparatus for elemental detection, which is able to discriminate particles with a minimum diameter of about 5 nm.
To evaluate the Ni dispersion, D (percent ratio of the exposed Ni atoms to the total Ni atoms), FESEM images were processed using the free ImageJ software version 1.53h (National Institutes of Health, Bethesda, MD, USA) [43] to measure the particle diameters, di. The particle diameter distribution was established by measuring all the particles observed in at least 5 images of each sample. The error in the particle size measurement due to the pixel dimensions of FESEM images (depending on the resolution at different magnifications) was ≤10%. The metal dispersion was derived according to [44] using the approximation of spherical particles, taking into account the relationship between D and the mean particle diameter, D = 100·6 (vNi/aNi)/dVA, where dVA = Σinidi3/Σnidi2 is the volume-area mean diameter, vNi is the volume of a Ni atom in bulk metal (0.01095 nm3), and aNi is the area occupied by a surface Ni atom (0.0651 nm2).
Temperature-programmed reduction (TPR) experiments were performed using a Thermo Scientific TPDRO1100 instrument (Waltham, MA, USA). The H2-TPR analysis was conducted by flowing a 5% H2/Ar mixture (10 cm3·min−1) through the sample (100 mg) from 323 to 1073 K (heating rate 10 K·min−1) and keeping the sample at 1073 K for 1 h. The H2 consumption was measured by a TCD detector, calibrated by the reduction of a known amount of CuO (99.99% purity; Sigma Aldrich, Saint Louis, MO, USA). Before flowing into the TCD, the H2O produced during the reduction was removed by a soda lime trap.
Raman spectra were recorded at room temperature, in back-scattering geometry, with an inVia Renishaw micro-Raman spectrometer (Wotton-under-Edge, Gloucestershire, UK), using the 488.0 nm emission line from an Ar ion laser as the exciting source. The power of the incident beam was about 5 mW. Repeated accumulations (10 or 20 scans × 10 s) were generally acquired on at least four regions of each sample using 20× or 5× objectives to check the sample homogeneity. Spectra were calibrated using the 520.5 cm−1 line of a silicon wafer. Spectra processing included baseline removal and curve fitting using a Gauss–Lorentz cross-product function by Peakfit 4.12 (Systat Software Inc., San Jose, CA, USA, 2007).
Transmission FTIR spectra were recorded with a Perkin Elmer Frontier spectrometer (Milano, Italy), equipped with a MCT detector operating with a resolution of 4 cm−1. The powdered sample, crushed and pelleted (pressure: 1.5 × 10⁴ kg·cm−2) in a self-supporting wafer of about 15 mg·cm−2, was inserted in a stainless-steel reactor equipped with CaF2 windows. The reactor, connected to a flow apparatus, allowed spectra to be recorded during thermal treatments up to 773 K in an oxidative (5% O2/N2) or reductive (10% H2/N2) flow to simulate the catalytic activation treatment. At a given temperature, surface species resulting from the various treatments were determined by subtracting reference spectra from those recorded after specific treatments. The reference spectra were collected in flowing helium, on samples heated up to 773 K and cooled down to the desired temperature (298–773 K).

2.3. Catalytic Activity

The CH4-CPO reaction was studied in a flow apparatus at atmospheric pressure. The feeding section included independent mass flow controller meters (MKS mod. 1259, driven by a four-channel unit MKS mod. 647C) and a glass ampoule for gas mixing before entering the reactor. The fixed-bed tubular reactor was made of two coaxial quartz tubes (i.d. 20 and 10 mm) to allow preheating of the feed gas. The temperature of the catalytic bed was monitored by a K-type thermocouple, located in a quartz tube (i.d. 4 mm) concentric to the reactor. High-purity gas mixtures (CH4/N2, O2/N2 and H2/N2 from Rivoira gas, Milano, Italy), and pure N2 (SOL) were used without further purification. Reactants and products were analysed by a Varian Micro-GC CP-4900 gas chromatograph (Agilent, Santa Clara, CA, USA) equipped with two columns (10 m Molsieve 5A BF, for H2, O2 and CO; 10 m Poraplot Q, for CH4, CO2 and H2O) and TCD detectors. Sample masses of 50 mg for ZrO2 and NiO/ZrO2 and 3.0 mg for unsupported NiO (nickel amount comparable to that contained in 50 mg of a catalyst with 5 wt.% Ni) were deposited on a ceramic wool bed in the reactor. The height of the catalytic bed in the reactor was ≤1 mm. Before catalytic measurements of Zm, unsupported NiO and NiO/ZrO2 catalysts were submitted to the in situ reduction procedure, ox-red or red, as specified in the Materials section (Section 2.1.).
Typical catalytic runs consisted of steady-state measurements with a mixture of 2% CH4, 1% O2, and N2 as balance, in the temperature range of 1023–723 K, leaving the catalysts in a continuous flow of the reactant mixture. The temperature was changed in a random sequence, maintaining a constant temperature for about 15 min (three consecutive Micro-GC analyses). To check the activity reproducibility, some temperature values were explored two or more times in the same run. For each catalyst, up to four runs were carried out by applying an ox-red activation treatment between two consecutive runs. The stability of the activity was tested in ad hoc runs following the reaction at a set temperature as a function of time on stream up to 5 h. The total flow rate was 150 cm3 (STP) min−1 (space velocity: 1.8·105 NL·kgcat−1·h−1; contact time τ = 9 ms). At constant temperature, the linear increase in conversions at increasing contact time (τ) indicated that, under our experimental conditions, the reaction was under kinetic control without external diffusion effects (Figure S1 in the Supplementary Material). All experiments yielded a satisfactory carbon, hydrogen and oxygen balance (100 ± 5%). Samples after catalytic activity tests were named used catalysts.
The catalytic activity and selectivity for the CH4-CPO reaction (CH4 + 1/2O2 → CO + 2H2) were discussed considering the simultaneous occurrence of methane total combustion (CH4 + 2O2 → CO2 + 2H2O), and the water gas shift (WGS) reaction (CO + H2O → CO2 + H2). The percent CH4 conversion was calculated as 100 (CH4 molecules consumed)/(CH4 molecules injected). The percent H2 yield was calculated as 100 (H2 molecules produced)/(1/2 CH4 molecules injected), and CO or CO2 yields were calculated as 100 (CO or CO2 molecules produced)/(CH4 molecules injected). The H2 selectivity was calculated as 100 (H2 molecules produced)/(1/2 CH4 molecules converted). The CO selectivity was calculated as 100 (CO molecules produced)/(CH4 molecules converted). The rate of H2 production (RH2/molecules s−1·g−1) was calculated from H2 molecules produced in experiments in which the conversion never exceeded 30%. The rate was correlated to the number of exposed Ni atoms per gram of catalyst (NNi(exp)), obtained according to the expression NNi(exp) = (D·wNi·NA)/(10,000·MNi), where D is the Ni dispersion value, wNi is the Ni loading (wt.%), NA is Avogadro’s number and MNi is the Ni molar mass (58.69 g·mol−1).

3. Results and Discussion

3.1. Characterization

3.1.1. Zirconium Oxide Support

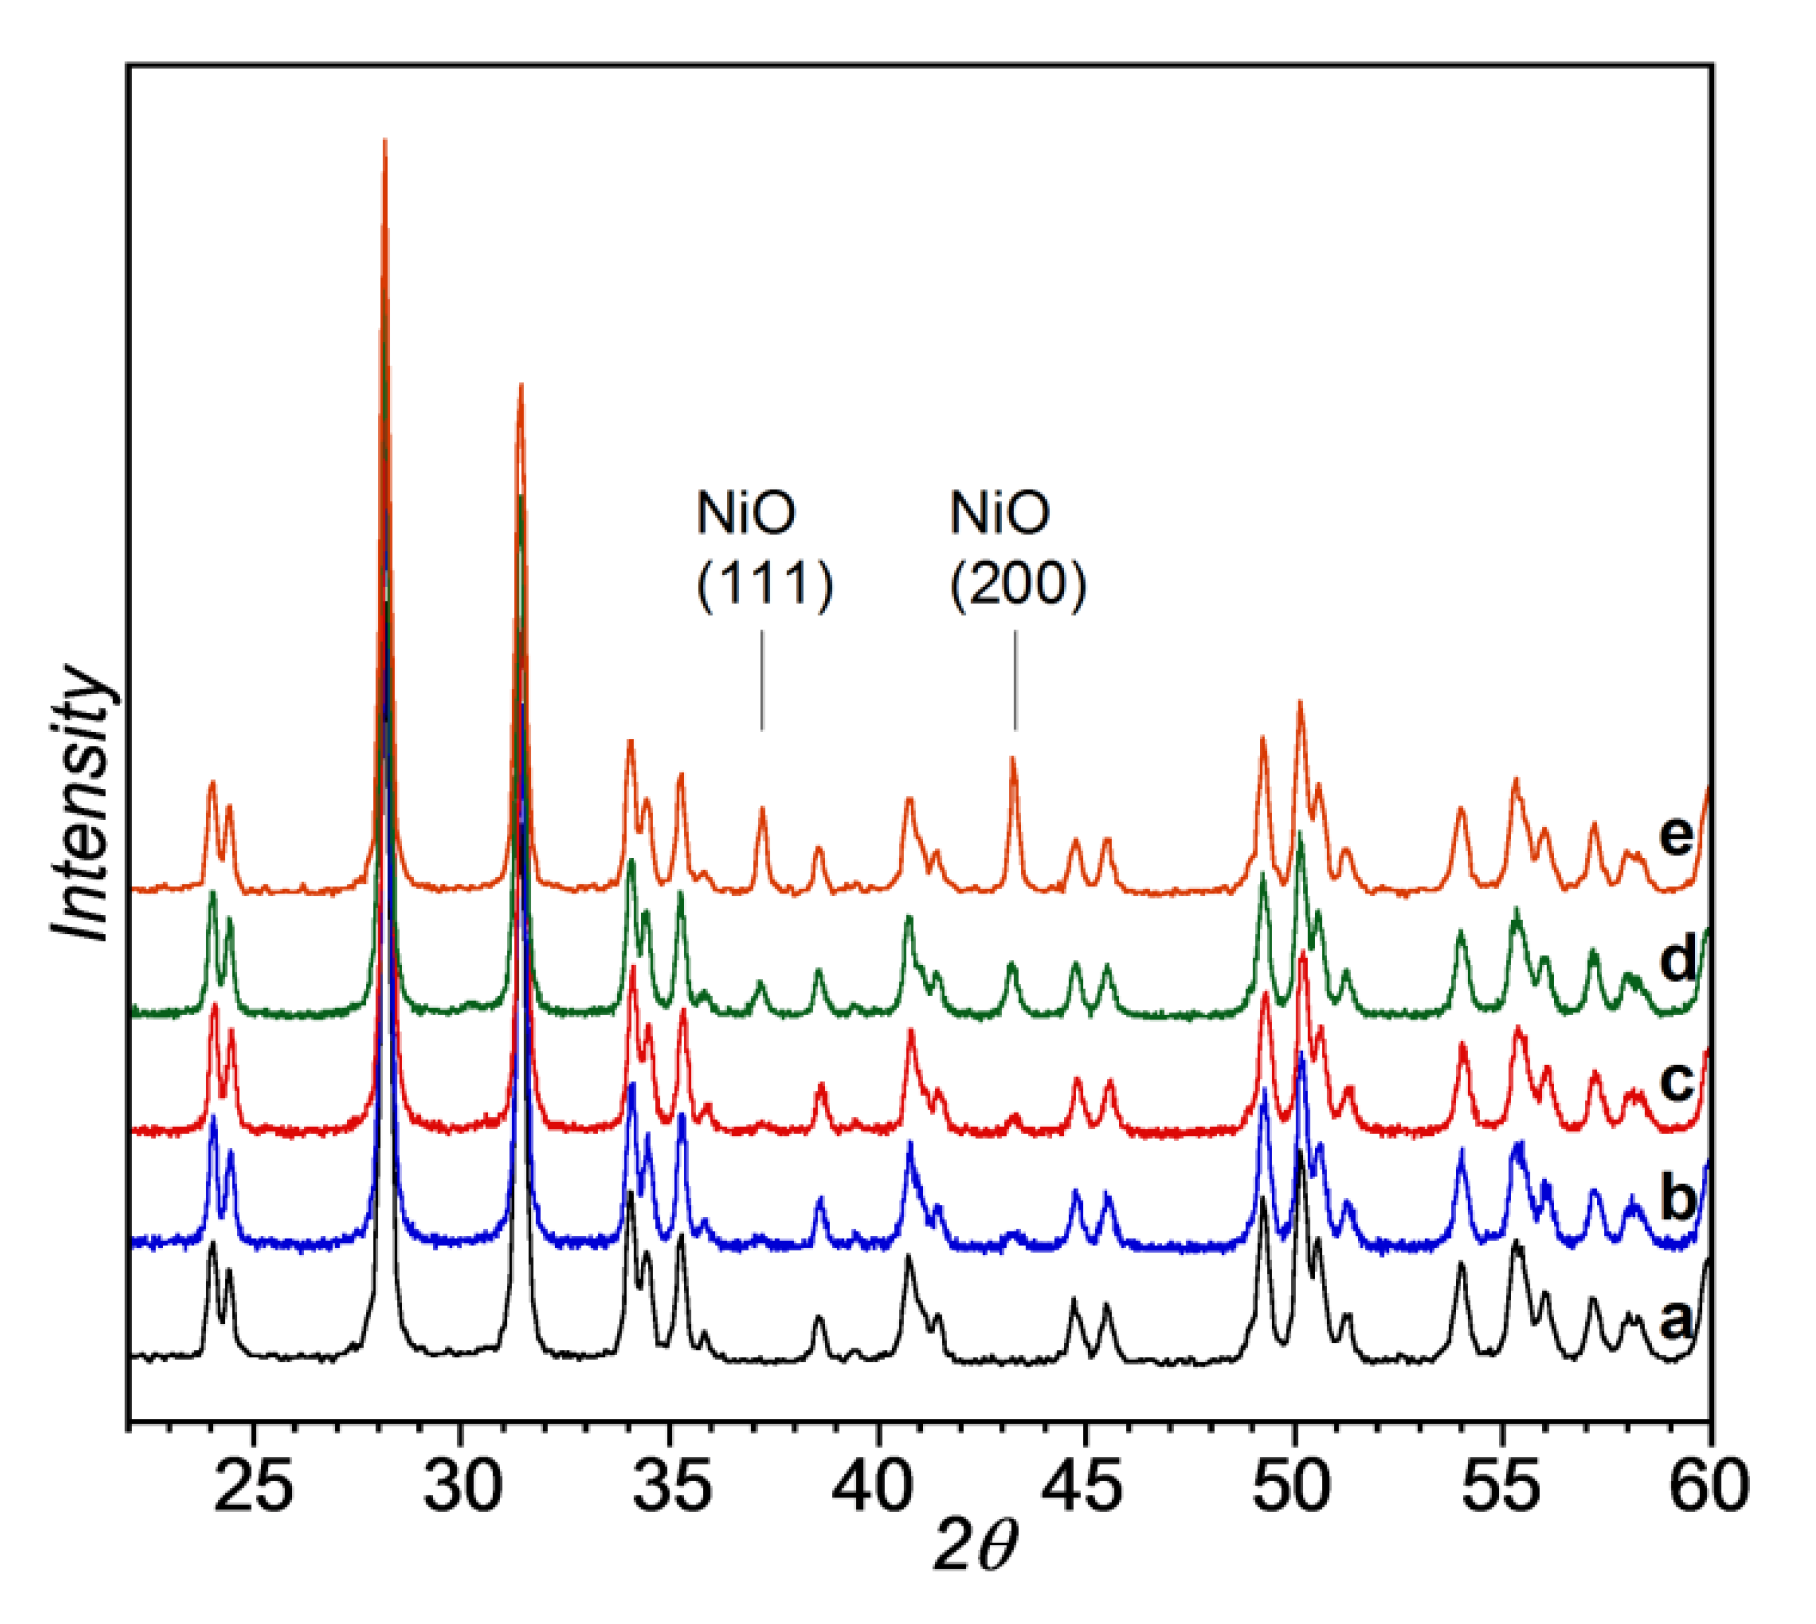
Amorphous zirconium oxyhydroxide, Zhy, heated at 1173 K transformed into monoclinic ZrO2, Zm, as shown by XRD (JCPDF card 37-1484) (Figure 1a). The Zm average crystallite size determined by the Scherrer equation [41] was 49 nm; the (−111) reflection at 28.4° was considered for the fitting procedure. Specific surface area measurements and textural analysis showed that Zhy was a micro-mesoporous material, with a specific surface area of 360 m2·g−1, and that monoclinic ZrO2, Zm, was a meso-macroporous material, with a specific surface area of 5.6 m2·g−1 (Table 1).
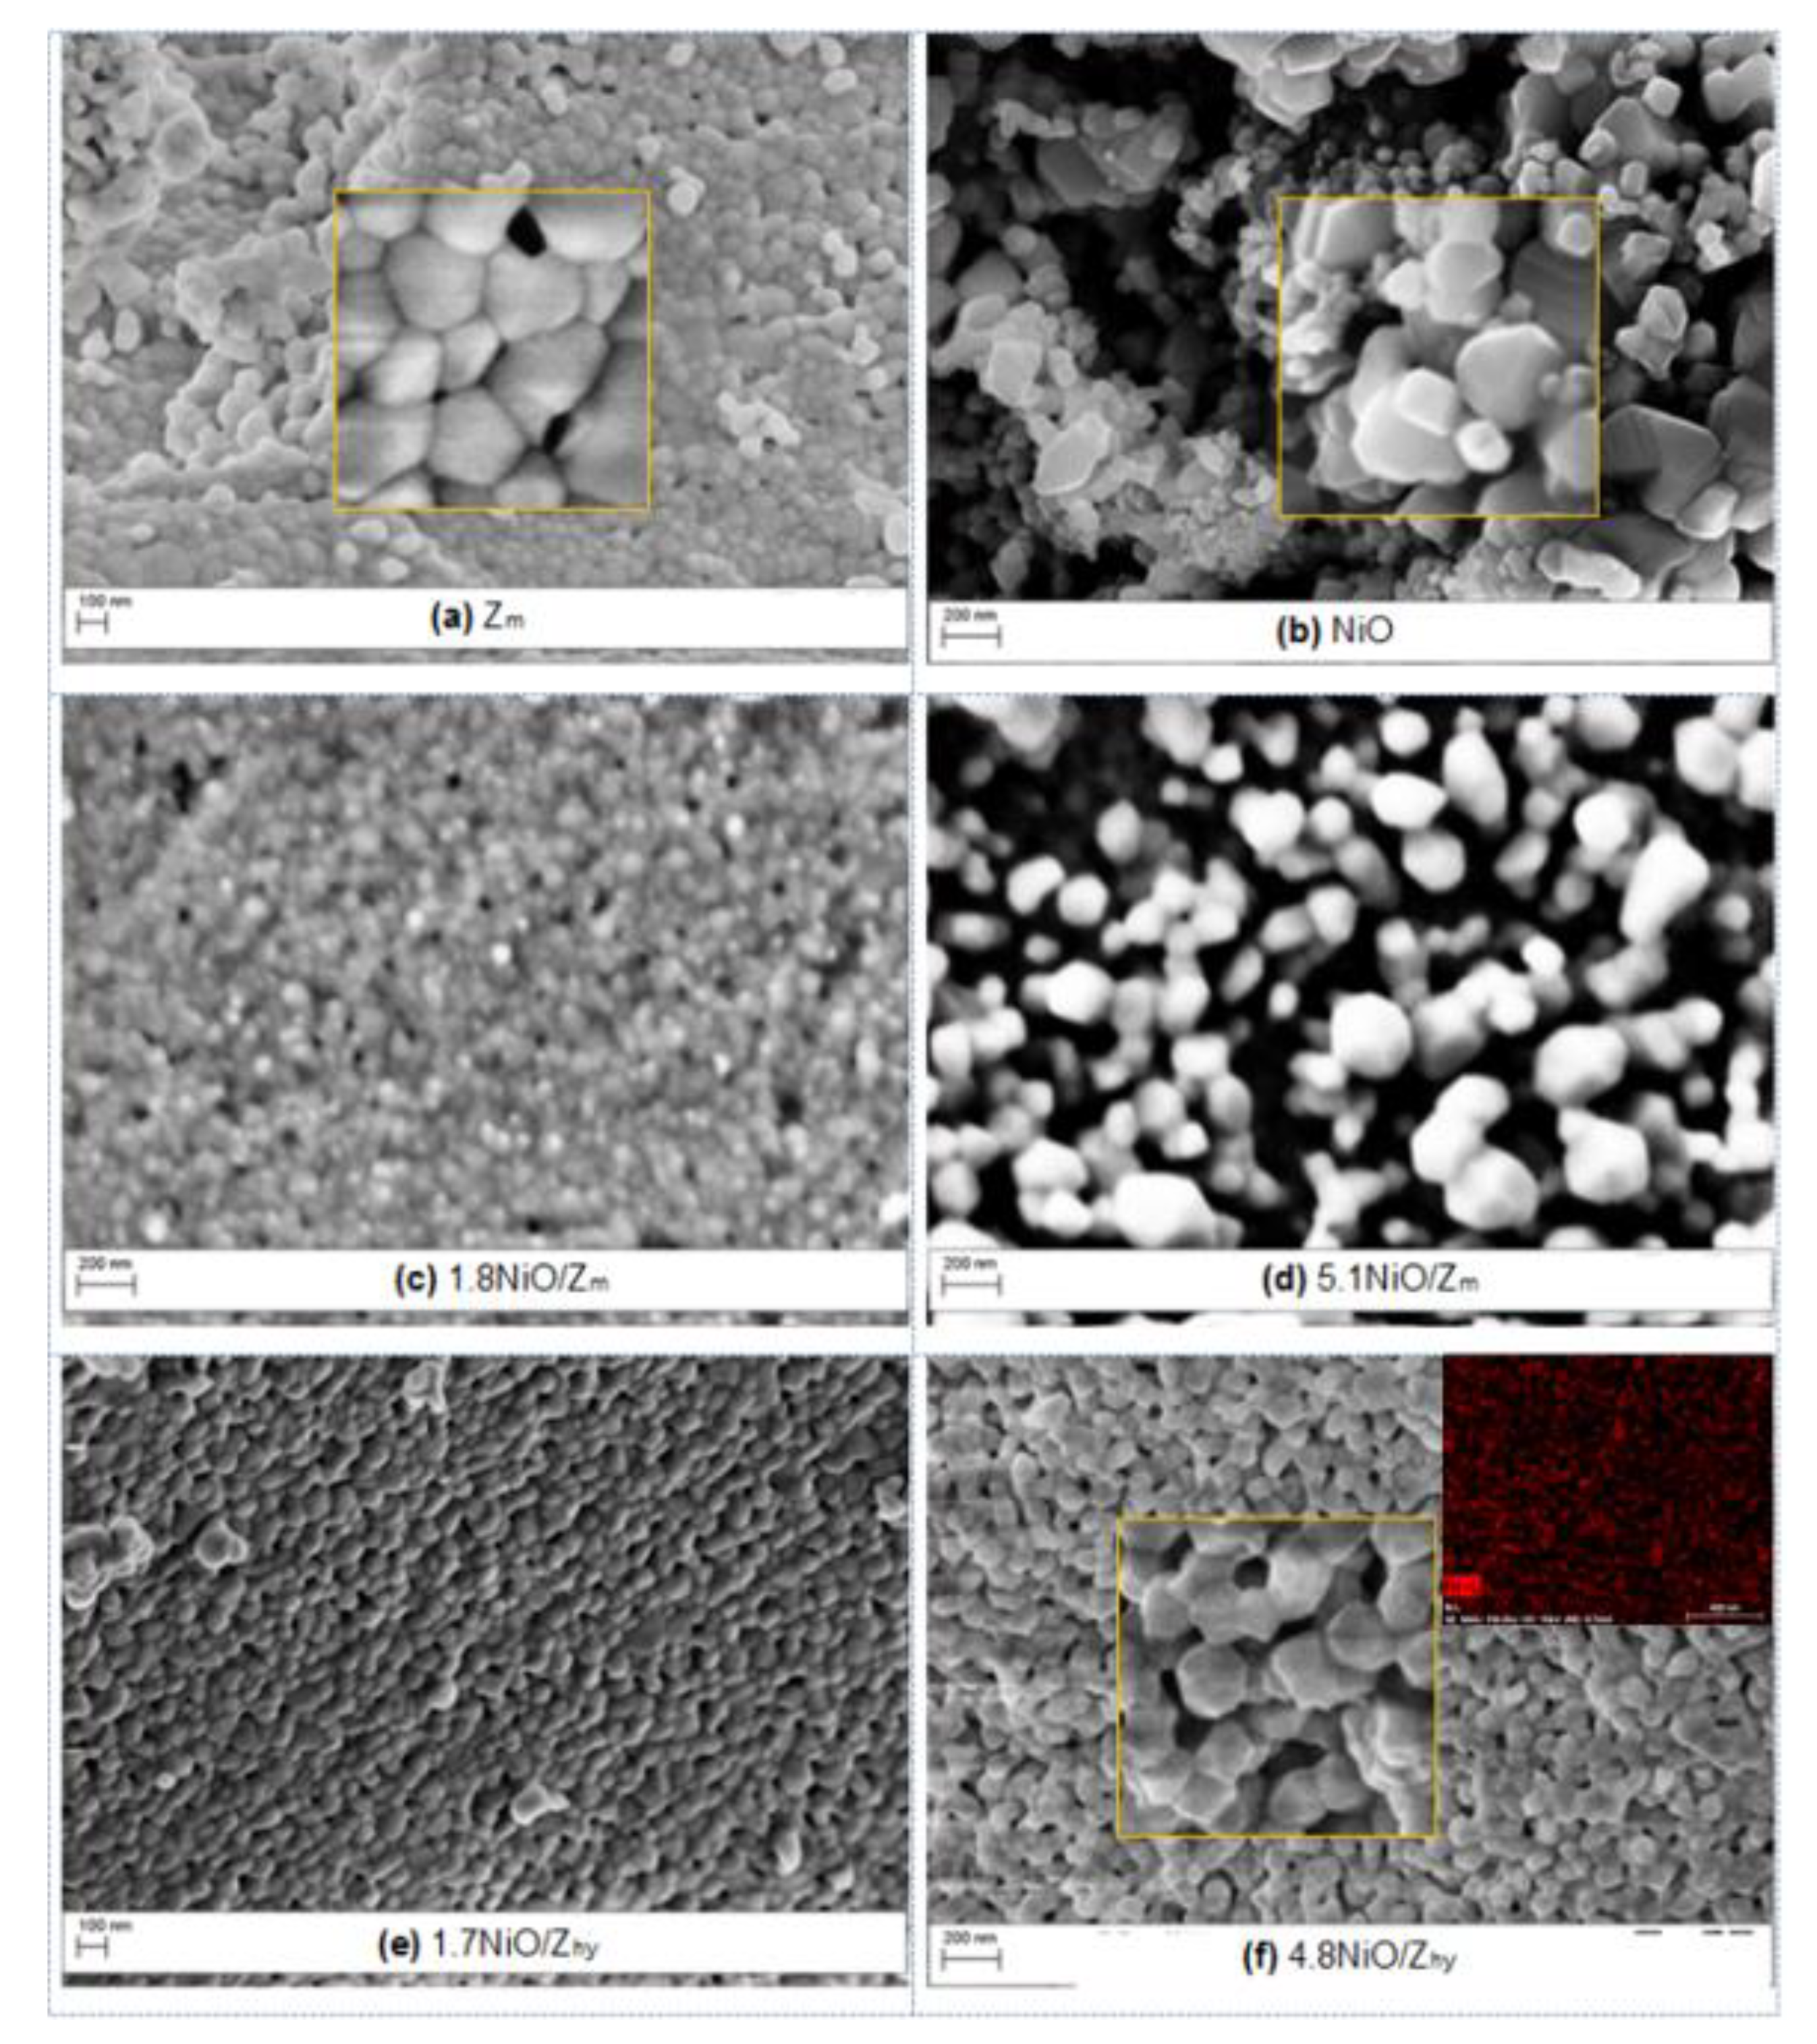
FESEM micrographs of the Zm support revealed ZrO2 particles having sizes in the range of 30–100 nm (Figure 2a and Table 2).

3.1.2. NiO/ZrO2 Catalyst Precursors

All the NiO/ZrO2 samples (NiO/Zhy and NiO/Zm) heated at 1173 K, in addition to the reflection of monoclinic ZrO2, showed peaks at 2θ values of 37.3° and 43.3°, corresponding to the (111) and (200) crystallographic planes of cubic NiO (JCPDF card 4-0835), (Figure 1, patterns b–e). For all the NiO/ZrO2 samples, the NiO average crystallite sizes, determined by the (200) reflection (Scherrer equation [41]), ranged from 22 to 36 nm and was smaller than those of unsupported NiO (70 nm, Table 1), suggesting that an interaction between NiO and the support positively affected the crystallite sizes.
FESEM micrographs of unsupported NiO mainly revealed octahedral truncated particles (inset in Figure 2b) with sizes in the range of 20–400 nm (Figure 2b and Table 2). The images of the NiO/Zm samples revealed NiO particles (EDX analysis) with sizes within the range exhibited by unsupported NiO, about 40–60 nm for the 1.8NiO/Zm sample and 80–300 nm for the 5.1NiO/Zm sample (Figure 2c,d; Table 2). In particular, in the latter sample, NiO-supported particles showed truncated octahedral shapes similar to those of unsupported NiO particles. The NiO particles imaged by FESEM were larger than those determined by XRD, indicating that, on the zirconia surface, NiO was in the form of crystallite aggregates.
The nitrogen adsorption/desorption Type IV isotherms (Figure S2a) showed H1 hysteresis loops characteristic of adsorbents with a narrow distribution of uniform pores. The surface area and total pore volume values of NiO/Zm samples were lower than those of the Zm support (Table 1), due to the decrease in the meso- and macroporosity, suggesting that some of the NiO particles partially occluded the pores. Accordingly, pore size distribution plots exhibited a mesoporous texture more abundant for Zm than for the NiO/ZrO2 catalyst precursors (Figure S2b).
In the NiO/Zhy samples, although EDX analysis detected a homogeneous distribution of Ni species, and NiO crystallite sizes estimated by XRD were above the size detection limit of FESEM (5 nm), no NiO particles were imaged (Figure 2e,f). This fact could be due to (i) the low contrast between supported NiO particles and the zirconia support, and/or (ii) the location of the NiO particles in the ZrO2 interparticle voids, formed during the calcination of Zhy impregnated with Ni(NO3)2. The similarity of surface area and total pore volume values between NiO/Zhy samples and the Zm support (Table 1) suggests that, for NiO/Zhy samples, pore occlusion of ZrO2 by NiO did not occur, supporting the hypothesis of small NiO particles. A closer inspection of the 4.8NiO/Zhy FESEM image (inset in Figure 2f) indicated particles with truncated octahedral morphologies, unlike the roundish particles of the Zm support but similar to those of unsupported NiO particles. This result suggests that, during the calcination treatment, the NiO phase spread as a raft-like layer on the Zhy support. This intimate contact between the two oxide phases could account for the low contrast in the FESEM images [45].
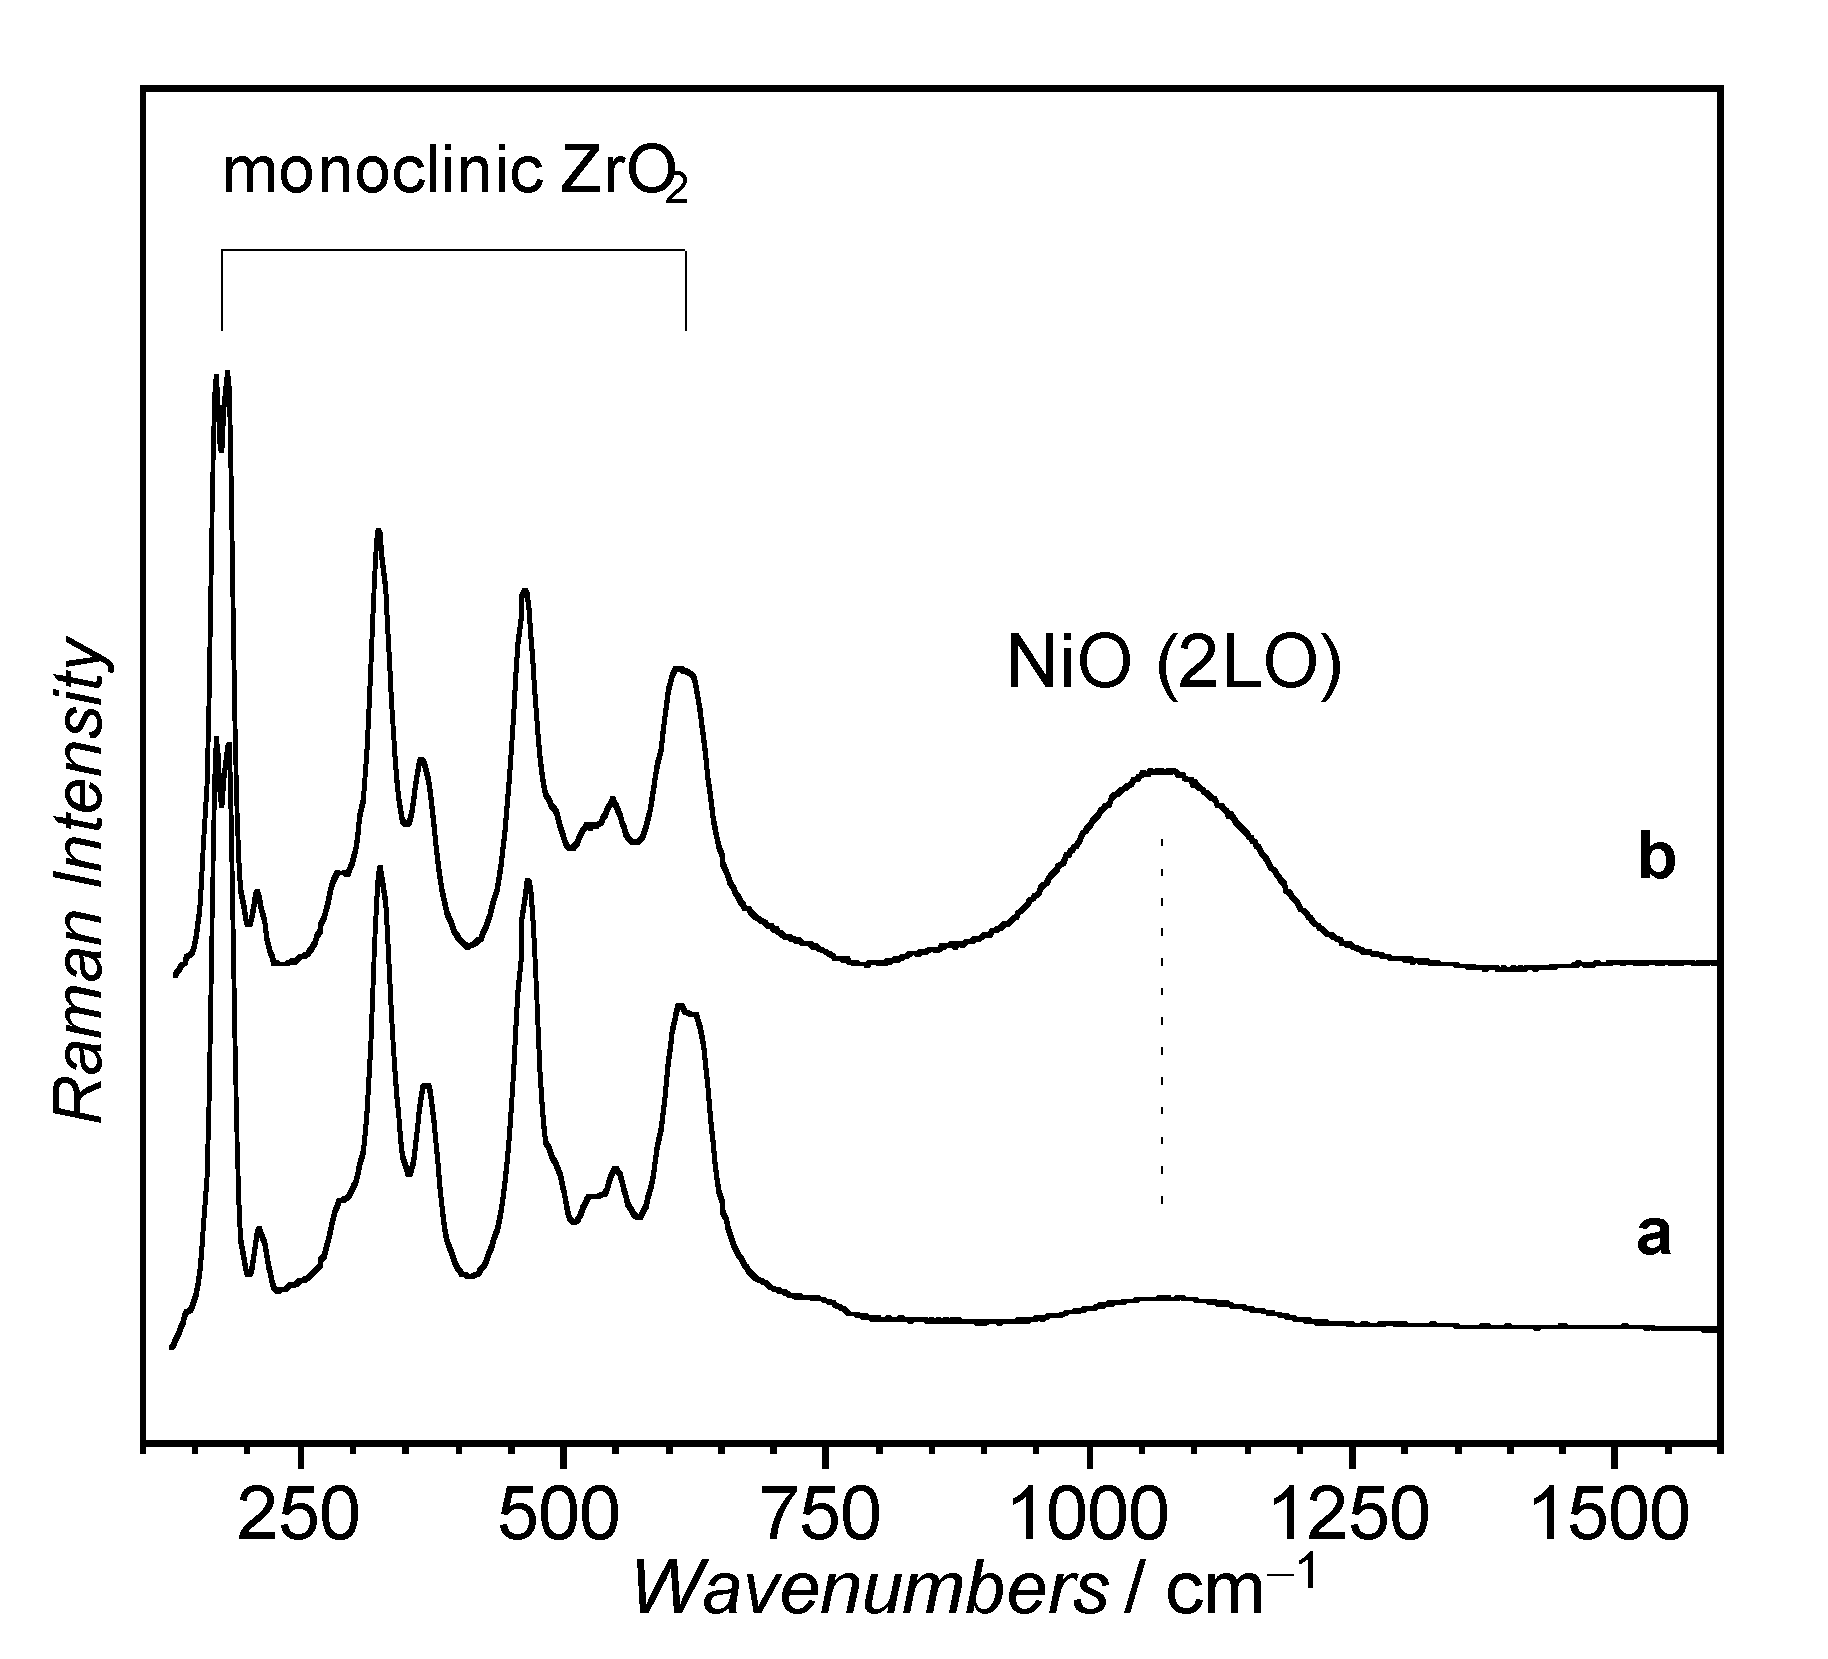
Raman spectra confirmed the presence of NiO both in the NiO/Zm and NiO/Zhy samples (Figure 3). NiO showed Raman bands at about 420 and 560 cm−1 (one-phonon, 1P: TO and LO modes, respectively) and at about 730, 906 and 1090 cm−1 (two-phonon, 2P: 2TO, TO + LO and 2LO modes, respectively) [46]. With the decrease in particle size, the 1P bands became more pronounced due to defects, whereas the 2P bands broadened and decreased in intensity [47]. For both 5.1NiO/Zm and 4.8NiO/Zhy samples, while the 1P and 2P modes in the range of 200–750 cm−1 were completely obscured by those of monoclinic ZrO2, the broad band at about 1090 cm−1 (2LO mode) clearly indicated the presence of the NiO phase (Figure 3). The much higher intensity of the 2LO band in the 5.1NiO/Zm sample than in the 4.8Ni/Zhy sample was consistent with the presence of larger NiO particles in the former than in the latter.
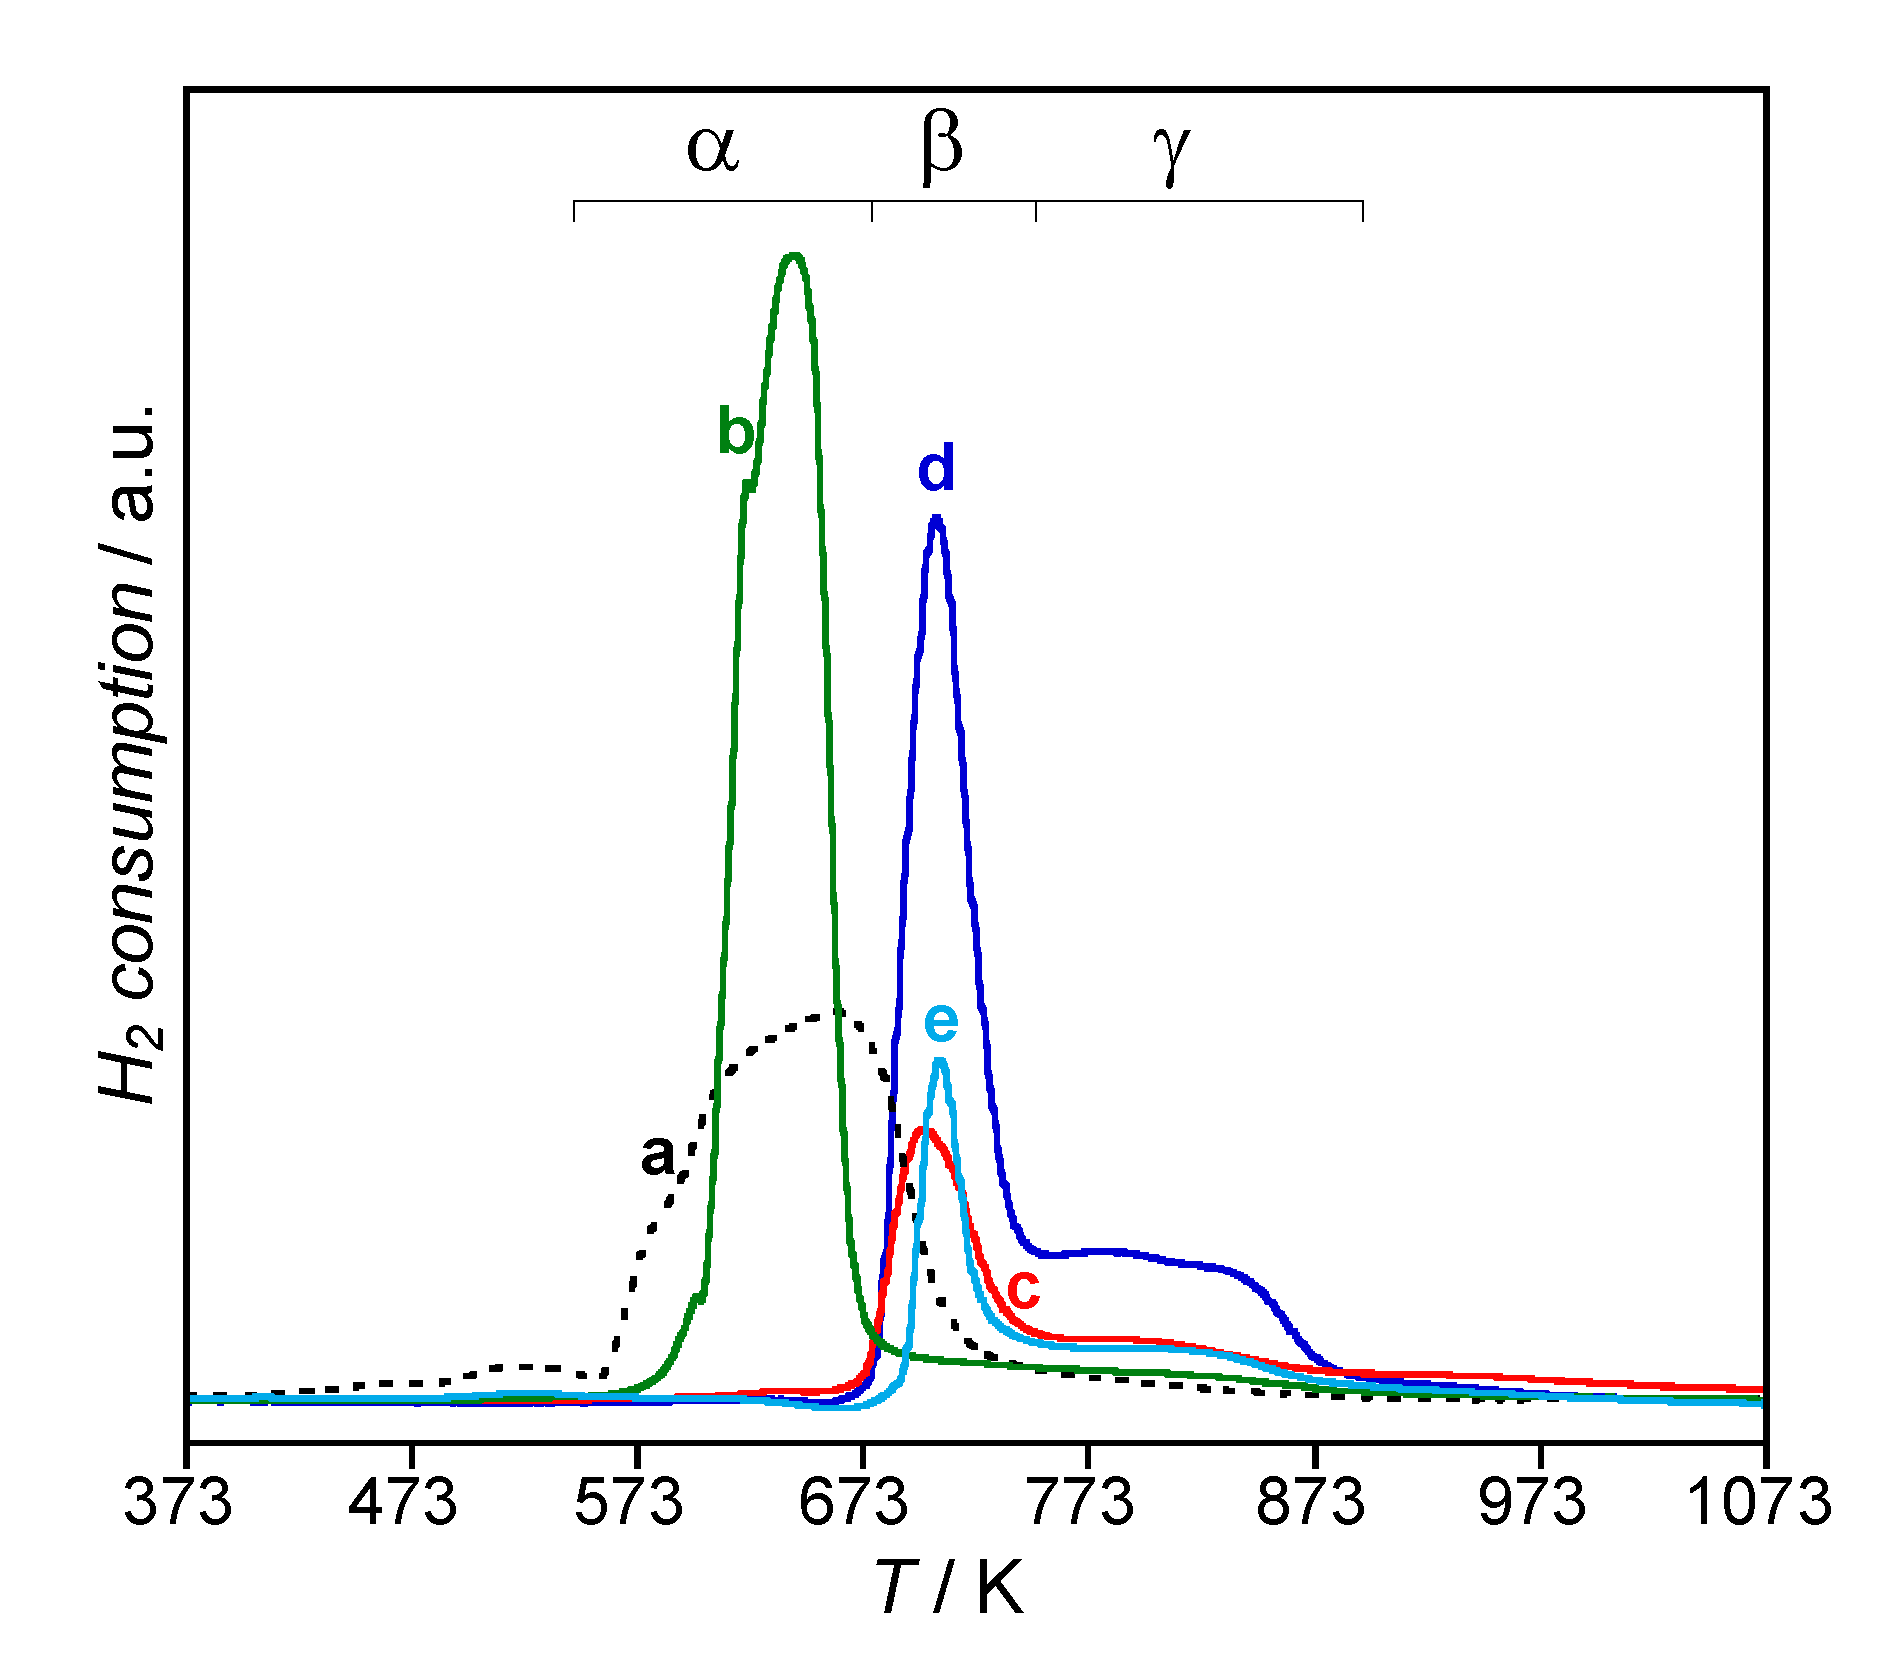
Temperature-programmed reduction (TPR) was applied to study the reducibility of NiO species, which is expected to depend on the strength of interaction with the support. In all the samples, NiO species were completely reduced to Ni metal in the temperature range of 473–923 K (total H2 consumption corresponding to about 2 e/Ni, Table 3).
The reduction profile of the 5.1NiO/Zm sample (Figure 4b) showed an intense H2 consumption peak in the 573–673 K range with a maximum at 640 K, close in position to that of unsupported NiO (Figure 4a), and a very weak H2 consumption spread up to 923 K. The 1.8NiO/Zm, 4.8NiO/Zhy and 1.7NiO/Zhy samples (Figure 4, profiles c–e) showed a very similar reduction profile with an intense and narrow peak at about 700 K and a broad hydrogen consumption in the 750–923 K range, with the integrated intensity of the peaks being proportional to the nickel content. Several authors have suggested that for NiO supported on ZrO2 or modified ZrO2, the stronger the interaction, the higher the reduction temperature [32,33,48,49,50,51]. Accordingly, the intense peak with a maximum at 640 K was attributed to NiO species not or weakly interacting with the ZrO2 surface, named α species; the peak and the envelope in the range of 673-873 K were ascribed to species interacting with the support, named β and γ, with the γ species being more strongly interacting than the β species are [51]. The similarity in shape and position of the reduction profiles of 1.8NiO/Zm, 4.8NiO/Zhy and 1.7NiO/Zhy precursors indicated that the strength of the NiO interaction with the support did not depend on the specific starting material adopted for the impregnation, Zm or Zhy. As shown in Table 3, for these samples, the H2 consumption was only due to β and γ NiO species and was much higher than that due to β and γ species in the 5.1NiO/Zm sample (100% vs 11%). The lower β and γ species amounts in 5.1NiO/Zm than in 1.8NiO/Zm precursors (Figure 4, profiles b and c, respectively) indicated that the amount of NiO interacting with the monoclinic ZrO2 decreased with nickel content, due to saturation of the low number of surface sites available on Zm to anchor Ni2+ species.
The characterization results for NiO/ZrO2 catalyst precursors indicated that the use of amorphous Zhy as a starting material for the preparation of samples favoured the spreading of NiO on the support (FESEM and Raman evidence), particularly at high Ni contents. The higher number of sites available on Zhy than on Zm to anchor Ni2+ species during the impregnation step allowed the formation of smaller NiO particles on Zhy than on Zm during the subsequent thermal treatment, implying a higher number of Ni sites strongly interacting with Zhy than with Zm (TPR evidence).

3.1.3. Ni/ZrO2 Catalysts

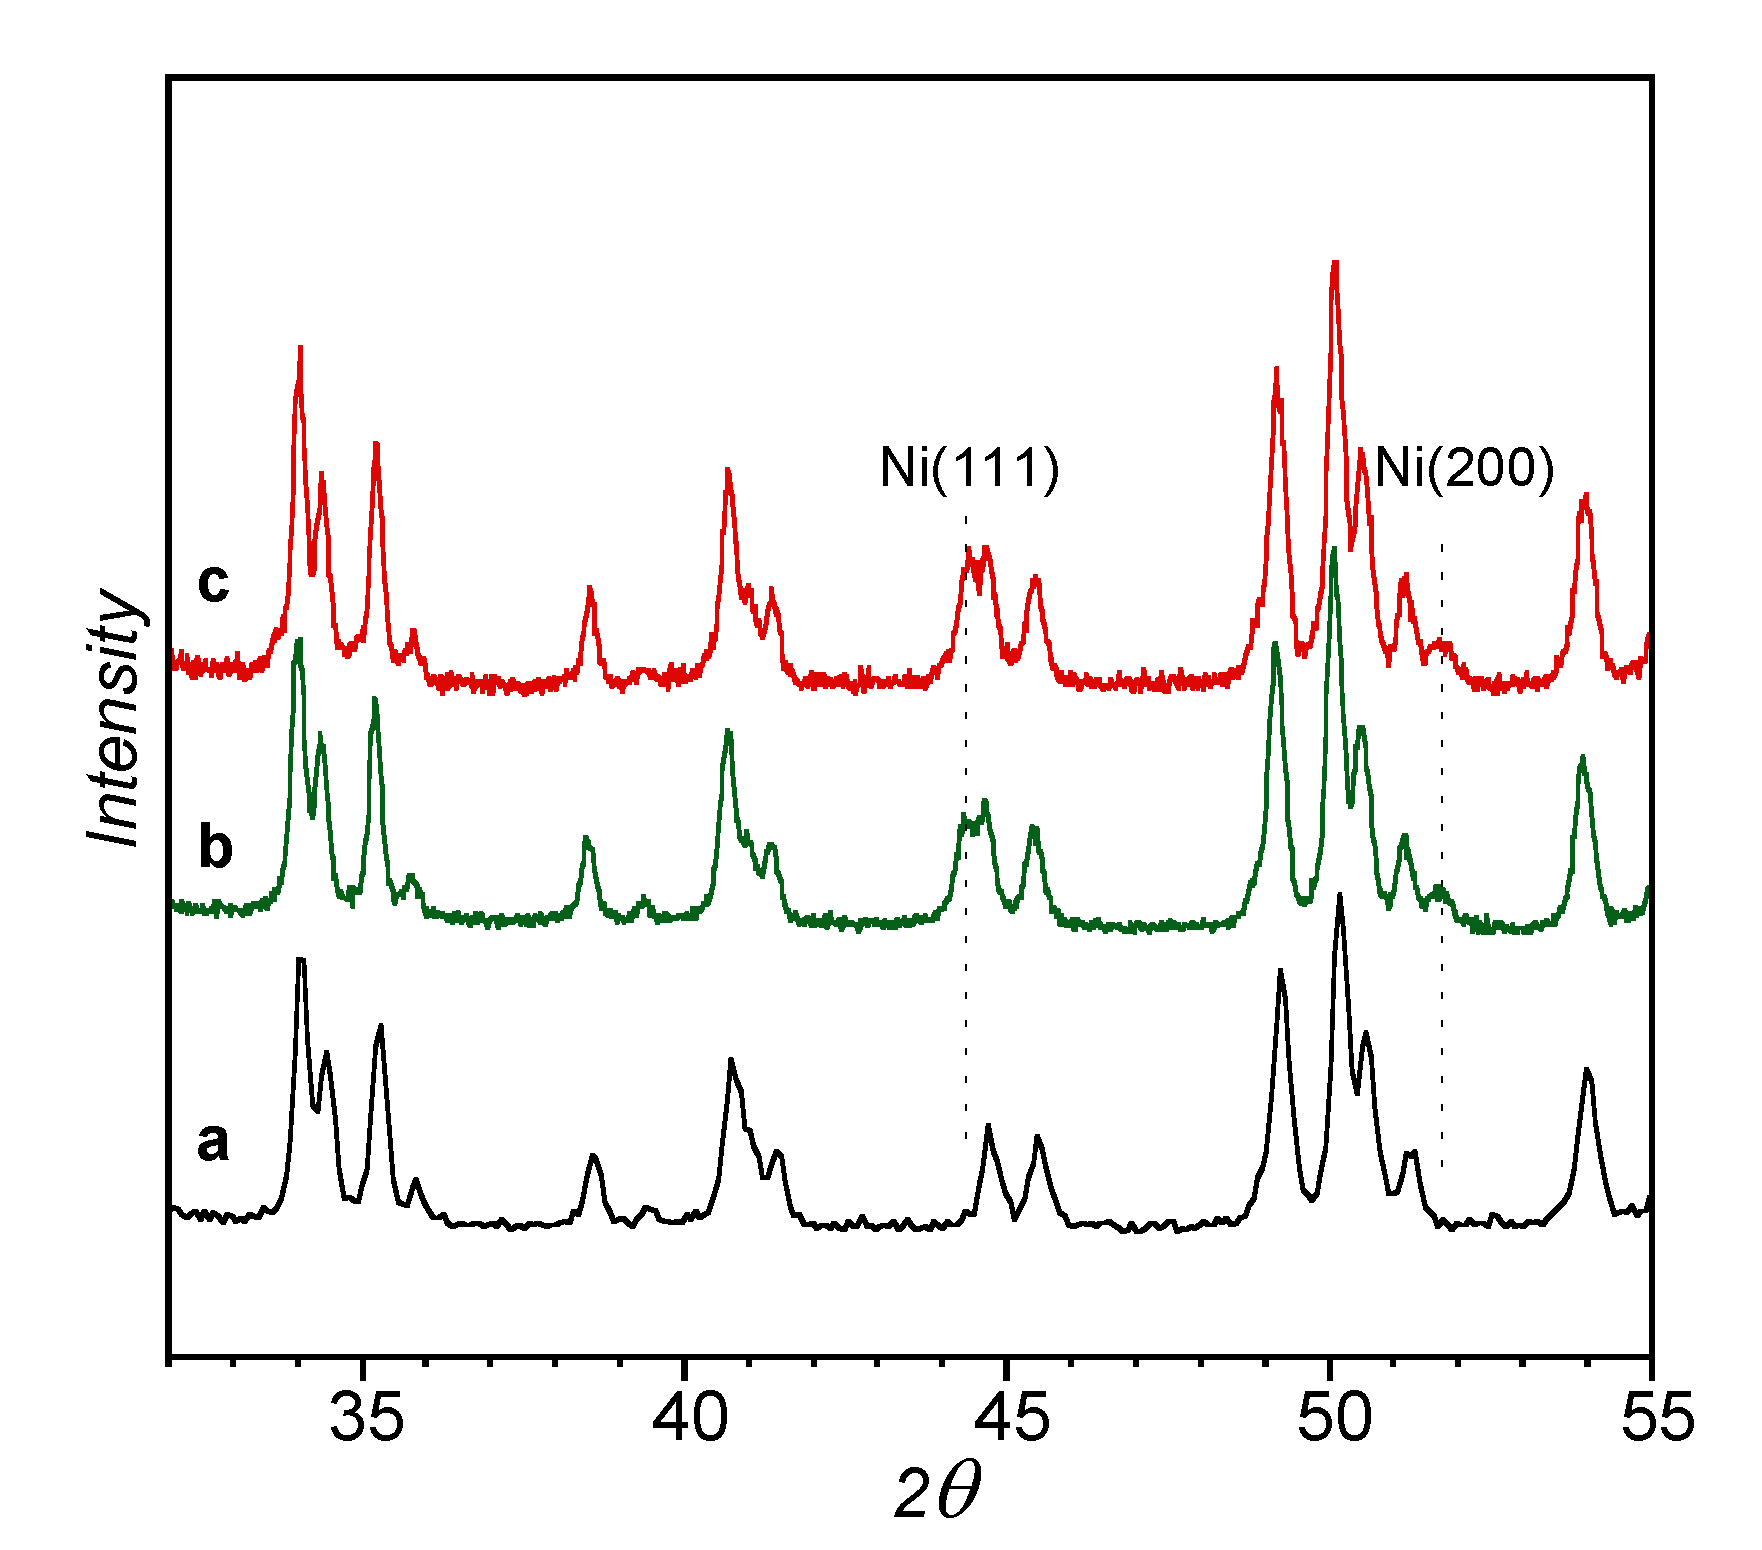
XRD patterns of Ni/ZrO2 catalysts, irrespective of the different activation treatments, showed reflections assigned to the (111) and (200) planes of Ni metal (JCPDS card 04-0850) and to monoclinic ZrO2 (JCPDS card 37-1484), as shown in Figure 5 for both 4.8Ni/Zhy ox-red and red, as an example.
Ni crystallite sizes, obtained by the Scherrer equation [41] using the (200) and/or (111) reflections, ranged from 18 to 35 nm for all of the samples (Table 1).
FESEM micrographs showed Ni particles larger in size with respect to XRD, indicating that, as for NiO, Ni crystallite aggregates were present on the zirconia surface. For Ni/Zm catalysts, the Ni particle sizes (Table 2) were in the range of 5–75 nm in the 1.8Ni/Zm (ox-red) sample (Figure 6a), and in the range of 30–1000 nm (highly heterogeneous in size) in the 5.1Ni/Zm (ox-red) sample (Figure 6b). For Ni/Zhy catalysts, small Ni particles of about 5–45 nm in diameter, in both the 1.7Ni/Zhy (ox-red) and 4.8Ni/Zhy (ox-red) samples, were detected (Figure 6c,d). Particle size values in the same ranges were found for the corresponding Ni/Zhy (red) and Ni/Zm (red) catalysts (Table 2).
Both the ox-red and red activation treatments caused a small particle sintering during the reductive process. In fact, instead of the expected decrease in particle size due to oxygen removal (based on NiO and Ni volume atomic densities, ρNiO = 2.69·1022 Ni-atoms/cm3 and ρNi = 9.13·1022 Ni-atoms/cm3, respectively) [45], we observed a small increase in size (compare dFESEM of Ni with dFESEM of NiO particles, Table 2). This result suggests that the NiO-ZrO2 interaction in the catalyst precursors was strong enough to limit the aggregation of Ni particles during the reduction process. In agreement, metal particle sizes of the unsupported Ni metal sample ranged from 40 to 1500 nm, much larger than those detected on Ni/ZrO2 samples (Table 2).
Overall, irrespective of the activation treatments, ox-red or red, Ni particles were smaller and more homogeneous in size in Ni/Zhy than in Ni/Zm catalysts, particularly at high Ni contents.

3.1.4. Dispersion of Ni in the Ni/ZrO2 Catalysts

To interpret the catalytic results (see below), the determination of Ni dispersion values is an important step in shedding light on the nature of active sites. The most frequently used method to evaluate the dispersion of the active phase is selective hydrogen chemisorption that allows the metal surface area measuring the H2 uptake to be determined. However, even in the samples with high Ni content and small particle size (as revealed by FESEM), the expected H2 uptake is too low to be confidently detected with our laboratory facilities (TPD and/or H2 chemisorption). As an alternative, the Ni dispersion could be evaluated by a physical technique able to measure particle diameters, di. Among the electron microscopy techniques, TEM is considered the most reliable and accurate physical technique for di measurements due to a resolution as high as 0.1 nm, whereas FESEM microscopy has a lower sensitivity limit (5 nm). As the particle sizes in our samples (Table 2) were above 5 nm in size, we confidently used FESEM microscopy to measure di values.
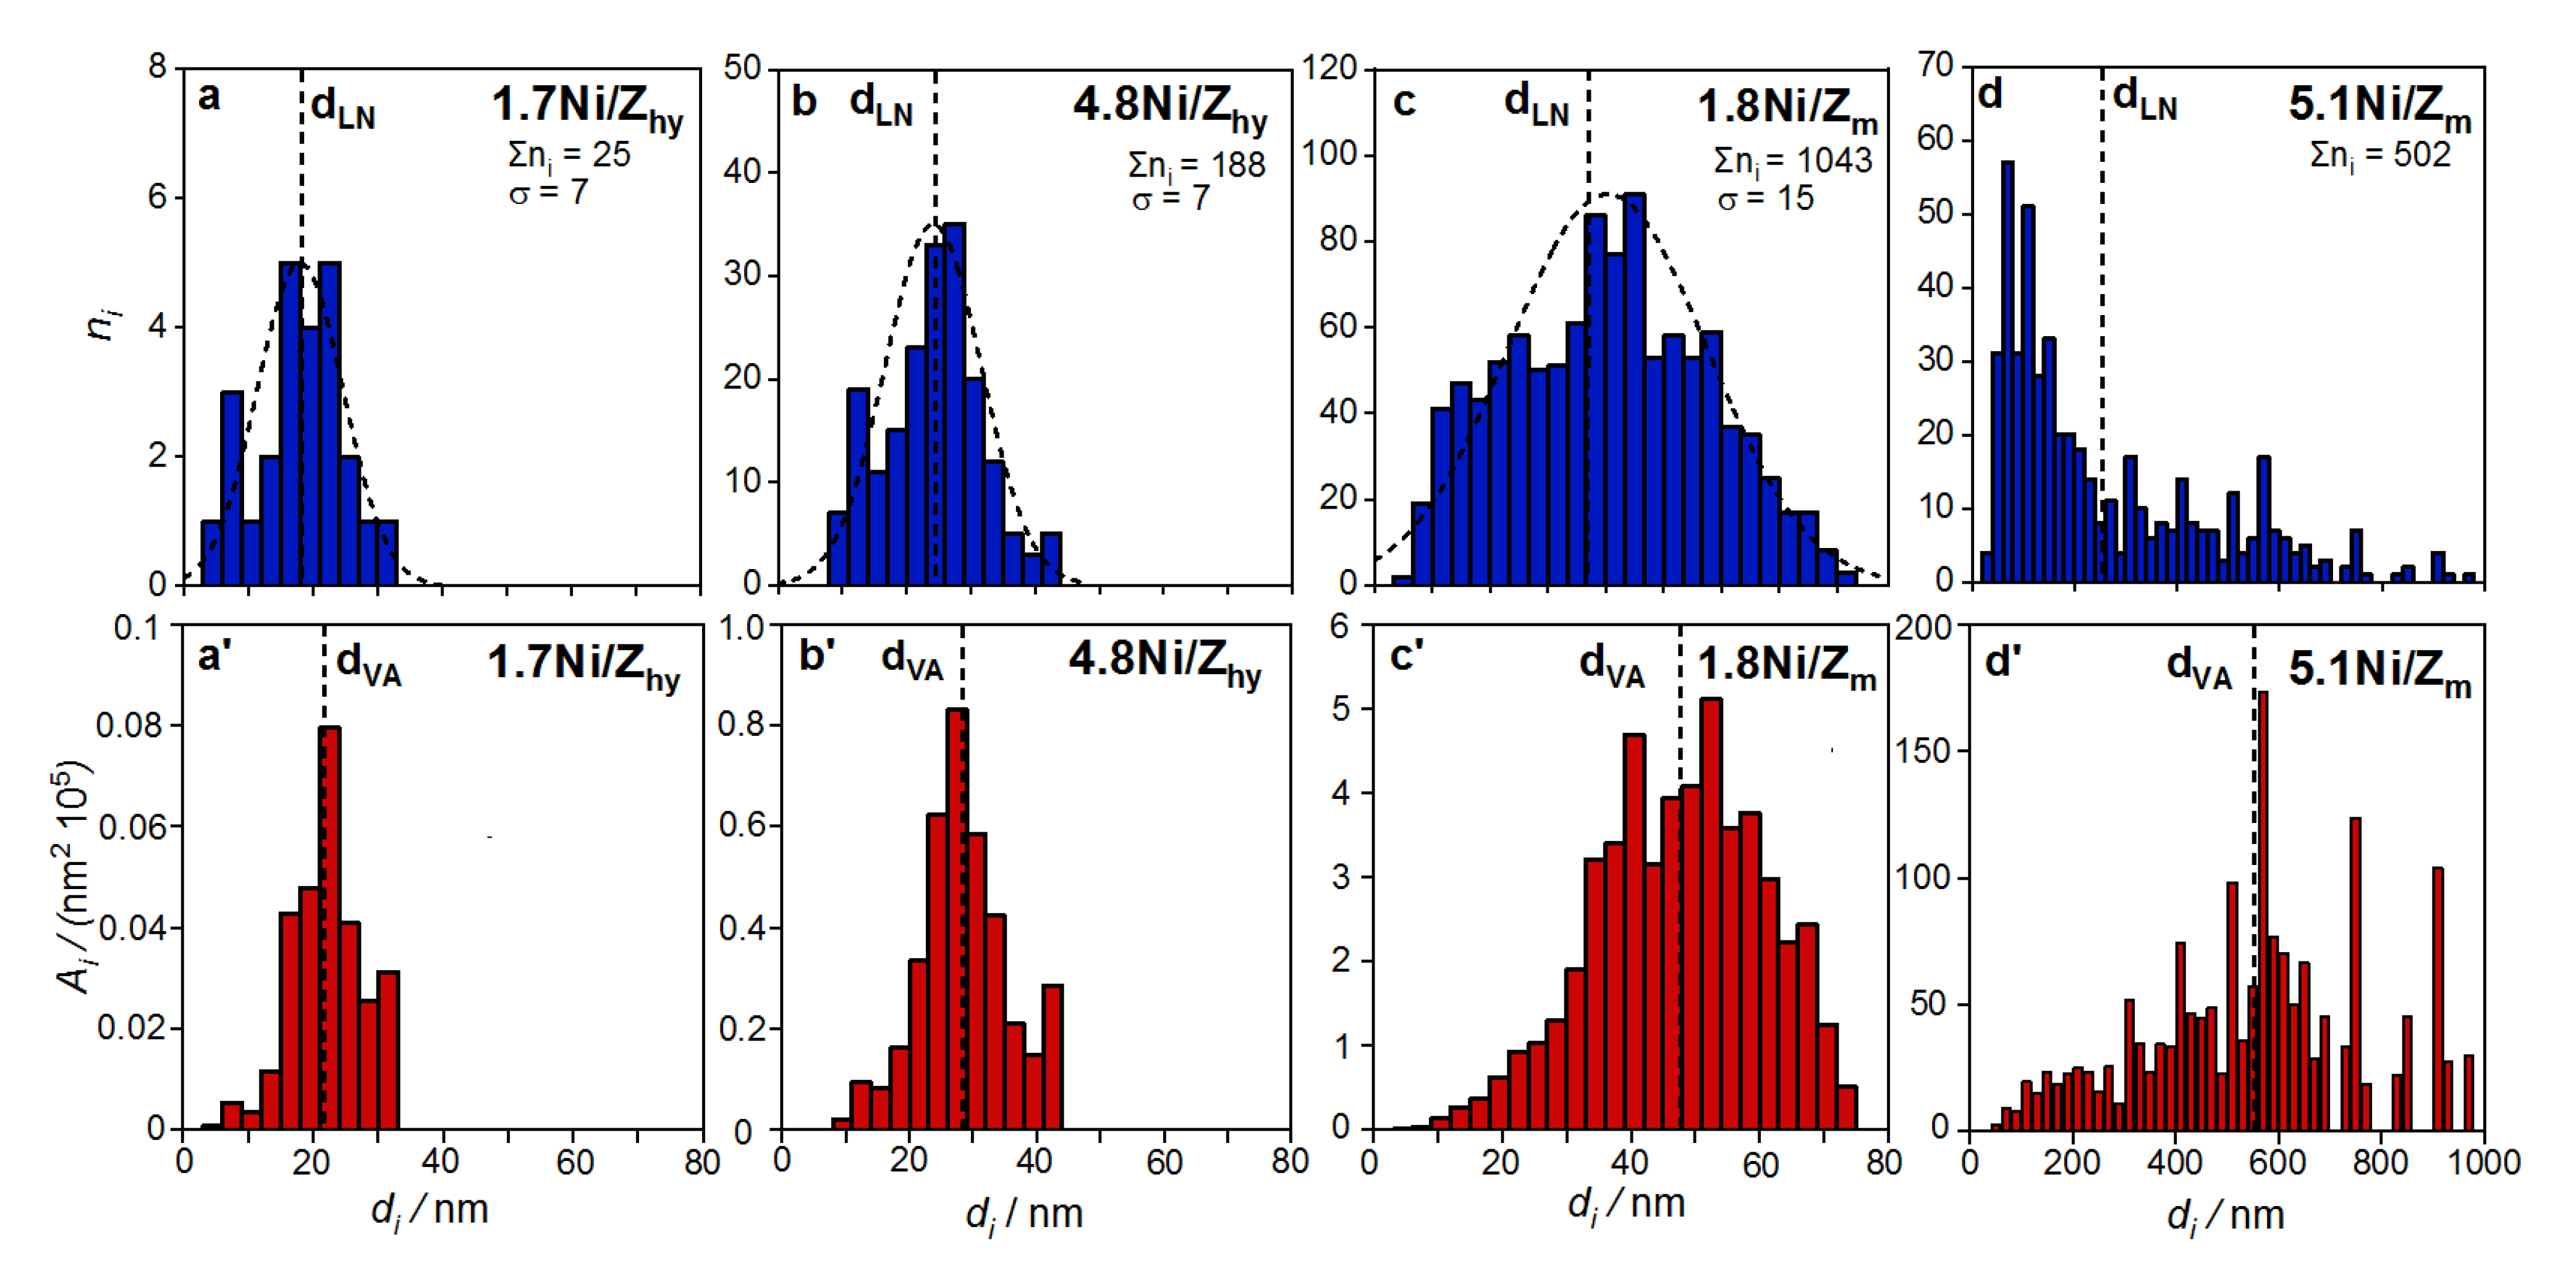
From FESEM image processing, we obtained a distribution of Ni-particle size, di, which was nearly symmetrical for the Ni/Zhy samples and the 1.8Ni/Zm sample (Figure 7a–c), whereas it was asymmetrical and spread over a broad range of di sizes (up to 1000 nm) for the 5.1Ni/Zm sample (Figure 7d). From these distributions, the length-number mean diameter, dLN, could be calculated (Table 2), as dLN = Σdi/Σni [45], where ni is the number of metal particles with a specific diameter di. As reported in the literature [45,52], for phenomena depending on the particle surface, such as the catalytic activity, the mean diameter value that gives a better account of the total metal surface area is the volume/area mean diameter, dVA (dVA = Σinidi3/Σnidi2 = 6·ΣiniVi/ΣniAi), which is directly related to the metal surface area [45]. In fact, in a particle-size distribution, large particles give the major contribution to the total metal surface area, as shown in the particle-surface distribution of Ni/ZrO2 samples at increasing particle size (Figure 7a’–d’). Therefore, the dispersion was calculated from the dVA values, which are always higher than the dLN values [53]. The difference between dVA and dLN increased as the distribution broadened towards larger di sizes. In agreement, for the 1.7Ni/Zhy, 1.8Ni/Zm and 4.8Ni/Zhy samples, dVA values were similar to the dLN values, whereas for the 5.1Ni/Zm sample, the dVA value was about twice that of the dLN value (Figure 7 and Table 2). FESEM image processing gave similar Ni dispersion values for the 1.7Ni/Zhy and 4.8Ni/Zhy samples (about 4%), slightly lower for the 1.8Ni/Zm sample (about 2%), and about 20 times lower for the 5.1Ni/Zm sample (Table 2).

3.1.5. Ni/ZrO2 Used Catalysts

XRD patterns of all the used catalysts were similar to those of activated catalysts, showing the presence of both monoclinic ZrO2 and Ni metal phases. The Ni mean crystallite size, estimated by XRD (Table 1), remained nearly unchanged under catalytic conditions.
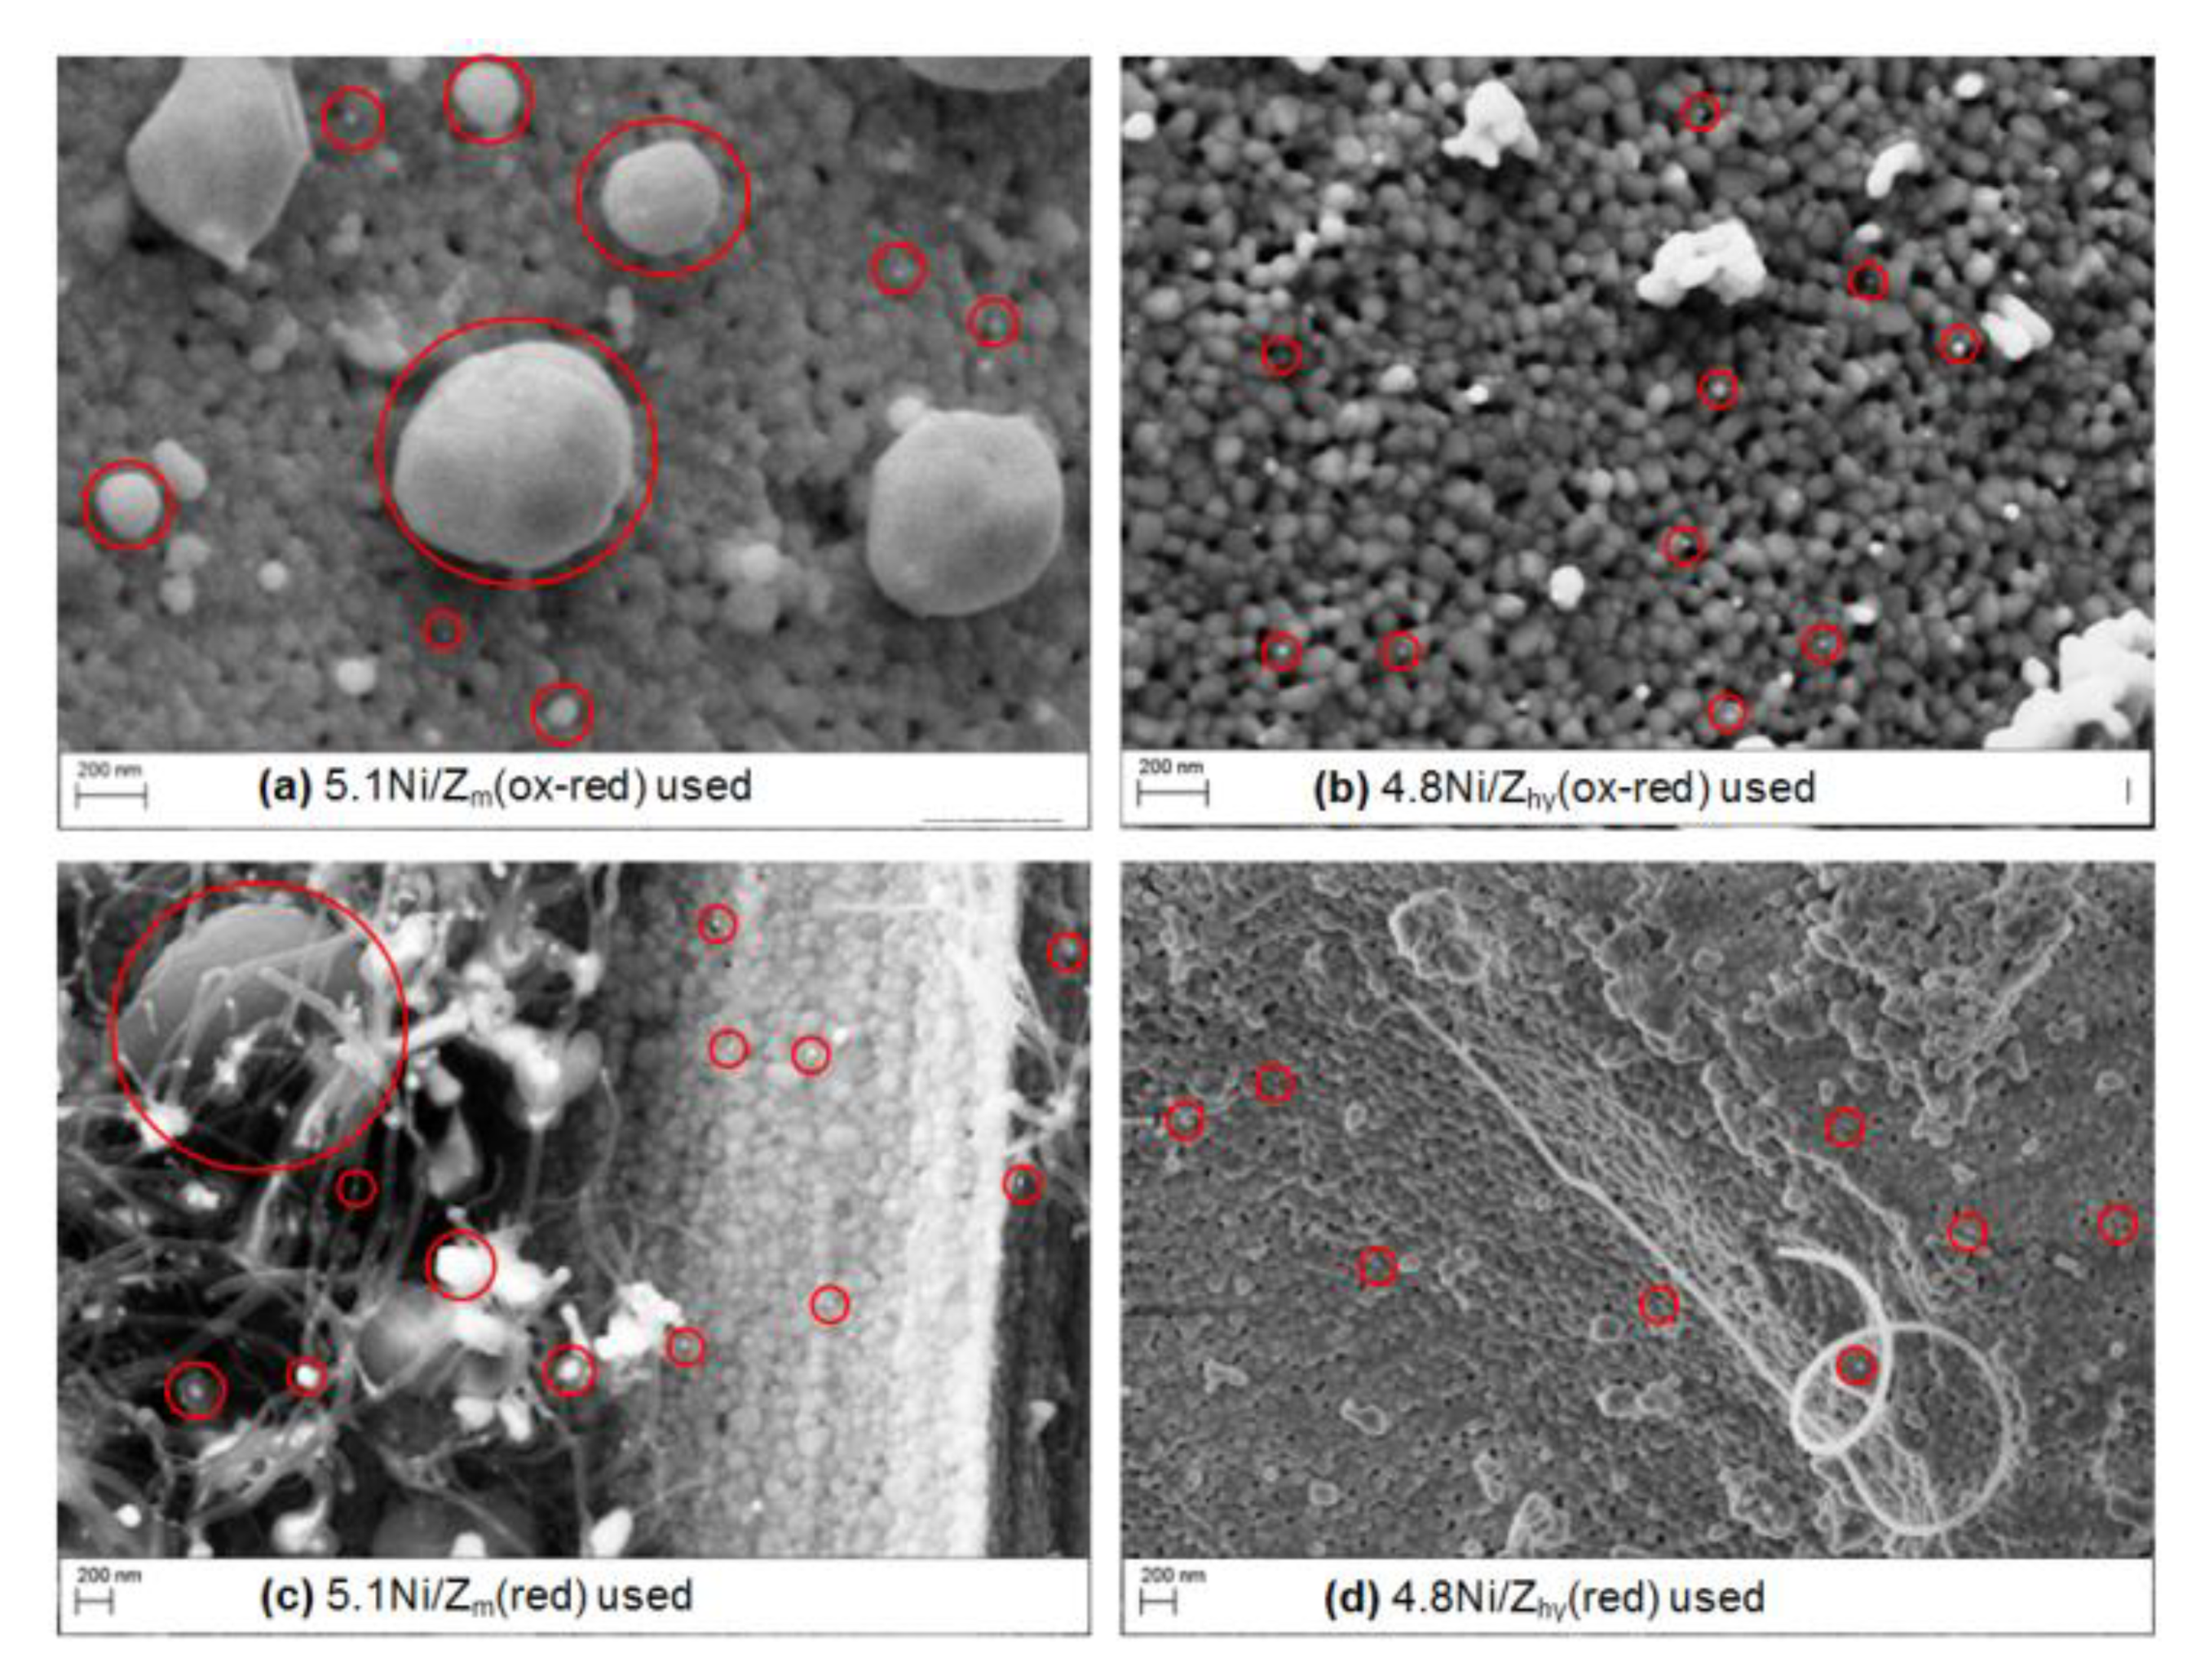
FESEM analysis confirmed that Ni particles remained unchanged both in size and distribution after catalytic runs (Table 2), as revealed by comparing Figure 6b,d with Figure 8a,b for high-loaded catalysts as an example. These results supported the idea that, irrespective of dispersion, Ni metal particles did not undergo sintering under catalytic conditions. Carbon whiskers encapsulating Ni particles were detected on both 5.1Ni/Zm (red) and 4.8Ni/Zhy (red) used catalysts, whereas they were not observed on the Ni/Z (ox-red) used catalysts (Figure 8). This suggests that Ni particles were firmly anchored to the ZrO2 support in Ni/Z (ox-red) catalysts, whereas in Ni/Z (red) catalysts, some Ni species showed a different reactivity that led to the growth of C whiskers incorporating Ni.
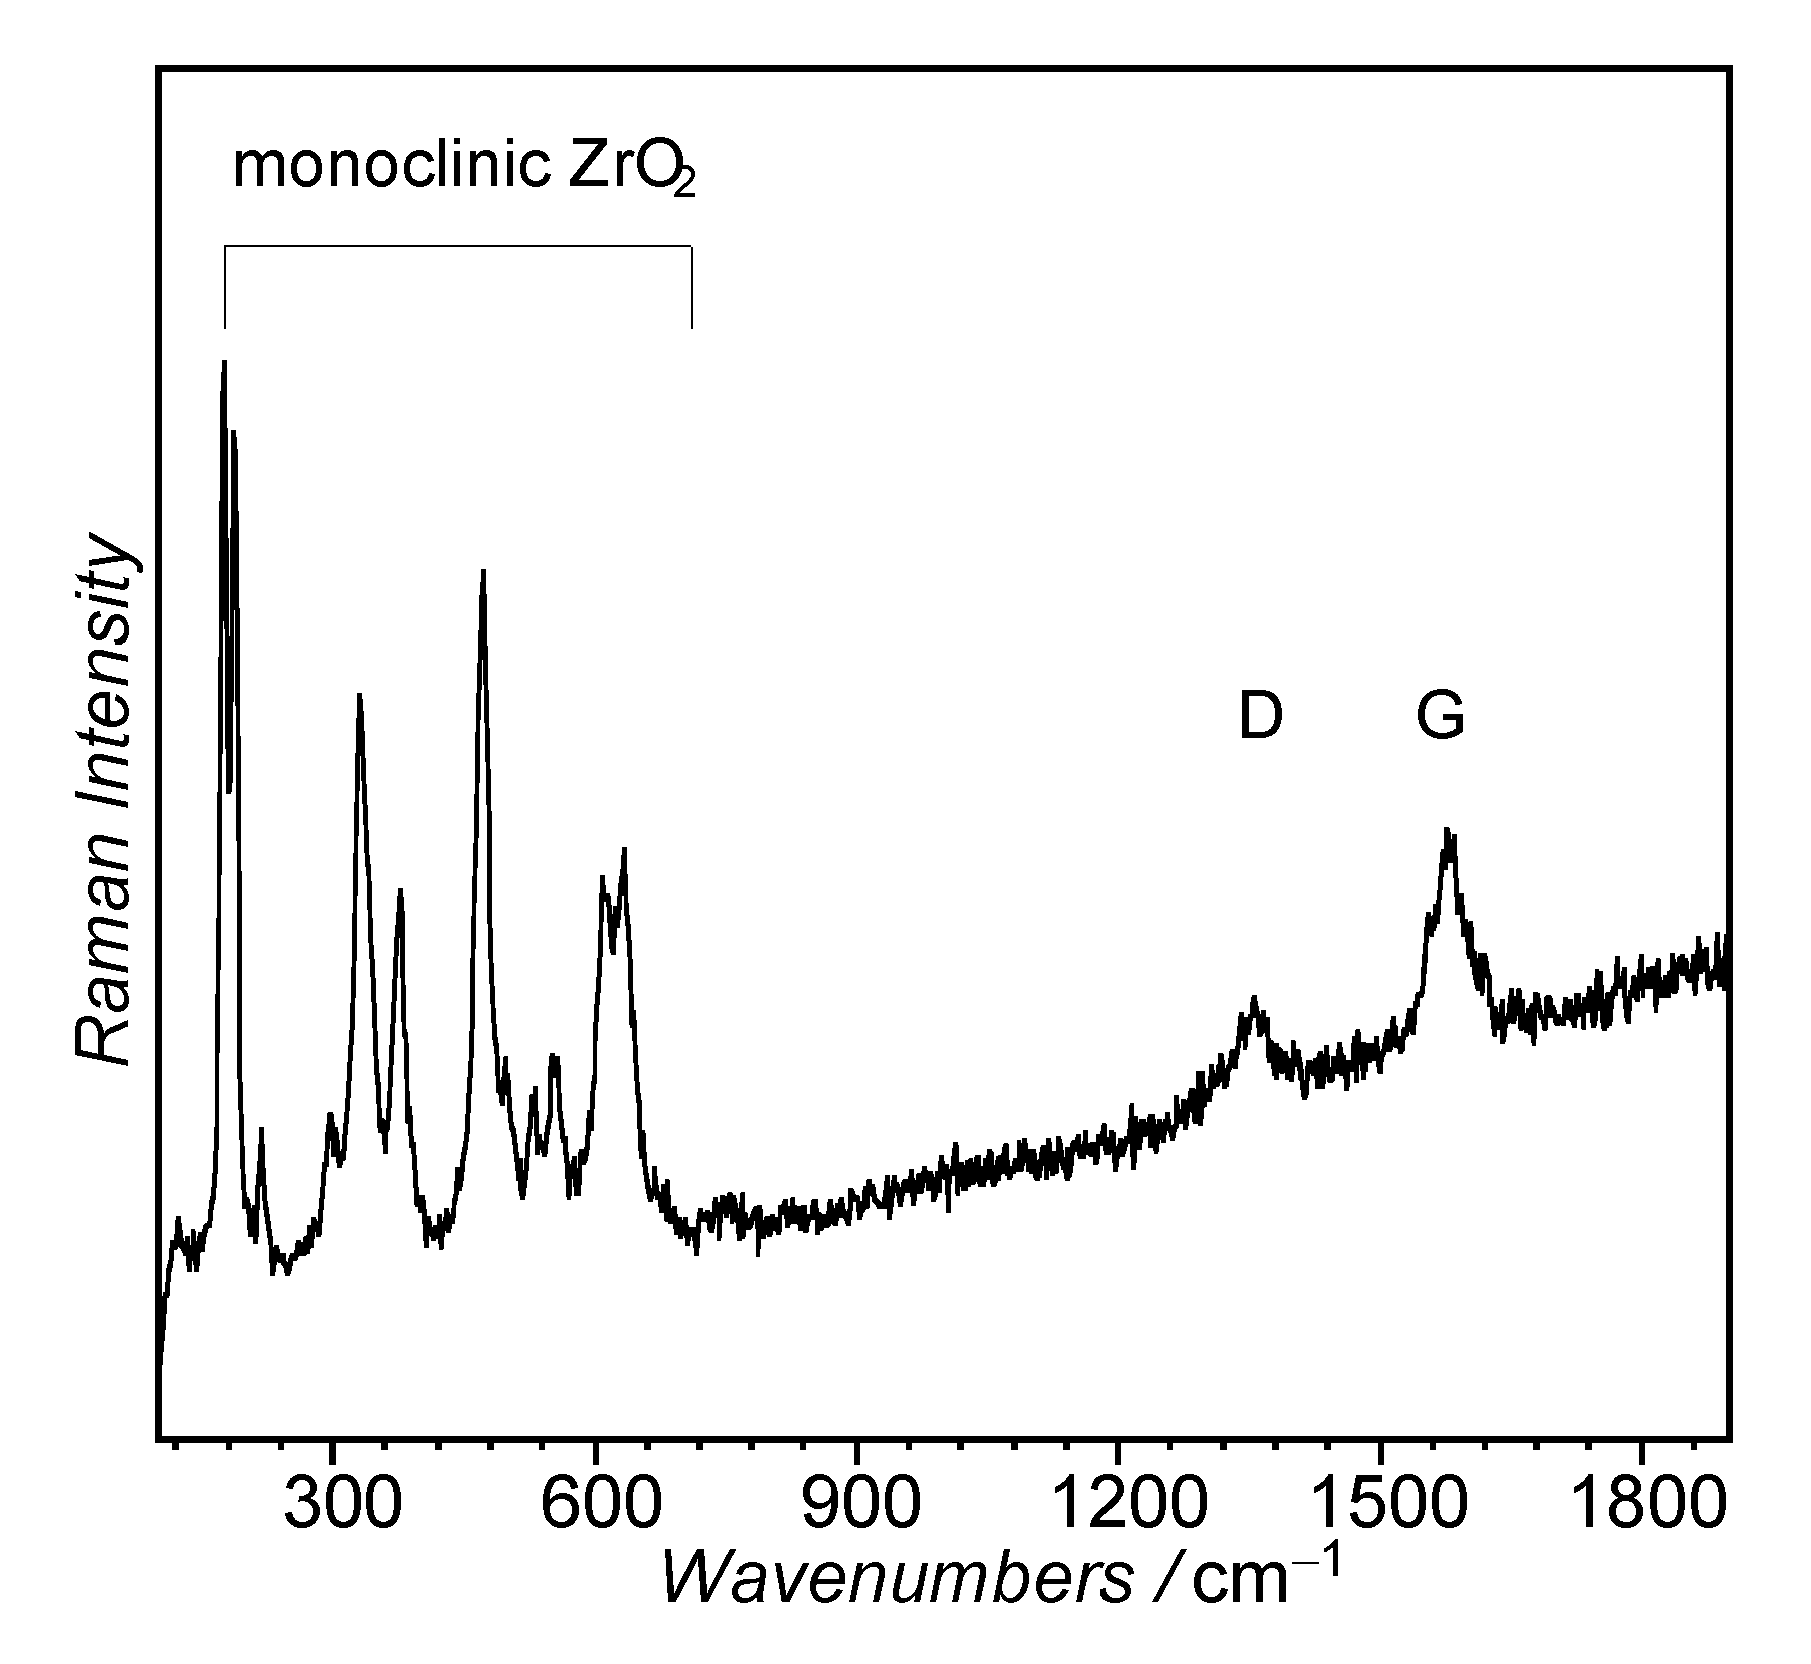
Raman spectroscopy, in agreement with FESEM results, clearly identified carbonaceous deposits on both 5.1Ni/Zm (red) and 4.8Ni/Zhy (red) used catalysts. As illustrated in Figure 9 for the 5.1Ni/Zm (red) used sample as an example, in addition to the bands due to monoclinic ZrO2, bands at about 1320 cm−1 (D band) and 1584 cm−1 (G band) were recorded. The G band (‘graphite peak,’ E2g symmetry) is characteristic of a perfect graphite lattice, whereas the D band (‘defect peak,’ A1g symmetry) is related to a defective graphitic lattice [53]. The nonoverlapping of the D and G bands is consistent with the presence of a structured carbon; the band at about 1584 cm−1 could originate from graphitic carbon types on the catalyst’s surface and that at about 1320 cm−1 could originate from carbon nanoparticles or defective filamentous carbon. The relative intensity of the D band to the G band, ID/IG, has been taken as a measure of the structural disorder of the carbon material, a high ratio indicating a large amount of disorder in the structure and more reactive carbon species [24]. An ID/IG value of 0.9 was obtained by the curve fitting procedure for the 5.1Ni/Zm (red) used sample, indicating the presence of a significant contribution of graphite-type structures.
Overall, characterization results of catalysts, before and after catalytic runs, showed that the starting material adopted for the preparation, Zhy or Zm, (i) affected the Ni particle sizes (smaller for the high-surface Zhy) because it affected the NiO particle sizes in the catalyst precursors; (ii) it did not affect the strength of the interaction between Ni particles and the ZrO2 surface. In all the catalysts, the activation treatment of the NiO/ZrO2 precursors did not affect the Ni particle sizes or the Ni-ZrO2 interactions that were strong enough to prevent the sintering of the Ni metal particles.

3.2. Catalytic Activity

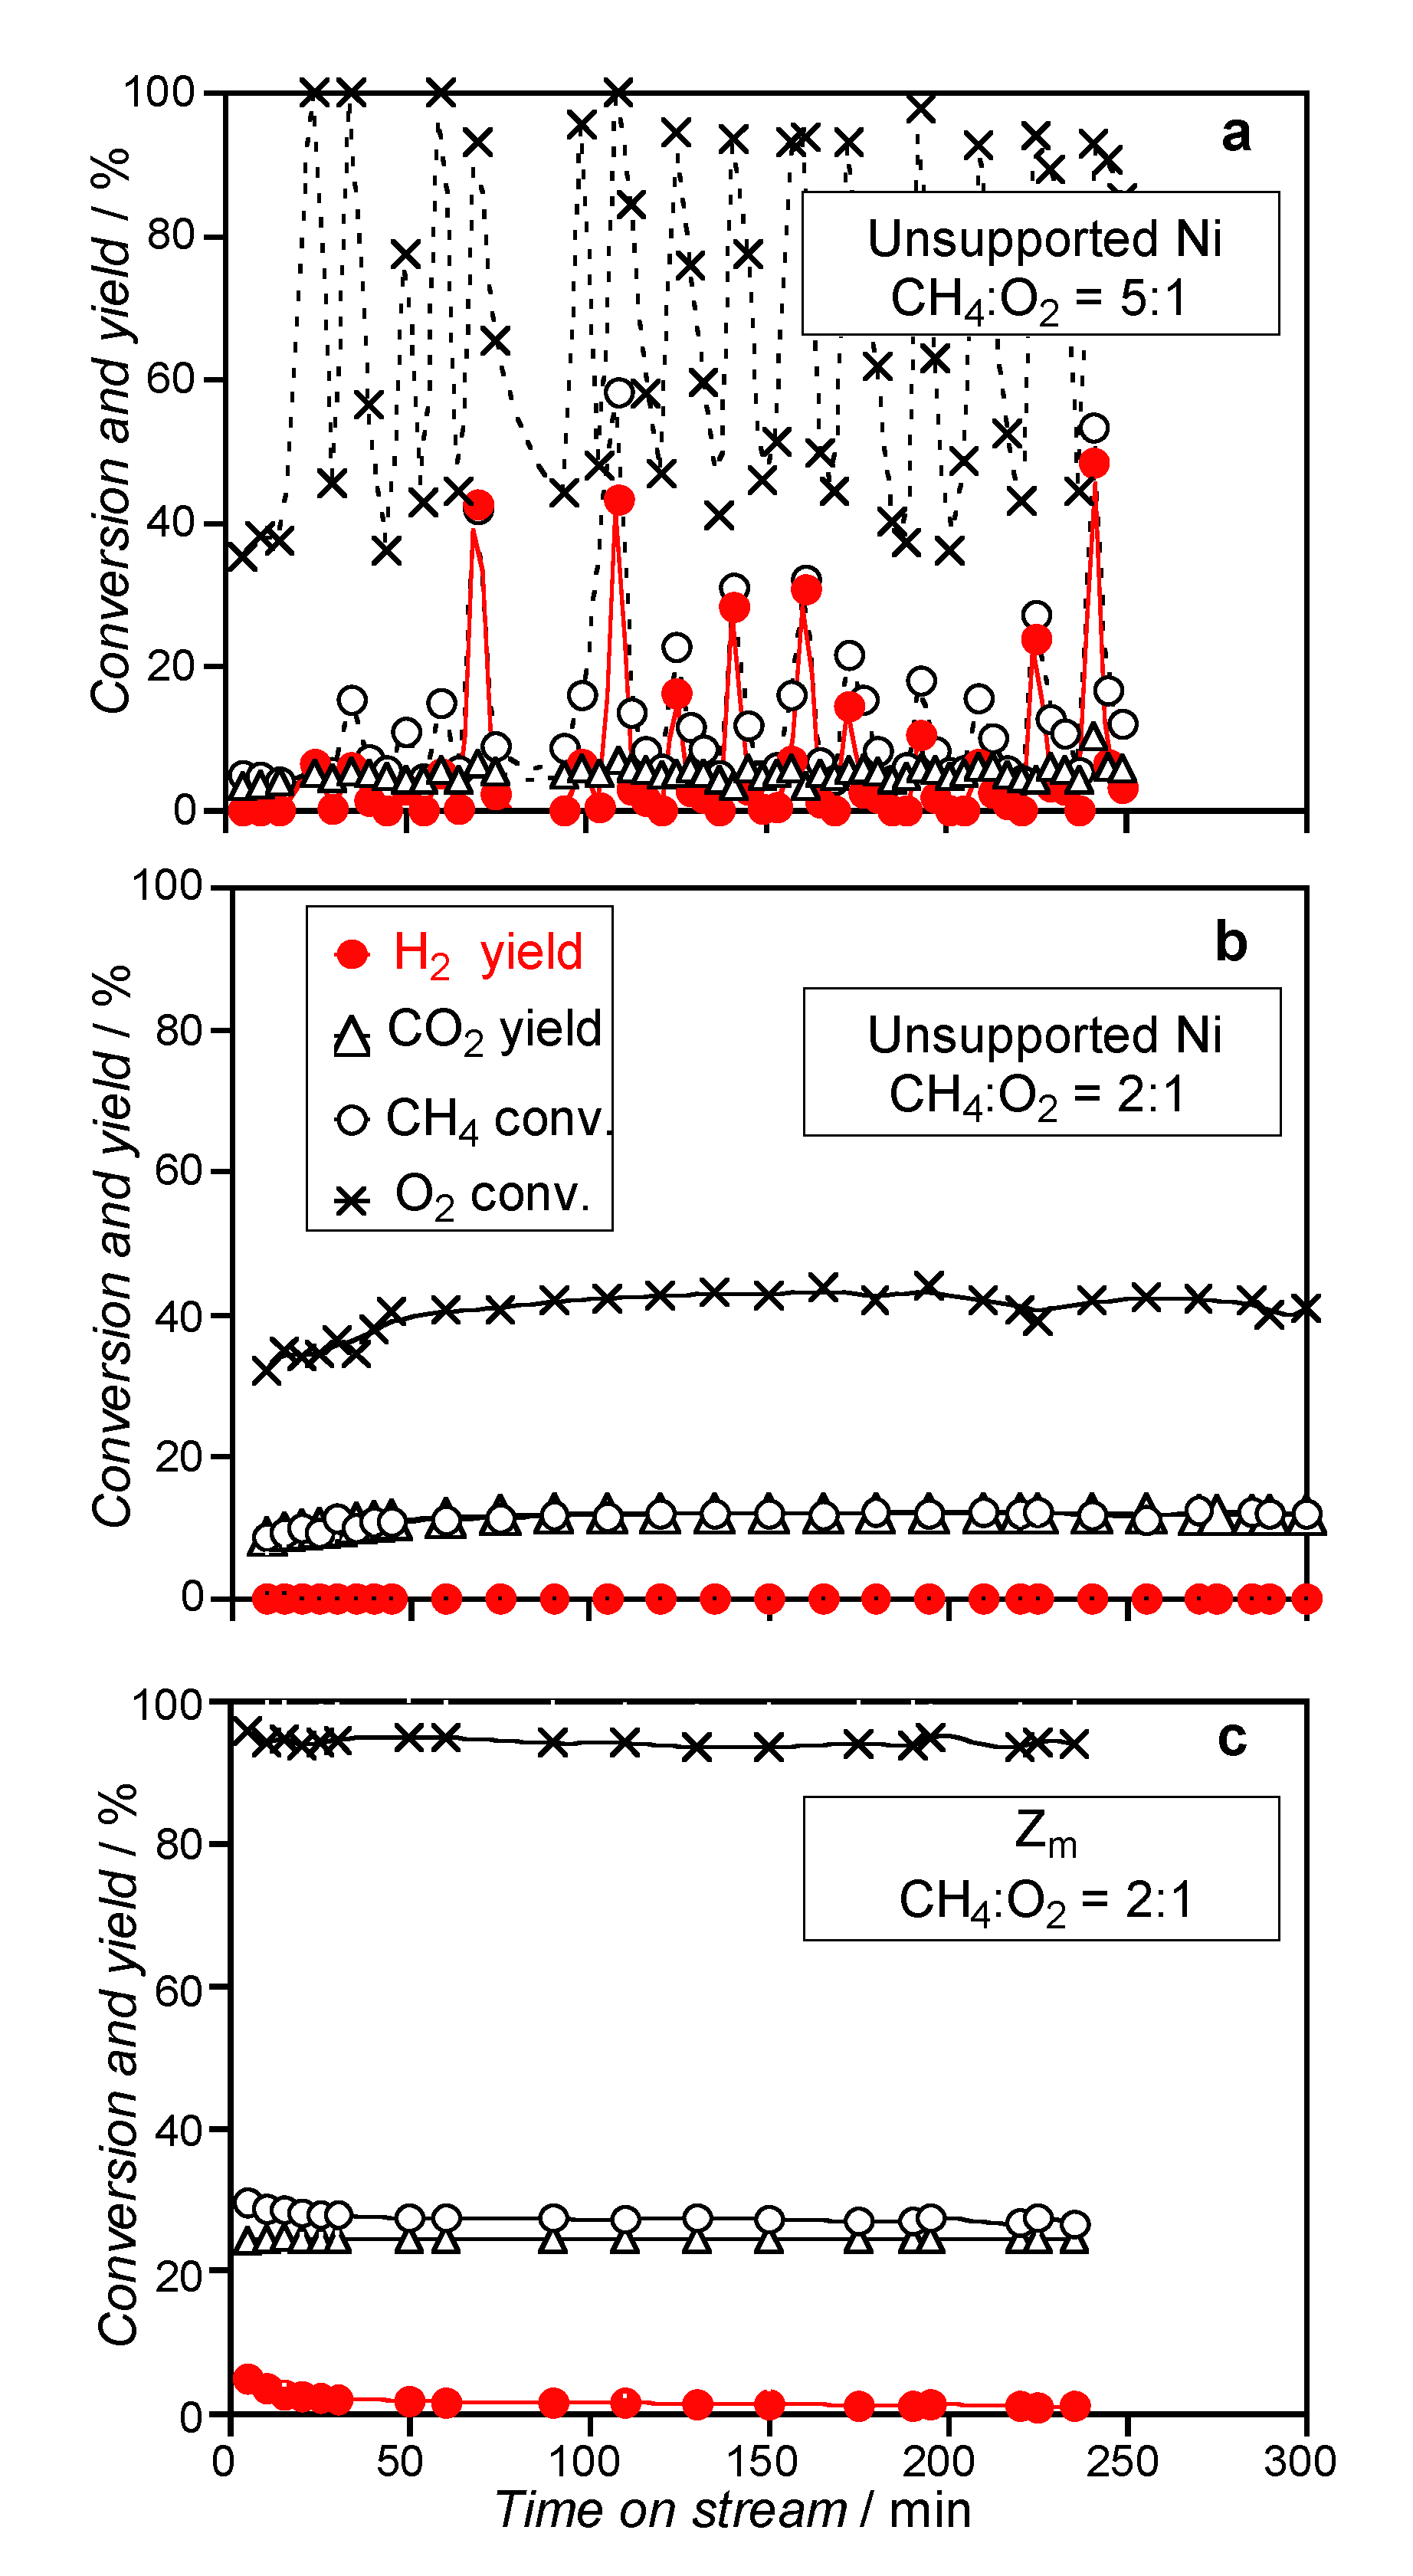
Unsupported Ni as foil or wires was reported to be somewhat active for the CH4-CPO using a methane-rich mixture CH4:O2 = 5:1, with a peculiar oscillatory activity [54,55]. Unsupported Ni metal powder was tested for the CH4-CPO using the methane-rich mixture and the stoichiometric mixture (CH4:O2 = 2:1). Irrespective of the activation procedure (ox-red or red), Ni metal powder showed an oscillatory on–off activity at 1023 K with the methane-rich mixture (Figure 10a), whereas it was inactive for syngas production with the stoichiometric mixture, showing only activity for the CH4 total combustion (Figure 10b).
The Zm support was inactive for the CH4-CPO in the temperature range of 773–1023 K with the CH4:O2 = 2:1 mixture and, irrespective of the activation treatment, yielded a total oxidation of CH4 above 823 K (maximum CO2 yield of about 25% at 1023 K, Figure 10c).
Unlike ZrO2 and unsupported Ni metal, Ni/ZrO2 catalysts were active for the CH4-CPO, indicating that the metal–support interaction plays a key role in developing Ni active species. However, the catalytic behaviour markedly depended on the activation procedure (ox-red or red), as illustrated in the following sections.

3.2.1. Catalysts Activated by Oxidation–Reduction Treatment

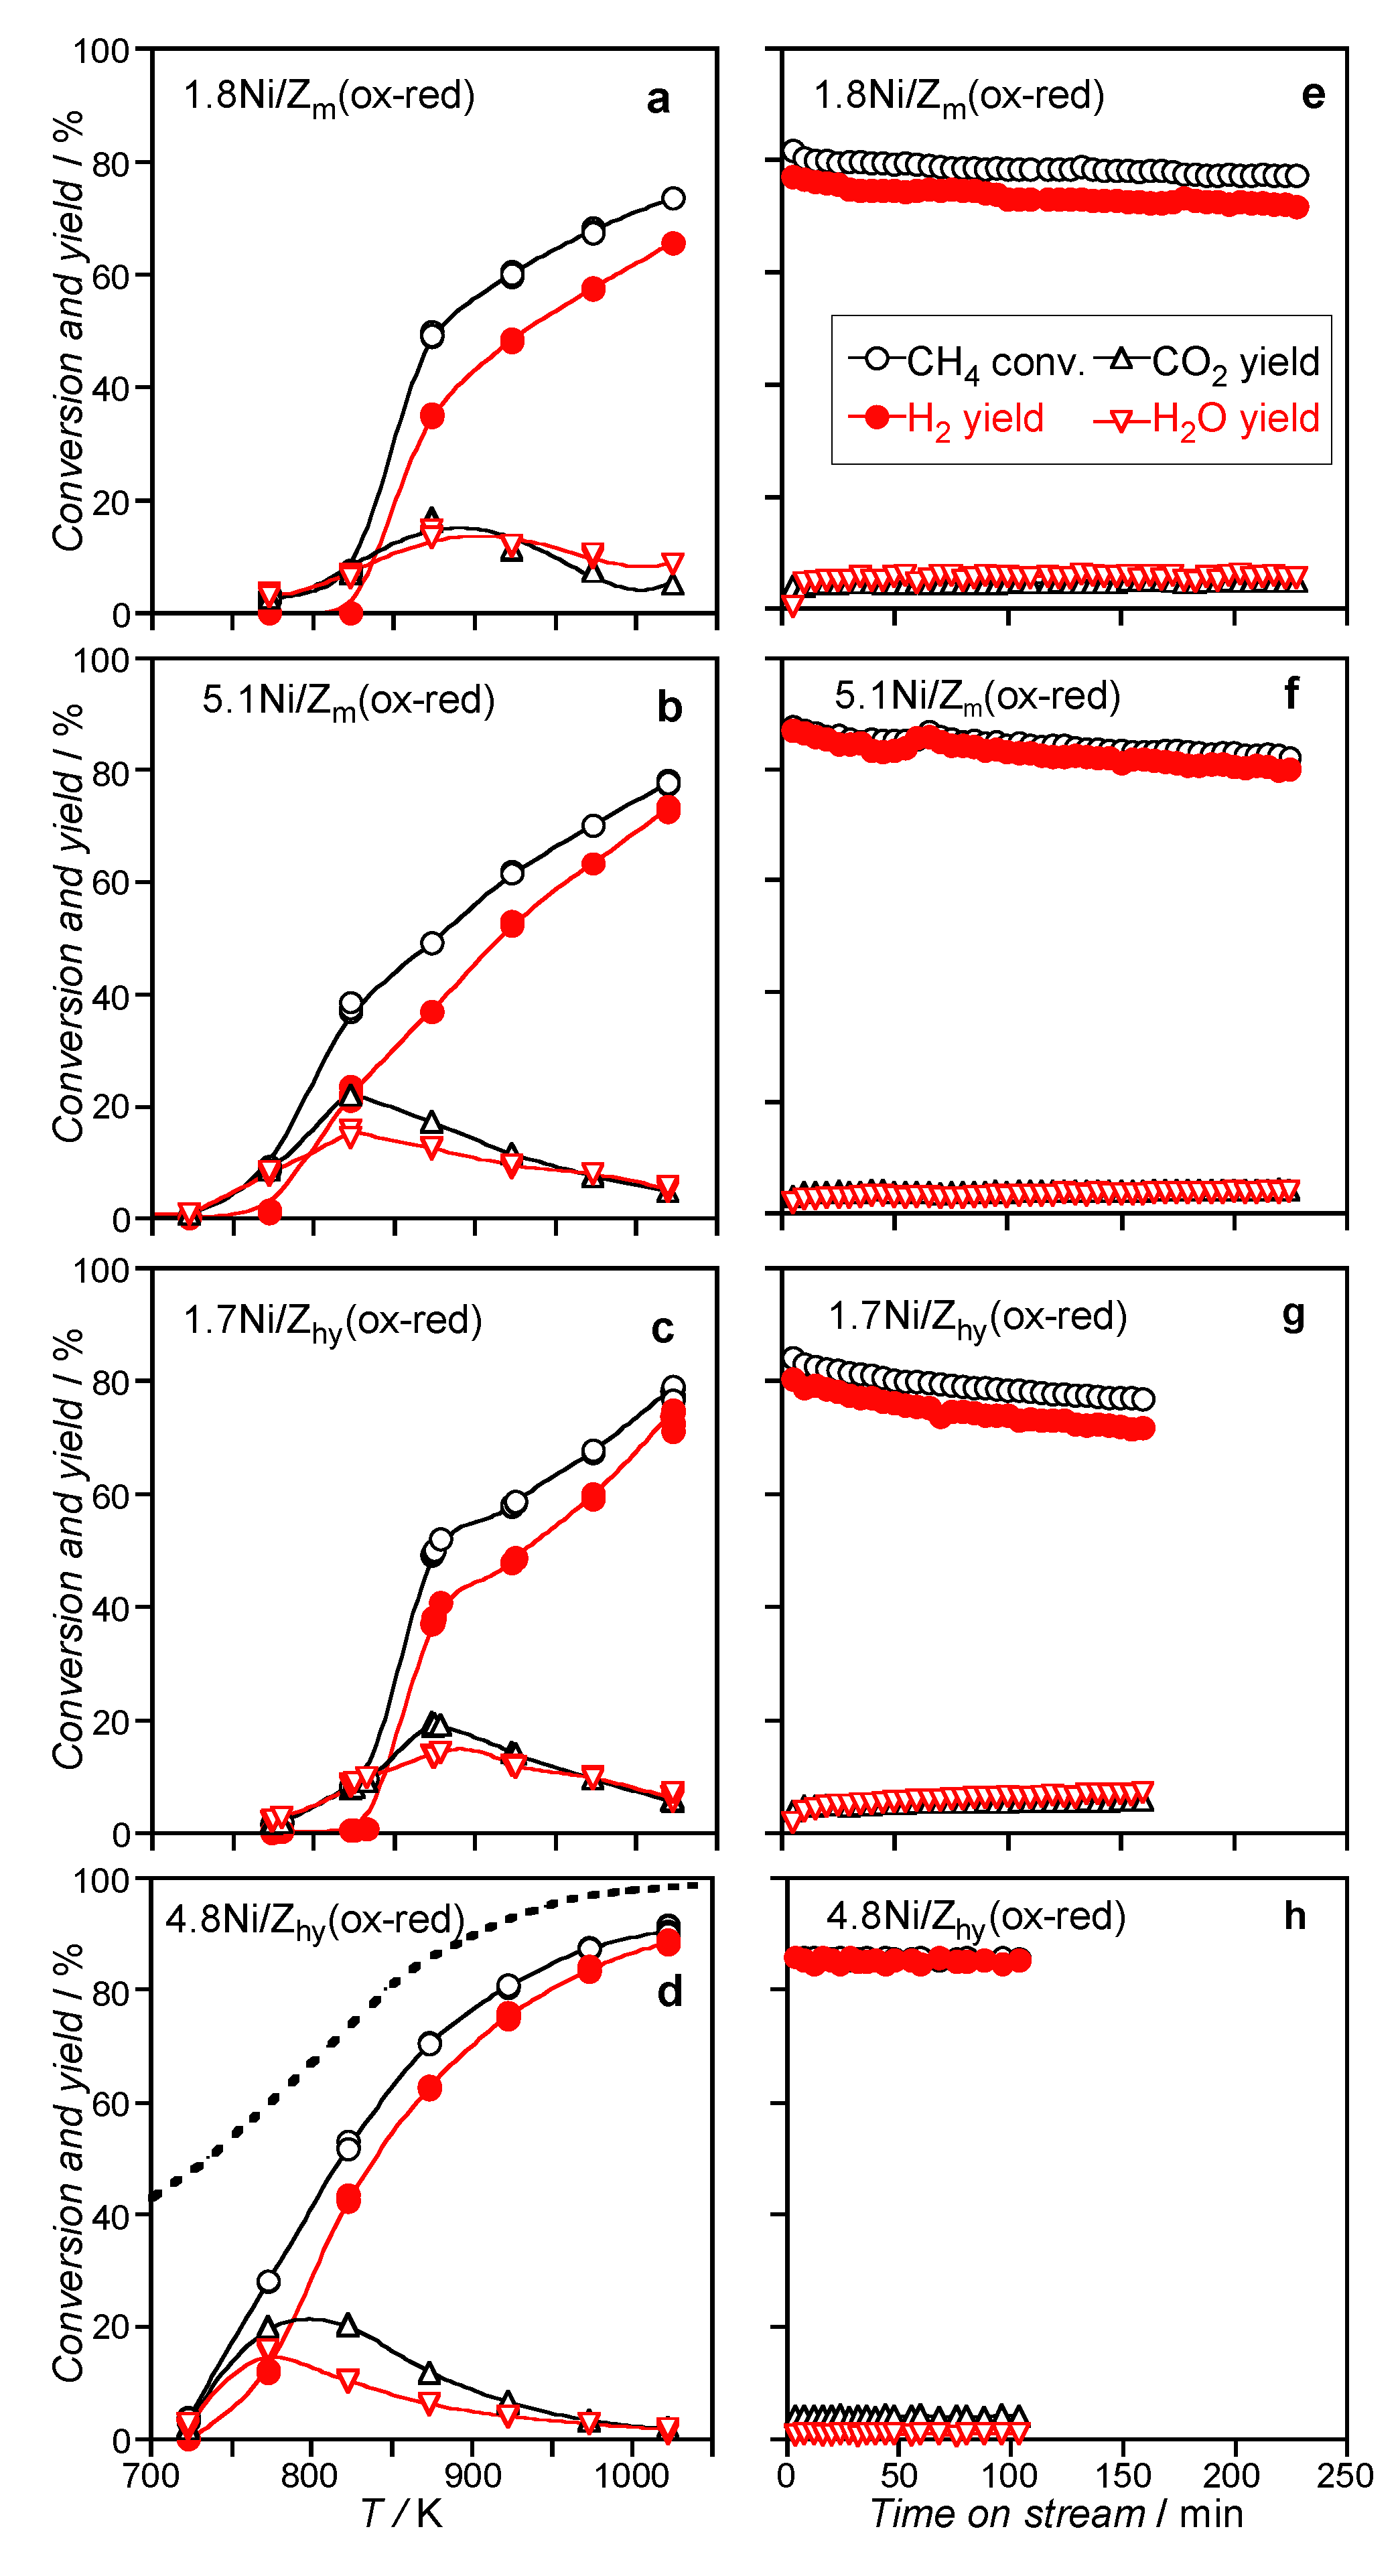
All the Ni/Zm (ox-red) and Ni/Zhy (ox-red) catalysts were highly active (Figure 11a–d and Figure 12a,b) and selective (Figure 12c,d) for the CH4-CPO at 1023 K with the CH4:O2 = 2:1 mixture. The most active 4.8Ni/Zhy (ox-red) sample reached, at 1023 K, a CH4 conversion and H2 selectivity close to the equilibrium (90% and 95%, respectively [14], Figure 11d and c).
For all the catalysts, decreasing the temperature below 1023 K decreased the H2 selectivity (H2 yield lower than CH4 conversion), indicating the occurrence of side reactions. The formation of similar amounts of CO2 and H2O as by-products suggested the occurrence of CH4 total combustion, with a volcano-shape activity trend as a function of temperature (maximum CO2 yield of 20%). Below 923 K, more evident for the concentrated 5.1Ni/Zm (ox-red) and 4.8Ni/Zhy (ox-red) samples, the H2O yield was slightly lower than the CO2 yield, and the H2 yield was slightly higher than the CO yield, suggesting that the WGS reaction occurred to a small extent. For all the catalysts, the activity and selectivity for the CH4-CPO dropped to zero, further lowering the temperature, and they were completely restored by a subsequent temperature increase, indicating that side-reactions causing irreversible deactivation did not occur.
The activity and selectivity as a function of time on stream at a set temperature were stable for the 4.8Ni/Zhy (ox-red) catalyst, but were slightly decreased for all the other catalysts (Figure 11e–h). The reproducibility of activity and selectivity in the whole temperature range was observed in each run and in consecutive runs (Figure S3a), with the error affecting the conversion values of, at maximum, 7%. All of these results suggest that no significant changes in the amount and/or type of active Ni sites occurred during the reaction and that the slight decrease in activity with time possibly arose from the deposition of a very small amount of coke on Ni active sites, in agreement with the literature [23].
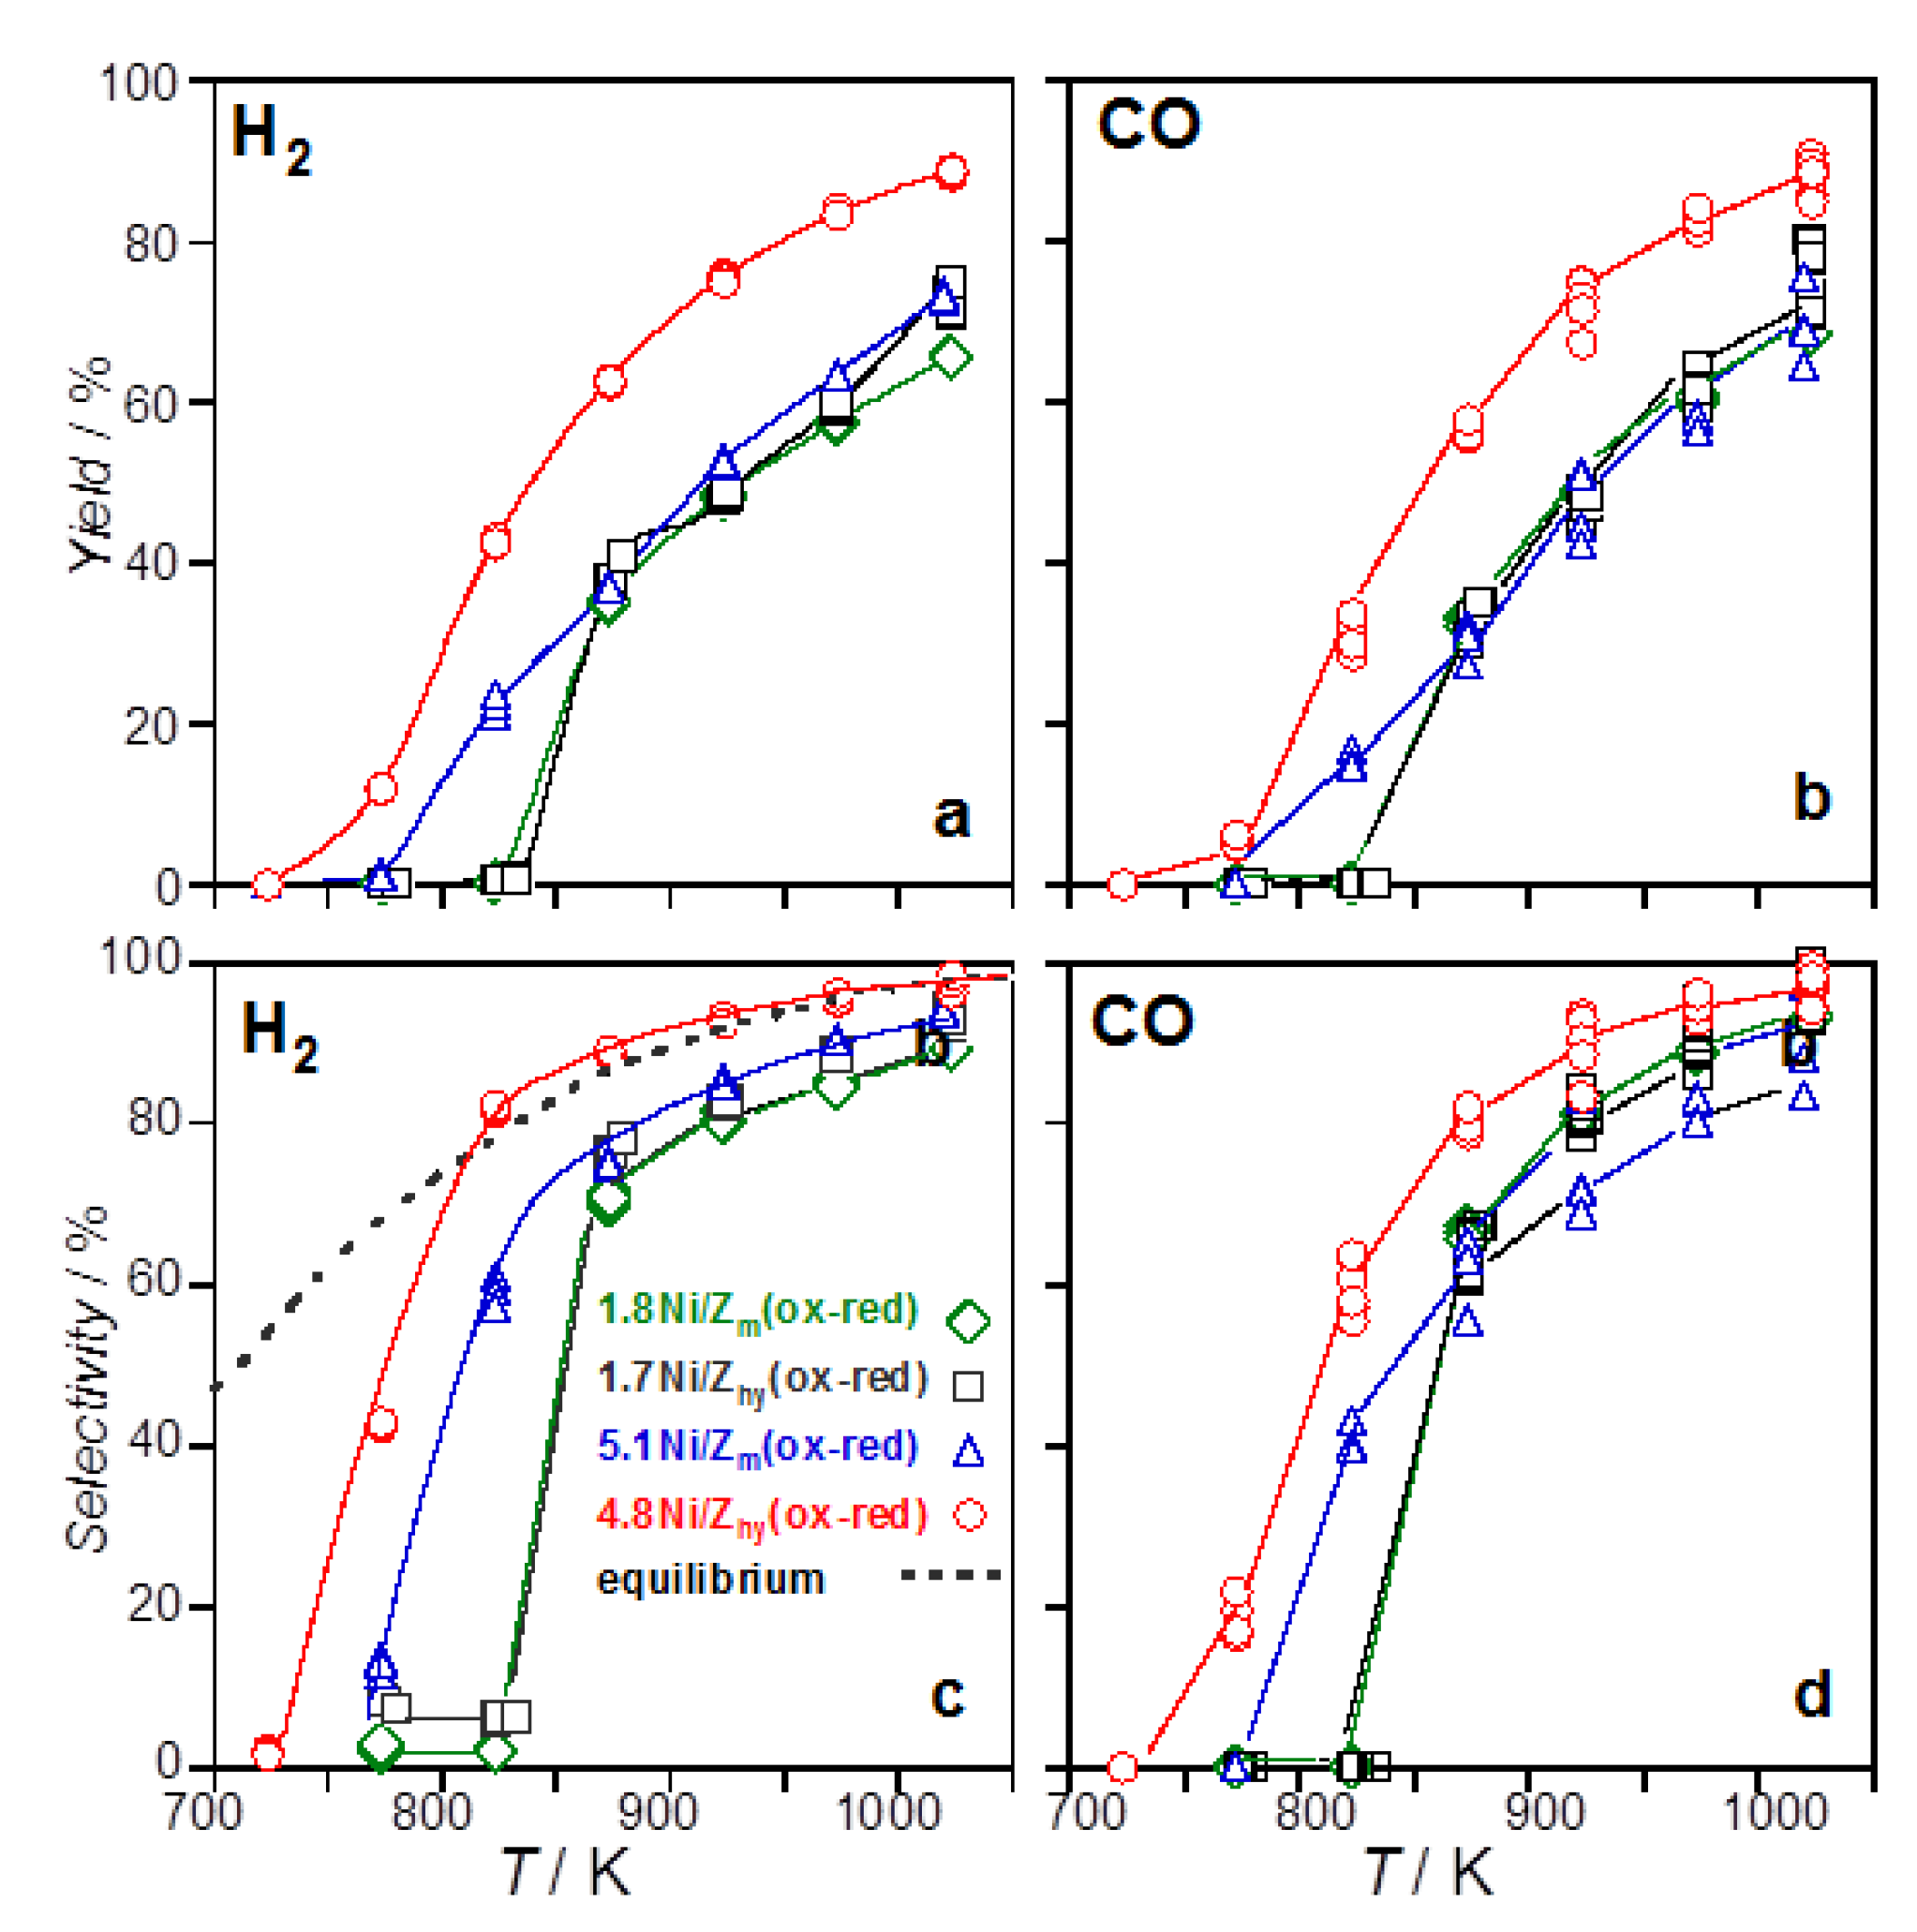
Similar H2 and CO yields (Figure 12a,b) and selectivities (Figure 12c,d) were observed for dilute 1.8Ni/Zm (ox-red) and 1.7Ni/Zhy (ox-red) catalysts, indicating that at low Ni loading, the starting supports allowed the formation of similar Ni active sites. The increase in Ni loading caused a different behaviour of catalysts prepared using Zm or Zhy starting materials. Specifically, for Ni/Zm (ox-red) catalysts, the increase in Ni loading lowered the reaction light-off of about 50 K, leaving the H2 and CO yield and selectivity values unchanged above the light-off temperature. By contrast, for Ni/Zhy (ox-red) catalysts, the increase in Ni loading caused a more consistent lowering of the reaction light-off temperature (about 100 K), giving higher H2 and CO yield and selectivity values for 4.8Ni/Zhy (ox-red) than for 1.7Ni/Zhy (ox-red) catalysts (Figure 12a–d). Therefore, the 4.8Ni/Zhy (ox-red) catalyst showed the best performances, exhibiting the lowest CPO light-off temperature and the highest H2 and CO yield and selectivity values.
As 1.8Ni/Zm (ox-red) and 1.7Ni/Zhy (ox-red) catalysts showed similar activity, the starting material Zhy or Zm used for the impregnation seemed to have no effect on the active site reactivity. The evidence that the 4.8Ni/Zhy (ox-red) catalyst with the smallest Ni particles had an activity higher than that of the 5.1Ni/Zm (ox-red) catalyst with the largest particles (FESEM evidence, Table 2) might raise the expectation that Ni dispersion favours catalytic activity.
To verify whether dispersion can be the key parameter affecting activity, the dependence of the rate of H2 production (RH2/molecules s−1·g−1) on the number of exposed Ni atoms, NNi(exp) (Ni(exp) atoms·g−1), was analysed for catalysts with different Ni dispersions (Table 2). The NNi(exp) value of the 4.8Ni/Zhy (ox-red) catalyst (1.8·1019 atoms·g−1) was about 20 times higher than that of the 5.1Ni/Zm (ox-red) catalyst (9.4·1017 atoms·g−1), whereas the rate RH2 at 823 K for the 4.8Ni/Zhy (ox-red) catalyst was only about twice as high than that for the 5.1Ni/Zm (ox-red) catalyst (2.2·1019 vs. 1.2·1019 molecules·s−1·g−1, respectively). The lack of a linear correlation between RH2 and NNi(exp) indicated that neither all nor a constant fraction of exposed Ni atoms were the active sites, only Ni species with peculiar properties. As a consequence, neither the different Zhy or Zm starting material alone nor Ni dispersion alone was the factor affecting the activity of Ni sites for CH4-CPO.

3.2.2. Catalysts Activated by Reduction Treatment

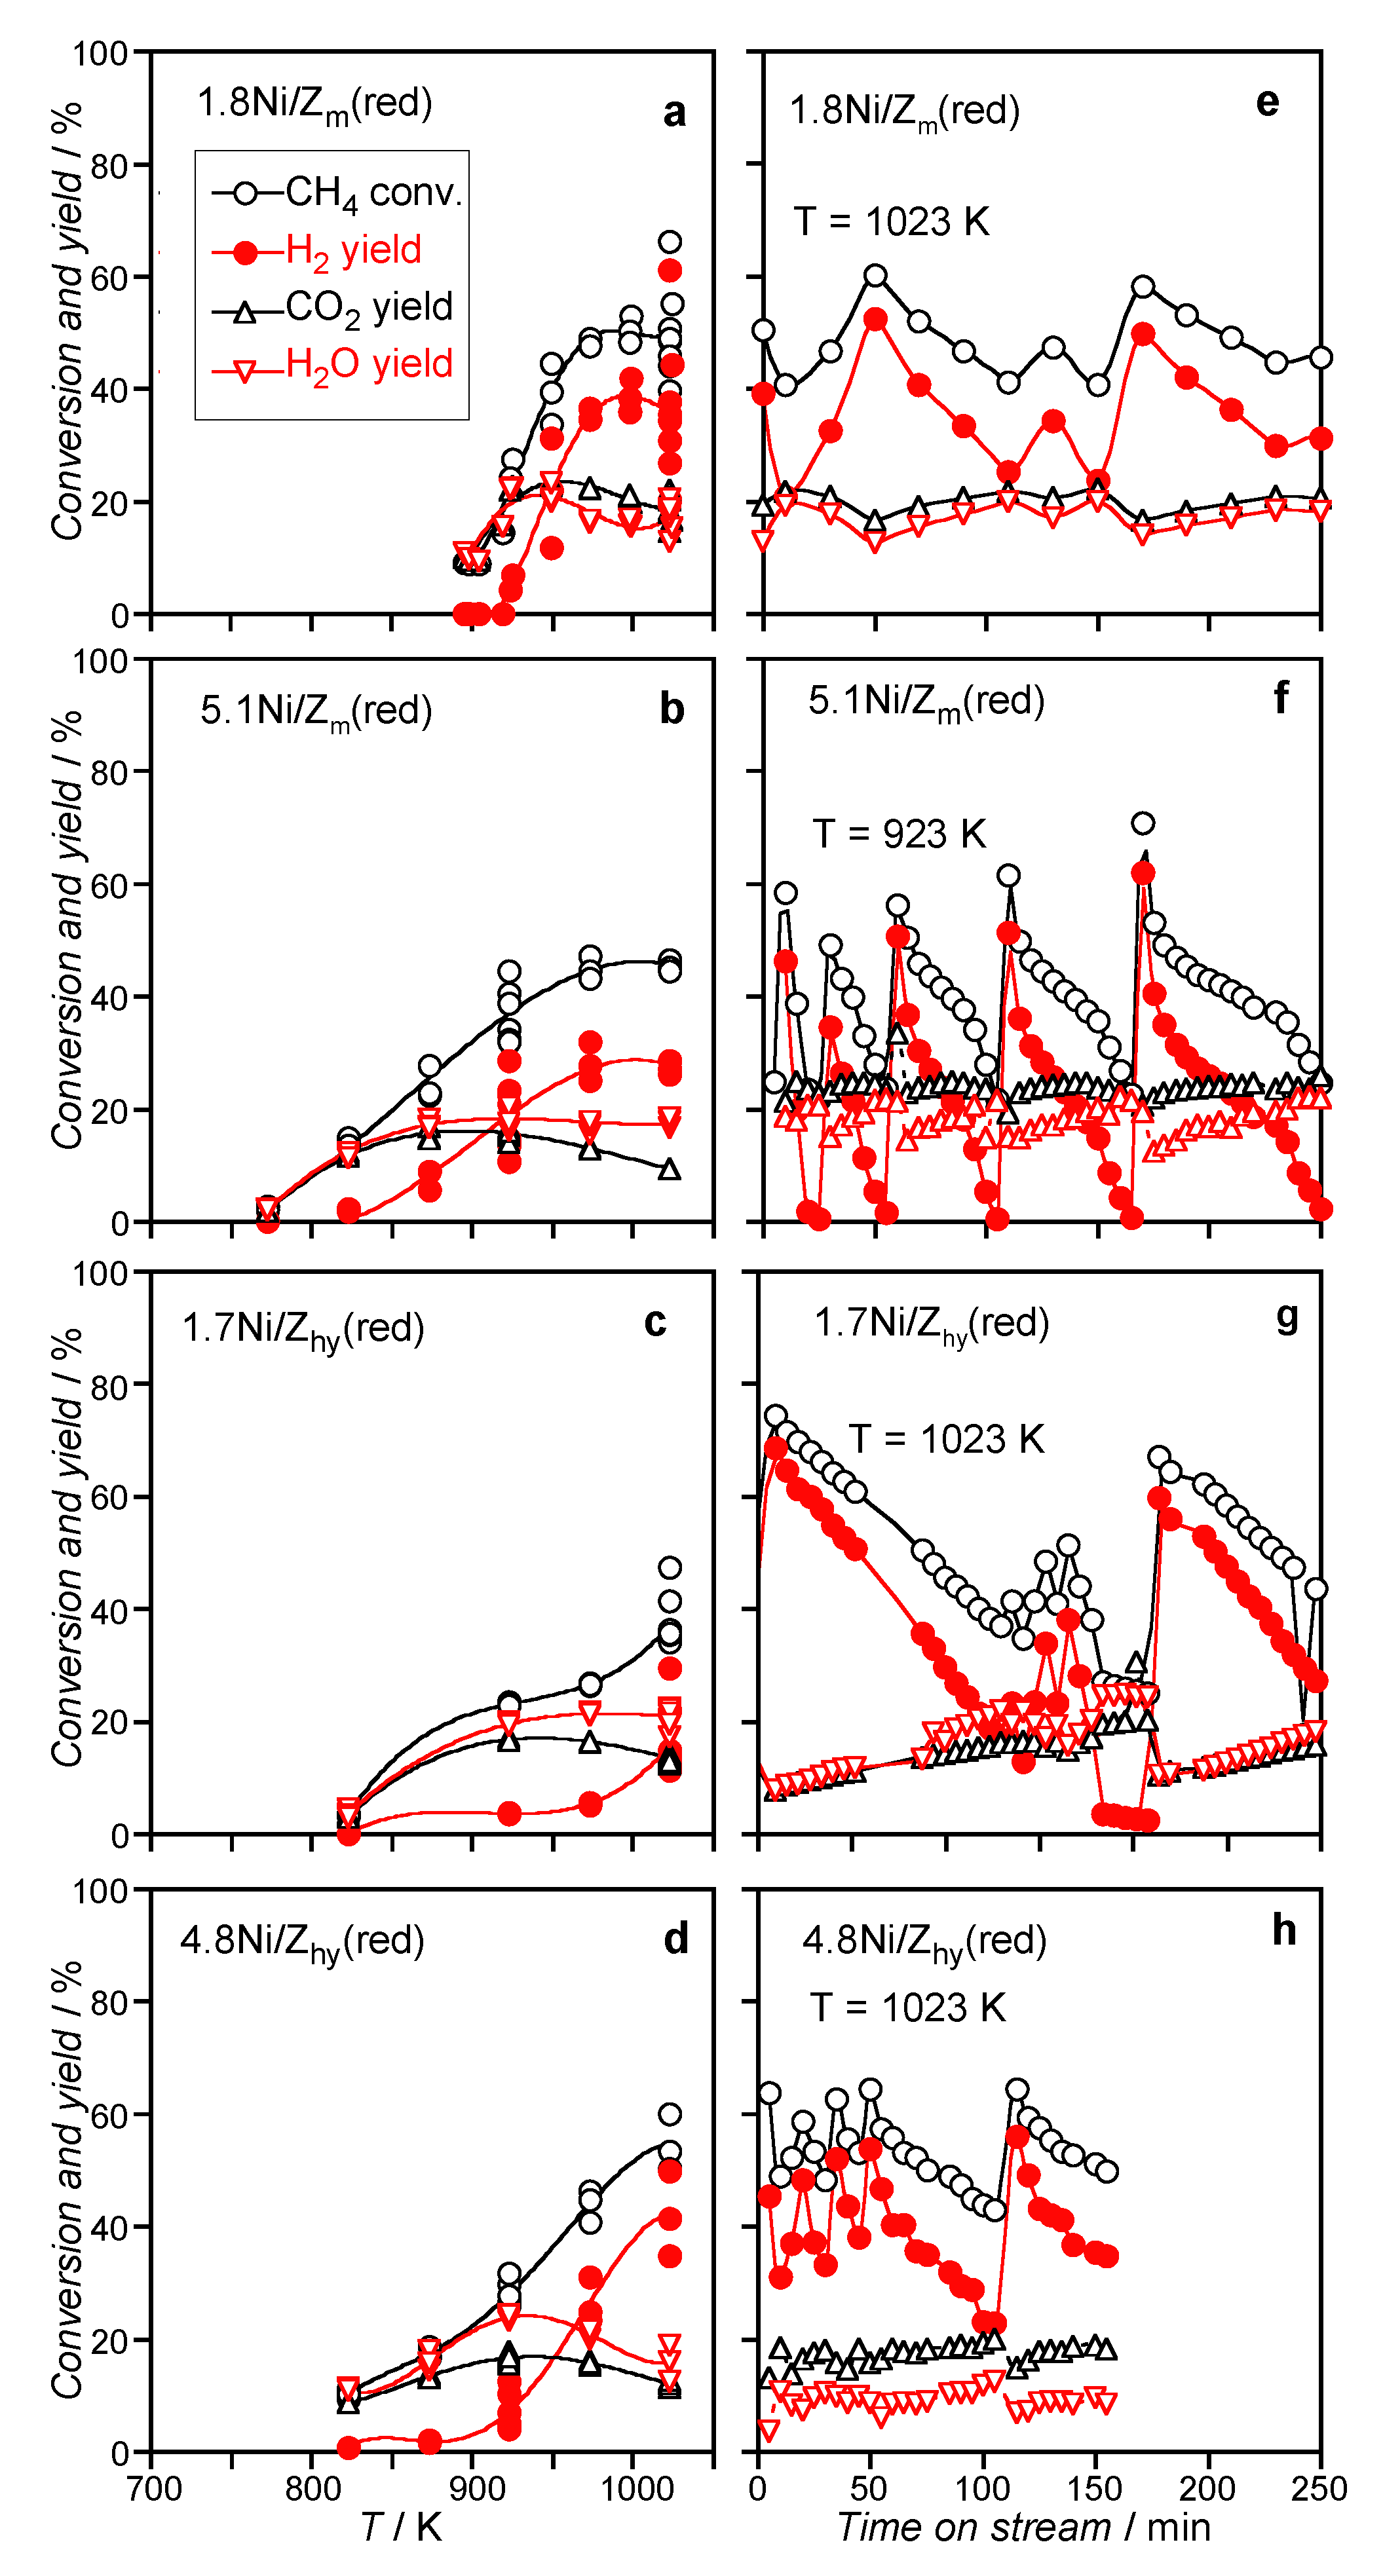
All the Ni/Zm (red) and Ni/Zhy (red) catalysts were less active (Figure 13a–d) and selective (Figure S4a,b) for the CH4-CPO than the corresponding ox-red samples in the whole temperature range. They gave scattered values of H2 and CO yields and no scattered combustion by-product values. Both the scattered H2 and CO yields and the lower activity of red samples with respect to the ox-red samples suggested that the red activation treatment generated active sites in a lower amount and with features unlike those obtained by the ox-red procedure.
For all Ni/Zm (red) and Ni/Zhy (red) catalysts, the scattered trend of activity was reproduced in subsequent runs (Figure S3b), indicating that, as for Ni/Zm (ox-red) and Ni/Zhy (ox-red) catalysts, no irreversible modification of the active Ni sites occurred during catalytic runs.
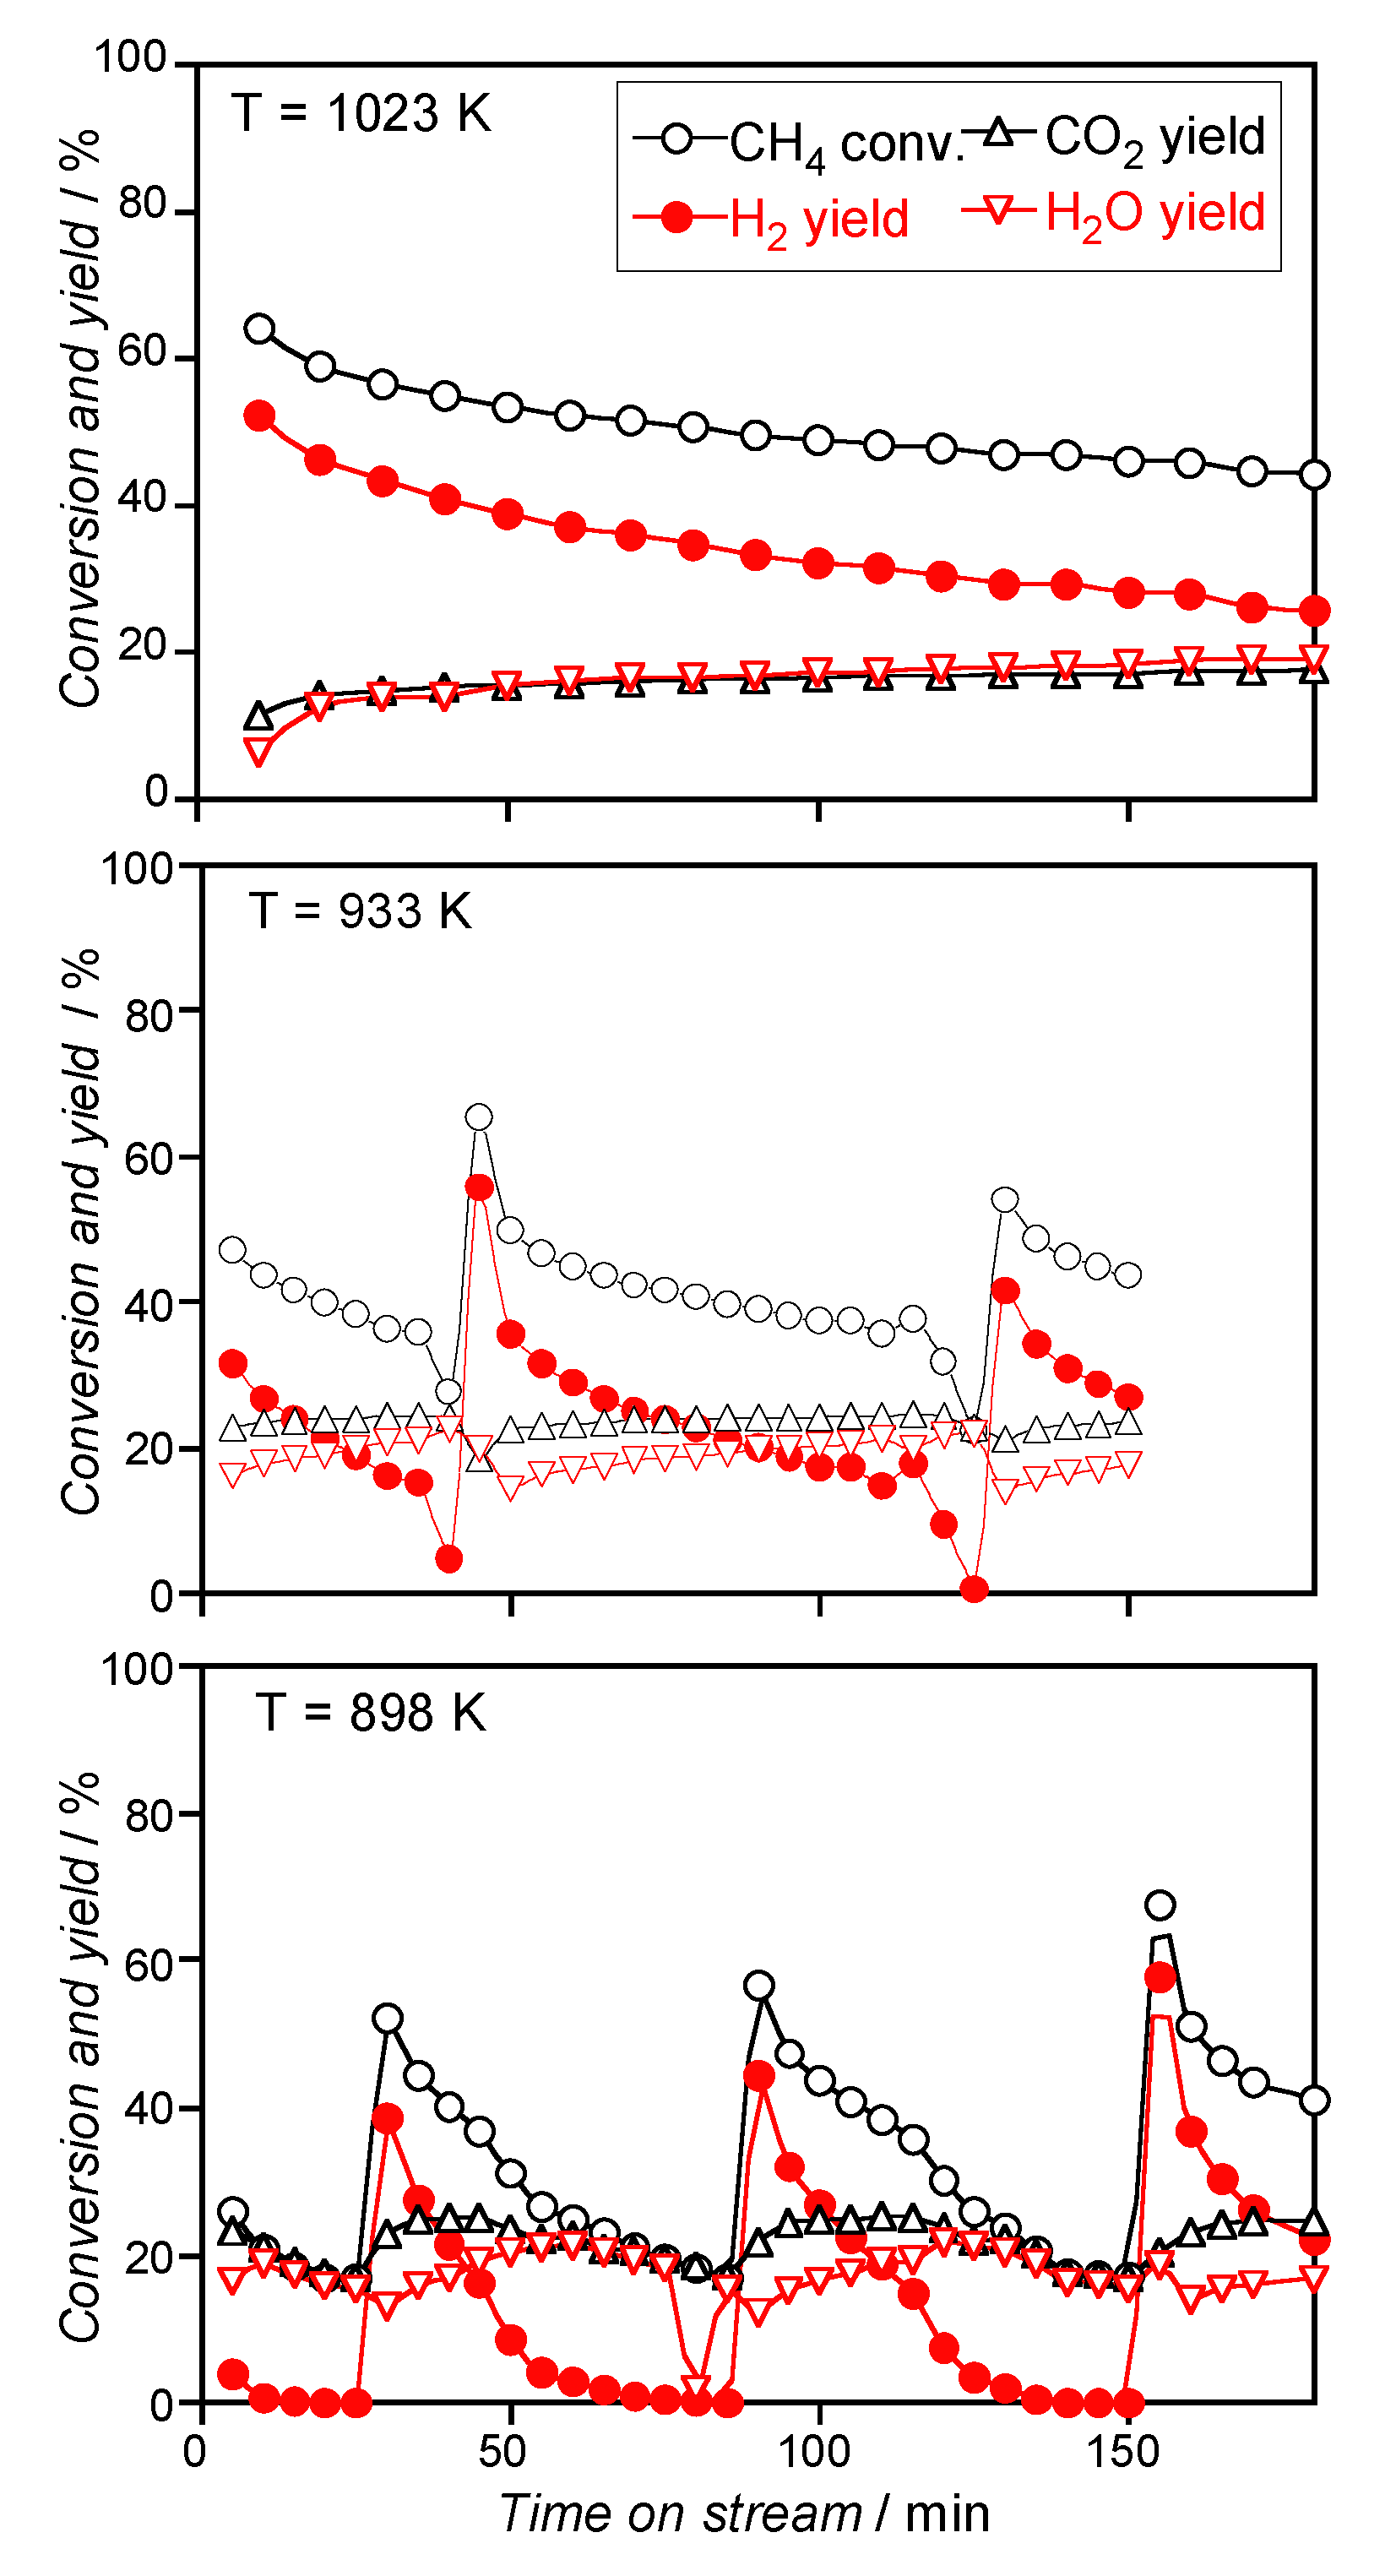
By investigating the activity at a set temperature, the Ni/Zm (red) and Ni/Zhy (red) catalysts exhibited CH4 conversion and H2 and CO yields markedly changing as a function of time on stream with in-phase saw-tooth shape oscillations (Figure 13e–h), indicating an oscillating behaviour of the CH4-CPO reaction. In the oscillating cycles, the total oxidation side-reaction occurred for all the catalysts, as evidenced by the CH4 conversion always being higher than the H2 yield and H2O and CO2 formation.
WGS side reactions also occurred to a small extent, as the H2 yield was slightly higher than that of CO, and the CO2 yield was slightly higher than that of H2O. The slightly oscillating behaviour of CO2 and H2O yields (Figure 13e–h), opposite in phase to that of the CH4-CPO, suggested an oscillating behaviour even for the WGS reaction. The oscillation of the WGS reaction might arise from the significant change in CO concentration as the reactant, consequent to the CH4-CPO oscillation. As the change in the relative amount of CO2 and H2O yields was small and arose from WGS oscillation, the amounts of CO2 and H2O arising from CH4 combustion were constant, indicating that the CH4 total oxidation did not oscillate. In addition, as the CO2 yield in the Ni/Z (red) catalysts was roughly similar to that observed for the Zm support (see Figure 10c), we suggest that the active sites yielding CH4 total oxidation are support sites, and those yielding oscillating CH4-CPO and WGS behaviours are Ni sites.
The remarkable oscillation of the CH4-CPO reaction for the Ni/Zm (red) and Ni/Zhy (red) catalysts can be tentatively explained according to evidence widely discussed in the literature for various metal or supported metal systems [55,56,57,58,59,60,61,62]. For supported noble metal catalysts (Ru and Pd), the oscillating behaviour was ascribed to a periodical oxidation–reduction of the active metal sites, with the metal species being active for the CH4-CPO and the oxidised species being active for the CH4 combustion [58,61]. In particular, an oxidation/reduction front of Pd nanoparticles was suggested to move through the catalytic fixed-bed, yielding the periodical predominance of the CH4 total oxidation with respect to the partial oxidation [61]. An operando XRD study on a Ni foil showed unambiguously that the oscillations of the CH4-CPO reaction were due to the reversible oxidation of Ni metal to NiO [63]. For Ni and Co foils [60] and Ni wires [56], it was suggested that the reversible oxidation–reduction of surface sites depended on the gas-phase composition and on changes in the local temperature due to the exothermicity of the reactions at the metal surface.
In agreement with all these findings, we suggest that in both Ni/Zm (red) and Ni/Zhy (red) catalysts, the CH4-CPO oscillating behaviour arose from the periodical oxidation–reduction of some Ni sites, which were CPO-inactive when oxidised and CPO-active when reduced. Unlike supported Ru and Pd catalysts [58,61], the oxidised Ni species that formed during the oscillation cycle contributed little to the CH4 total oxidation, as in our catalysts, CH4 total oxidation did not oscillate.
The oscillating behaviour depended on temperature, contact time and O2 content in the mixture. Specifically, (i) the trends of conversions and yields changed form or disappeared, depending on temperature (Figure 14), as the surface reactions causing changes in the Ni oxidation state depended on temperature by different activation energy values; (ii) oscillations disappeared, increasing the total flow rate (Figure S5), in agreement with the literature, showing that short contact times favoured CH4-CPO compared to total oxidation [63]; (iii) oscillations appeared when the O2 content was above 0.5% (Figure S6), as a higher oxygen coverage of the metal surface favoured the oxidation of Ni sites [60].
To explain why Ni/Zm (red) and Ni/Zhy (red) catalysts yielded oscillations, whereas Ni/Zm (ox-red) and Ni/Zhy (ox-red) did not, we rationalized our results considering carbon balance, oscillation reproducibility, and Ni particle size for the used samples. As, during the oscillation cycles, the carbon balance was satisfactory, the oscillating behaviour could not be related to the process of the covering/restoring of active Ni sites (carbon deposition followed by auto-thermally induced carbon oxidation). In addition, as the oscillating behaviour was the same in subsequent runs, the number and features of Ni sites causing oscillations were not affected by aging in the CH4-CPO feed and by the re-activation treatment between two consecutive runs. Recalling that for all the catalysts, the red activation treatment yielded Ni metal particles similar in size to those obtained by the ox-red activation treatment (see Table 2), the oscillating activity of catalysts could not be attributed to Ni particles of specific size. Therefore, we suggest that the red activation treatment yielded specific Ni sites able to easily change their oxidation state, inducing an oscillating process.

3.3. Surface Species Evolution during Activation Treatments by in situ FTIR

To gain an insight into the Ni surface species that might be involved in the oscillating activity of Ni/Zm (red) and Ni/Zhy (red) catalysts, in situ FTIR analysis was performed in a gas flow simulating the activation treatments of the catalyst precursors.
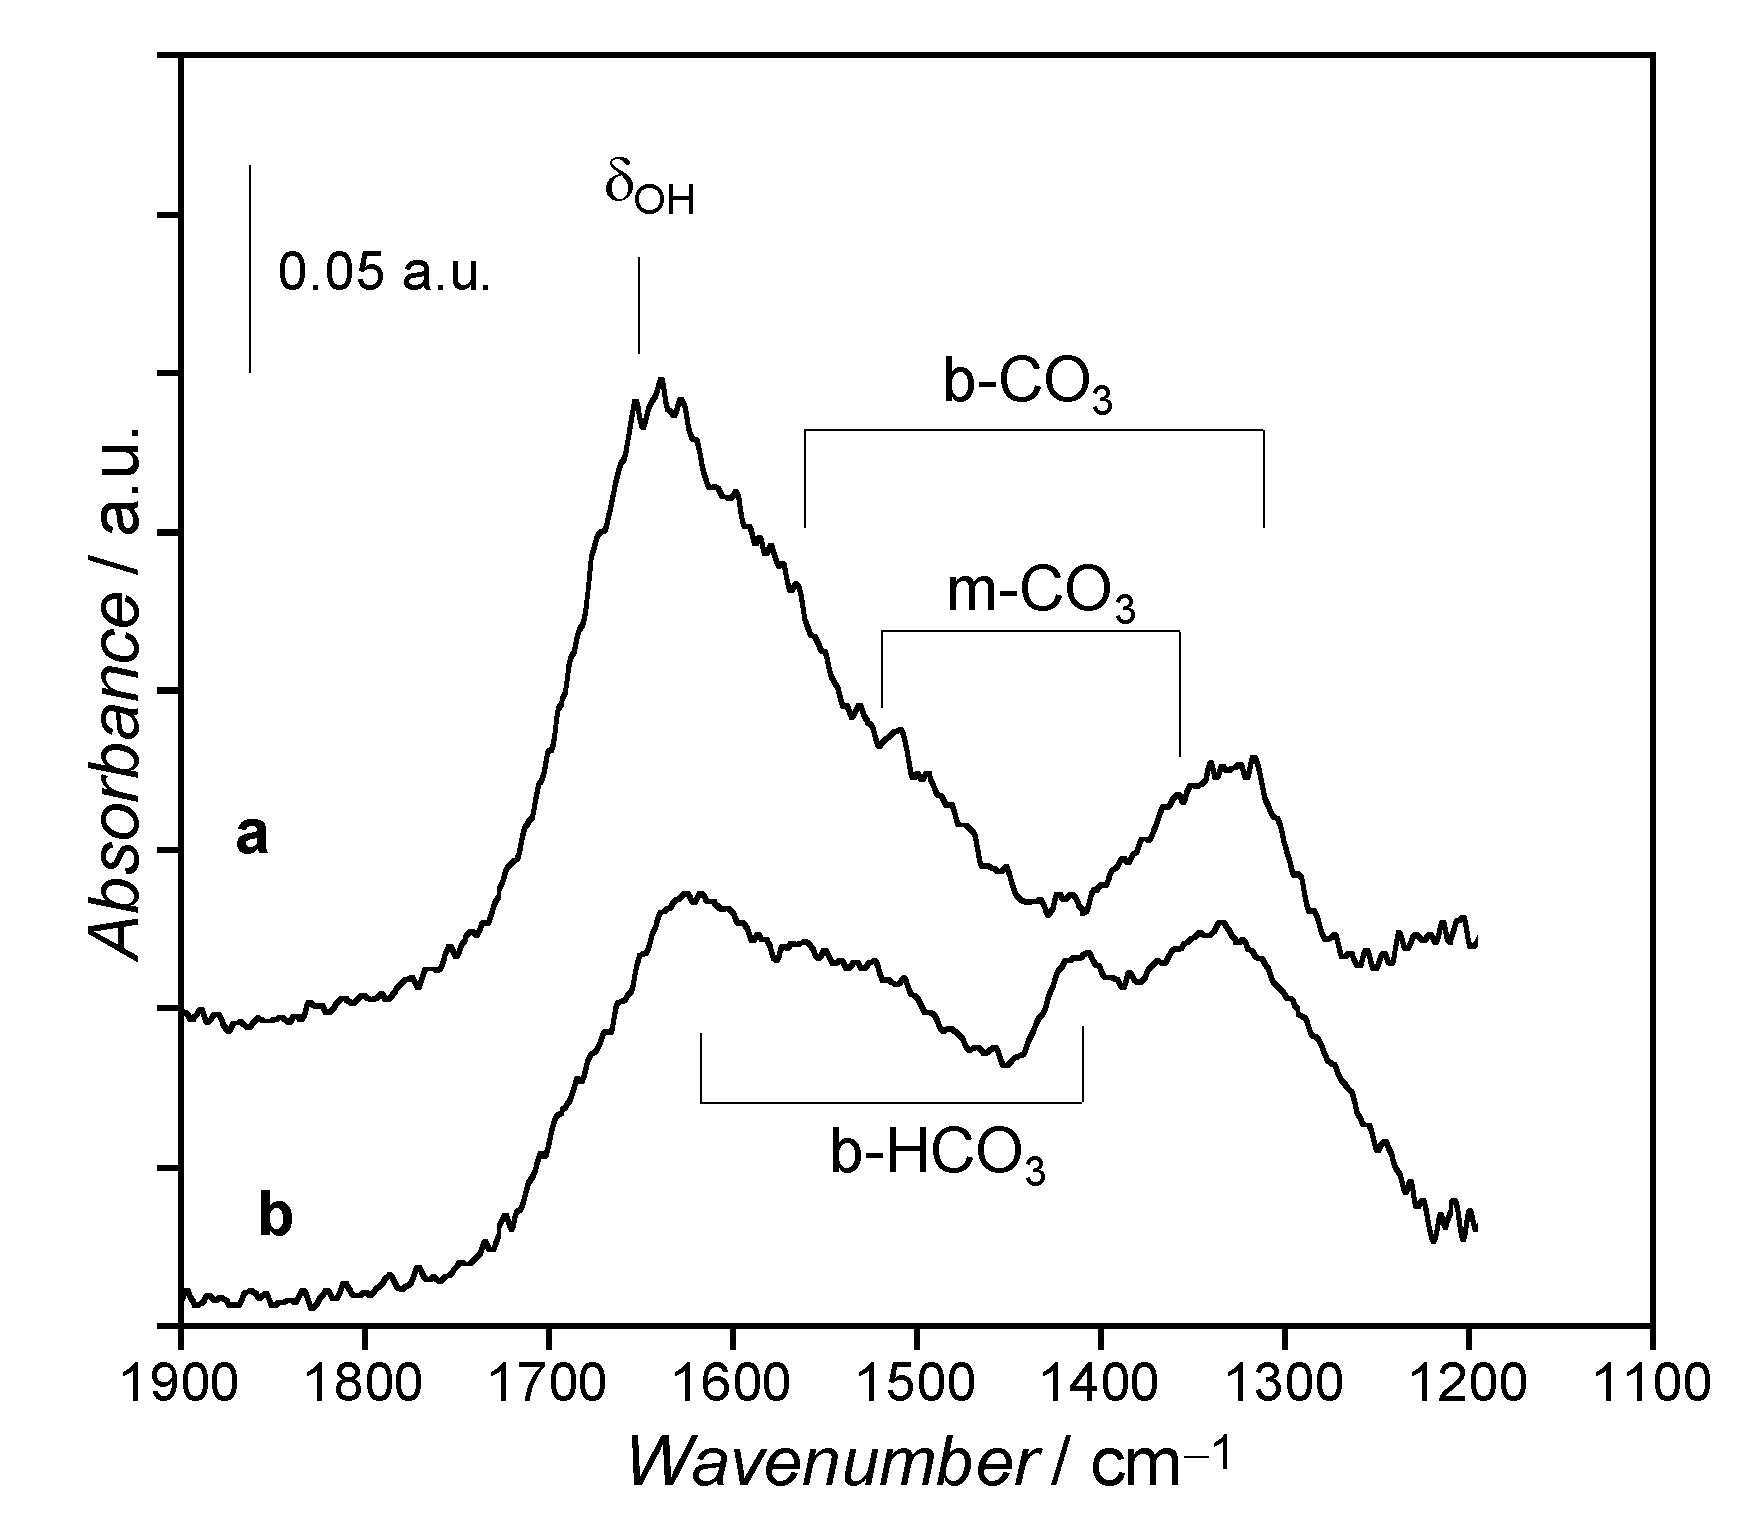
The spectra of the Zm support and the 4.8NiO/Zhy precursor recorded in air at 298 K (Figure 15) showed a broad band at about 3600 cm−1 due to H-bonded OH (νOH, spectral region not shown) and an envelope in the 1650–1250 cm−1 region, containing bands characteristic of adsorbed water (at about 1630 cm−1, δOH mode), monodentate carbonates (m-CO3, at 1475 and 1355 cm−1), bidentate carbonates (b-CO3, at 1560 and 1330 cm−1) and bidentate bicarbonates (b-HCO3, at 1690 and 1410 cm−1) adsorbed on the zirconia surface [64,65,66,67,68].
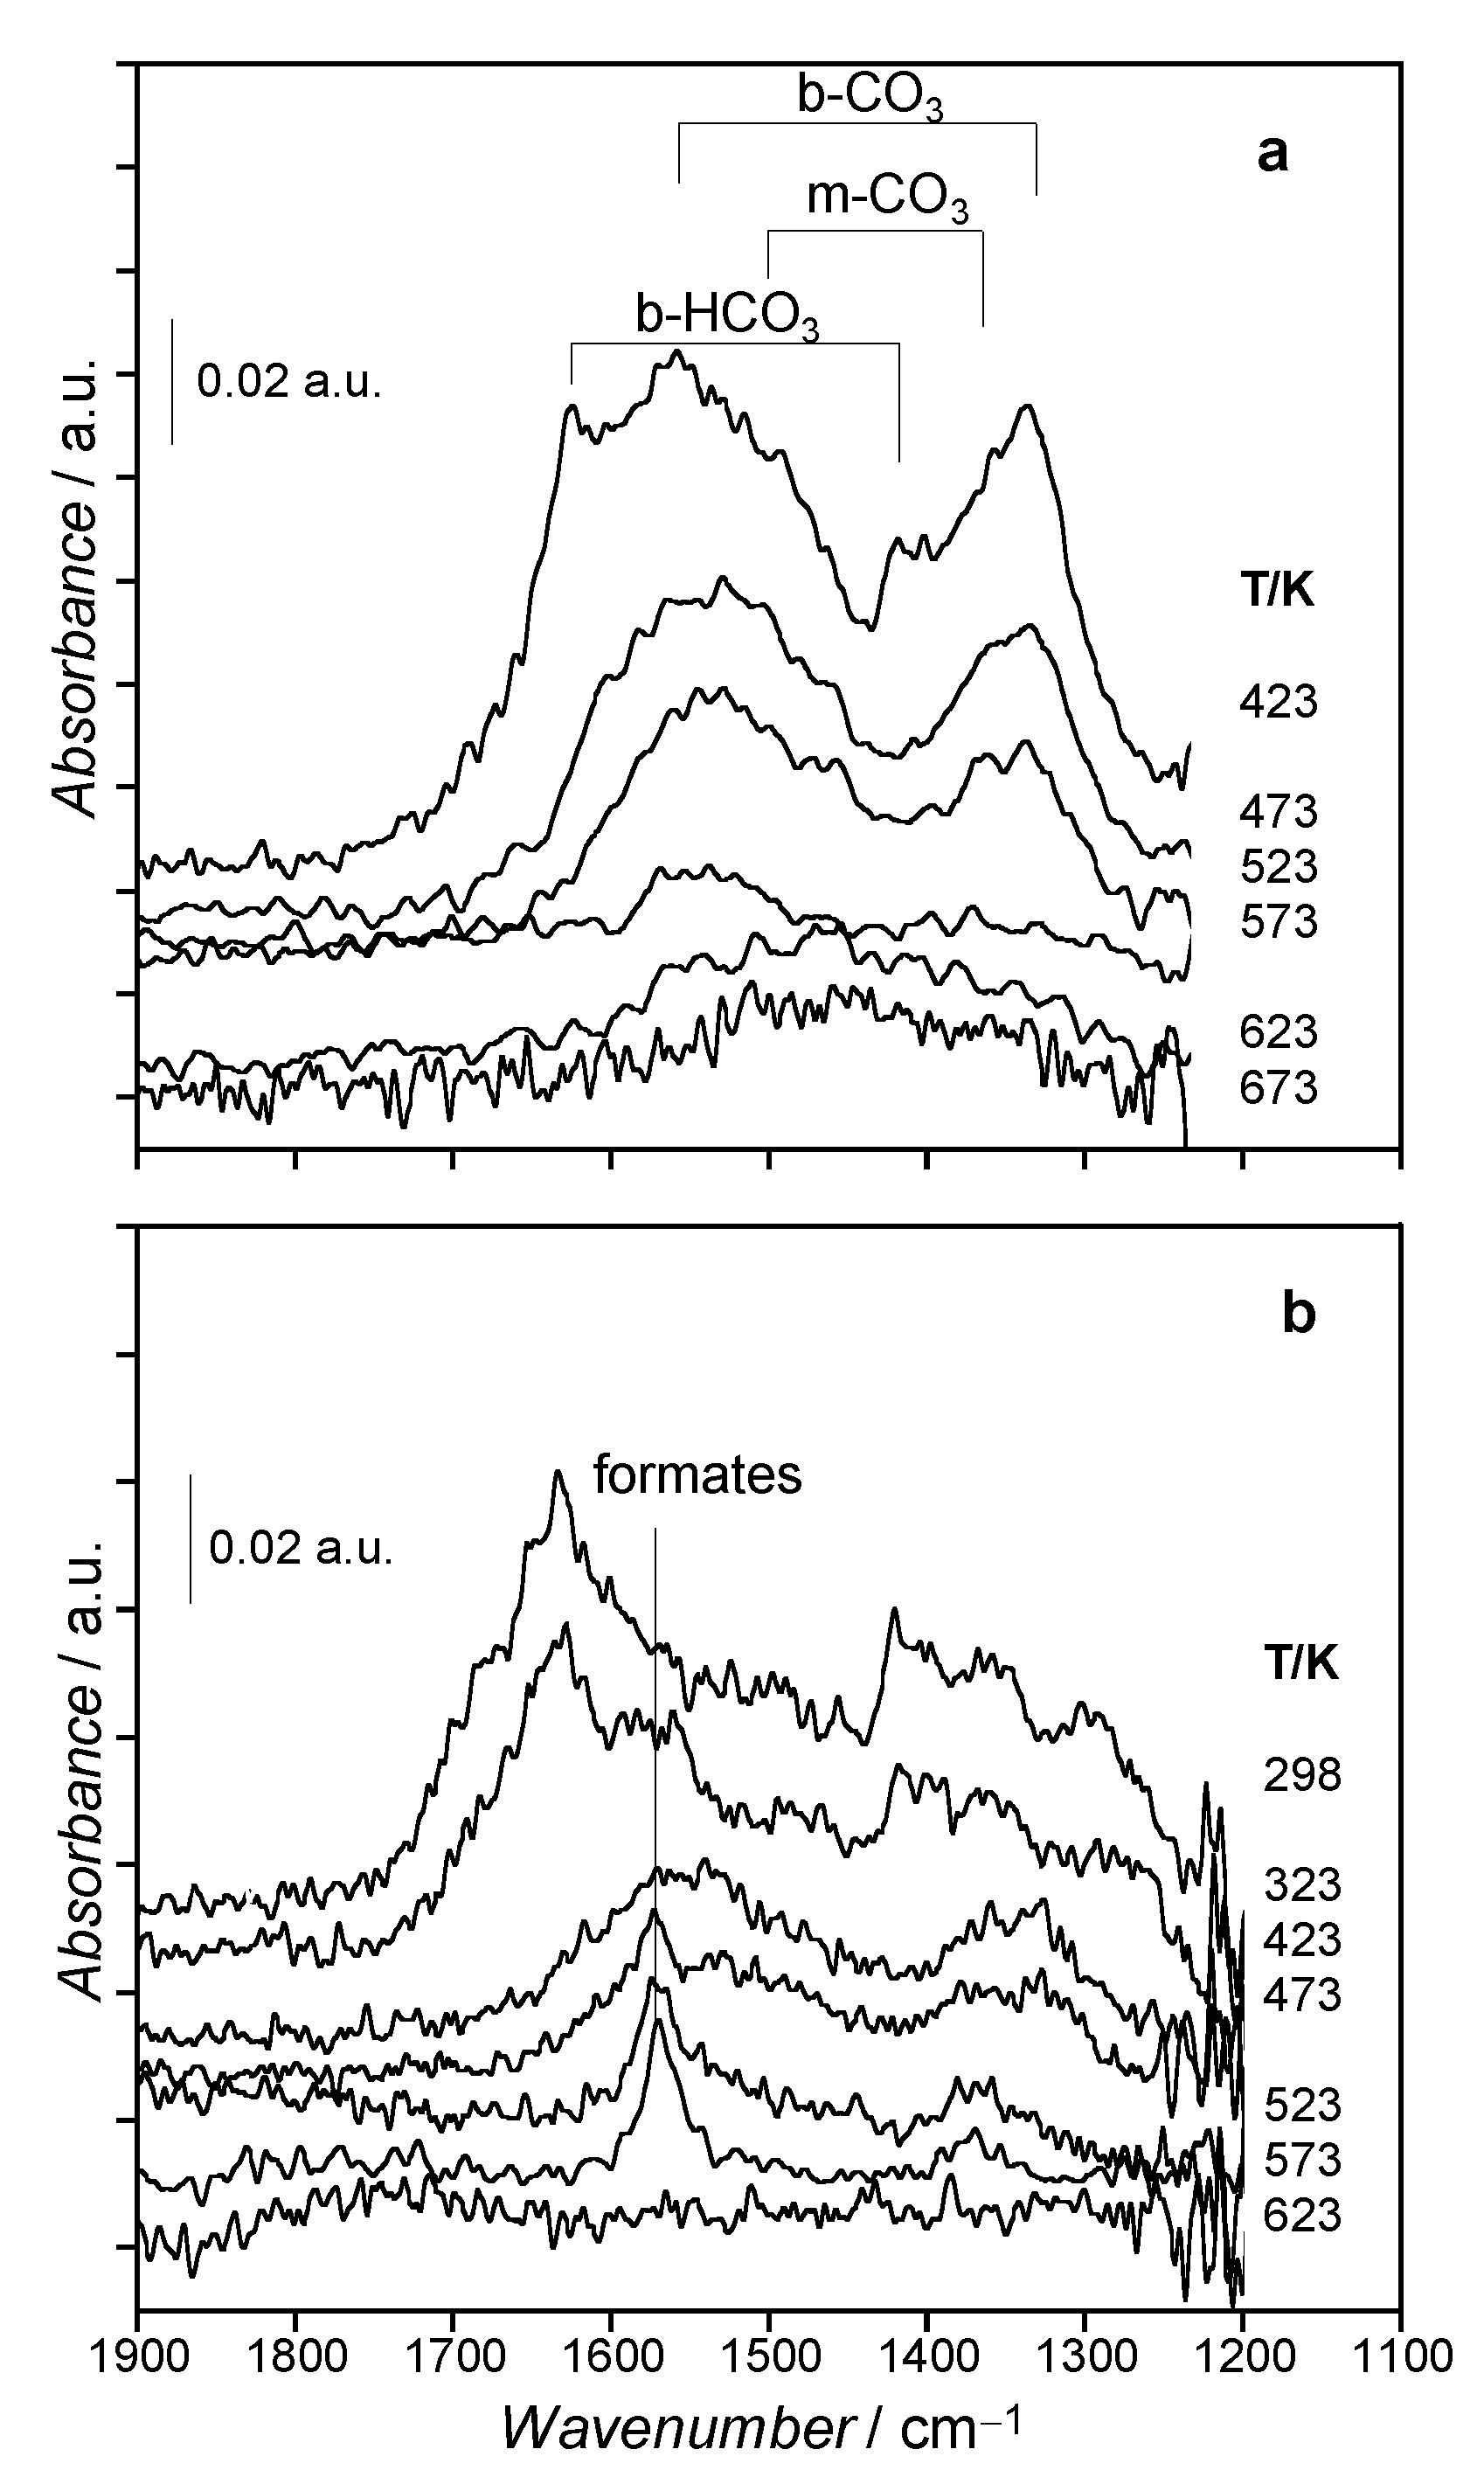
The exposure of the 4.8NiO/Zhy precursor to an O2/N2 flow at increasing temperature, simulating the oxidative step of the ox-red activation procedure, produced a progressive decrease in intensity of the bands due to adsorbed H2O, carbonates and bicarbonates, until their disappearance above 573 K (Figure 16a).
The exposure of the 4.8NiO/Zhy precursor to an H2/N2 flow, at increasing temperature, simulating the red activation procedure, produced a progressive decrease in intensity of adsorbed H2O and carbonates/bicarbonates bands. At 473 K, a new band at about 1575 cm−1 appeared, whose intensity reached a maximum at 573 K and then decreased with temperature. All the bands disappeared above 623 K (Figure 16b). The band at 1575 cm−1 was assigned to formate species [69], arising from the reduction of the adsorbed carbonates/bicarbonates surface species in the H2 flow.
The formation of reduced carbon-containing species solely after the red activation treatment of the precursors could account for the dependence of the catalytic behaviour on the activation procedures. During the red activation, carbonates species adsorbed on the support could be reduced to formates that, at higher temperature, are supposed to form carbide-like species (Cδ−), not detectable by IR. The Cδ− species located on the ZrO2 surface in proximity of the Ni particles could induce a positive charge on Ni atoms at the boundary between metal particles and the support, yielding Niδ+ surface species. These species could easily change their oxidation state, thus favouring the oscillating behaviour of the CH4-CPO reaction. As the oscillating catalytic behaviour was retained by subsequent red-ox cycles, it can be assumed that the Cδ− species, once formed, are stable on the surface of red-activated catalysts. The formation of carbide-like species in Ni/Zm (red) and Ni/Zhy (red) catalysts, hypothesized based on FTIR results, can find some correspondence in the presence of carbon nanotubes observed by FESEM. In fact, by consensus, the presence of nickel carbide species was well recognised to be involved in the induction step of the carbon nanotubes formation on Ni metal particles [70]. Conversely, when the catalysts precursors were activated by the ox-red procedure, adsorbed carbonates desorbed during the oxidation step, and carbide-like species could not form during the reduction step. Consequently, Ni active sites with a pure metal character formed, thus preventing the oscillating phenomenon.

3.4. Hypothesis on Active Sites for the CH4-CPO

The activity of both Ni/Zm (ox-red) and Ni/Zhy (ox-red) catalysts, much higher than that of unsupported Ni, and the oscillating behaviour of Ni/Zm (red) and Ni/Zhy (red) catalysts suggest that the active sites are possibly Ni sites at the boundary between metal particles and the support. The electron density of these Ni sites is sufficiently affected by the interaction with zirconia and/or with nearby carbide-like species to modify the catalytic behaviour of these Ni sites with respect to unsupported Ni metal particles.
Furthermore, Ni active sites should only be a very small fraction of the boundary species, as TPR results indicated a markedly lower amount of interacting Ni species in the 5.1Ni/Zm catalyst than in the 4.8Ni/Zhy catalyst (11% vs 100%), both showing similar catalytic performance.
In the literature, the CH4-CPO mechanism was described as a direct oxidation route, requiring several Ni sites able to activate methane and oxygen in adjacent positions (Ni–C, Ni–O and Ni–H) [14,17,36,60]. According to this pathway, we suggest that the active sites for the CH4-CPO on Ni/ZrO2 catalysts should be poly-nuclear metal sites at the metal particle boundary, in a specific configuration. A similar proposal on the presence of cooperating nearby sites has been made to explain the catalytic activity of Ni supported on grafted ZrO2-Al2O3 catalysts [36]. The amount of poly-nuclear metal active sites was lower in the Ni/Z (red) than in the Ni/Z (ox-red) catalysts because, in the Ni/Z (red), some Niδ+ carbide-like species formed, inducing CPO oscillation.

4. Conclusions

Ni metal particles supported on monoclinic ZrO2, prepared via the impregnation of two different starting materials, were active for the partial oxidation of CH4. As both monoclinic ZrO2 and unsupported Ni metal were inactive for the CH4-CPO under the same experimental conditions, the metal–support interaction played a key role in developing active Ni sites. Although the starting material strongly influenced the size of the supported NiO particles due to the different number of available anchoring sites, the NiO-ZrO2 interaction was strong enough to prevent the sintering of metal particles formed during the ox-red or red activation treatment. In the same way, the Ni-ZrO2 interaction was strong enough to guarantee the stability of metal particles during the catalytic runs.
Different activation treatments of catalysts yielded different catalytic properties: the ox-red treatment yielded nonoscillating activity and a selectivity of Ni sites, whereas the red treatment induced an oscillating behaviour. It can be suggested that the red activation treatment reduced NiO and carbonates adsorbed on the zirconia surface, leading to the formation of Niδ+ carbide-like species. These Niδ+ sites, having a greater tendency to change the oxidation state, were responsible for oscillations in the catalytic activity. Conversely, the ox-red treatment, removing adsorbed carbonates during the oxidation step, yielded Ni active sites with metal characteristics, producing a nonoscillating catalytic activity.
We conclude that Ni dispersion was not the main factor affecting the activity and that the active sites were a small fraction of all the exposed Ni atoms, likely those at the boundary of the metal particles in a specific configuration and nuclearity, strongly depending on the activation procedure. The interaction of these specific Ni atoms with the zirconia surface and/or with nearby carbide-like species was strong enough to modify the catalytic behaviour of the Ni species with respect to the unsupported Ni metal.

Supplementary Materials

The following are available online at https://www.mdpi.com/article/10.3390/ma14102495/s1, Figure S1: Catalytic activity with contact time. Figure S2: Nitrogen adsorption/desorption isotherms (a) and pore size distributions (b) for the Zm support and NiO/ZrO2 catalyst precursors. Figure S3: Reproducibility of activity in four subsequent runs on two representative samples activated by the ox-red treatment (a) or by the red treatment (b). Figure S4: Percent H2 selectivity (a) and percent CO selectivity (b) for Ni/ZrO2 catalysts after red activation treatment as a function of temperature. Figure S5: Catalytic activity of 5.1Ni/Zm (red) catalyst at 923 K with different total flow rates. CH4 conversion and H2, CO2 and H2O yields as a function of time on stream. Figure S6: Catalytic activity of 1.8Ni/Zm (red) catalyst at 1023 K with different O2 contents in the feed. CH4 conversion and H2, CO2 and H2O yields as a function of time on stream.

Author Contributions

Conceptualization, D.P. and D.G.; data curation, D.P. and M.C.C.; formal analysis, S.T., M.C.C. and G.L.; funding acquisition, D.P. and D.G.; investigation, I.P., S.T., G.L., L.A. and I.L.; methodology, D.P.; project administration, D.P. and D.G.; resources, G.L. and L.A.; supervision, D.P. and D.G.; writing—original draft, G.L.; writing—review and editing, D.G., M.C.C., I.P. and D.P. All authors have read and agreed to the published version of the manuscript.

Funding

This research was funded by Sapienza University of Roma, grant number RM11715C7E58658B.

Institutional Review Board Statement

Not applicable.

Informed Consent Statement

Not applicable.

Data Availability Statement

Data are contained within the article and supplementary material.

Acknowledgments

The authors are grateful to Francesco Mura (Sapienza Nanotechnology and Nanoscience Laboratory (SNN-Lab), Sapienza University of Rome) for FESEM analyses.

Conflicts of Interest

The authors declare no conflict of interest. The funders had no role in the design of the study; in the collection, analyses, or interpretation of data; in the writing of the manuscript, or in the decision to publish the results.

References

  1. Faramawy, S.; Zaki, T.; Sakr, A.-E. Natural gas origin, composition, and processing: A review. J. Nat. Gas. Sci. Eng. 2016, 34, 34–54. [Google Scholar] [CrossRef]
  2. Olajire, A.A. Valorization of greenhouse carbon dioxide emissions into value-added products by catalytic processes. J. CO2 Util. 2013, 3-4, 74–92. [Google Scholar] [CrossRef]
  3. Horn, R.; Schlögl, R. Methane Activation by Heterogeneous Catalysis. Catal. Lett. 2015, 145, 23–39. [Google Scholar] [CrossRef] [Green Version]
  4. Pen, M.A.; Gomez, J.; Fierro, J. New catalytic routes for syngas and hydrogen production. Appl. Catal. A: Gen. 1996, 144, 7–57. [Google Scholar] [CrossRef]
  5. Al-Sayari, S.A. Recent Developments in the Partial Oxidation of Methane to Syngas. Open Catal. J. 2013, 6, 17–28. [Google Scholar] [CrossRef]
  6. Ghoneim, S.A.; El-Salamony, R.A.; El-Temtamy, S.A. Review on Innovative Catalytic Reforming of Natural Gas to Syngas. World J. Eng. Technol. 2016, 4, 116–139. [Google Scholar] [CrossRef] [Green Version]
  7. Aasberg-Petersen, K.; Dybkjær, I.; Ovesen, C.; Schjødt, N.; Sehested, J.; Thomsen, S. Natural gas to synthesis gas – Catalysts and catalytic processes. J. Nat. Gas. Sci. Eng. 2011, 3, 423–459. [Google Scholar] [CrossRef]
  8. Rostrup-Nielsen, J. Steam reforming and chemical recuperation. Catal. Today 2009, 145, 72–75. [Google Scholar] [CrossRef]
  9. Meloni, E.; Martino, M.; Palma, V. A Short Review on Ni Based Catalysts and Related Engineering Issues for Methane Steam Reforming. Catalysts 2020, 10, 352. [Google Scholar] [CrossRef] [Green Version]
  10. Elbadawi, A.H.; Ge, L.; Li, Z.; Liu, S.; Wang, S.; Zhu, Z. Catalytic partial oxidation of methane to syngas: Review of perovskite catalysts and membrane reactors. Catal. Rev. 2021, 63, 1–67. [Google Scholar] [CrossRef]
  11. Osman, A.I. Catalytic Hydrogen Production from Methane Partial Oxidation: Mechanism and Kinetic Study. Chem. Eng. Technol. 2020, 43, 641–648. [Google Scholar] [CrossRef]
  12. Choudhary, T.V.; Choudhary, V.R. Energy-Efficient Syngas Production through Catalytic Oxy-Methane Reforming Reactions. Angew. Chem. Int. Ed. 2008, 47, 1828–1847. [Google Scholar] [CrossRef] [PubMed]
  13. Enger, B.C.; Lødeng, R.; Holmen, A. A review of catalytic partial oxidation of methane to synthesis gas with emphasis on reaction mechanisms over transition metal catalysts. Appl. Catal. A Gen. 2008, 346, 1–27. [Google Scholar] [CrossRef]
  14. Campa, M.; Ferraris, G.; Gazzoli, D.; Pettiti, I.; Pietrogiacomi, D. Rhodium supported on tetragonal or monoclinic ZrO2 as catalyst for the partial oxidation of methane. Appl. Catal. B Environ. 2013, 142-143, 423–431. [Google Scholar] [CrossRef]
  15. Liu, H.; He, D. Recent Progress on Ni-Based Catalysts in Partial Oxidation of Methane to Syngas. Catal. Surv. Asia 2012, 16, 53–61. [Google Scholar] [CrossRef]
  16. Jin, R.; Chen, Y.; Li, W.; Cui, W.; Ji, Y.; Yu, C.; Jiang, Y. Mechanism for catalytic partial oxidation of methane to syngas over a Ni/Al2O3 catalyst. Appl. Catal. A Gen. 2000, 201, 71–80. [Google Scholar] [CrossRef]
  17. Dong, W.-S.; Jun, K.-W.; Roh, H.-S.; Liu, Z.-W.; Park, S.-E. Comparative Study on Partial Oxidation of Methane over Ni/ZrO2, Ni/CeO2 and Ni/Ce–ZrO2 Catalysts. Catal. Lett. 2002, 78, 215–222. [Google Scholar] [CrossRef]
  18. Yan, Q.G.; Weng, W.Z.; Wan, H.L.; Toghiani, H.; Toghiani, R.K.; Pittman, C.U., Jr. Activation of methane to syngas over a Ni/TiO2 catalyst. Appl. Catal. A 2003, 239, 43–58. [Google Scholar] [CrossRef]
  19. Enger, B.C.; Lødeng, R.; Holmén, A. Evaluation of reactor and catalyst performance in methane partial oxidation over modified nickel catalysts. Appl. Catal. A Gen. 2009, 364, 15–26. [Google Scholar] [CrossRef]
  20. Barbero, J.; Peña, M.A.; Campos-Martin, J.M.; Fierro, J.; Arias, P.L. Support Effect in Supported Ni Catalysts on Their Performance for Methane Partial Oxidation. Catal. Lett. 2003, 87, 211–218. [Google Scholar] [CrossRef]
  21. Alvarez-Galvan, C.; Melian, M.; Ruiz-Matas, L.; Eslava, J.L.; Navarro, R.M.; Ahmadi, M.; Cuenya, B.R.; Fierro, J.L.G. Partial Oxidation of Methane to Syngas Over Nickel-Based Catalysts: Influence of Support Type, Addition of Rhodium, and Preparation Method. Front. Chem. 2019, 7, 104. [Google Scholar] [CrossRef] [PubMed] [Green Version]
  22. Claridge, J.B.; Green, M.L.H.; Tsang, S.C.; York, A.P.E.; Ashcroft, A.T.; Battle, P.D. A study of carbon deposition on catalysts during the partial oxidation of methane to synthesis gas. Catal. Lett. 1993, 22, 299–305. [Google Scholar] [CrossRef]
  23. Mahamulkar, S.; Yin, K.; Agrawal, P.K.; Davis, R.J.; Jones, C.W.; Malek, A.; Shibata, H. Formation and Oxidation/Gasification of Carbonaceous Deposits: A Review. Ind. Eng. Chem. Res. 2016, 55, 9760–9818. [Google Scholar] [CrossRef]
  24. Yan, Q.; Wu, T.; Li, J.; Luo, C.; Weng, W.; Yang, L.; Wa, H. Mechanism study of carbon deposition on a Ni/Al2O3 catalyst during partial oxidation of methane to syngas. J. Nat. Gas Chem. 2000, 9, 89–102. [Google Scholar]
  25. Hayek, K.; Kramer, R.; Paál, Z. Metal-support boundary sites in catalysis. Appl. Catal. A Gen. 1997, 162, 1–15. [Google Scholar] [CrossRef]
  26. Cuenya, B.R. Synthesis and catalytic properties of metal nanoparticles: Size, shape, support, composition, and oxidation state effects. Thin Solid Films 2010, 518, 3127–3150. [Google Scholar] [CrossRef]
  27. Tanabe, K. Surface and catalytic properties of ZrO2. Mater. Chem. Phys. 1985, 13, 347–364. [Google Scholar] [CrossRef]
  28. Chuah, G.-K.; Jaenicke, S. The preparation of high surface area zirconia—Influence of precipitating agent and digestion. Appl. Catal. A Gen. 1997, 163, 261–273. [Google Scholar] [CrossRef]
  29. Jung, K.T.; Bell, A.T. The effects of synthesis and pretreatment conditions on the bulk structure and surface properties of zirconia. J. Mol. Catal. A Chem. 2000, 163, 27–42. [Google Scholar] [CrossRef]
  30. Hegarty, M.; O’Connor, A.; Ross, J. Syngas production from natural gas using ZrO2-supported metals. Catal. Today 1998, 42, 225–232. [Google Scholar] [CrossRef]
  31. Song, Y.-Q.; He, D.-H.; Xu, B.-Q. Effects of preparation methods of ZrO2 support on catalytic performances of Ni/ZrO2 catalysts in methane partial oxidation to syngas. Appl. Catal. A Gen. 2008, 337, 19–28. [Google Scholar] [CrossRef]
  32. Song, Y.-Q.; Liu, H.-M.; He, D.-H. Effects of Hydrothermal Conditions of ZrO2 on Catalyst Properties and Catalytic Performances of Ni/ZrO2 in the Partial Oxidation of Methane. Energy Fuels 2010, 24, 2817–2824. [Google Scholar] [CrossRef]
  33. Galanov, S.I.; Sidorova, O.I. Effect of a precursor on the phase composition and particle size of the active component of Ni-ZrO2 catalytic systems for the oxidation of methane into syngas. Russ. J. Phys. Chem. A 2014, 88, 1629–1636. [Google Scholar] [CrossRef]
  34. Xu, B.-Q.; Wei, J.-M.; Yu, Y.-T.; Li, Y.; Li, J.-L.; Zhu, Q.-M. Size Limit of Support Particles in an Oxide-Supported Metal Catalyst: Nanocomposite Ni/ZrO2 for Utilization of Natural Gas. J. Phys. Chem. B 2003, 107, 5203–5207. [Google Scholar] [CrossRef]
  35. Pedrero, C.M.; Carrazán, S.G.; Ruiz, P. Preliminary results on the role of the deposition of small amounts of ZrO2 on Al2O3 support on the partial oxidation of methane and ethane over Rh and Ni supported catalysts. Catal. Today 2021, 363, 111–121. [Google Scholar] [CrossRef]
  36. Martins, R.L.; Schmal, M. Activation of Methane on NiO Nanoparticles with Different Morphologies. J. Braz. Chem. Soc. 2014, 25, 2399–2408. [Google Scholar] [CrossRef]
  37. Yang, J.; Ren, J.; Guo, H.; Qin, X.; Han, B.; Lin, J.; Li, Z. The growth of Nin clusters and their interaction with cubic, monoclinic, and tetragonal ZrO2 surfaces–a theoretical and experimental study. RSC Adv. 2015, 5, 59935–59945. [Google Scholar] [CrossRef]
  38. Boudjennad, E.; Chafi, Z.; Ouafek, N.; Ouhenia, S.; Keghouche, N.; Minot, C. Experimental and theoretical study of the Ni−(m-ZrO2) interaction. Surf. Sci. 2012, 606, 1208–1214. [Google Scholar] [CrossRef]
  39. Dacquin, J.-P.; Dujardin, C.; Granger, P. Surface reconstruction of supported Pd on LaCoO3: Consequences on the catalytic properties in the decomposition of N2O. J. Catal. 2008, 253, 37–49. [Google Scholar] [CrossRef]
  40. Scherrer, P. Bestimmung der grösse und der inneren struktur von kolloidteilchen mittels röntgensrahlen. Nachr. Ges. Wiss. Göttingen 1918, 26, 98–100. [Google Scholar]
  41. Barrett, E.P.; Joyner, L.G.; Halenda, P.P. The Determination of Pore Volume and Area Distributions in Porous Substances. I. Computations from Nitrogen Isotherms. J. Am. Chem. Soc. 1951, 73, 373–380. [Google Scholar] [CrossRef]
  42. Gurvitsch, L. Physicochemical attractive force. J. Phys. Chem. Soc. Russ. 1915, 47, 805–827. [Google Scholar]
  43. Schneider, C.A.; Rasband, W.S.; Eliceiri, K.W. NIH Image to ImageJ: 25 years of image analysis. Nat. Methods 2012, 9, 671–675. [Google Scholar] [CrossRef] [PubMed]
  44. Bergeret, G.; Gallezot, P. Particle Size and Dispersion Measurements. In Handbook of Heterogeneous Catalysis; Ertl, G., Knözinger, H., Weitkamp, J., Eds.; Wiley-VCH: Weinheim, Germany, 1997; Volume 2, pp. 439–464. [Google Scholar]
  45. Ul-Hamid, A. A Beginners’ Guide to Scanning Electron. Microscopy; Metzler, J.B., Ed.; Springer: Berlin, Germany, 2018; pp. 77–128. [Google Scholar]
  46. Mironova-Ulmane, N.; Kuzmin, A.; Steins, I.; Grabis, J.; Sildos, I.; Pärs, M. Raman scattering in nanosized nickel oxide NiO. J. Phys. Conf. Ser. 2007, 93, 012039. [Google Scholar] [CrossRef]
  47. Wang, W.; Liu, Y.; Xu, C.; Zheng, C.; Wang, G. Synthesis of NiO nanorods by a novel simple precursor thermal decomposition approach. Chem. Phys. Lett. 2002, 362, 119–122. [Google Scholar] [CrossRef]
  48. Bellido, J.D.A.; Assaf, E.M. Nickel catalysts supported on ZrO2, Y2O3-stabilized ZrO2 and CaO-stabilized ZrO2 for the steam reforming of ethanol: Effect of the support and nickel load. J. Power Sources 2008, 177, 24–32. [Google Scholar] [CrossRef]
  49. Zhao, K.; Wang, W.; Li, Z. Highly efficient Ni/ZrO2 catalysts prepared via combustion method for CO2 methanation. J. CO2 Util. 2016, 16, 236–244. [Google Scholar] [CrossRef]
  50. Kesavan, J.K.; Luisetto, I.; Tuti, S.; Meneghini, C.; Iucci, G.; Battocchio, C.; Mobilio, S.; Casciardi, S.; Sisto, R. Nickel supported on YSZ: The effect of Ni particle size on the catalytic activity for CO2 methanation. J. CO2 Util. 2018, 23, 200–211. [Google Scholar] [CrossRef]
  51. Mori, H.; Wen, C.-ju; Otomo, J.; Eguchi, K.; Takahashi, H. Investigation of the interaction between NiO and yttria-stabilized zirconia (YSZ) in the NiO/YSZ composite by temperature-programmed reduction technique. Appl. Catal. A 2003, 245, 79–85. [Google Scholar] [CrossRef]
  52. Alderliesten, M. Mean Particle Diameters. From Statistical Definition to Physical Understanding. J. Biopharm. Stat. 2005, 15, 295–325. [Google Scholar] [CrossRef] [Green Version]
  53. Ferrari, A.C.; Robertson, J. Interpretation of Raman spectra of disordered and amorphous carbon. Phys. Rev. B 2000, 61, 14095–14107. [Google Scholar] [CrossRef] [Green Version]
  54. Zhang, X.; Hayward, D.O.; Mingos, D.M.P. Oscillatory behaviour during the partial oxidation of methane over Nickel foils. Catal. Lett. 2002, 83, 149–155. [Google Scholar] [CrossRef]
  55. Zhang, X.; Hayward, D.O.; Mingos, D.M.P. Further Studies on Oscillations over Nickel Wires during the Partial Oxidation of Methane. Catal. Lett. 2003, 86, 235–243. [Google Scholar] [CrossRef]
  56. Hu, Y.H.; Ruckenstein, E. Catalyst Temperature Oscillations during Partial Oxidation of Methane. Ind. Eng. Chem. Res. 1998, 37, 2333–2335. [Google Scholar] [CrossRef]
  57. Wang, M.; Weng, W.; Zheng, H.; Yi, X.; Huang, C.; Wan, H. Oscillations during partial oxidation of methane to synthesis gas over Ru/Al2O3 catalyst. J. Nat. Gas. Chem. 2009, 18, 300–305. [Google Scholar] [CrossRef]
  58. Zhang, X.; Lee, C.; Hayward, D.; Mingos, D. Oscillatory behaviour observed in the rate of oxidation of methane over metal catalysts. Catal. Today 2005, 105, 283–294. [Google Scholar] [CrossRef]
  59. Bychkov, V.; Tyulenin, Y.; Slinko, M.; Korchak, V. Nonlinear behaviour during methane and ethane oxidation over Ni, Co and Pd catalysts. Surf. Sci. 2009, 603, 1680–1689. [Google Scholar] [CrossRef]
  60. Stötzel, J.; Frahm, R.; Kimmerle, B.; Nachtegaal, M.; Grunwaldt, J.-D. Oscillatory behaviour during the catalytic partial oxidation of methane: Following dynamic structural changes of palladium using the QEXAFS technique. J. Phys. Chem. C 2012, 116, 599–609. [Google Scholar] [CrossRef] [Green Version]
  61. Lashina, E.A.; Kaichev, V.V.; Saraev, A.A.; Vinokurov, Z.S.; Chumakova, N.A.; Chumakov, G.A.; Bukhtiyarov, V.I. Experimental Study and Mathematical Modeling of Self-Sustained Kinetic Oscillations in Catalytic Oxidation of Methane over Nickel. J. Phys. Chem. A 2017, 121, 6874–6886. [Google Scholar] [CrossRef]
  62. Saraev, A.A.; Vinokurov, Z.S.; Kaichev, V.; Shmakov, A.N.; Bukhtiyarov, V. The origin of self-sustained reaction-rate oscillations in the oxidation of methane over nickel: An operando XRD and mass spectrometry study. Catal. Sci. Technol. 2017, 7, 1646–1649. [Google Scholar] [CrossRef] [Green Version]
  63. Specchia, S.; Vella, L.D.; Montini, T.; Fornasiero, P. Hydrogen Production: Prospects and Processes; Nova Science Publishers Inc.: New York, NY, USA, 2011; pp. 95–139. [Google Scholar]
  64. Pokrovski, K.; Jung, K.T.; Bell, A.T. Investigation of CO and CO2 Adsorption on Tetragonal and Monoclinic Zirconia. Langmuir 2001, 17, 4297–4303. [Google Scholar] [CrossRef]
  65. Kouva, S.; Andersin, J.; Honkala, K.; Lehtonen, J.; Lefferts, L.; Kanervo, J. Water and carbon oxides on monoclinic zirconia: Experimental and computational insights. Phys. Chem. Chem. Phys. 2014, 16, 20650–20664. [Google Scholar] [CrossRef] [PubMed]
  66. Bachiller-Baeza, B.; Rodriguez-Ramos, I.; Guerrero-Ruiz, A. Interaction of Carbon Dioxide with the Surface of Zirconia Polymorphs. Langmuir 1998, 14, 3556–3564. [Google Scholar] [CrossRef]
  67. Morterra, C.; Orio, L. Surface characterization of zirconium oxide. II. The interaction with carbon dioxide at ambient temperature. Mater. Chem. Phys. 1990, 24, 247–268. [Google Scholar] [CrossRef]
  68. Bolis, V.; Morterra, C.; Volante, M.; Orio, L.; Fubini, B. Development and suppression of surface acidity on monoclinic zirconia: A spectroscopic and calorimetric investigation. Langmuir 1990, 6, 695–701. [Google Scholar] [CrossRef]
  69. Ouyang, F.; Nakayama, A.; Tabada, K.; Suzuki, E. Infrared Study of a Novel Acid-Base Site on ZrO2 by Adsorbed Probe Molecules. I.; Pyridine, Carbon Dioxide, and Formic Acid Adsorption. J. Phys. Chem. B 2000, 104, 2012–2018. [Google Scholar] [CrossRef]
  70. Esconjauregui, S.; Whelan, C.M.; Maex, K. The reasons why metals catalyze the nucleation and growth of carbon nanotubes and other carbon nanomorphologies. Carbon 2009, 47, 659–669. [Google Scholar] [CrossRef]
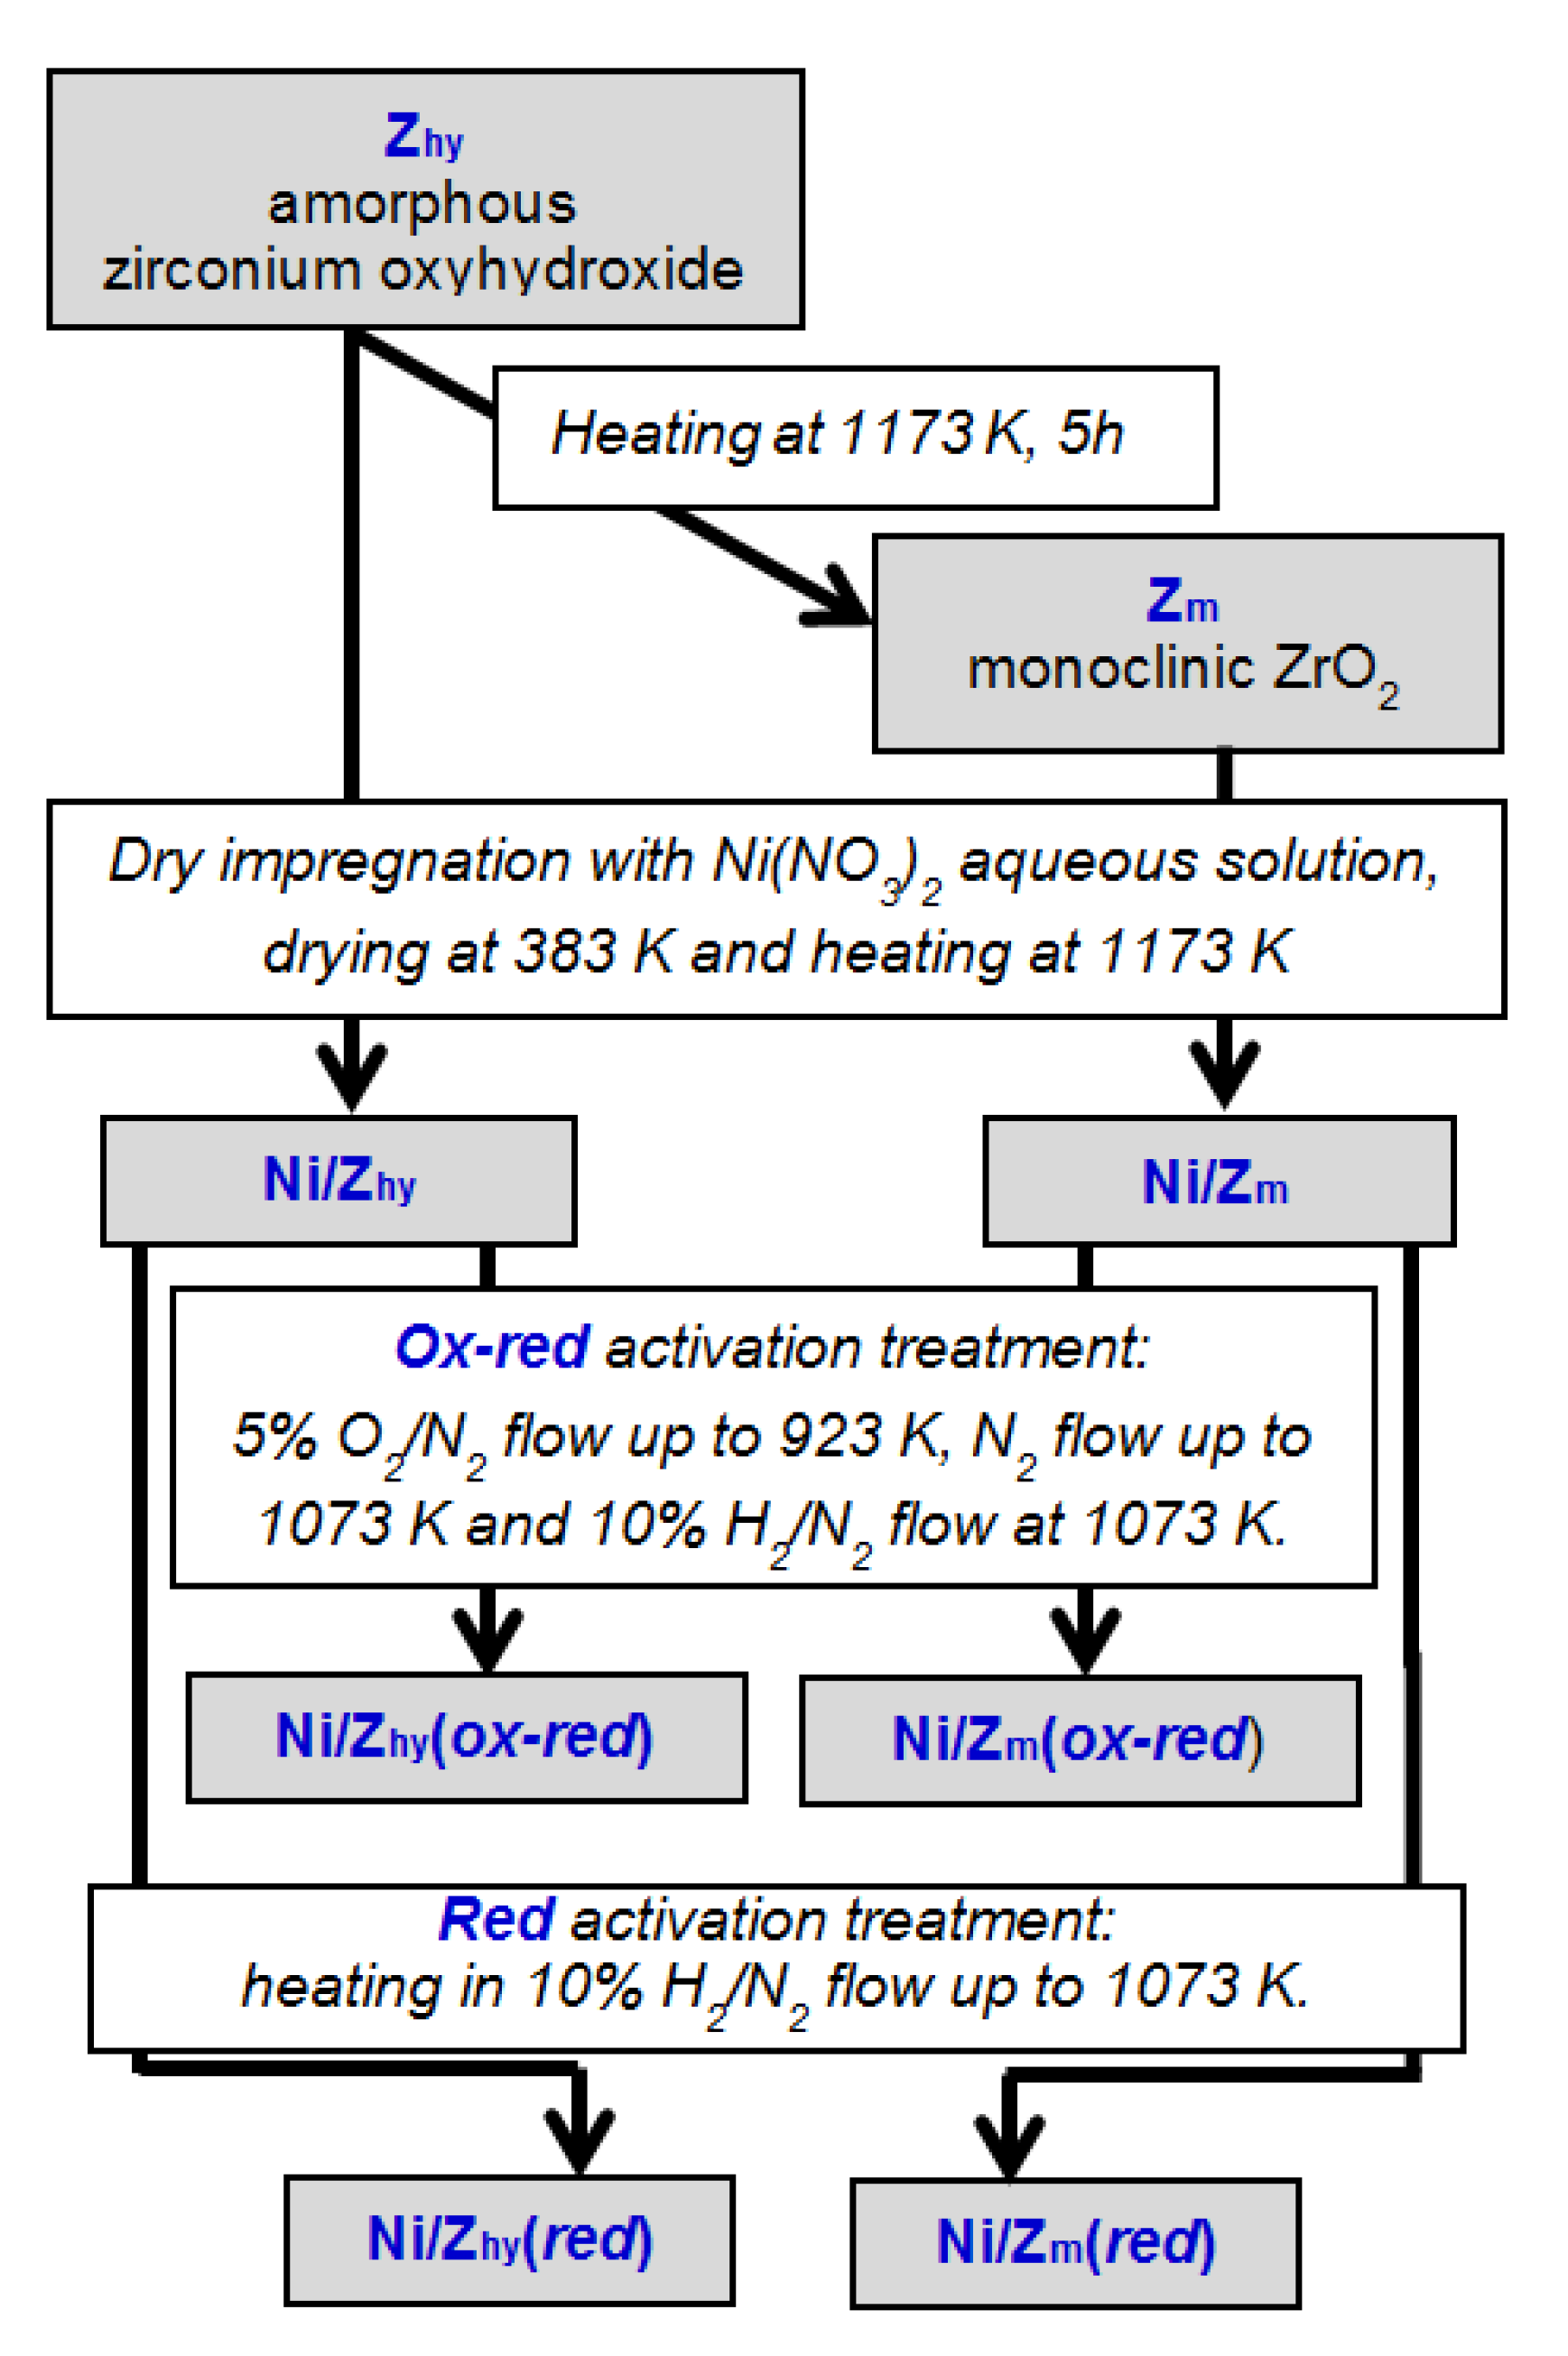
Scheme 1. Preparation procedures of Ni/ZrO2 catalysts.
Materials 14 02495 sch001
Figure 1. XRD patterns of monoclinic ZrO2 and NiO/ZrO2 catalyst precursors. (a) Zm; (b) 1.8NiO/Zm; (c) 1.7NiO/Zhy; (d) 4.8NiO/Zhy; (e) 5.1NiO/Zm.
Materials 14 02495 g001
Figure 2. FESEM images of monoclinic ZrO2, unsupported NiO and NiO/ZrO2 catalyst precursors. Magnifications of selected areas are shown in the insets of (a), (b) and (f). The inset with red dots in (f) refers to the Ni EDX elemental map.
Materials 14 02495 g002
Figure 3. Raman spectra of catalyst precursors. (a) 4.8NiO/Zhy; (b) 5.1NiO/Zm.
Materials 14 02495 g003
Figure 4. TPR profiles for NiO and NiO/ZrO2 catalyst precursors. (a) Unsupported NiO; (b) 5.1NiO/Zm; (c) 1.8NiO/Zm; (d) 4.8NiO/Zhy; (e) 1.7NiO/Zhy. α, β and γ: temperature ranges for the reduction of NiO species interacting differently with the support.
Materials 14 02495 g004
Figure 5. XRD patterns of monoclinic ZrO2 and activated Ni/ZrO2 catalysts. (a) Zm; (b) 4.8Ni/Zhy (red); (c) 4.8Ni/Zhy (ox-red).
Materials 14 02495 g005
Figure 6. FESEM images of Ni/Zhy (ox-red) and Ni/Zm (ox-red) catalysts. Red circles and magnifications in sections (c) and (d) highlight some Ni particles.
Materials 14 02495 g006
Figure 7. Ni-particle number (ni) (ad) and Ni-particle surface (Ai = πnidi2) (a’d’) distributions as a function of Ni-particle diameters (di) for 1.7Ni/Zhy (a,a’), 4.8Ni/Zhy (b,b’), 1.8Ni/Zm (c,c’) and 5.1Ni/Zm (d,d’) samples. Dotted lines identify the length-number mean diameter (dLN) or volume-area mean diameter (dVA) values; Σni stands for the total number of Ni particles from FESEM images. For samples showing a normal distribution curve of Ni particles size, the curve and the corresponding standard deviation σ are also reported.
Materials 14 02495 g007
Figure 8. (ad) FESEM images of 4.8Ni/Zhy and 5.1Ni/Zm used catalysts. Red circles highlight some Ni particles.
Materials 14 02495 g008
Figure 9. Raman spectrum of the 5.1Ni/Zm (red) used catalyst. D and G identify disordered-graphite and graphite bands, respectively.
Materials 14 02495 g009
Figure 10. Catalytic activity of unsupported Ni metal and monoclinic ZrO2 (Zm) with reactant mixtures at different CH4:O2 ratios. CH4 and O2 conversions and H2 and CO2 yields as a function of time on stream at 1023 K for ox-red-activated catalysts. (a): [CH4] = 2%, [O2] = 0.4%. (b,c): [CH4] = 2%, [O2] = 1%, N2 as balance; total flow rate = 150 cm3 (STP)·min−1.
Materials 14 02495 g010
Figure 11. Catalytic activity (CH4 conversion and H2, CO2 and H2O yields) of Ni/ZrO2 catalysts after ox-red activation treatment in experiments as a function of temperature (left side: (ad)) or as a function of time on stream at 1023 K (right side: (eh)). Reactant mixture: [CH4] = 2%, [O2] = 1%, N2 as balance; total flow rate = 150 cm3 (STP)·min−1. Dotted line: CH4 conversion for the same mixture calculated at thermodynamic equilibrium (data from Ref. [11]).
Materials 14 02495 g011
Figure 12. Comparison of activity and selectivity for Ni/ZrO2 catalysts after ox-red activation treatment. H2 yield and selectivity (a,c) and CO yield and selectivity (b,d) as a function of temperature. Reactant mixture: [CH4] = 2%, [O2] = 1%, N2 as balance; total flow rate = 150 cm3 (STP)·min−1. Dotted line: H2 selectivity for the same mixture calculated at thermodynamic equilibrium (data from Ref. [11]).
Materials 14 02495 g012
Figure 13. Catalytic activity (CH4 conversion and H2, CO2 and H2O yields) of Ni/ZrO2 catalysts after red activation treatment in experiments as a function of temperature (left side: ad) or as a function of time on stream at set temperatures (right side: eh). Reactant mixture: [CH4] = 2%, [O2] = 1%, N2 as balance; total flow rate = 150 cm3 (STP)·min−1.
Materials 14 02495 g013
Figure 14. CH4 conversion and H2, CO2 and H2O yields on 5.1Ni/Zm (red) catalyst as a function of time on stream for specific temperatures. Reactant mixture: [CH4] = 2%, [O2] = 1%, N2 as balance; total flow rate = 150 cm3 (STP)·min−1.
Materials 14 02495 g014
Figure 15. FTIR spectra of surface species recorded in air at 298 K. (a) Zm support; (b) 4.8NiO/Zhy catalyst precursor.
Materials 14 02495 g015
Figure 16. In situ FTIR spectra of surface species during activation treatments on 4.8NiO/Zhy catalyst precursor. Spectra recorded in O2/N2 oxidative flow (a), and in H2/N2 reductive flow (b) at increasing temperature.
Materials 14 02495 g016
Table 1. Structural and textural features of precursors and catalysts (activated or used): specific surface area (S.A.), total pore volume (Vtot) and crystallite size (dXRD) of ZrO2, NiO and Ni.
PrecursorsCatalystsS.A. 1
(m2·g−1)
Vtot 2
(cc·g−1)
Crystallite Size, dXRD
(nm)
ZrO2NiONi
act 3 Used
Zhy-3600.33----
-Zm5.60.04149---
NiO (unsupported)----70--
-Ni (unsupported)-----70
1.8NiO/Zm-2.70.024-22--
-1.8Ni/Zm(ox-red)----1828
1.8Ni/Zm(red)----25-
5.1NiO/Zm-3.30.0315036--
-5.1Ni/Zm(ox-red)----3025
5.1Ni/Zm(red)----3537
1.7NiO/Zhy-5.40.040 32--
-1.7Ni/Zhy(ox-red)-----20
1.7Ni/Zhy(red)-----25
4.8NiO/Zhy-4.40.0445226--
-4.8Ni/Zhy(ox-red)----23-
4.8Ni/Zhy(red)----2430
1 ±0.5 m2·g-1; 2 ±0.005 cm3·g-1; 3 act, activated catalysts.
Table 2. FESEM images analysis for Zm, NiO and Ni.
PrecursorsCatalystsParticle Size, dFESEM (nm)Ni Particle NumberNi Particle Mean DiameterNi DispersionExposed Ni Atoms
ZrO2NiONi
Activated Used
Σni 1dLN 2
(nm)
dVA 3
(nm)
D 4
(%)
NNi(exp) 5
(atoms/g)
-Zm30–100--------
NiO (unsupported)--20–400-------
-Ni (unsupported) 40–150050–2000-----
1.8NiO/Zm--40–60-------
-1.8Ni/Zm (ox-red)--5–7520–80104336 ± 15482.13.9·1018
1.8Ni/Zm (red)--20–7520–80-----
5.1NiO/Zm--80–300-------
-5.1Ni/Zm (ox-red)--30–100050–7005022.6·1025.5·1020.189.4·1017
5.1Ni/Zm (red)--30–70035–700-----
1.7NiO/Zhy--n.d. 6-------
-1.7Ni/Zhy (ox-red)--10–3515–252518 ± 7224.67.1·1018
1.7Ni/Zhy (red)--5–3015–20-----
4.8NiO/Zhy--n.d. 6-------
-4.8Ni/Zhy (ox-red)--10–4515–4018824 ± 7283.61.8·1019
4.8Ni/Zhy (red)--8–3515–40-----
1 ni, number of metal particles with a specific diameter di; 2 length-number mean diameter, dLN = Σni·di/Σni and the corresponding standard deviation σ; 3 volume-area mean diameter, dVA = Σinidi3/Σnidi2; 4 Ni dispersion, D = 100 ·6⋅(vNi/aNi)/dVA; 5 exposed Ni atoms, NNi(exp) = (D·wNi·NA)/(10,000·MNi); 6 n.d., not detected.
Table 3. H2-TPR results for NiO and Ni/ZrO2 catalyst precursors.
CatalystH2 Consumption
(μmoli g−1)
e/Ni 1
% NiO Species
αβγ
NiO13302.00100--
1.8Ni/Zm31.042.02-6040
5.1Ni/Zm97.072.038947
1.7Ni/Zhy29.932.02-5446
4.8Ni/Zhy83.751.97-6832
1 Number of electrons consumed per Ni atom (e/Ni), calculated as (2·H2 molecules consumed g−1)/(Ni atoms·g−1).
Publisher’s Note: MDPI stays neutral with regard to jurisdictional claims in published maps and institutional affiliations.