
Effect of Superabsorbent Polymer on the Mechanical Performance and Microstructure of Concrete

Abstract
:1. Introduction
2. Materials and Methods
2.1. Materials
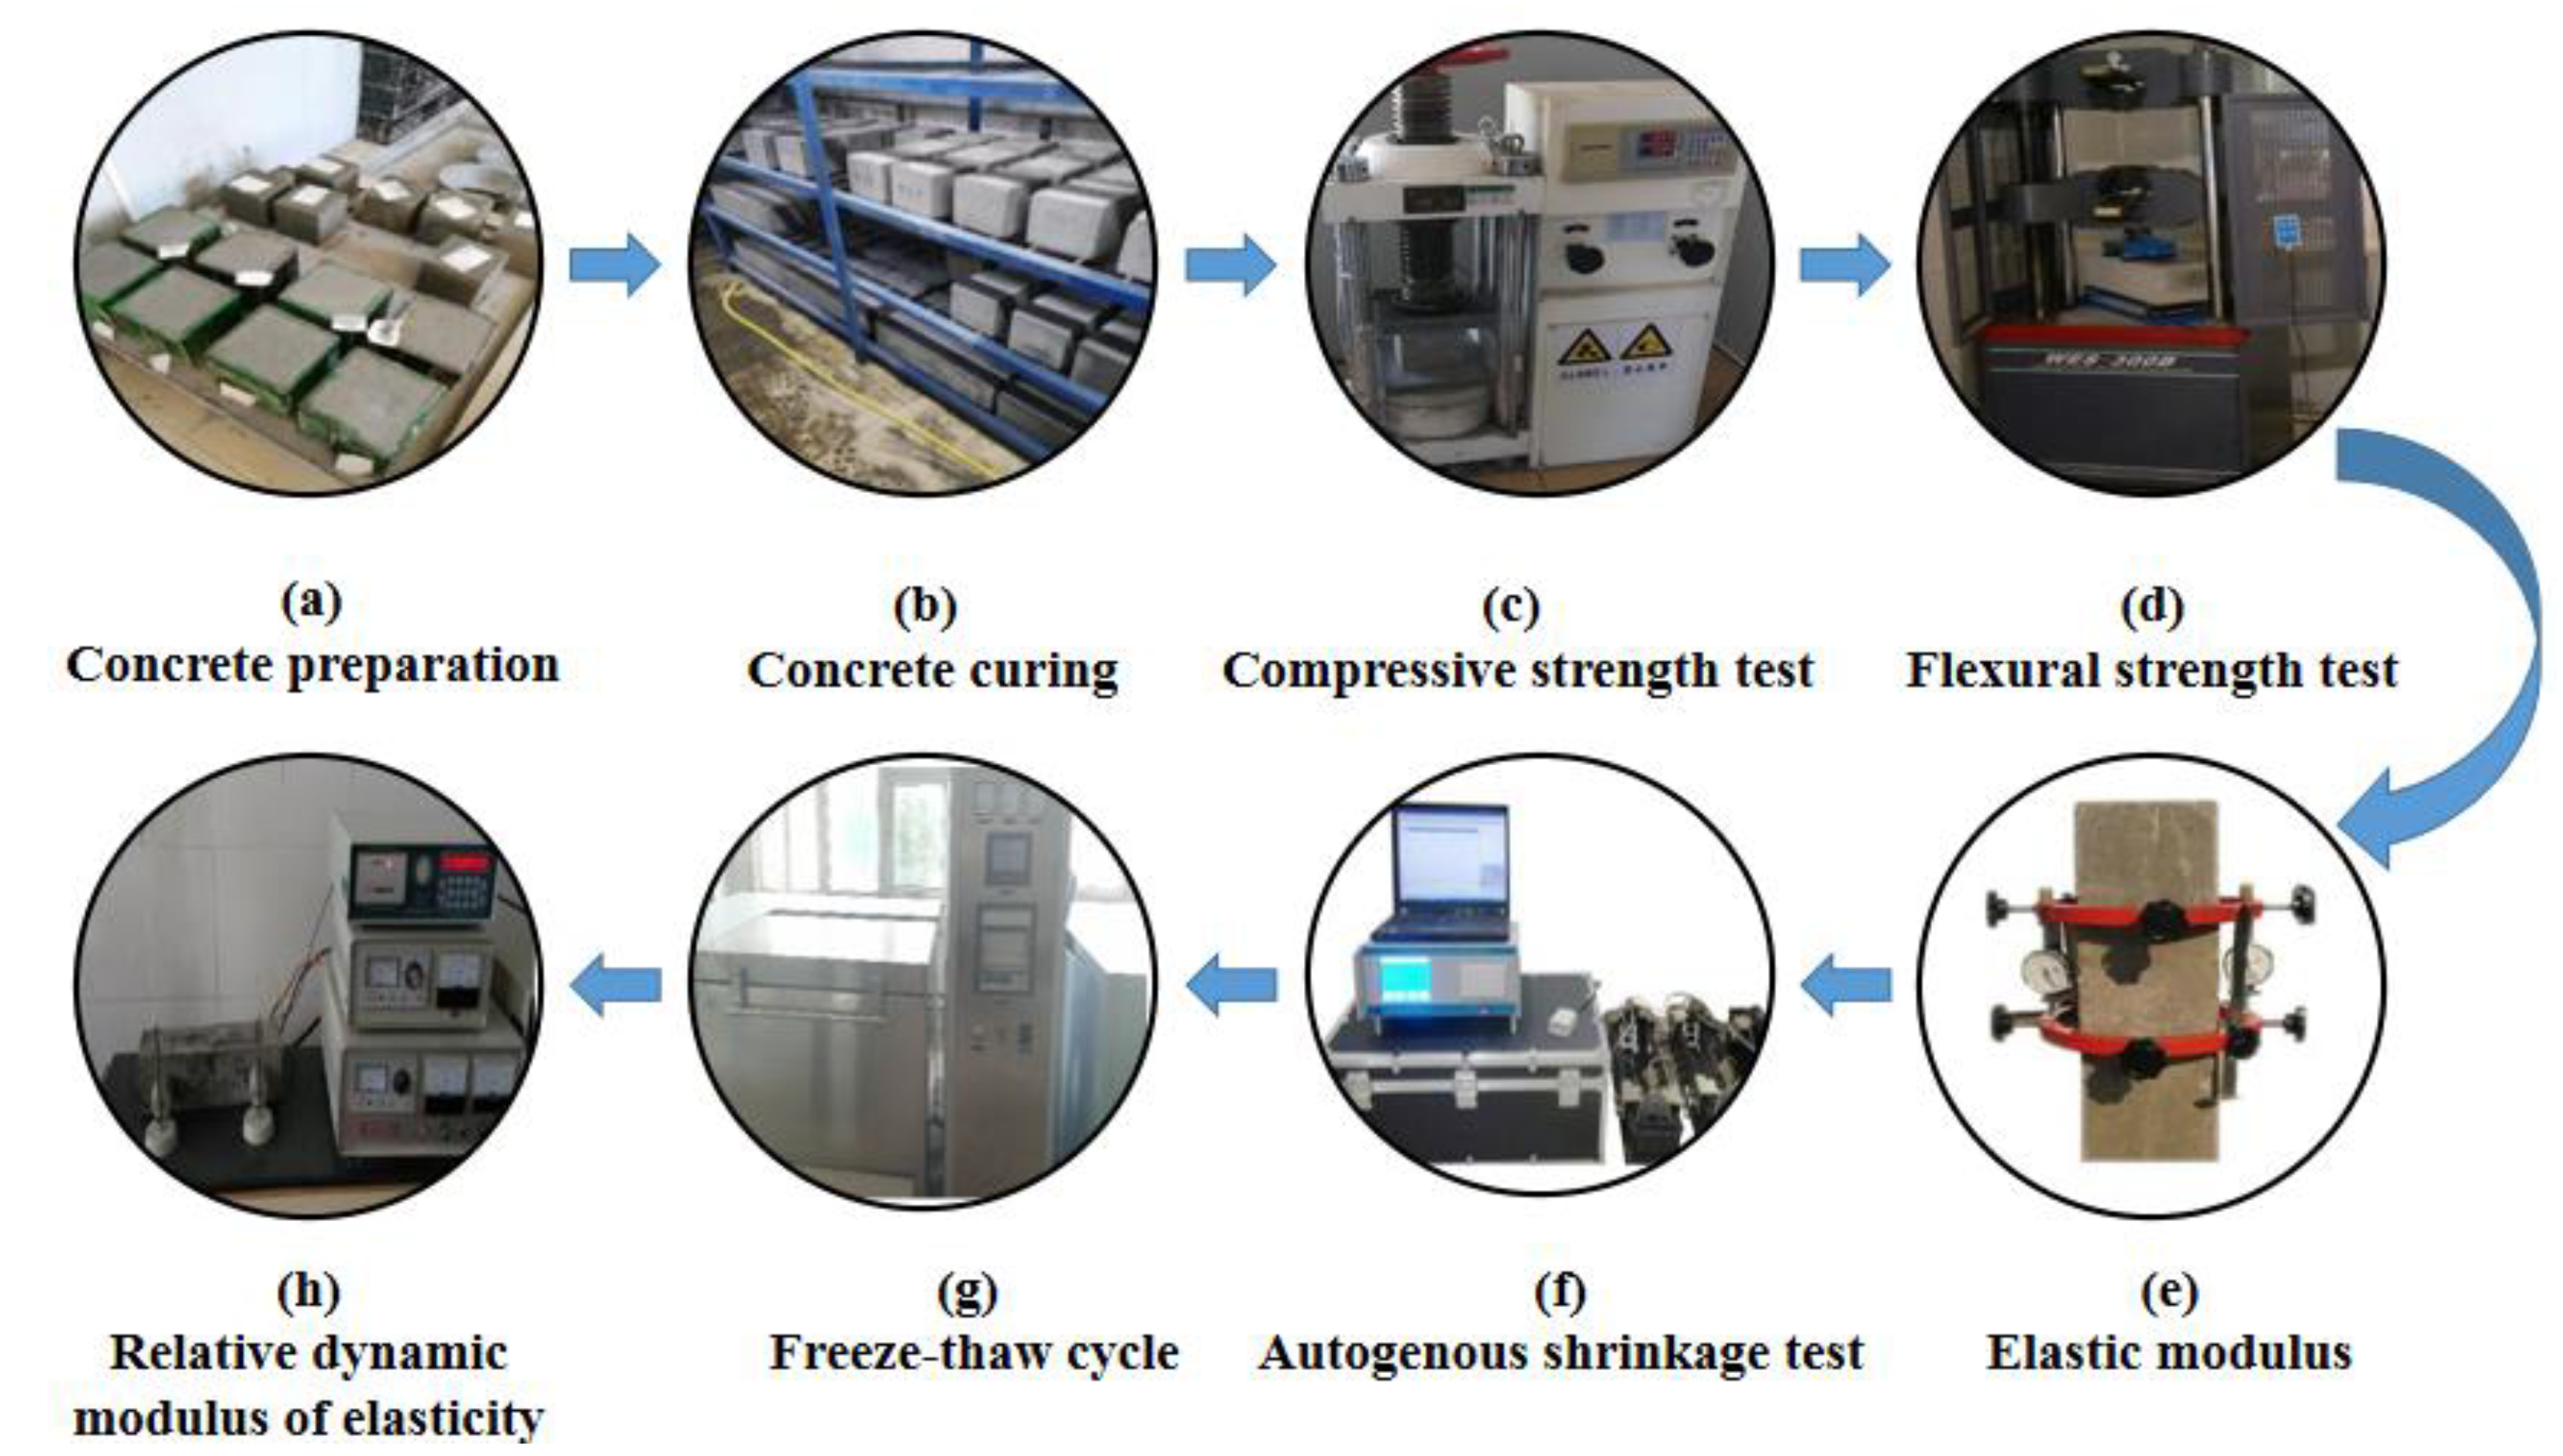
2.2. Test Procedure
3. Results and Discussions
3.1. Mechanical Properties
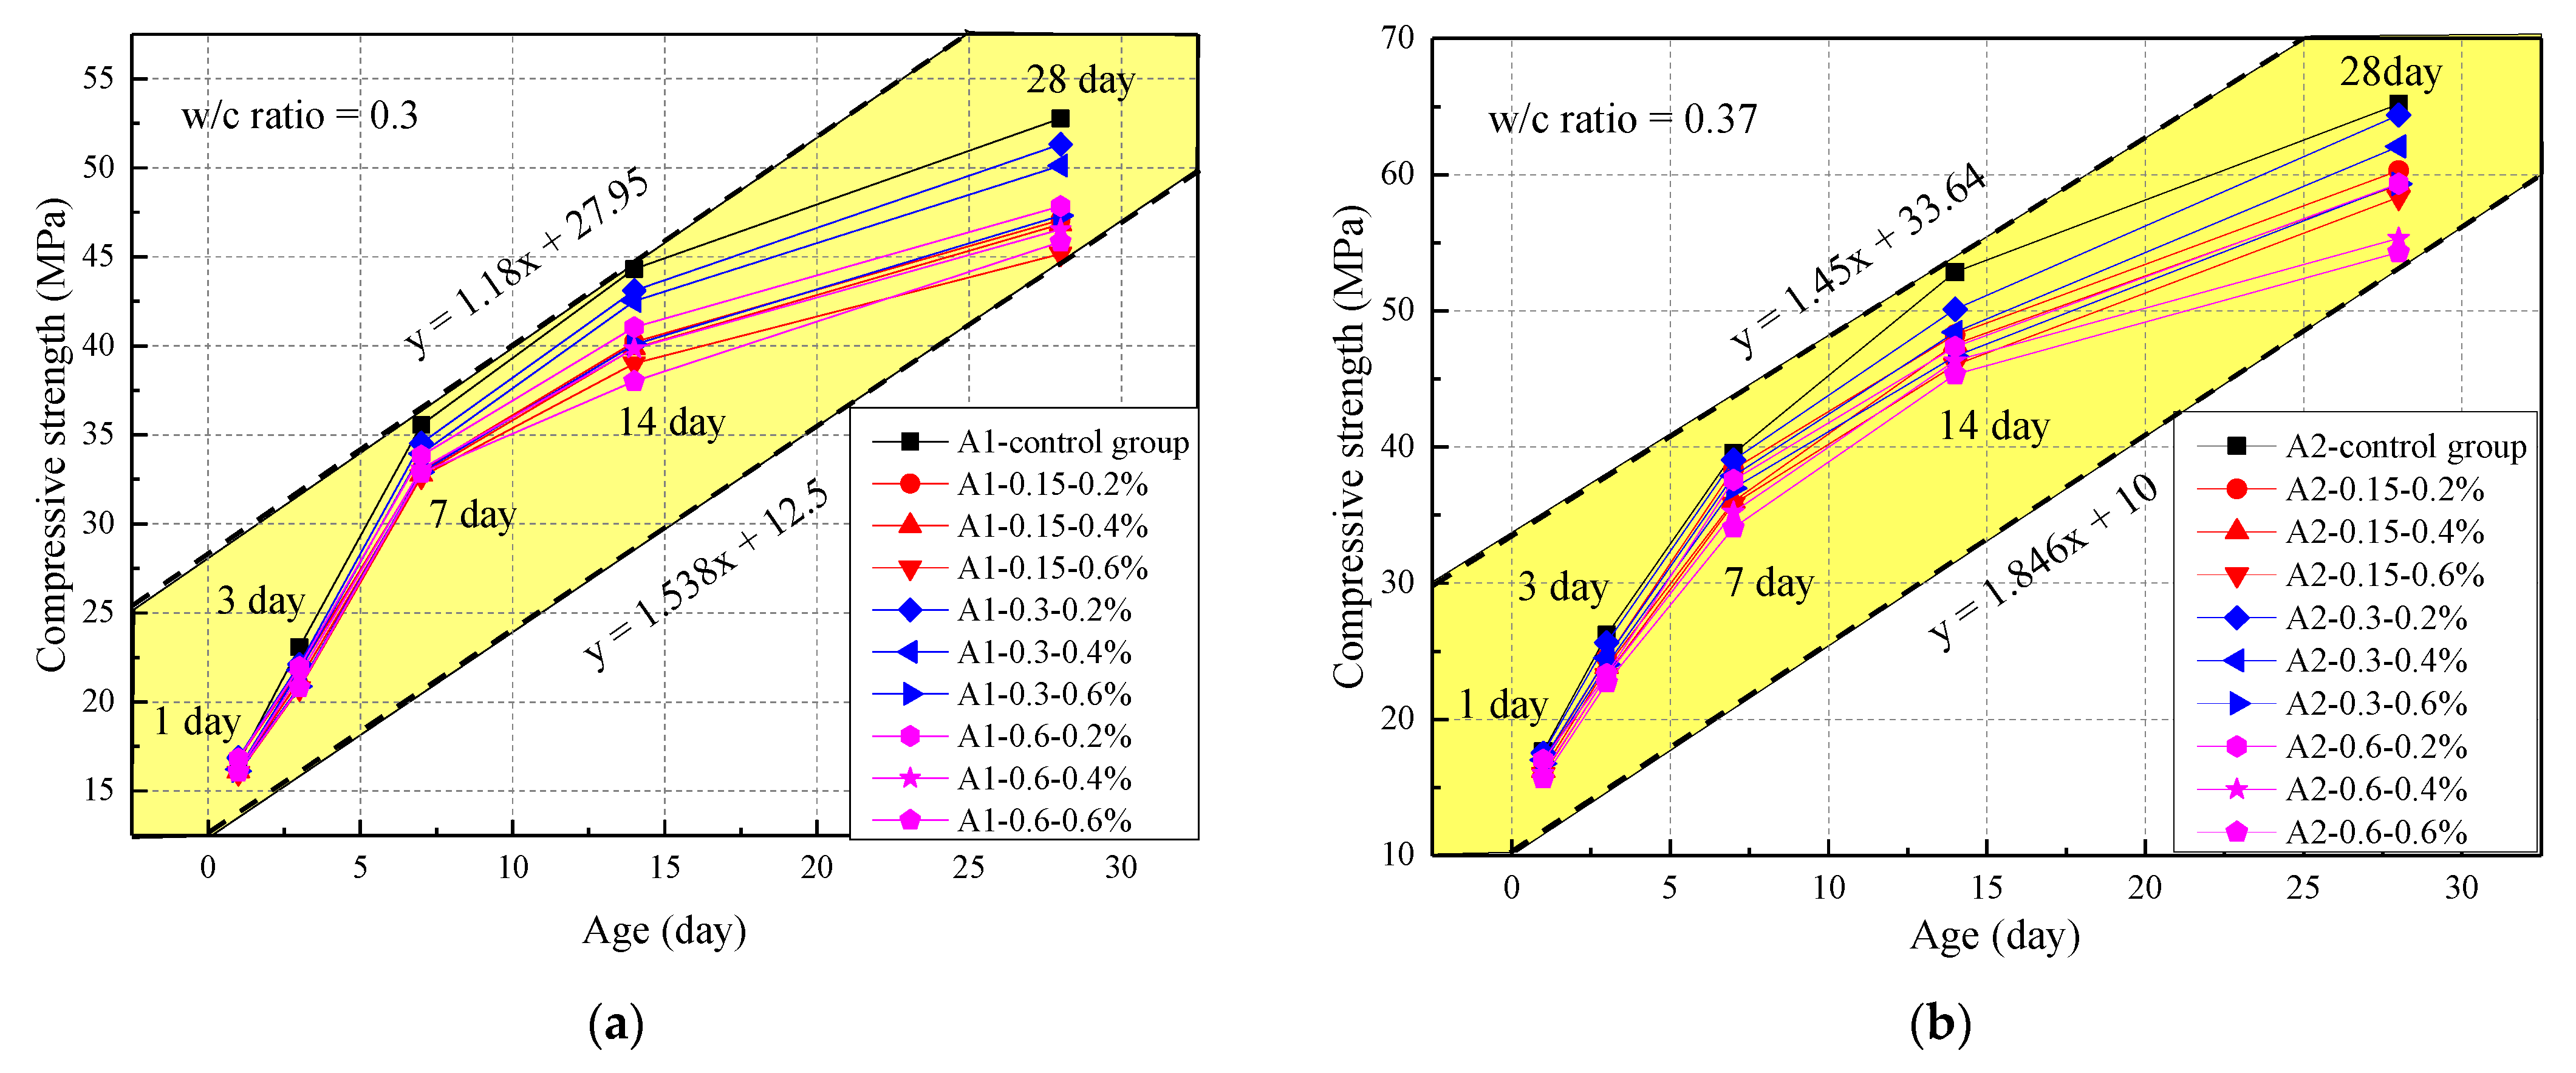
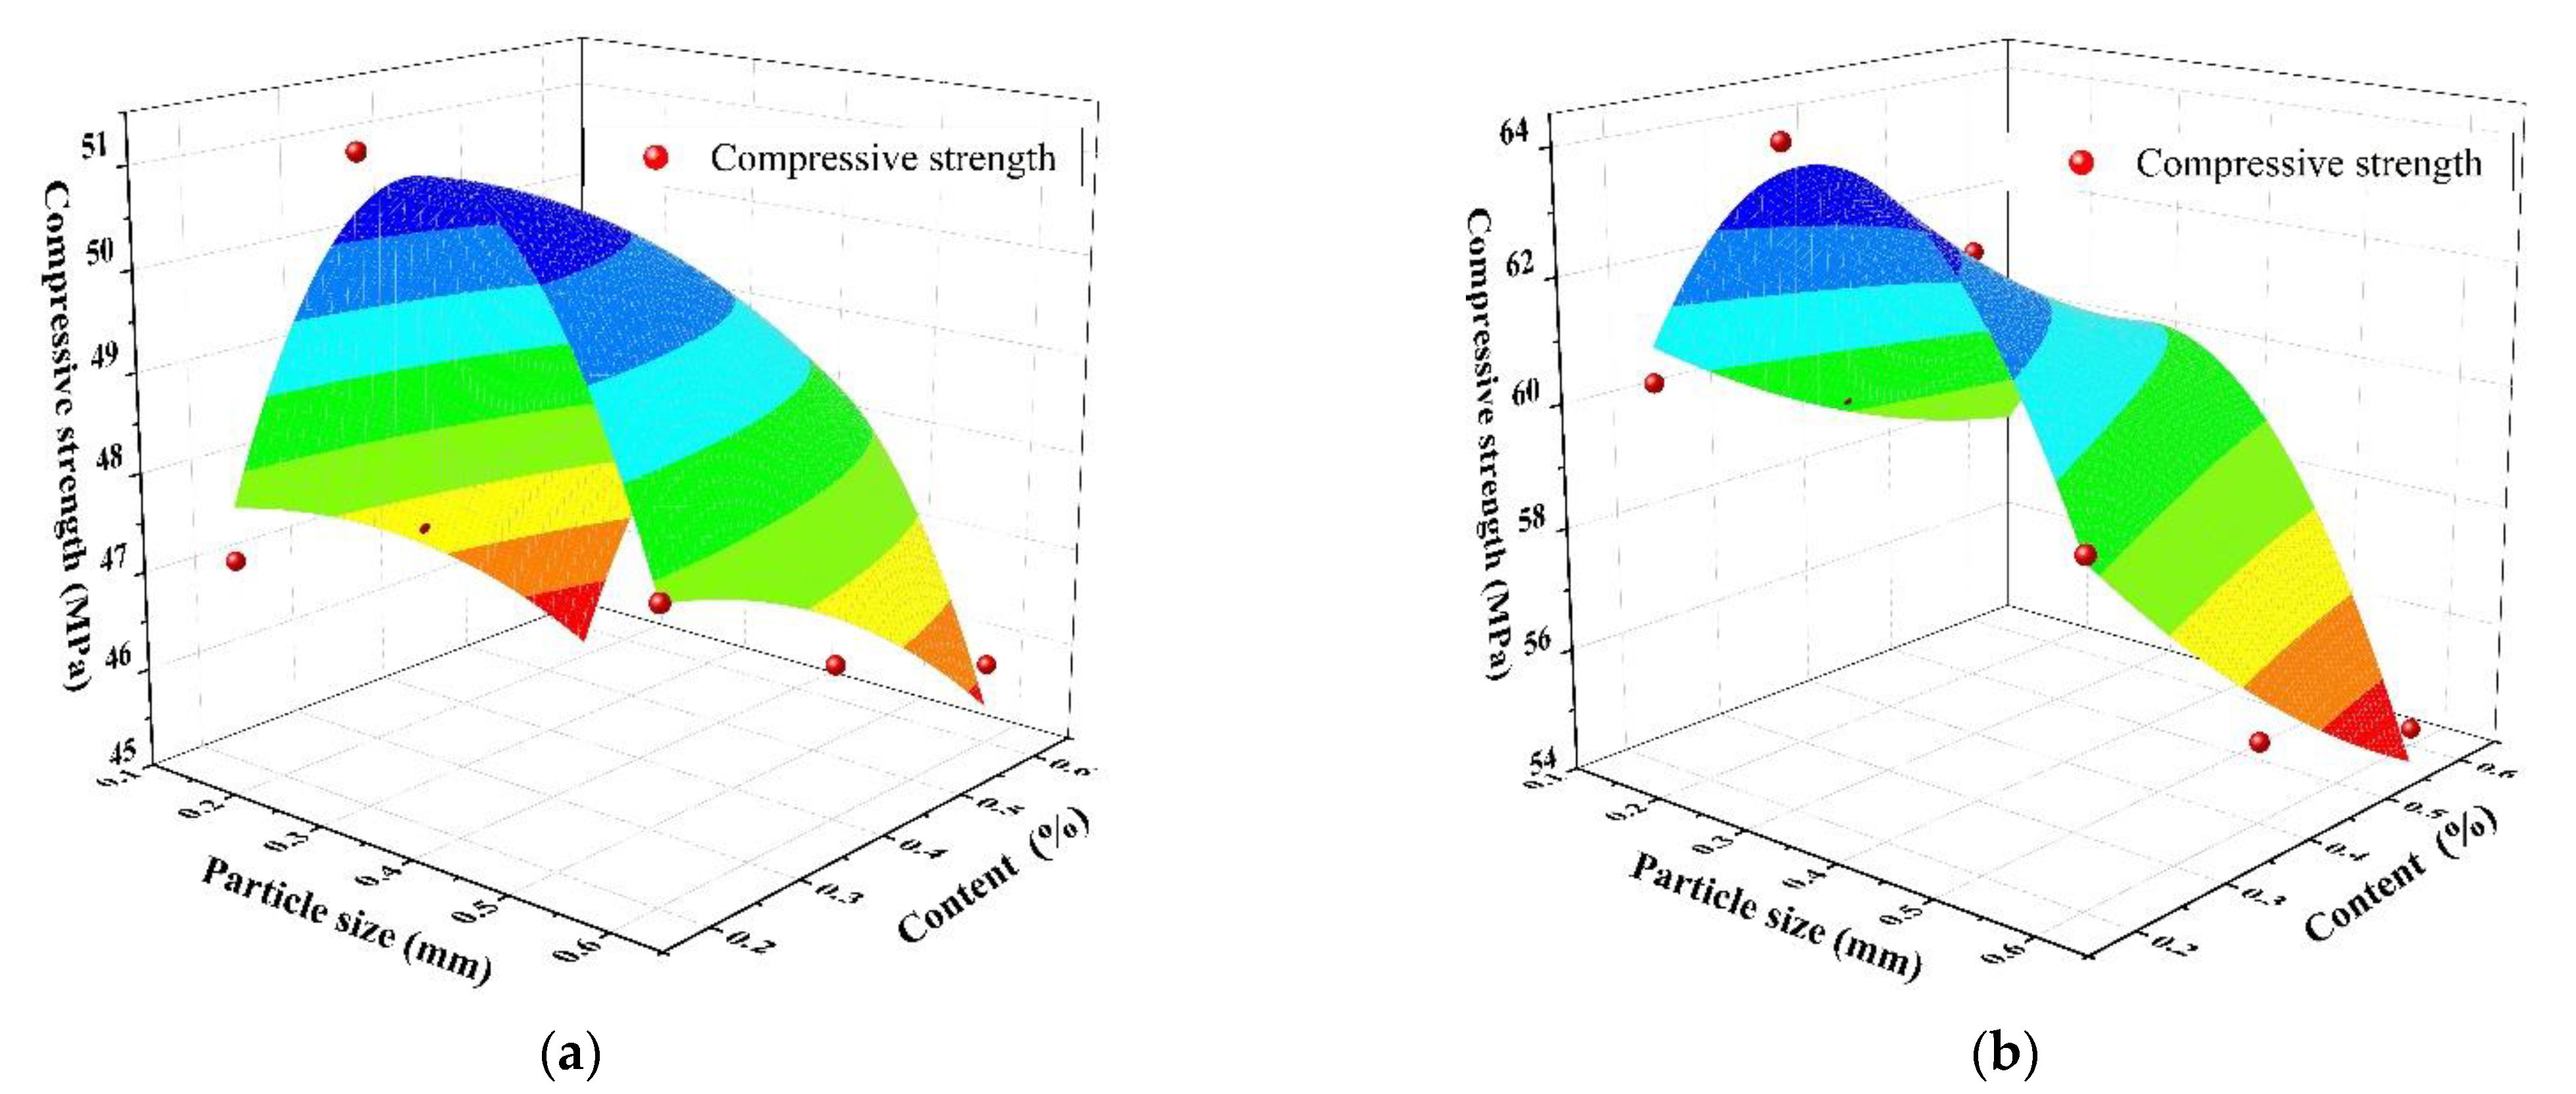
3.1.1. Compressive Strength
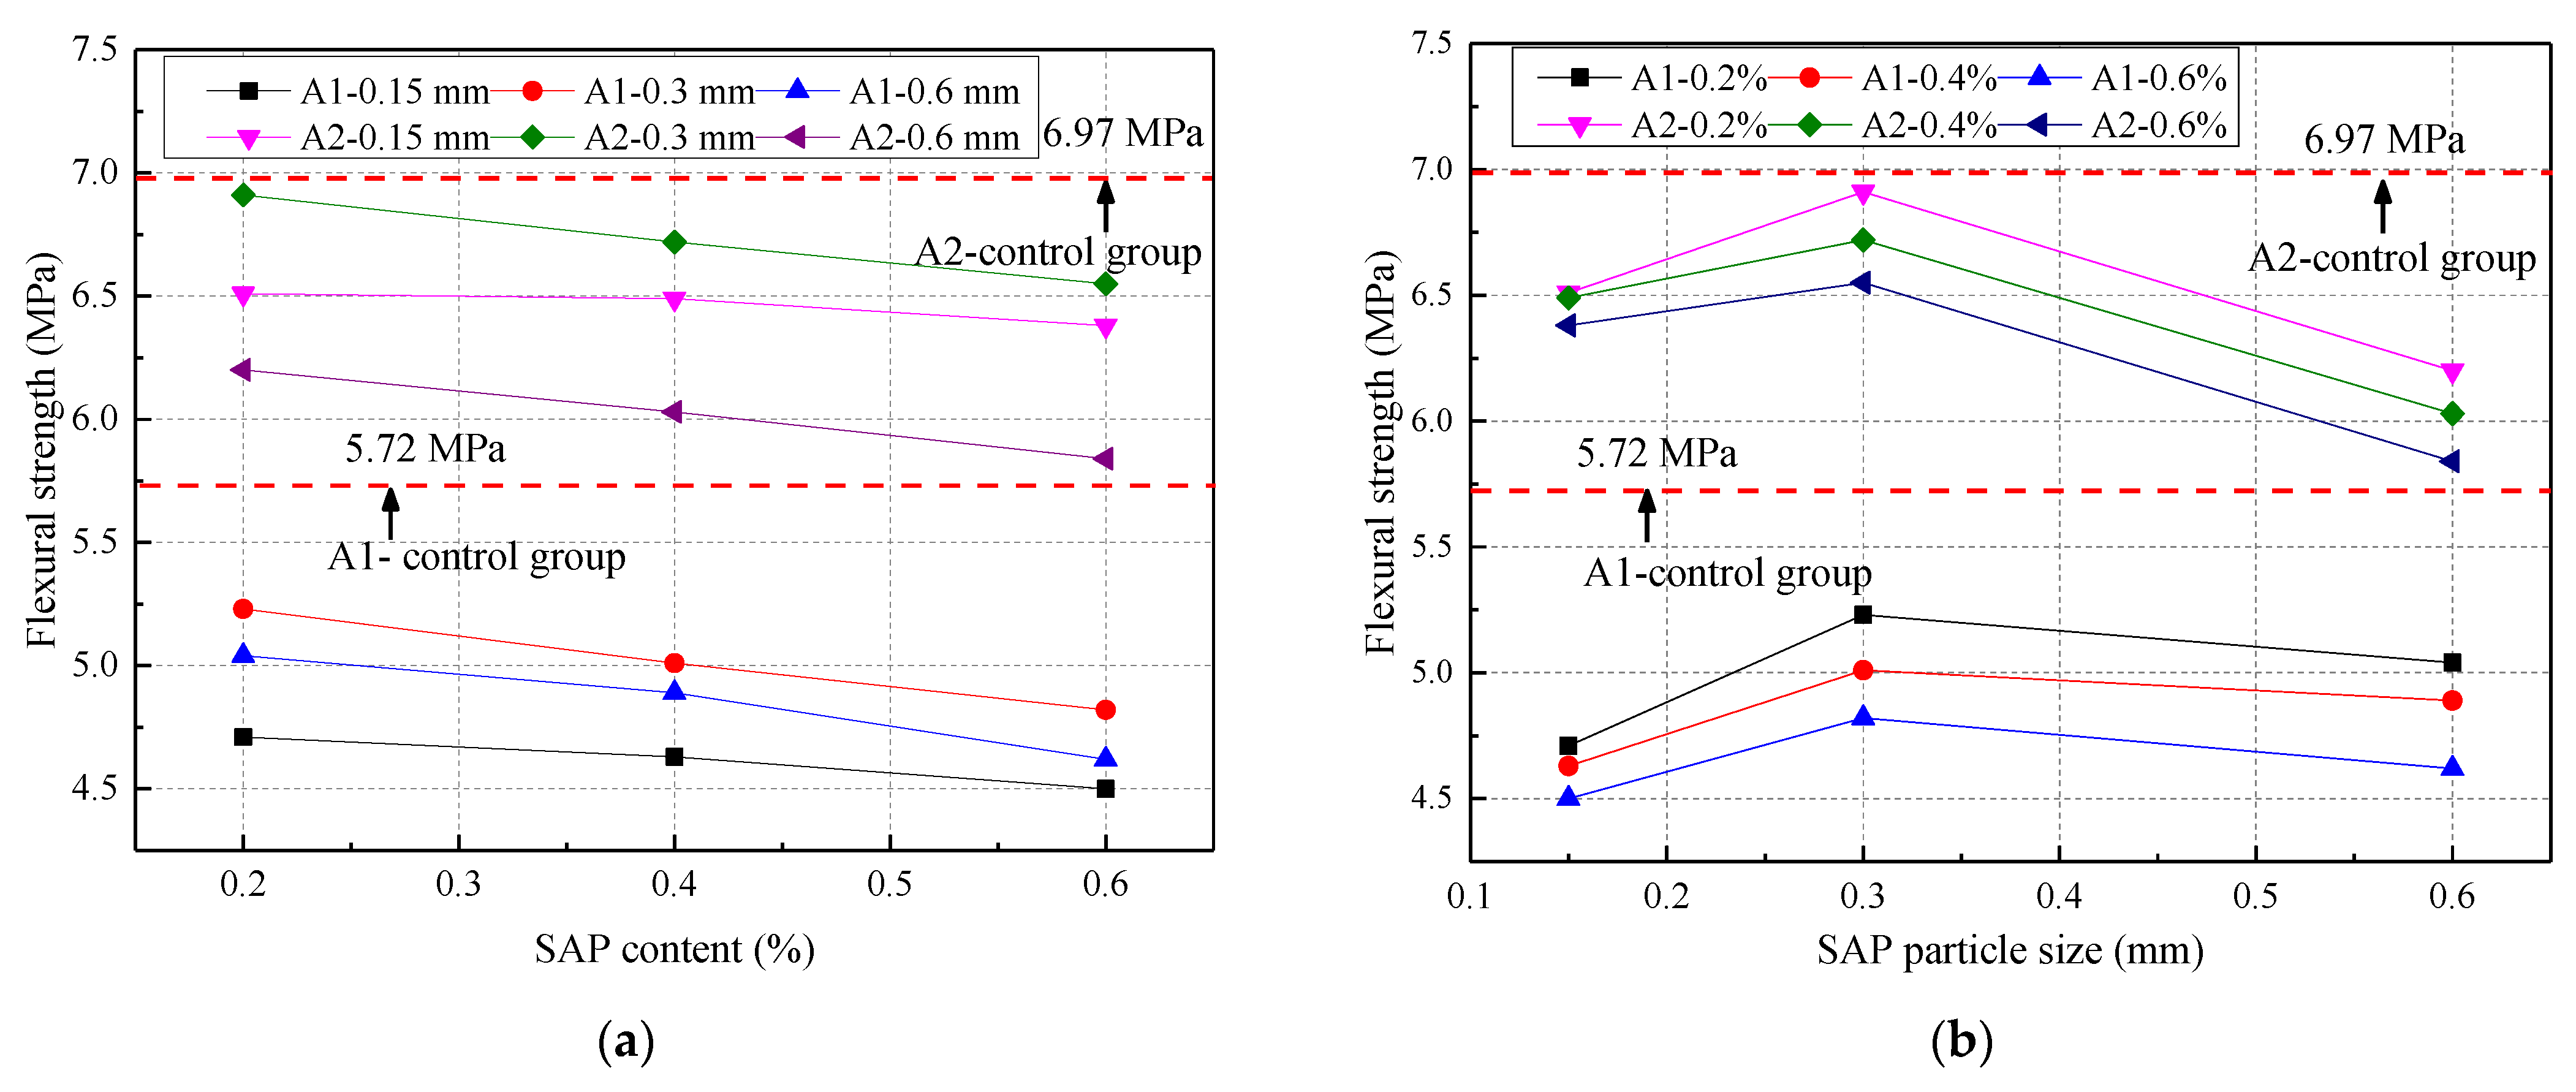
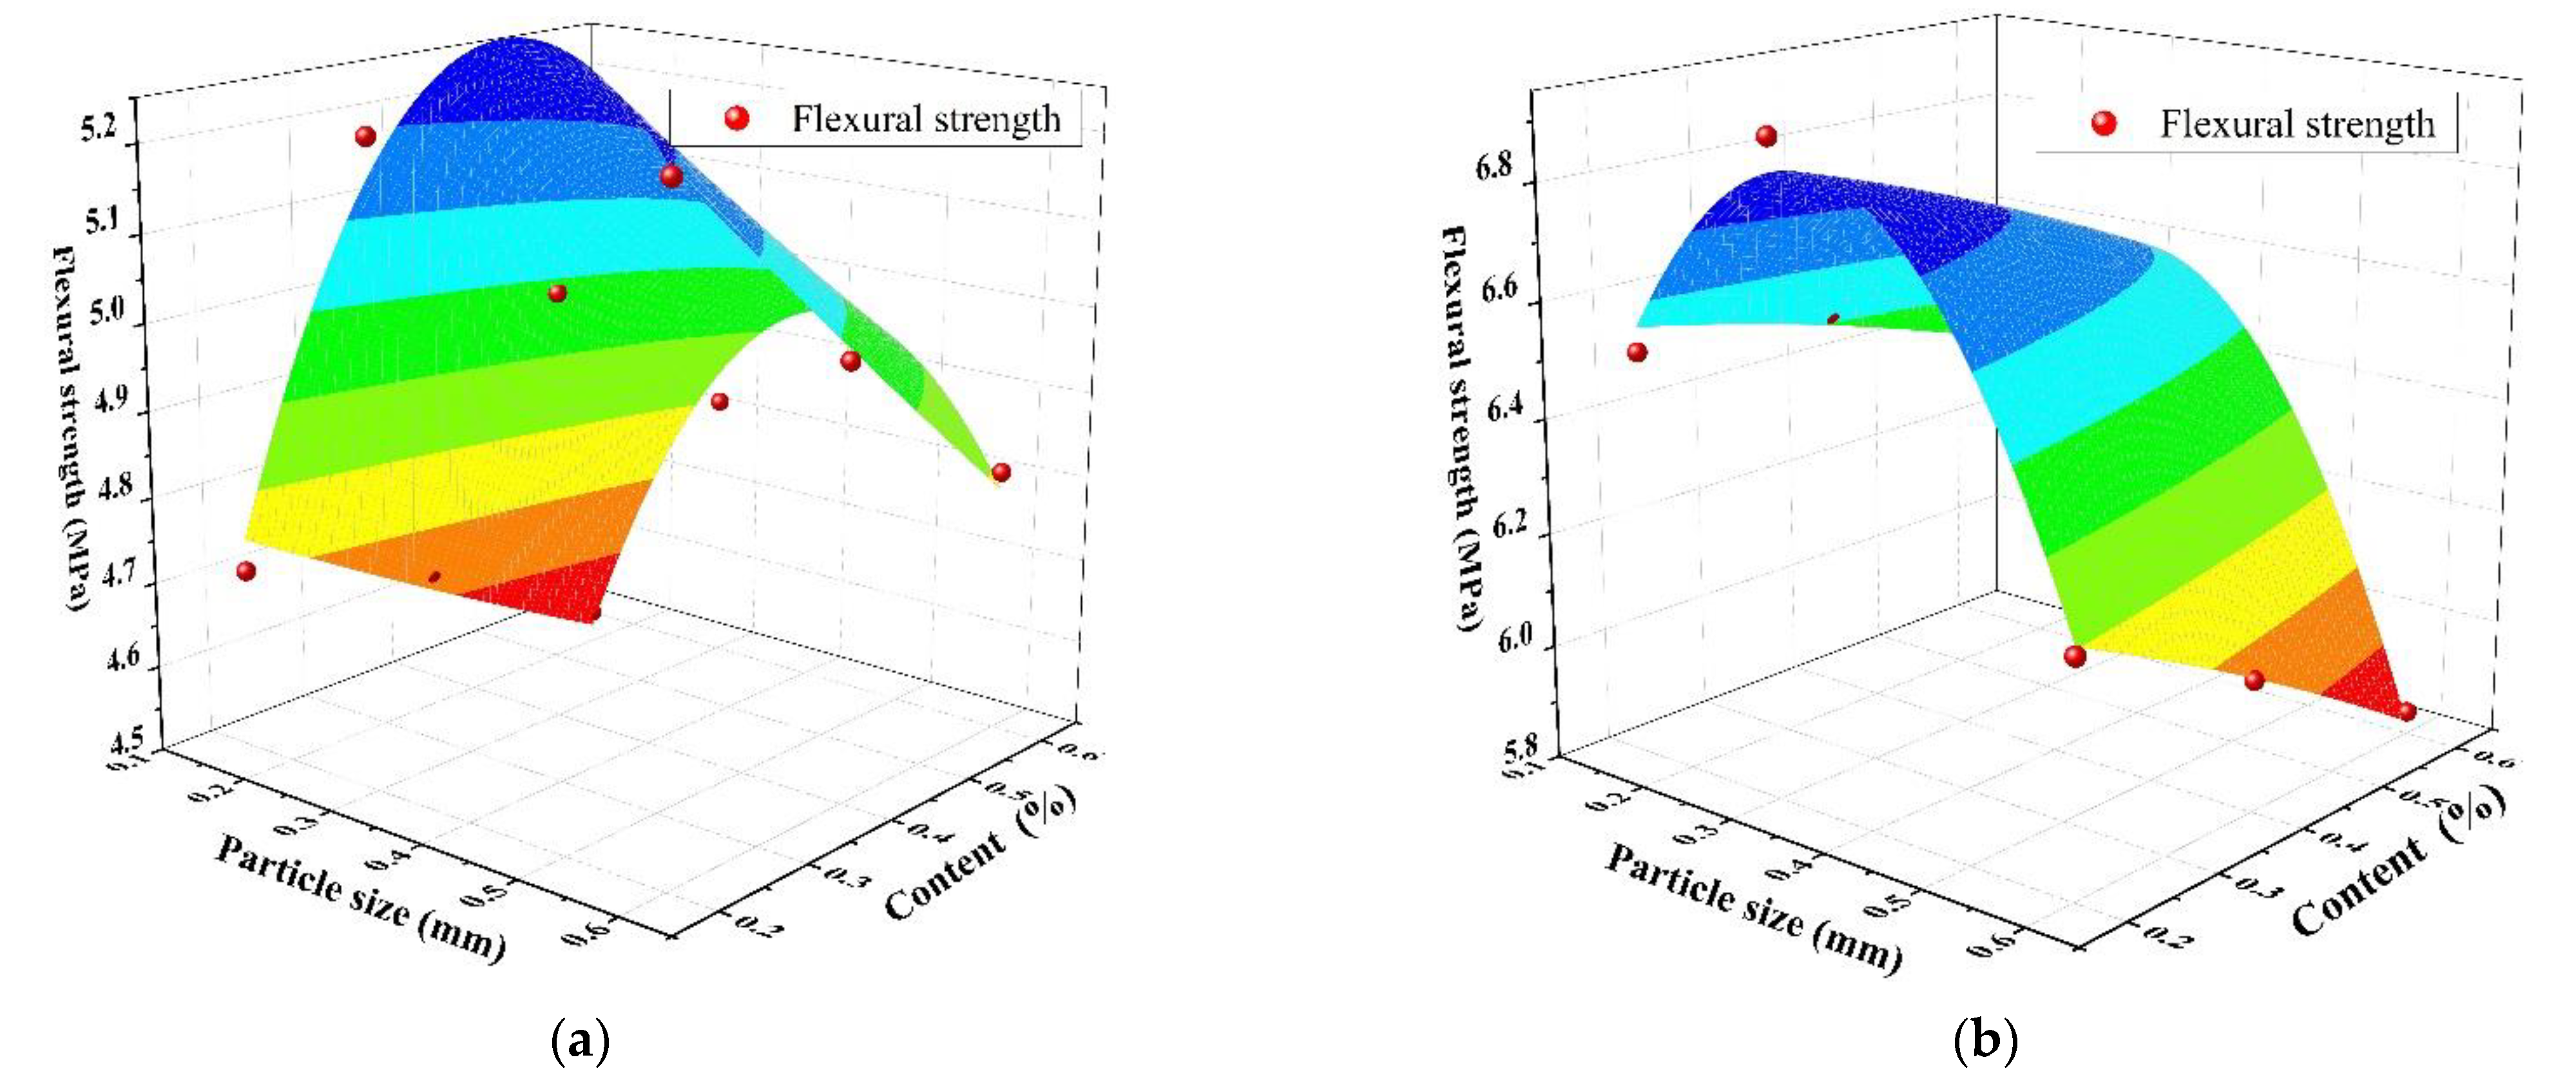
3.1.2. Flexural Strength
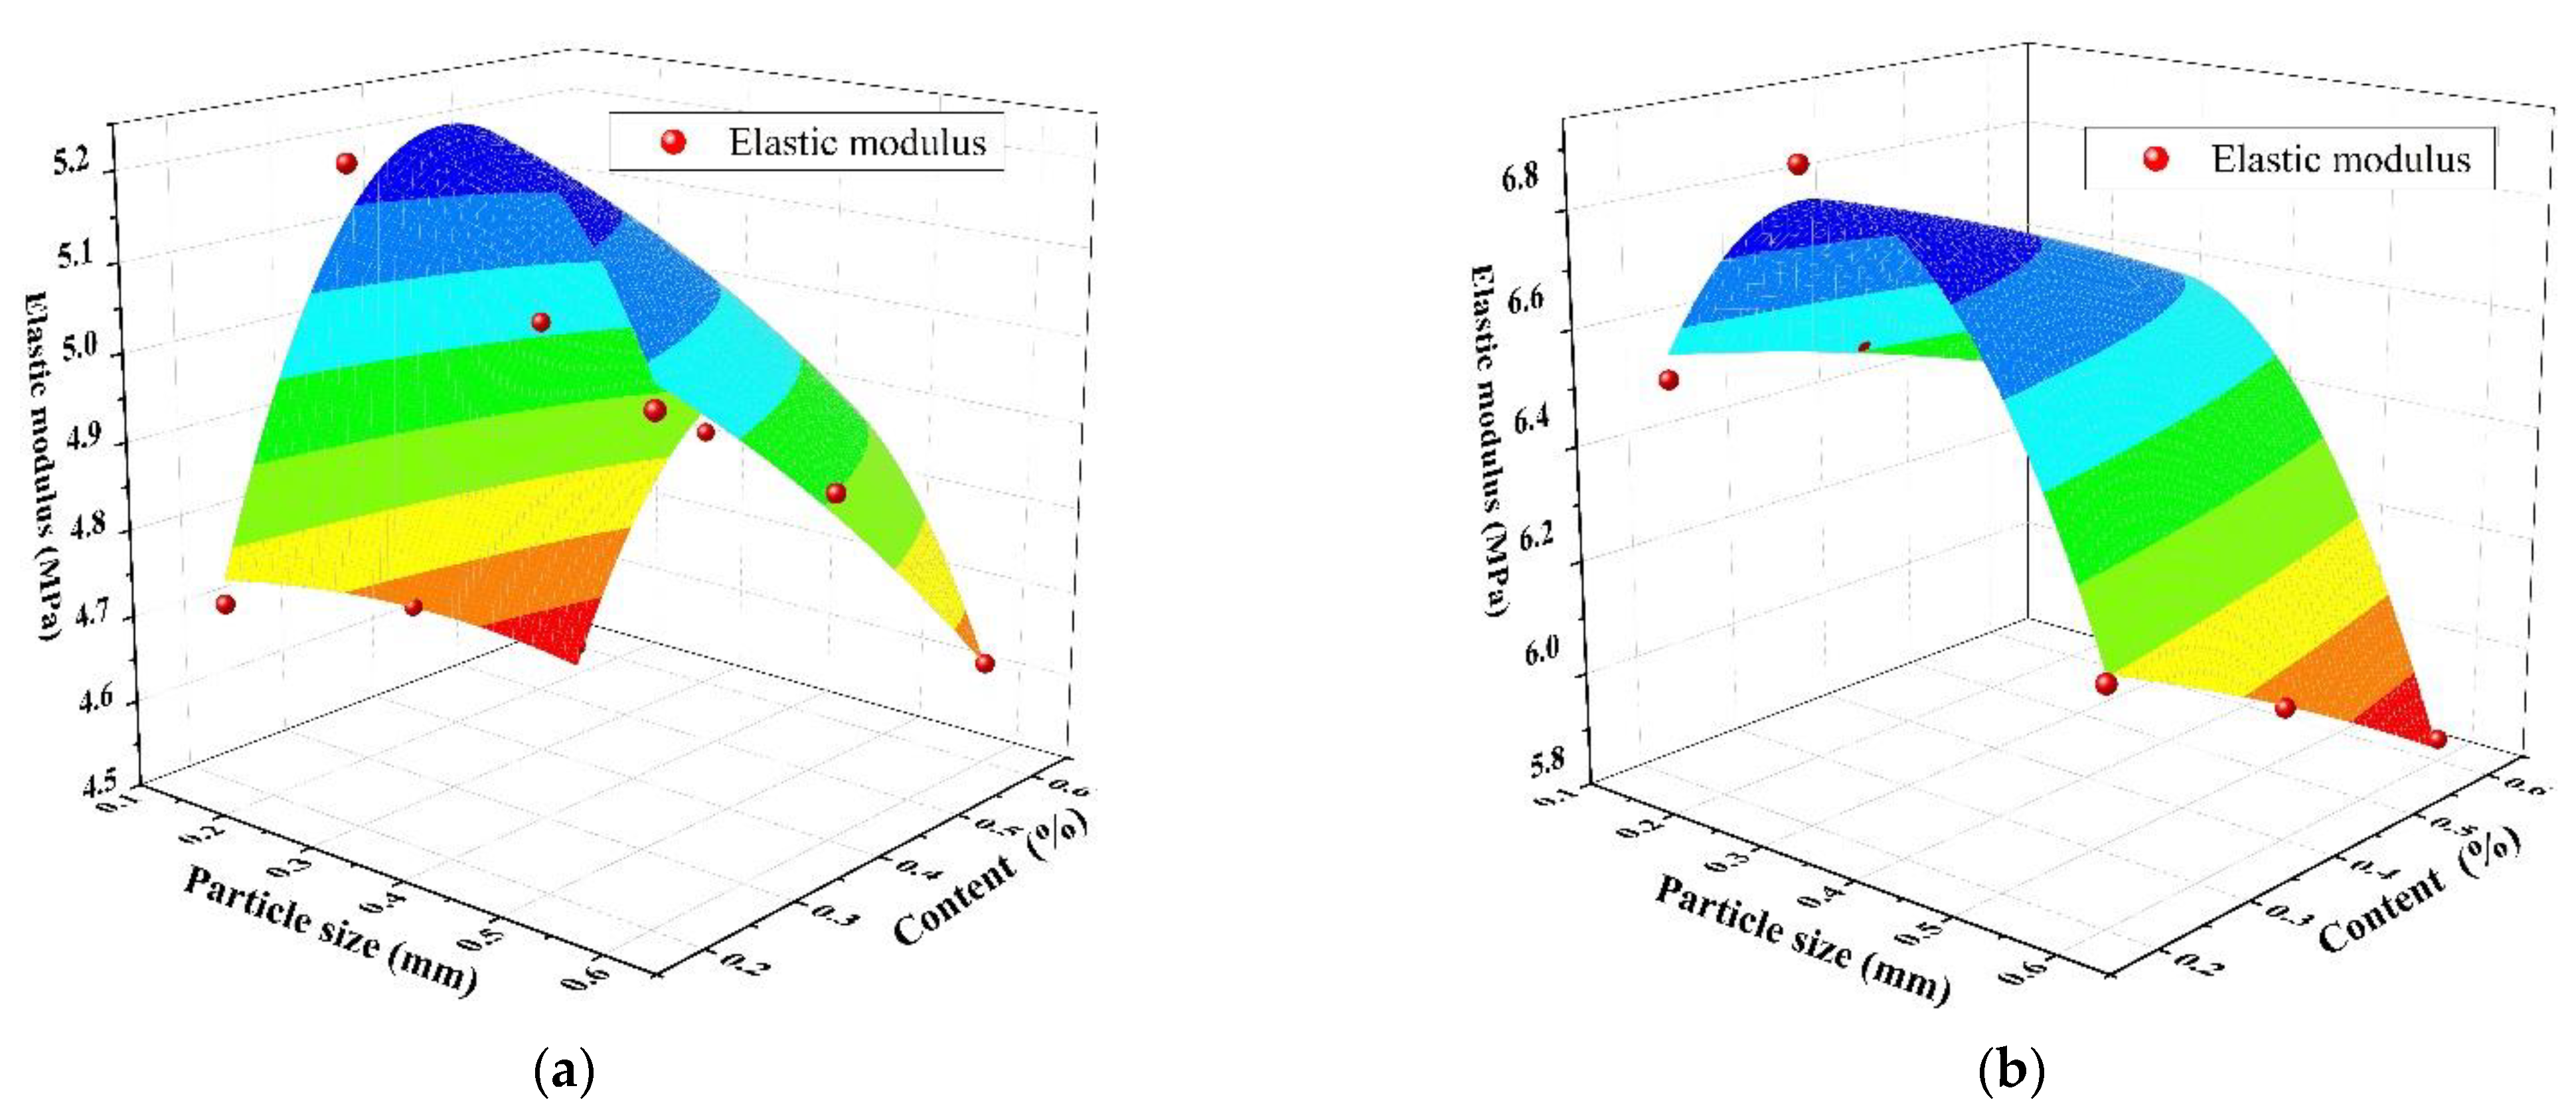
3.1.3. Elastic Modulus
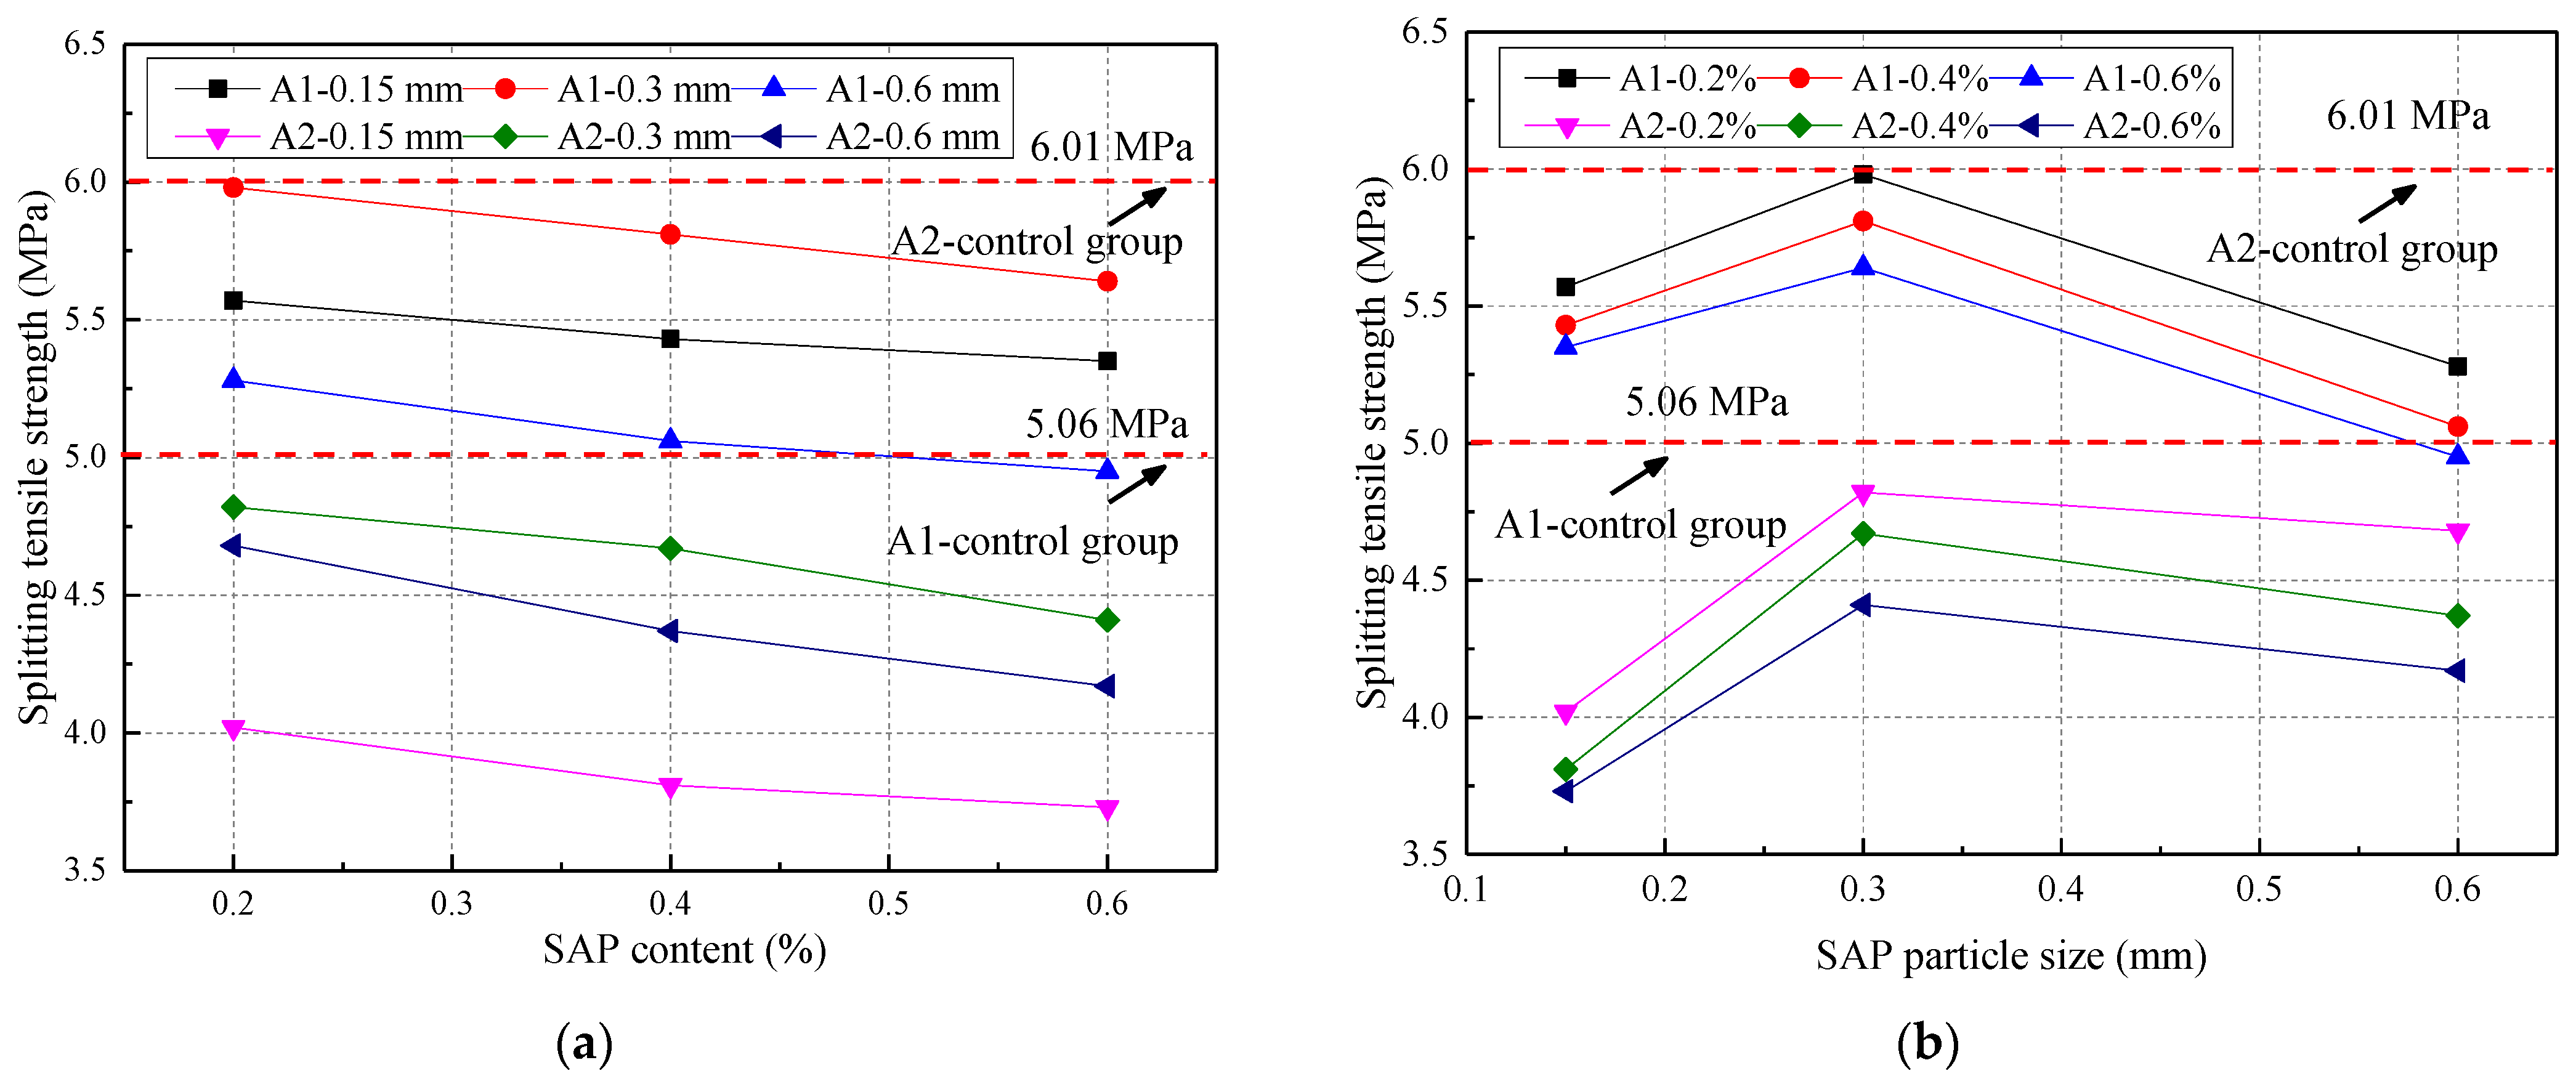
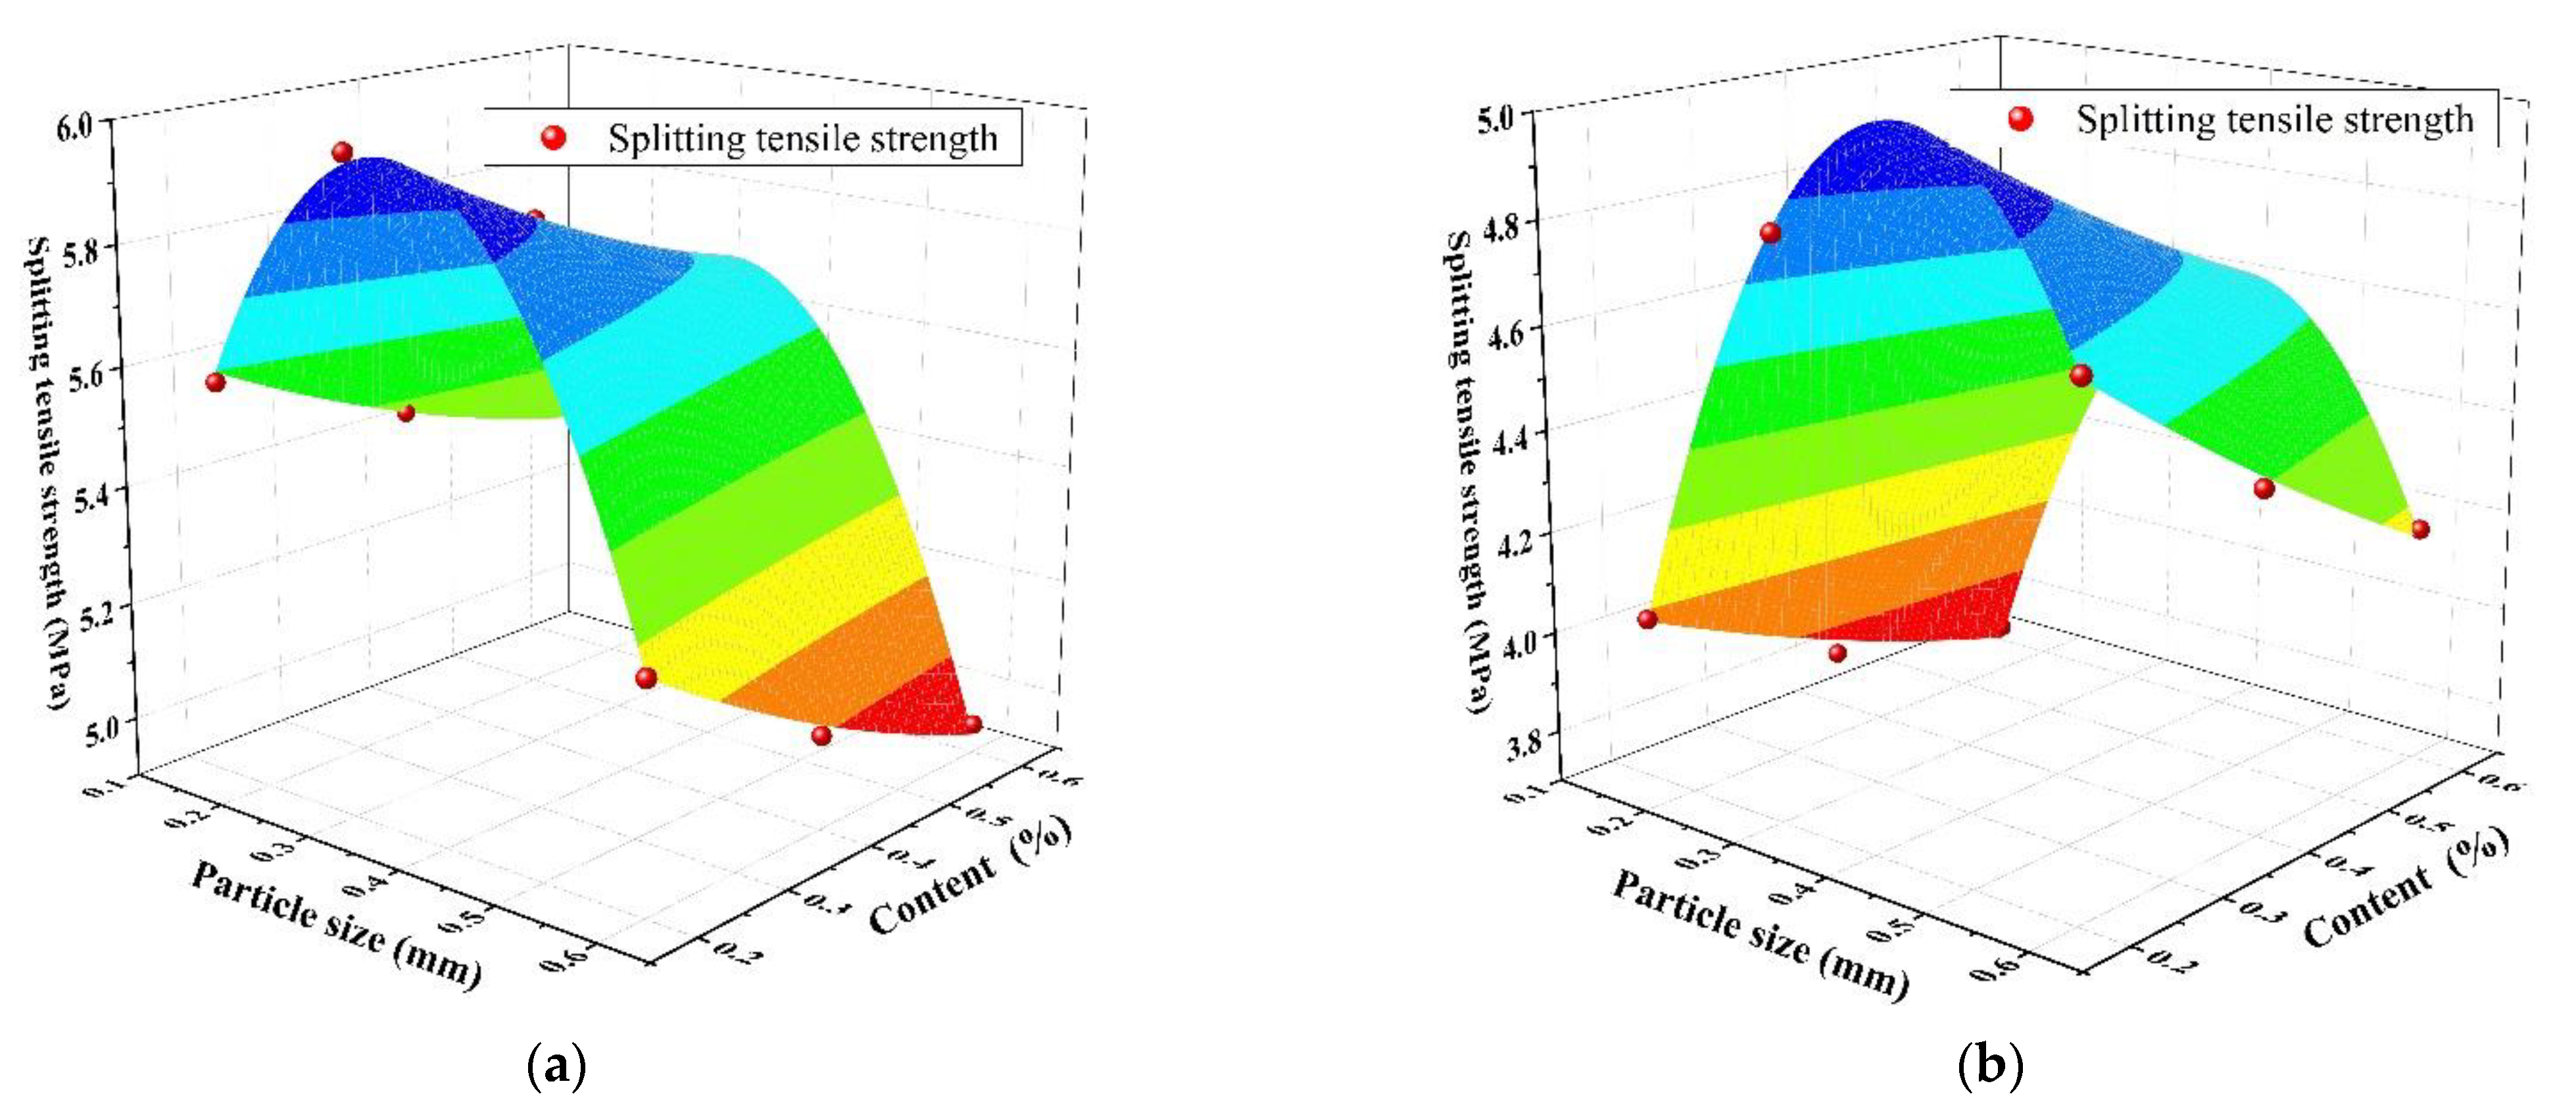
3.1.4. Splitting Tensile Strength
3.2. Volume Stability
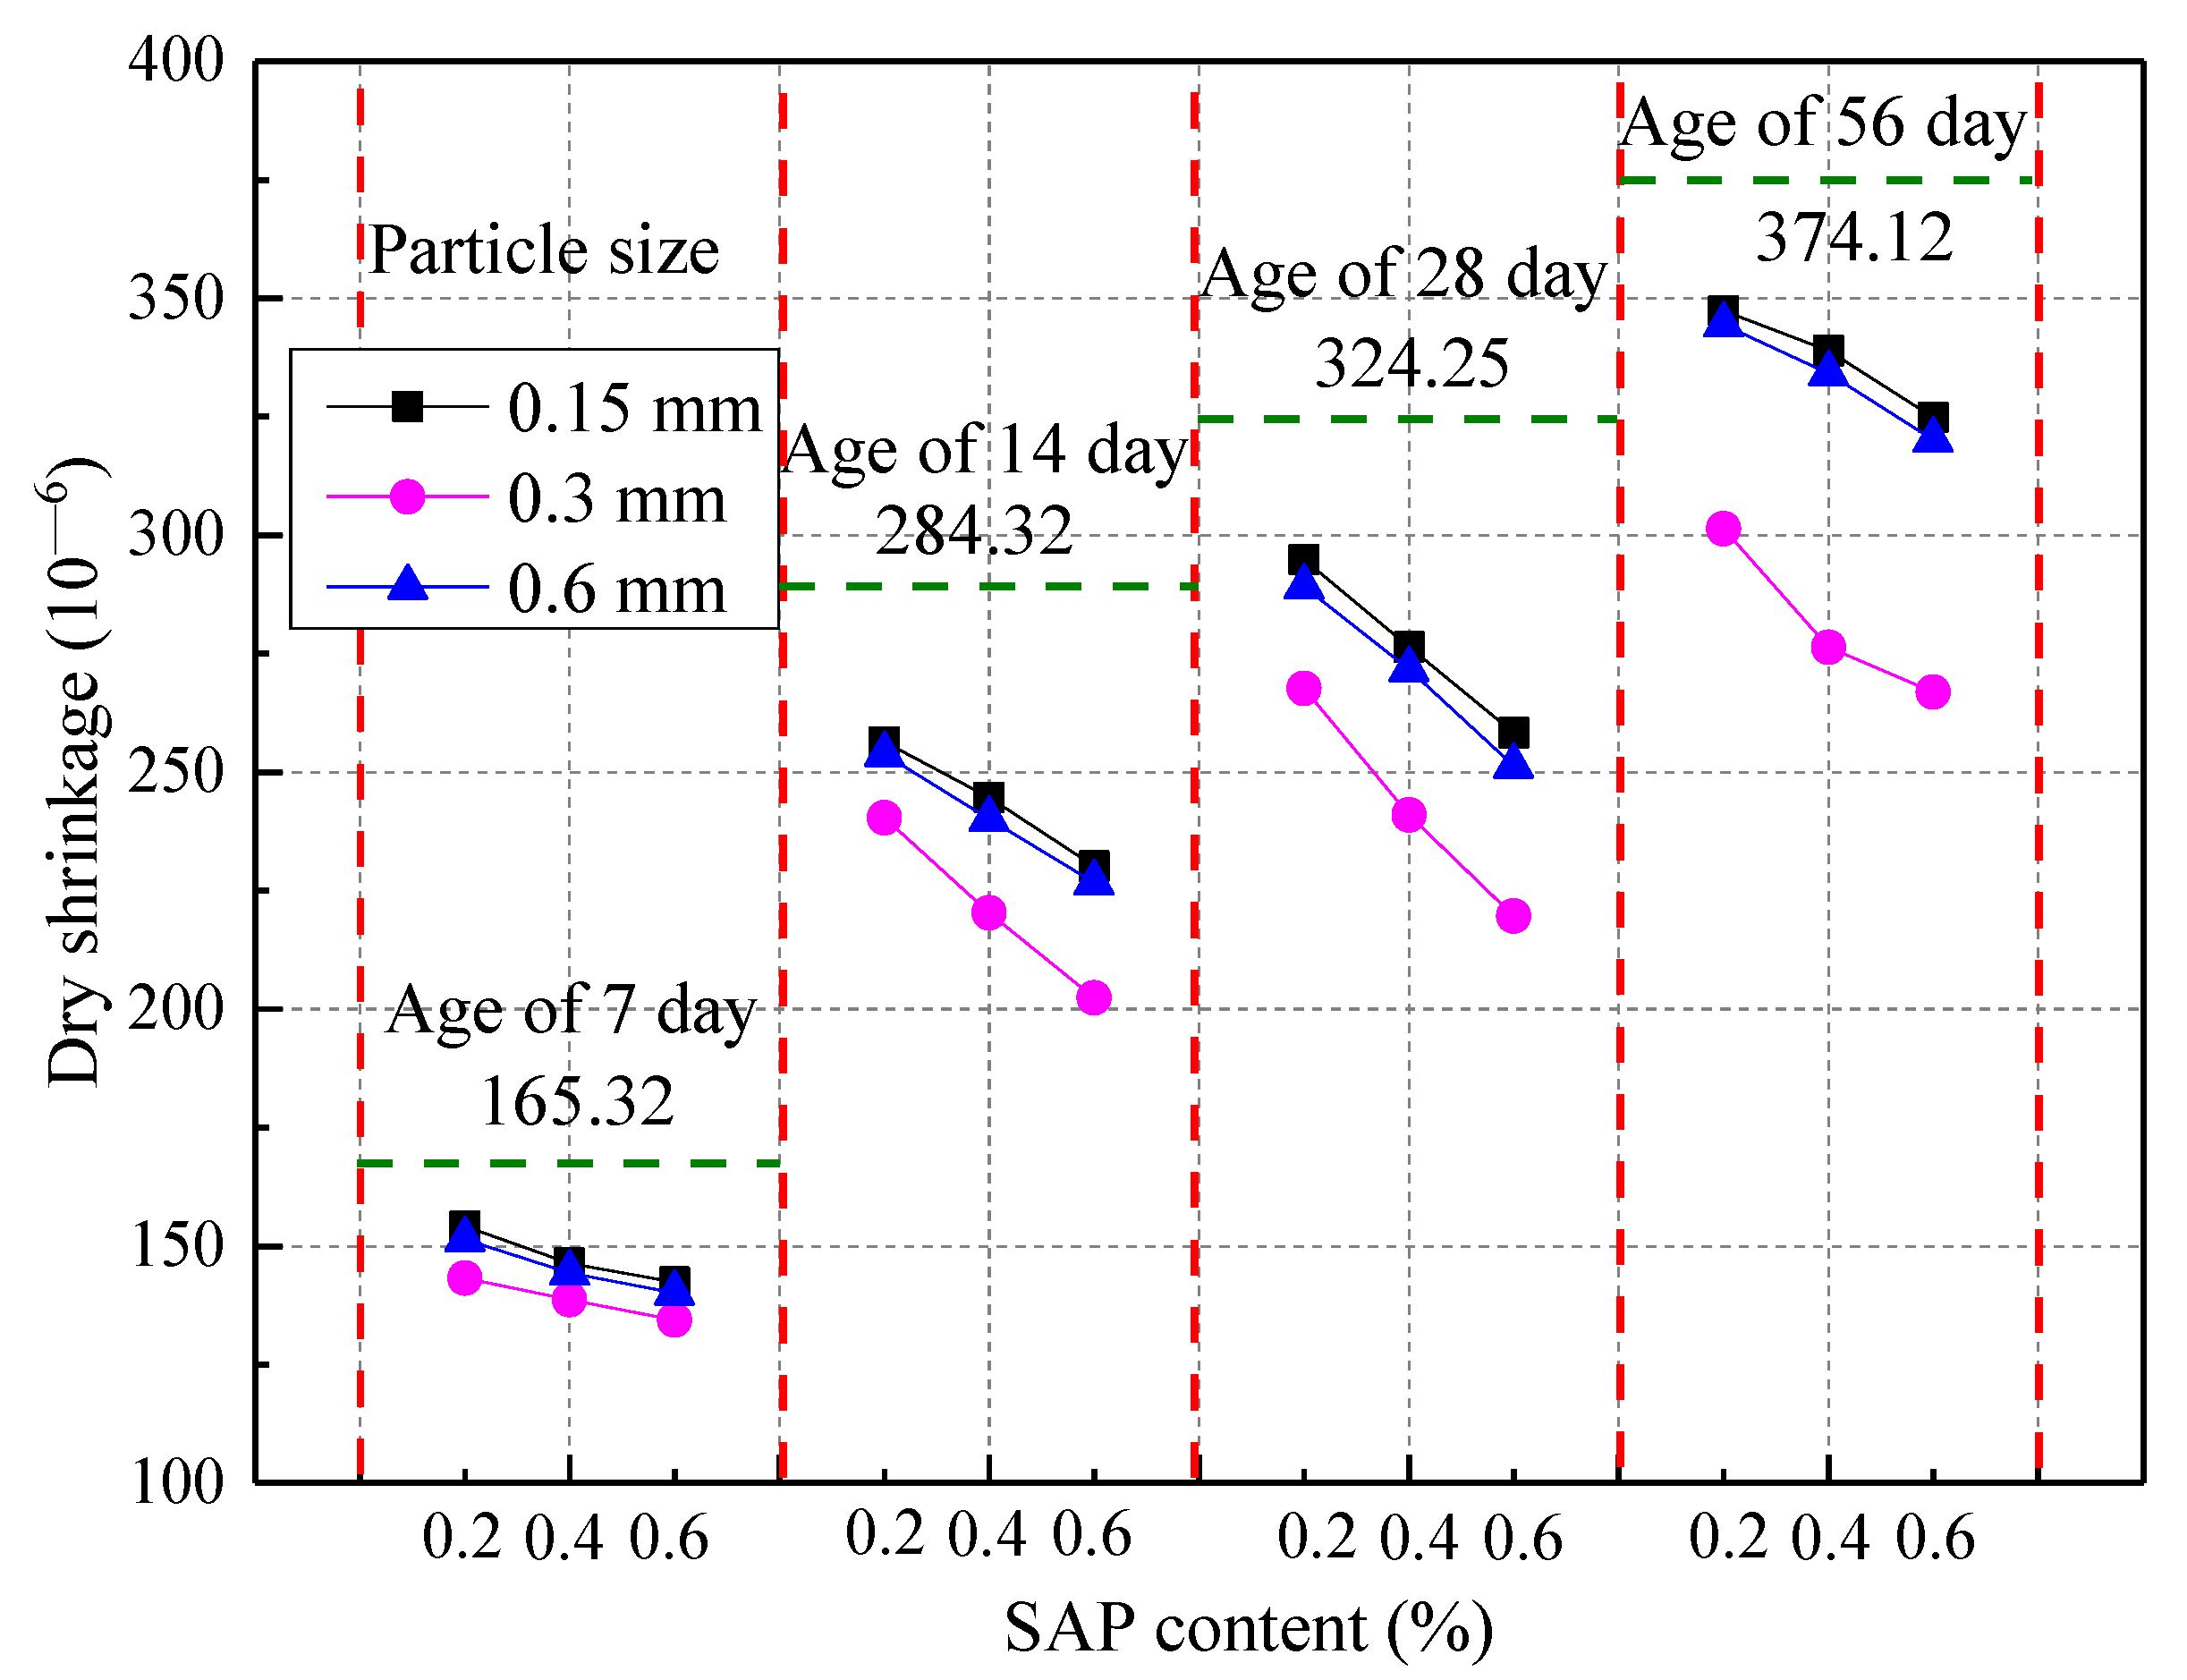
3.2.1. Drying Shrinkage
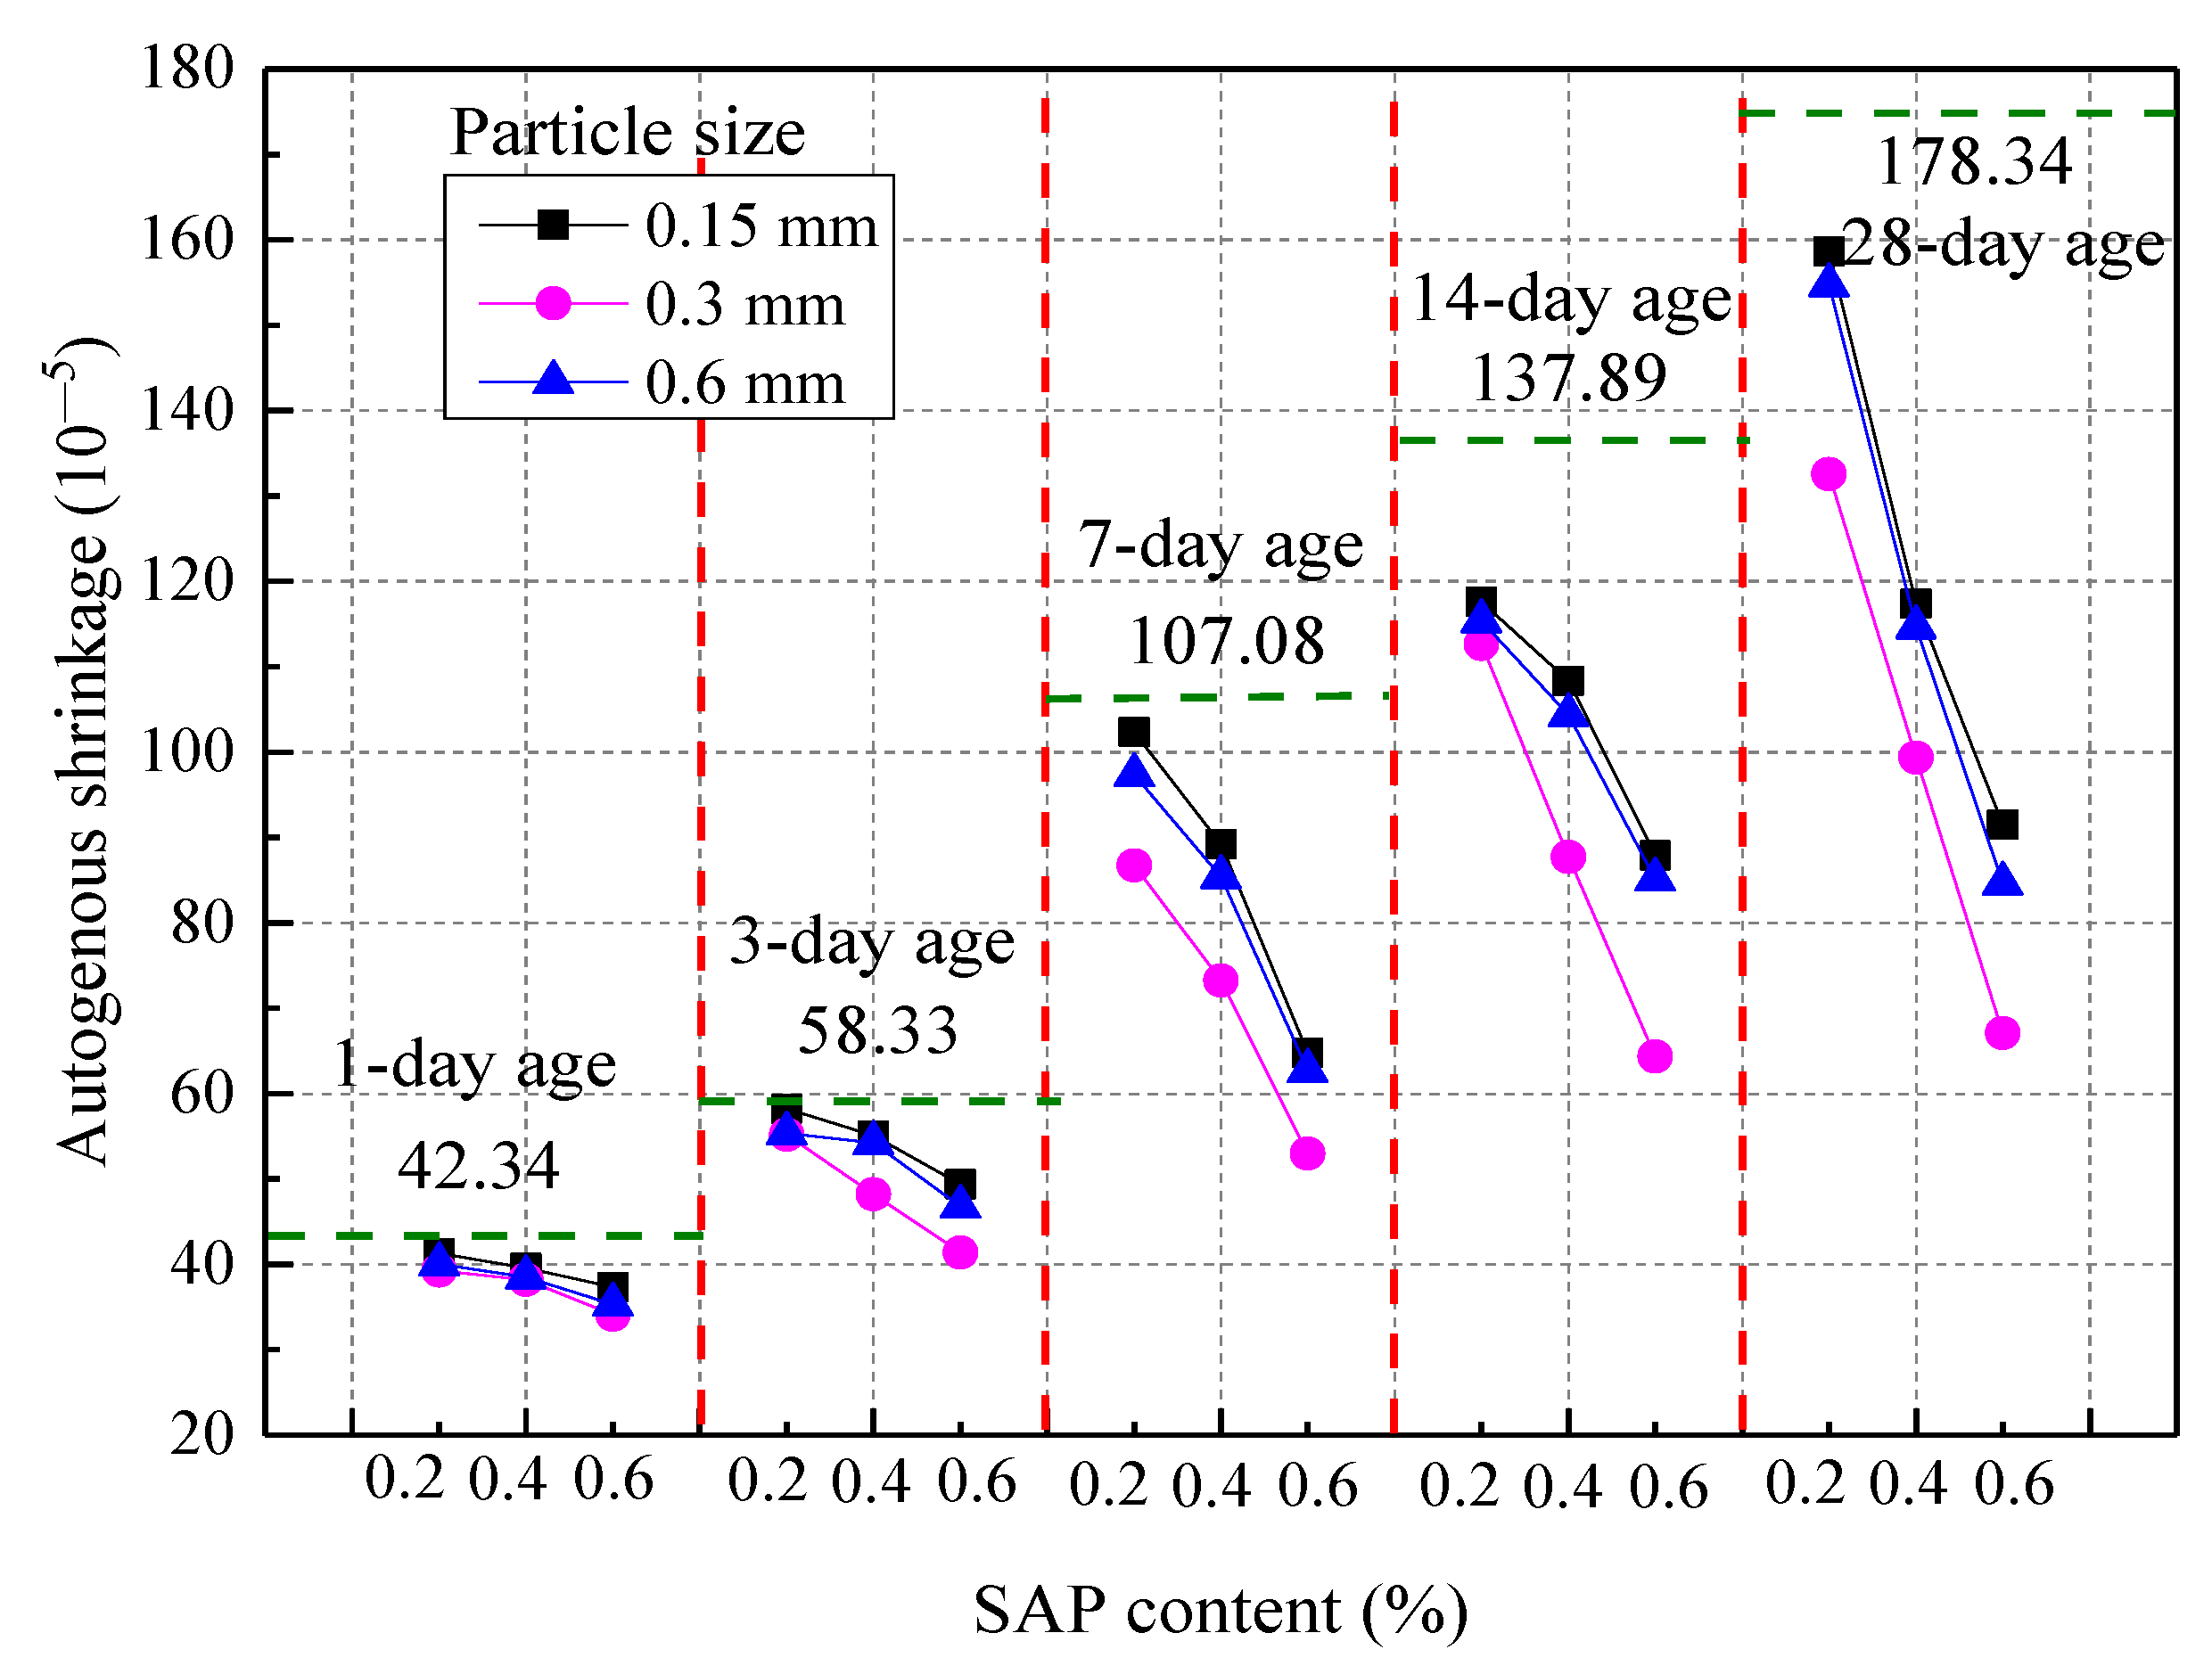
3.2.2. Autogenous Shrinkage
3.3. Durability
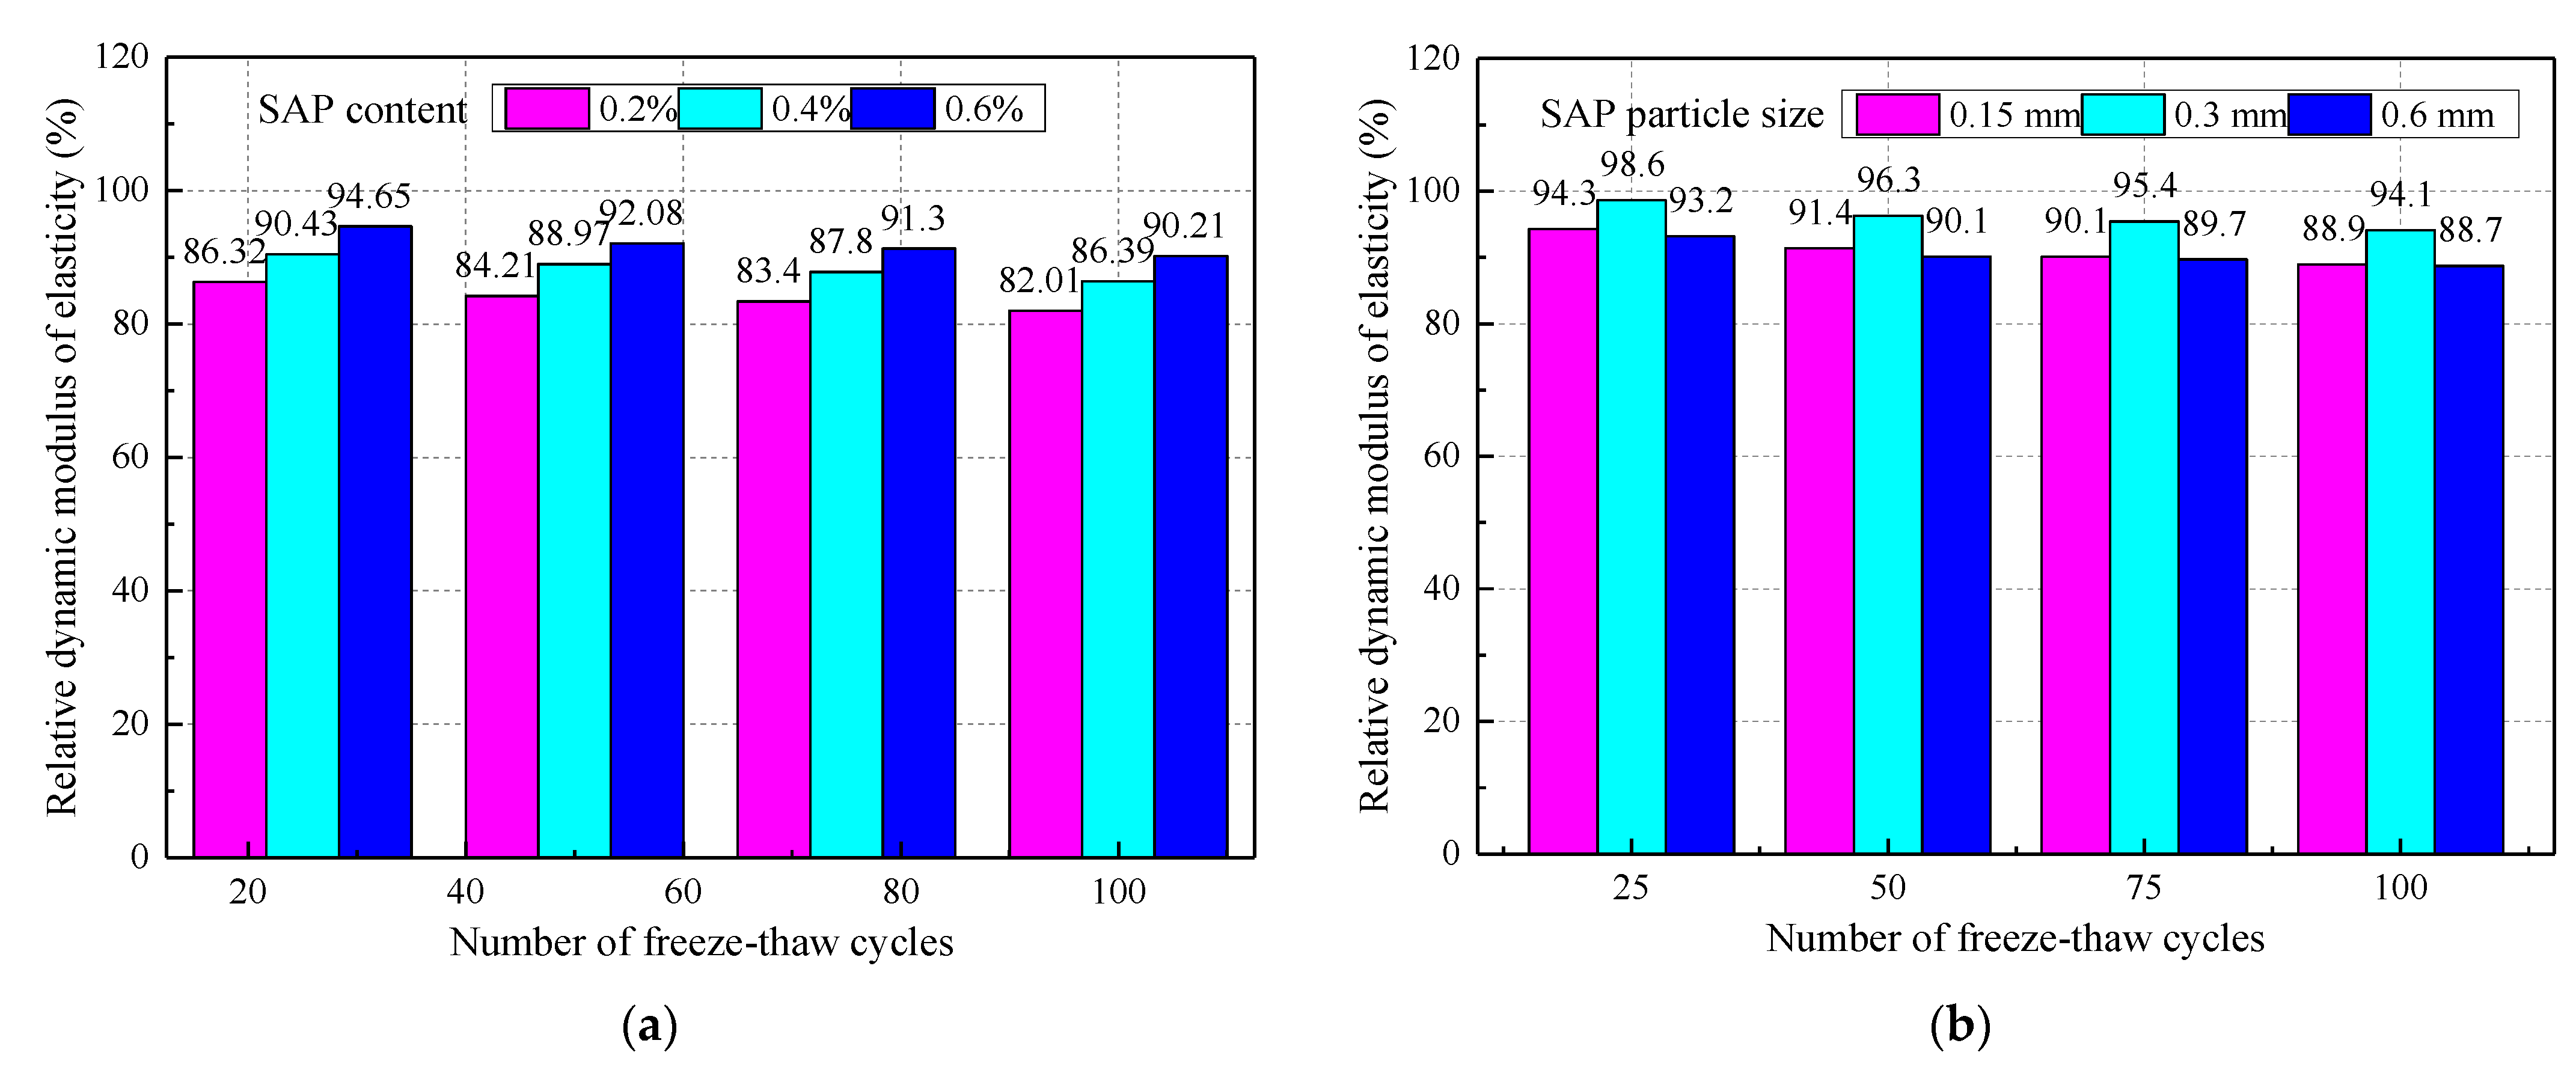
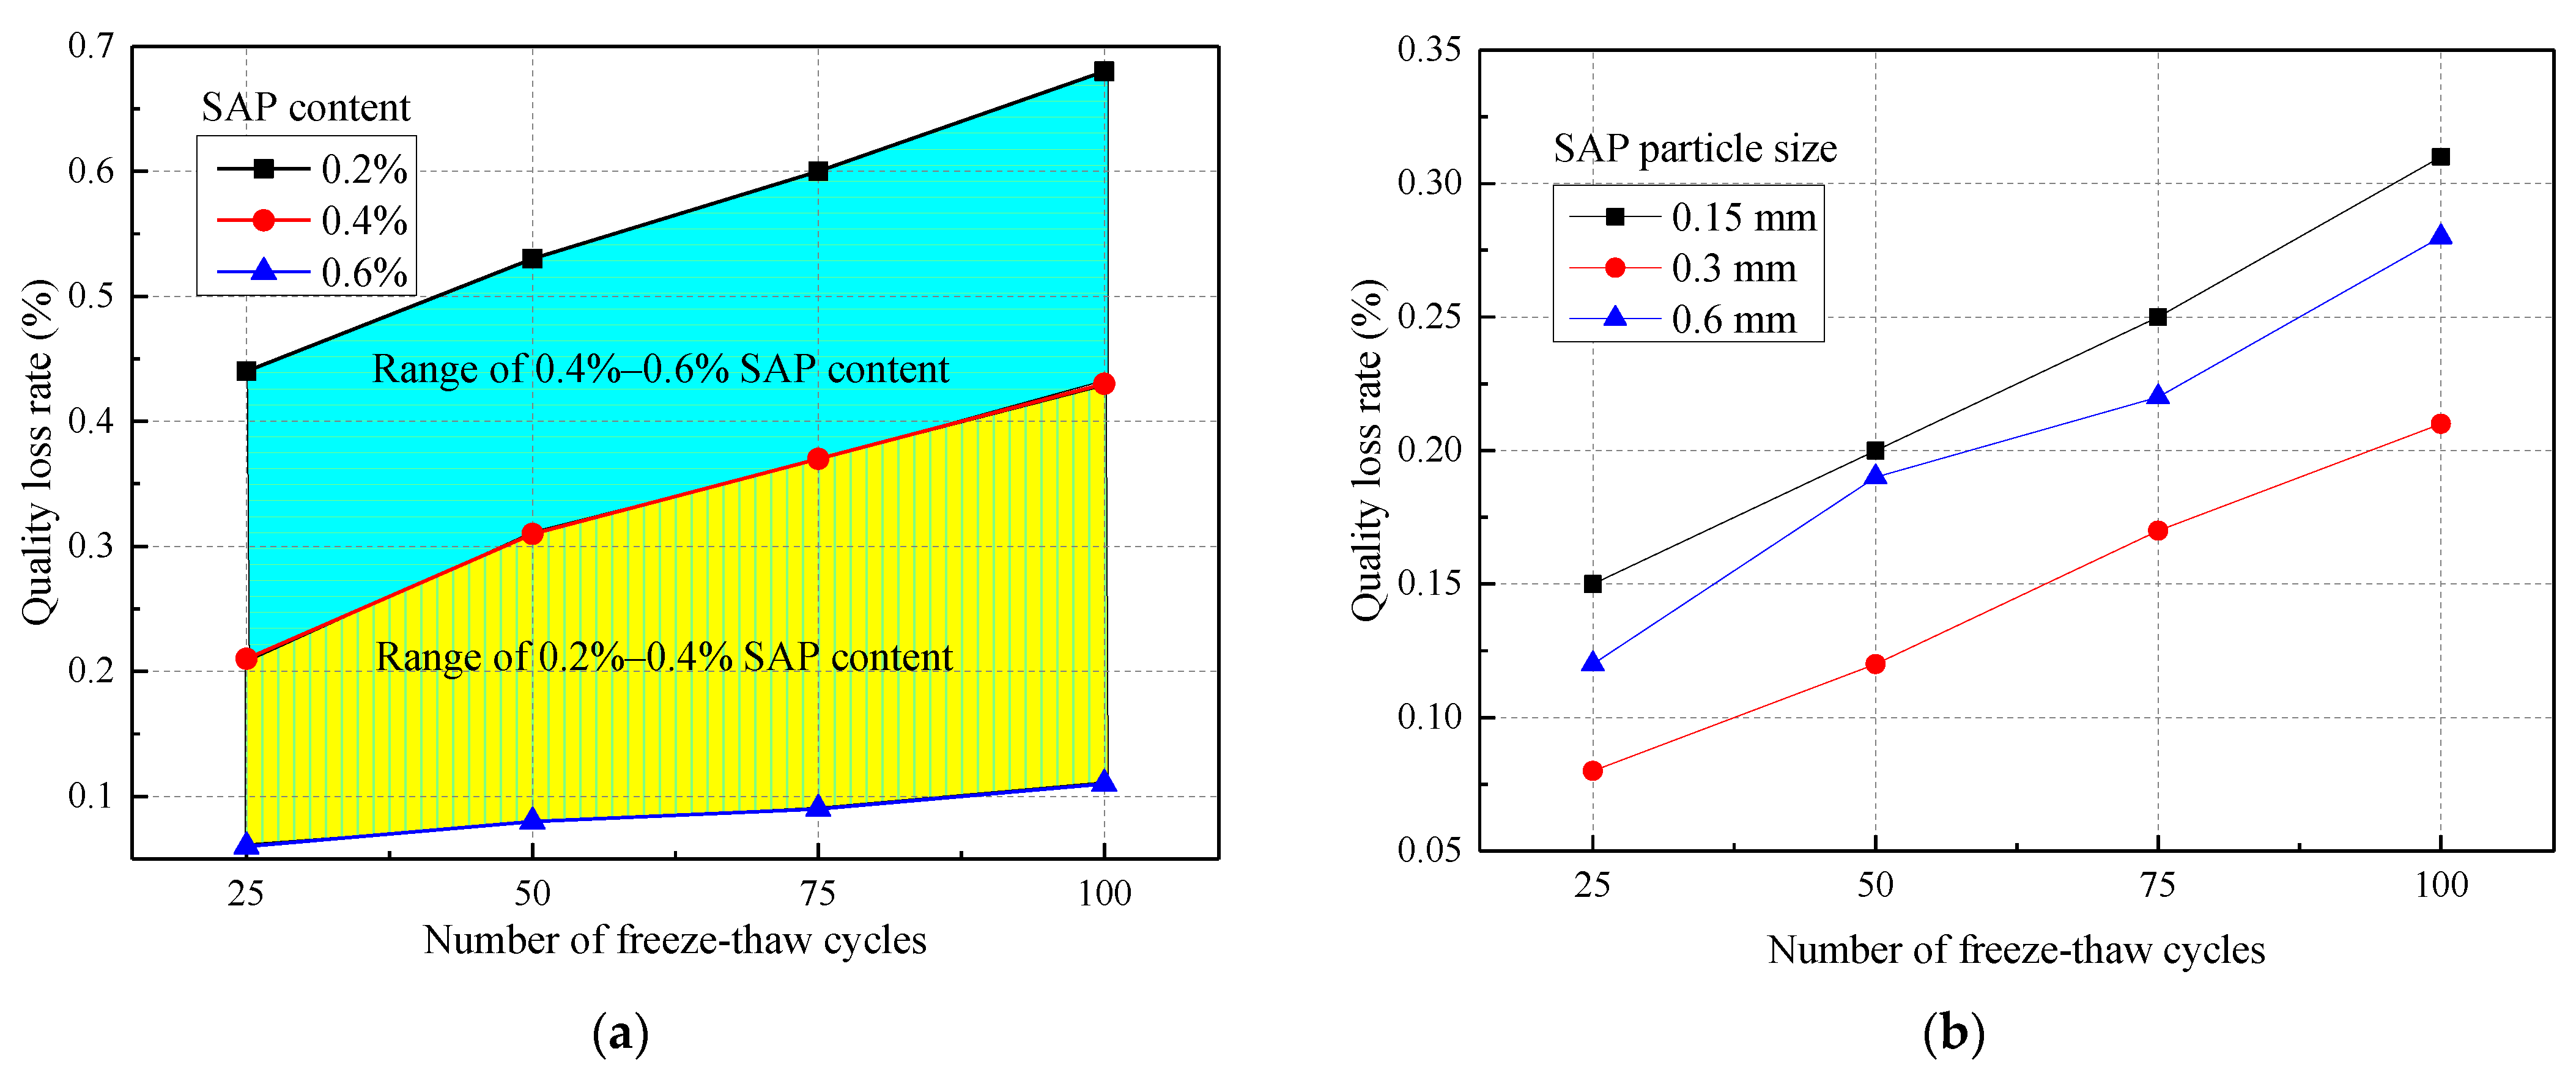
3.3.1. Frost Resistance
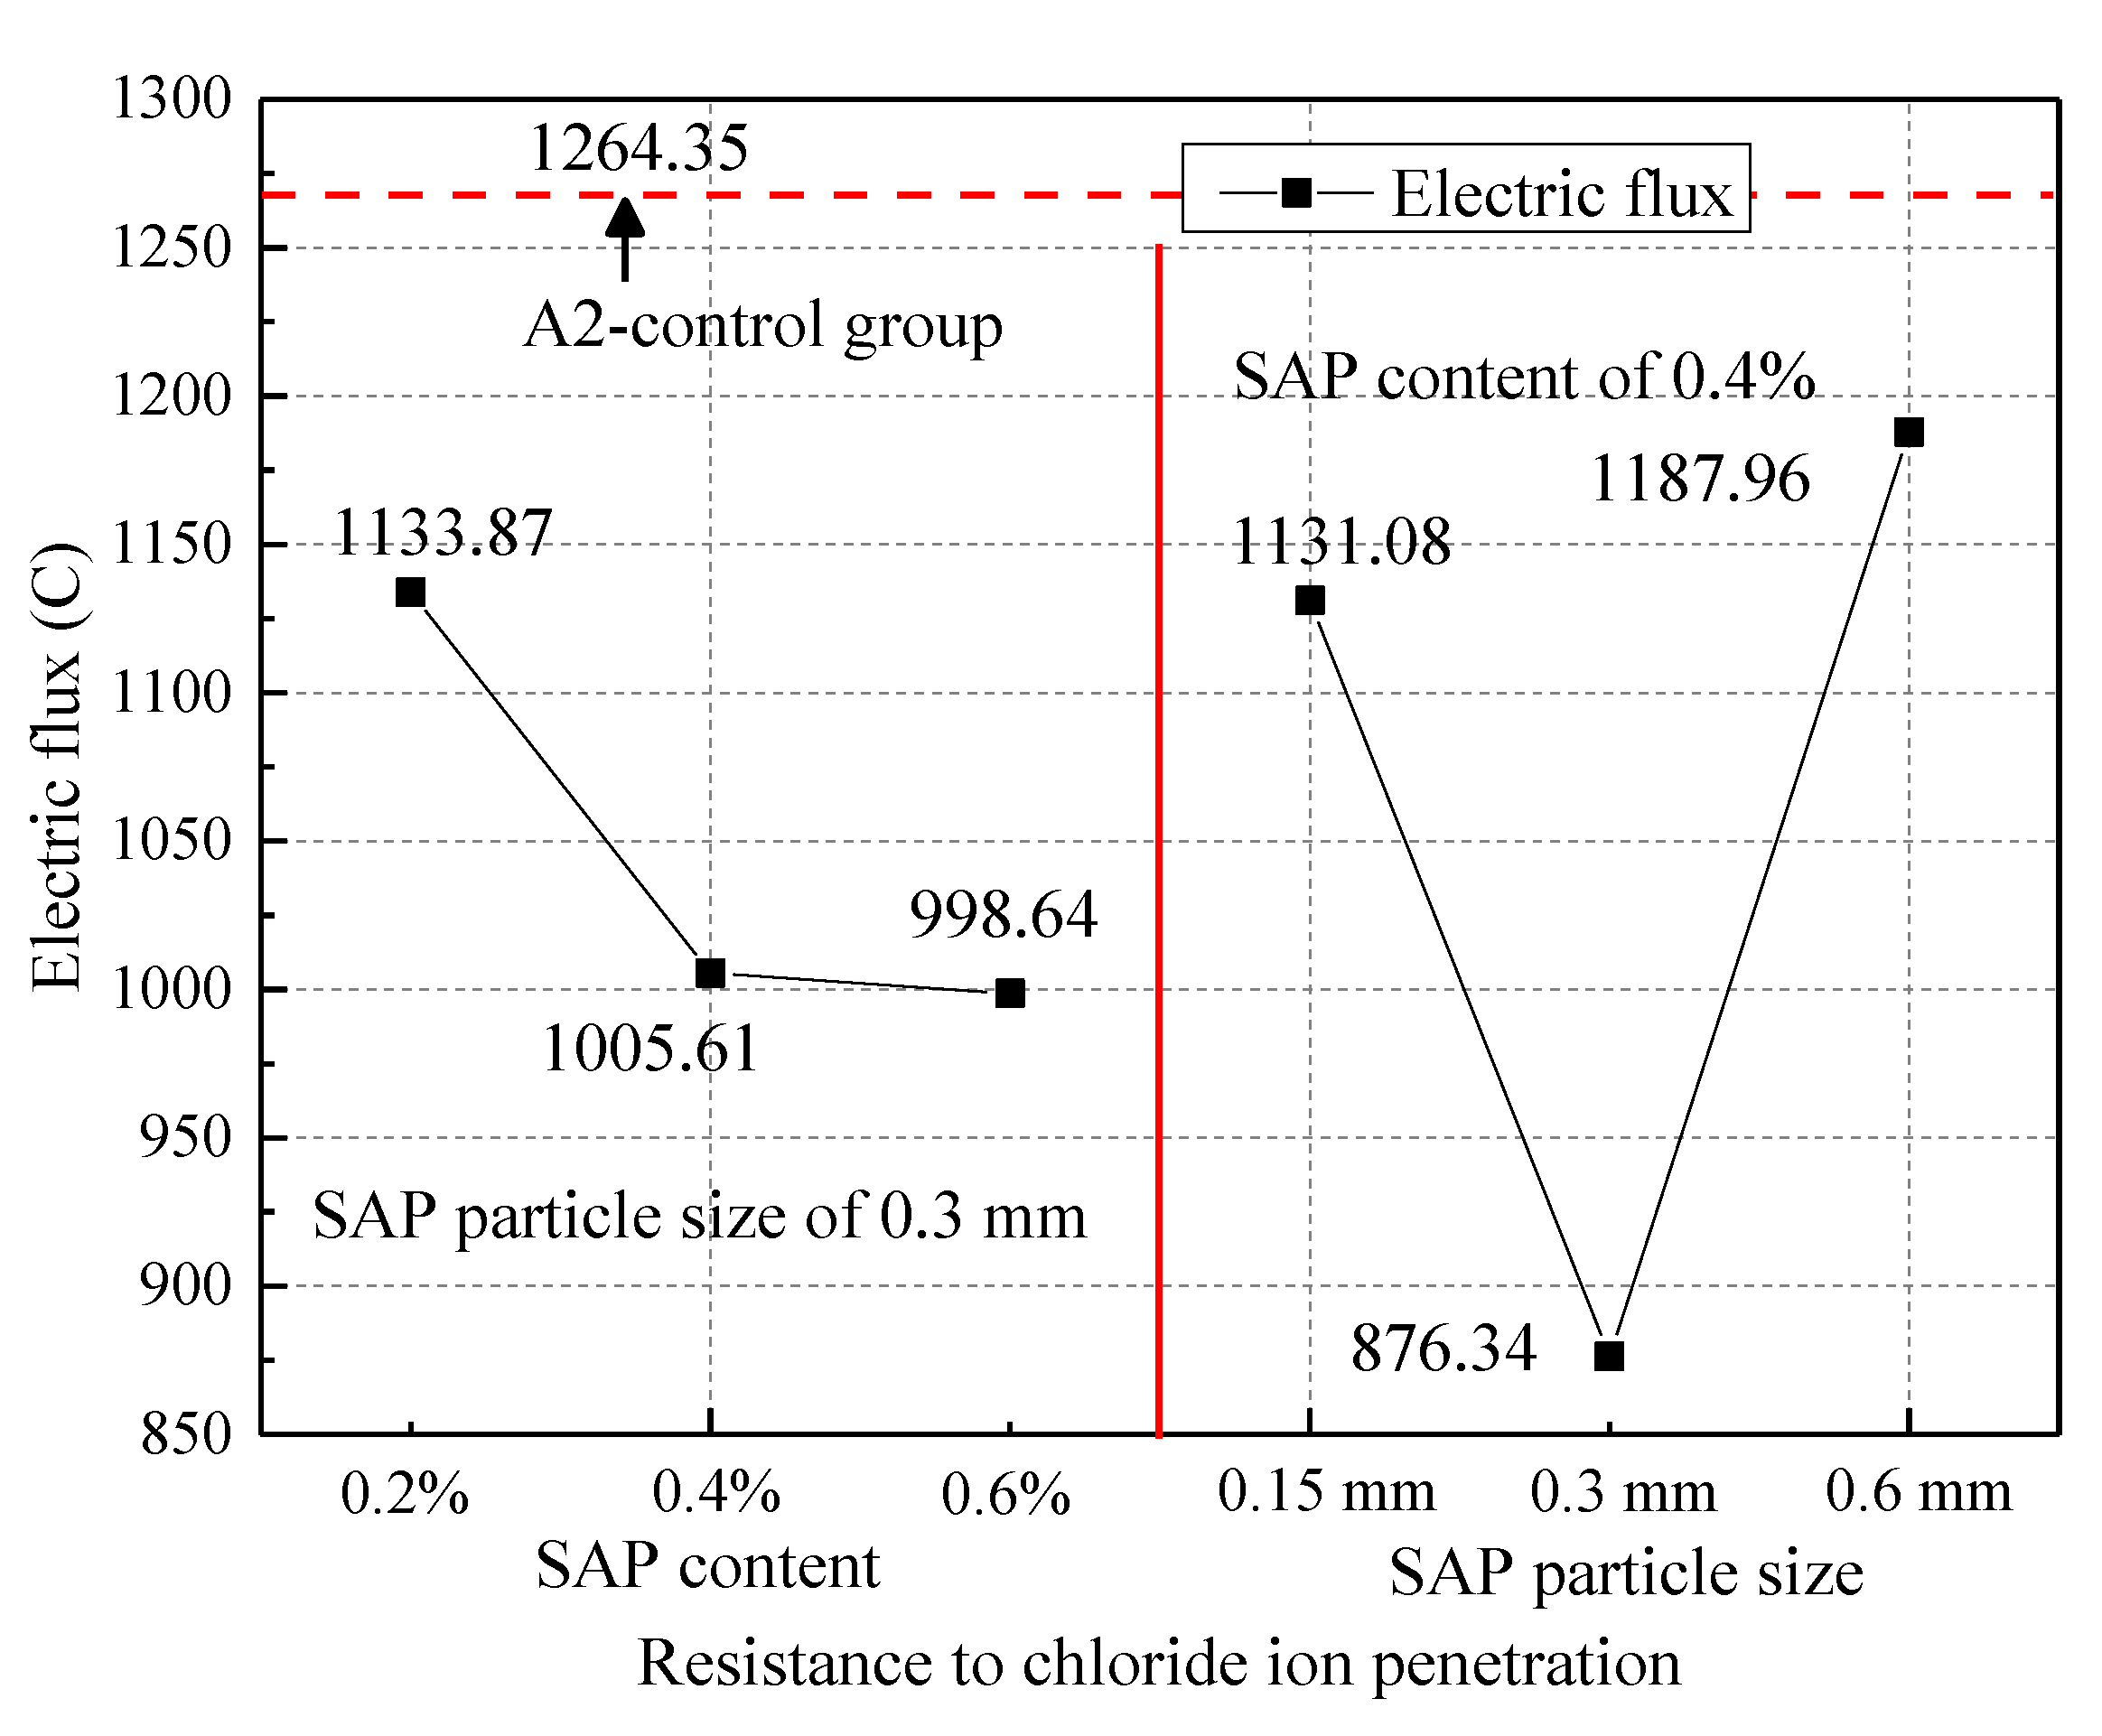
3.3.2. Chloride Penetration Resistance
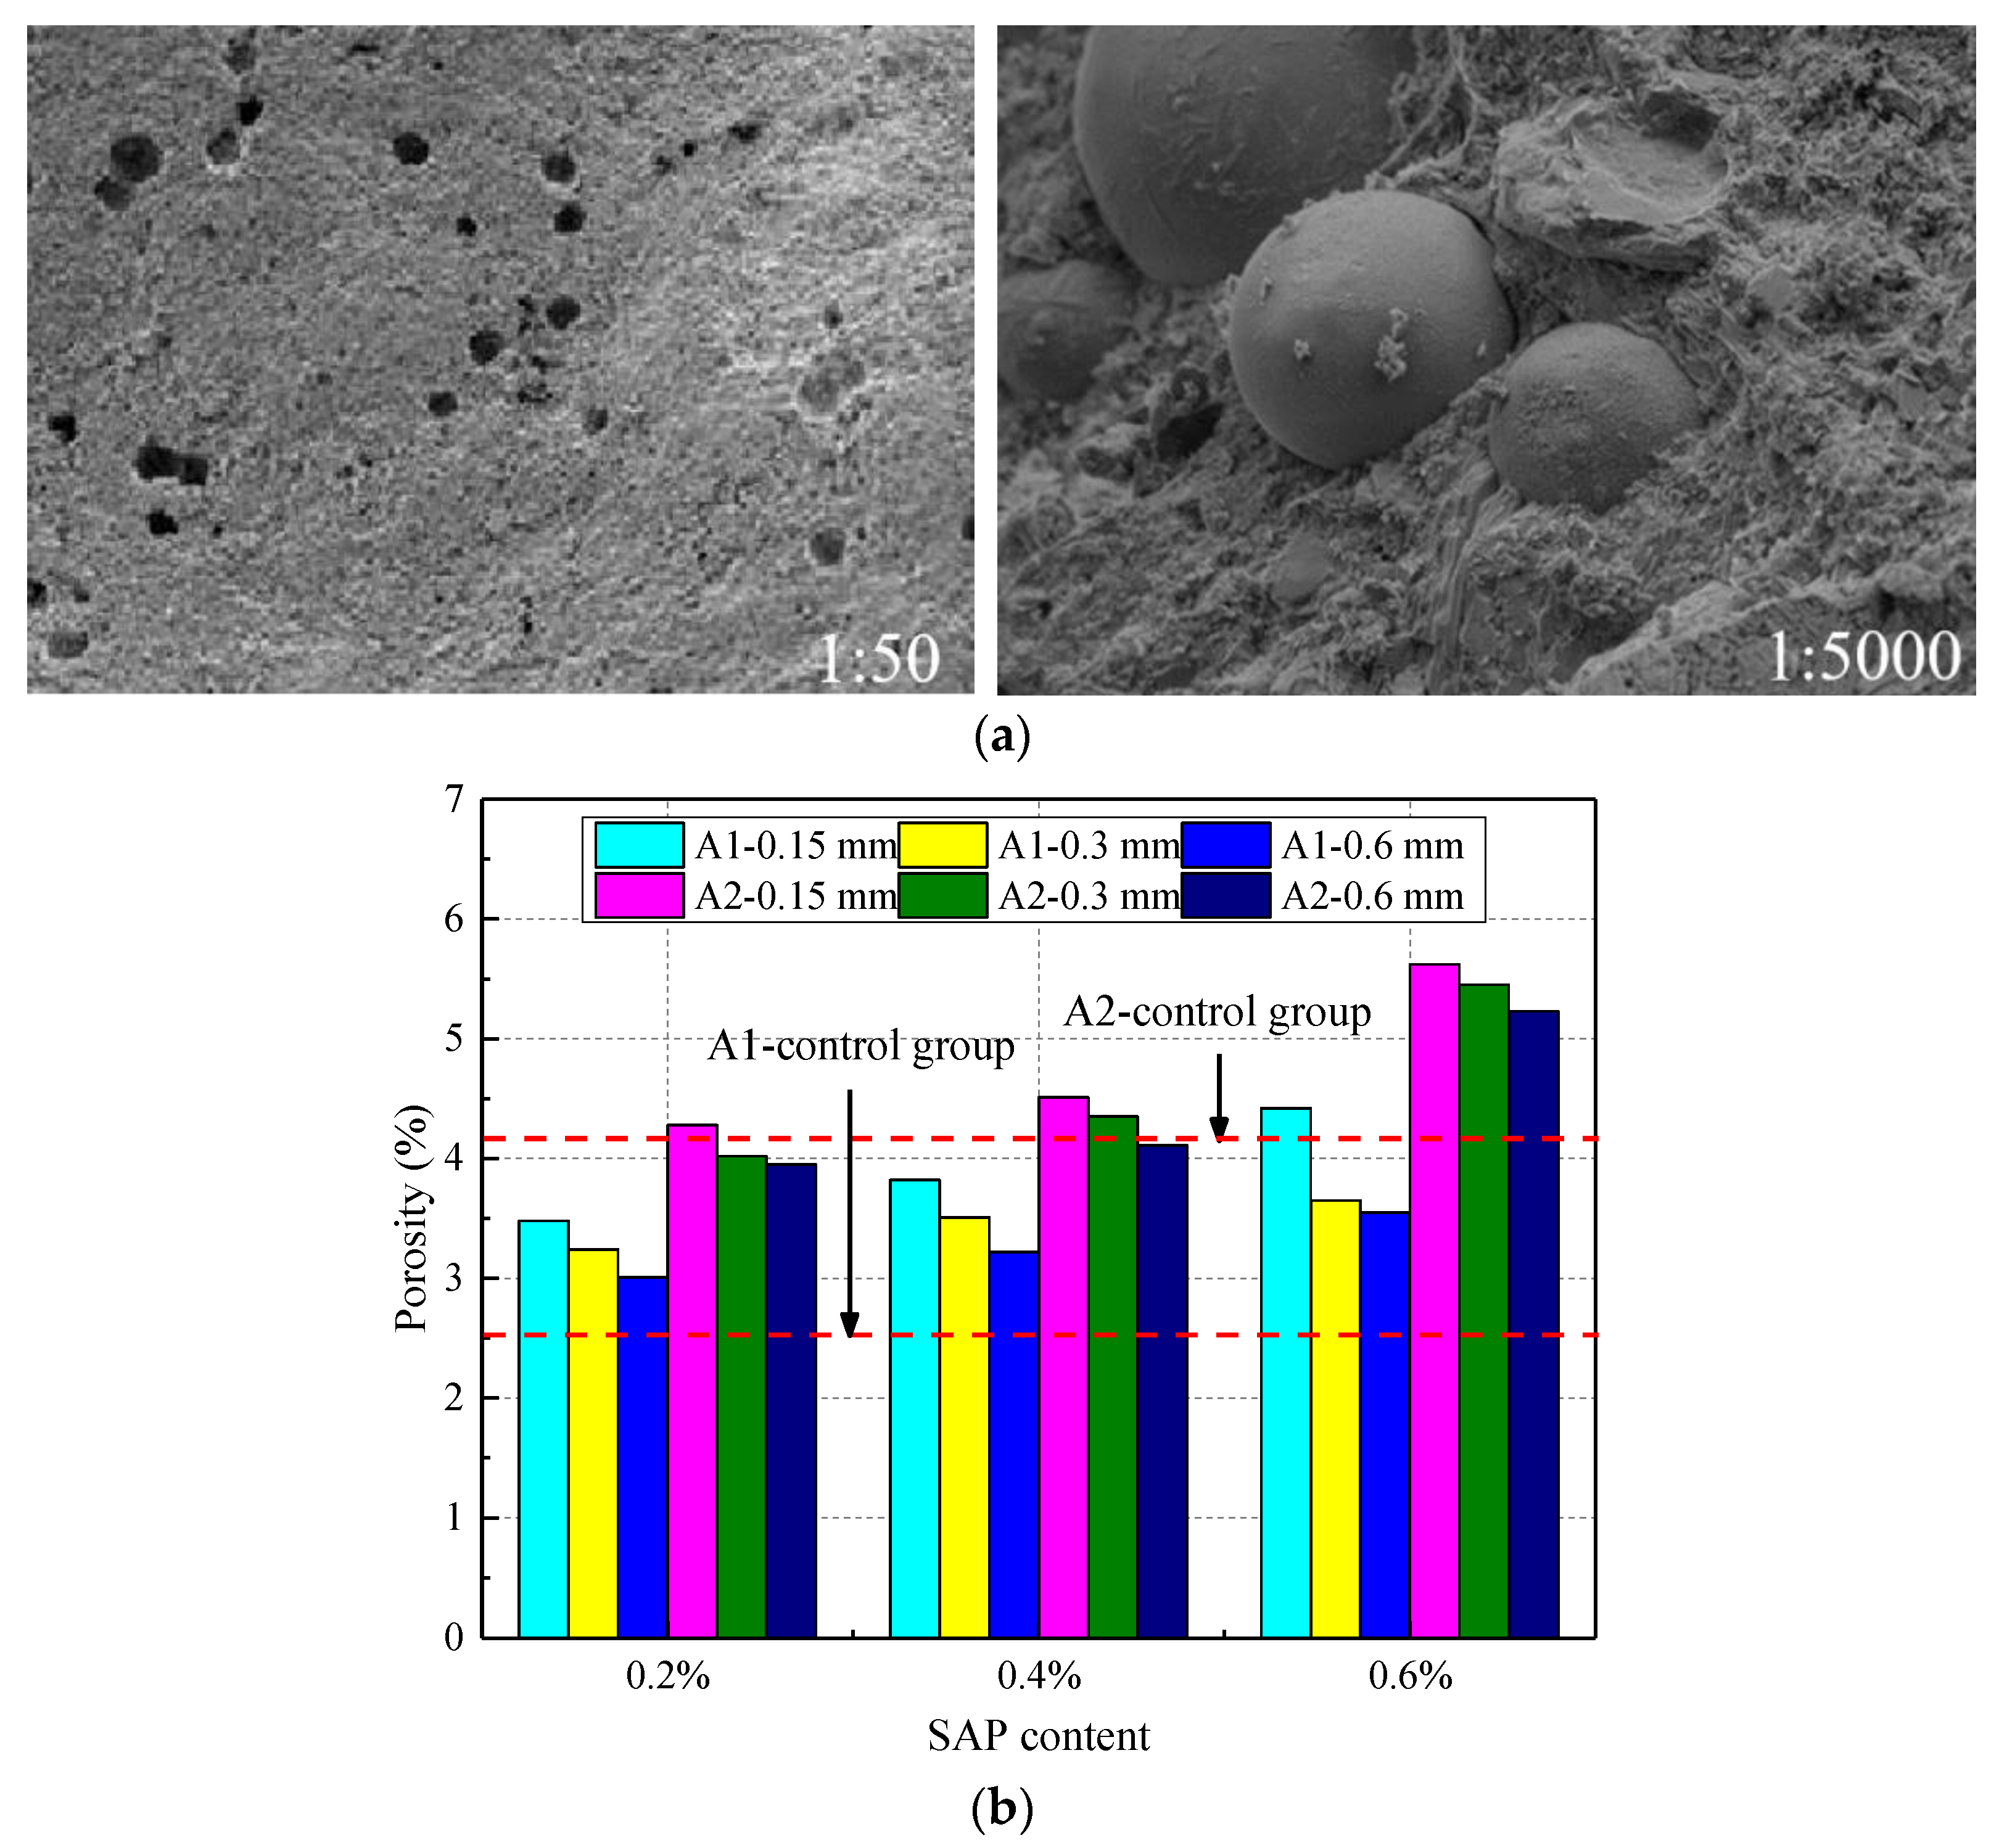
3.4. Characteristics of Microscopic Pore Structure of Concrete
3.4.1. Calculation of Pore Structure Parameters
- Porosity
- 2.
- Equivalent pore diameter
- 3.
- Coefficient of average pore spacing
3.4.2. Porosity
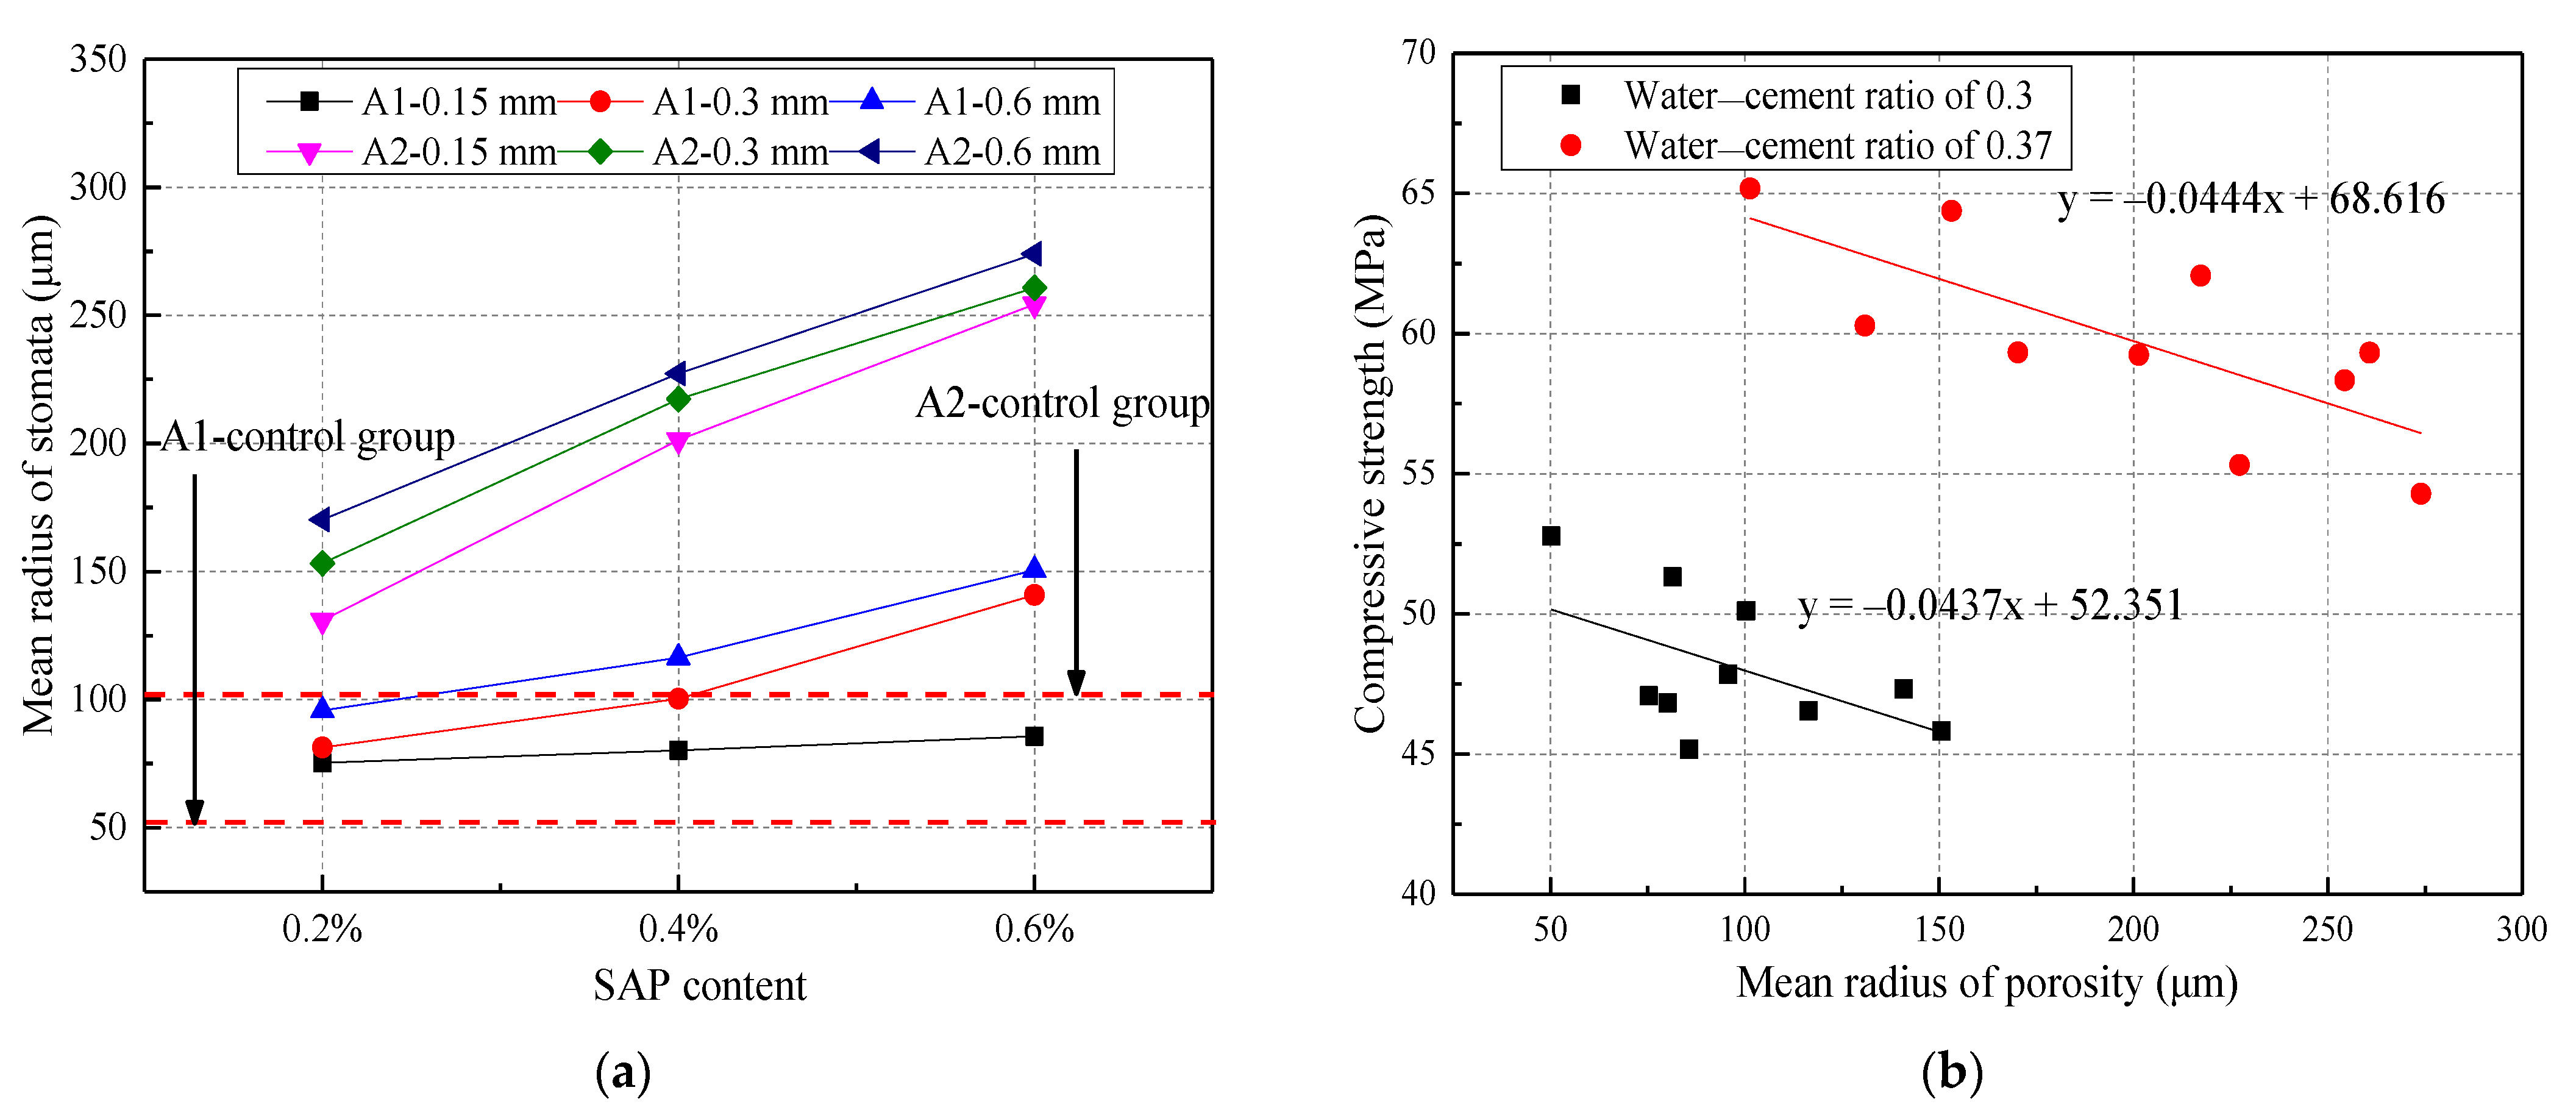
3.4.3. Mean Radius of the Pore
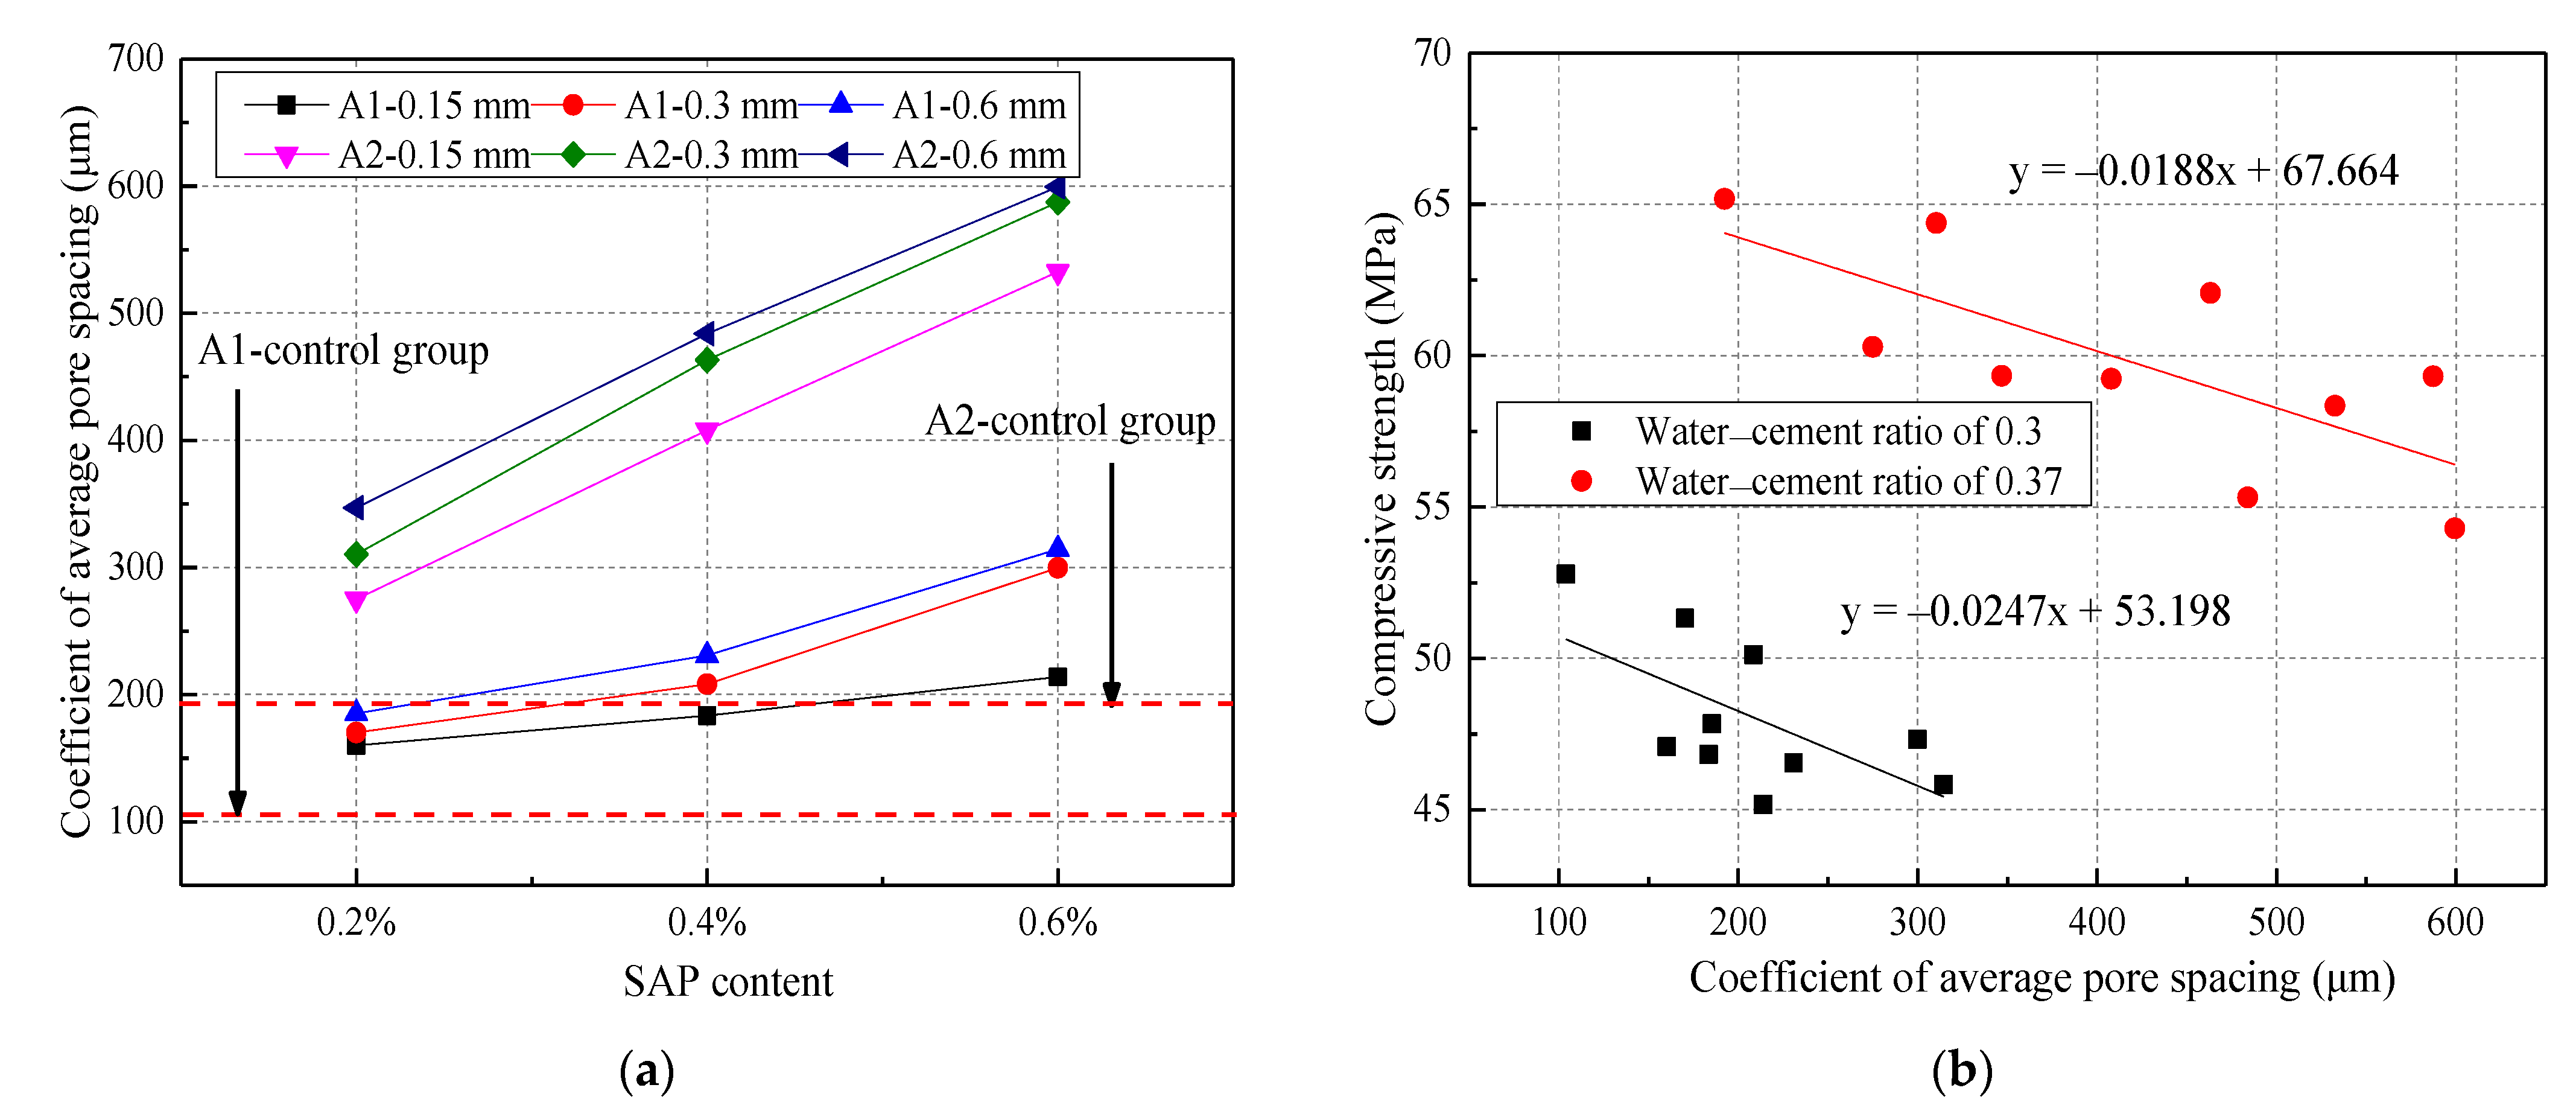
3.4.4. Coefficient of Average Pore Spacing
4. Conclusions
- There are inversely proportional relationships among the SAP content and the concrete mechanical performances, such as compressive strength, flexural strength, elastic modulus, and splitting tensile strength. The mechanical properties of the concrete tend to first increase and then decrease with the SAP particle size. In addition, the mechanical performances of concrete mixed with SAP can be reduced by 10% on average. The best SAP particle size and content are 0.3 mm and 0.2%, respectively, which have the most comprehensive effect to ensure the mechanical properties of concrete.
- Through the Chebyshev2D model adopted, the relationship among the SAP particle size, content and mechanical performances at different water‒cement ratios have been obtained. This provides great assistance with the prediction of concrete’s mechanical properties.
- There is an inversely proportional relationship between the SAP content and shrinkage of concrete. The volume stability of the concrete tends to first increase and then decrease with SAP particle size. The drying shrinkage and autogenous shrinkage of concrete can be best improved by 16.09% and 30.62%, respectively, and thus, the volume stability of concrete is improved.
- A certain closed pore structure is formed inside the concrete after the SAP releases water. Therefore, SAP can effectively improve the frost resistance of concrete by 28.3%, and the resistance to chloride ion penetration by 16.6%. Overall, the frost resistance and corrosion resistance of the concrete are improved.
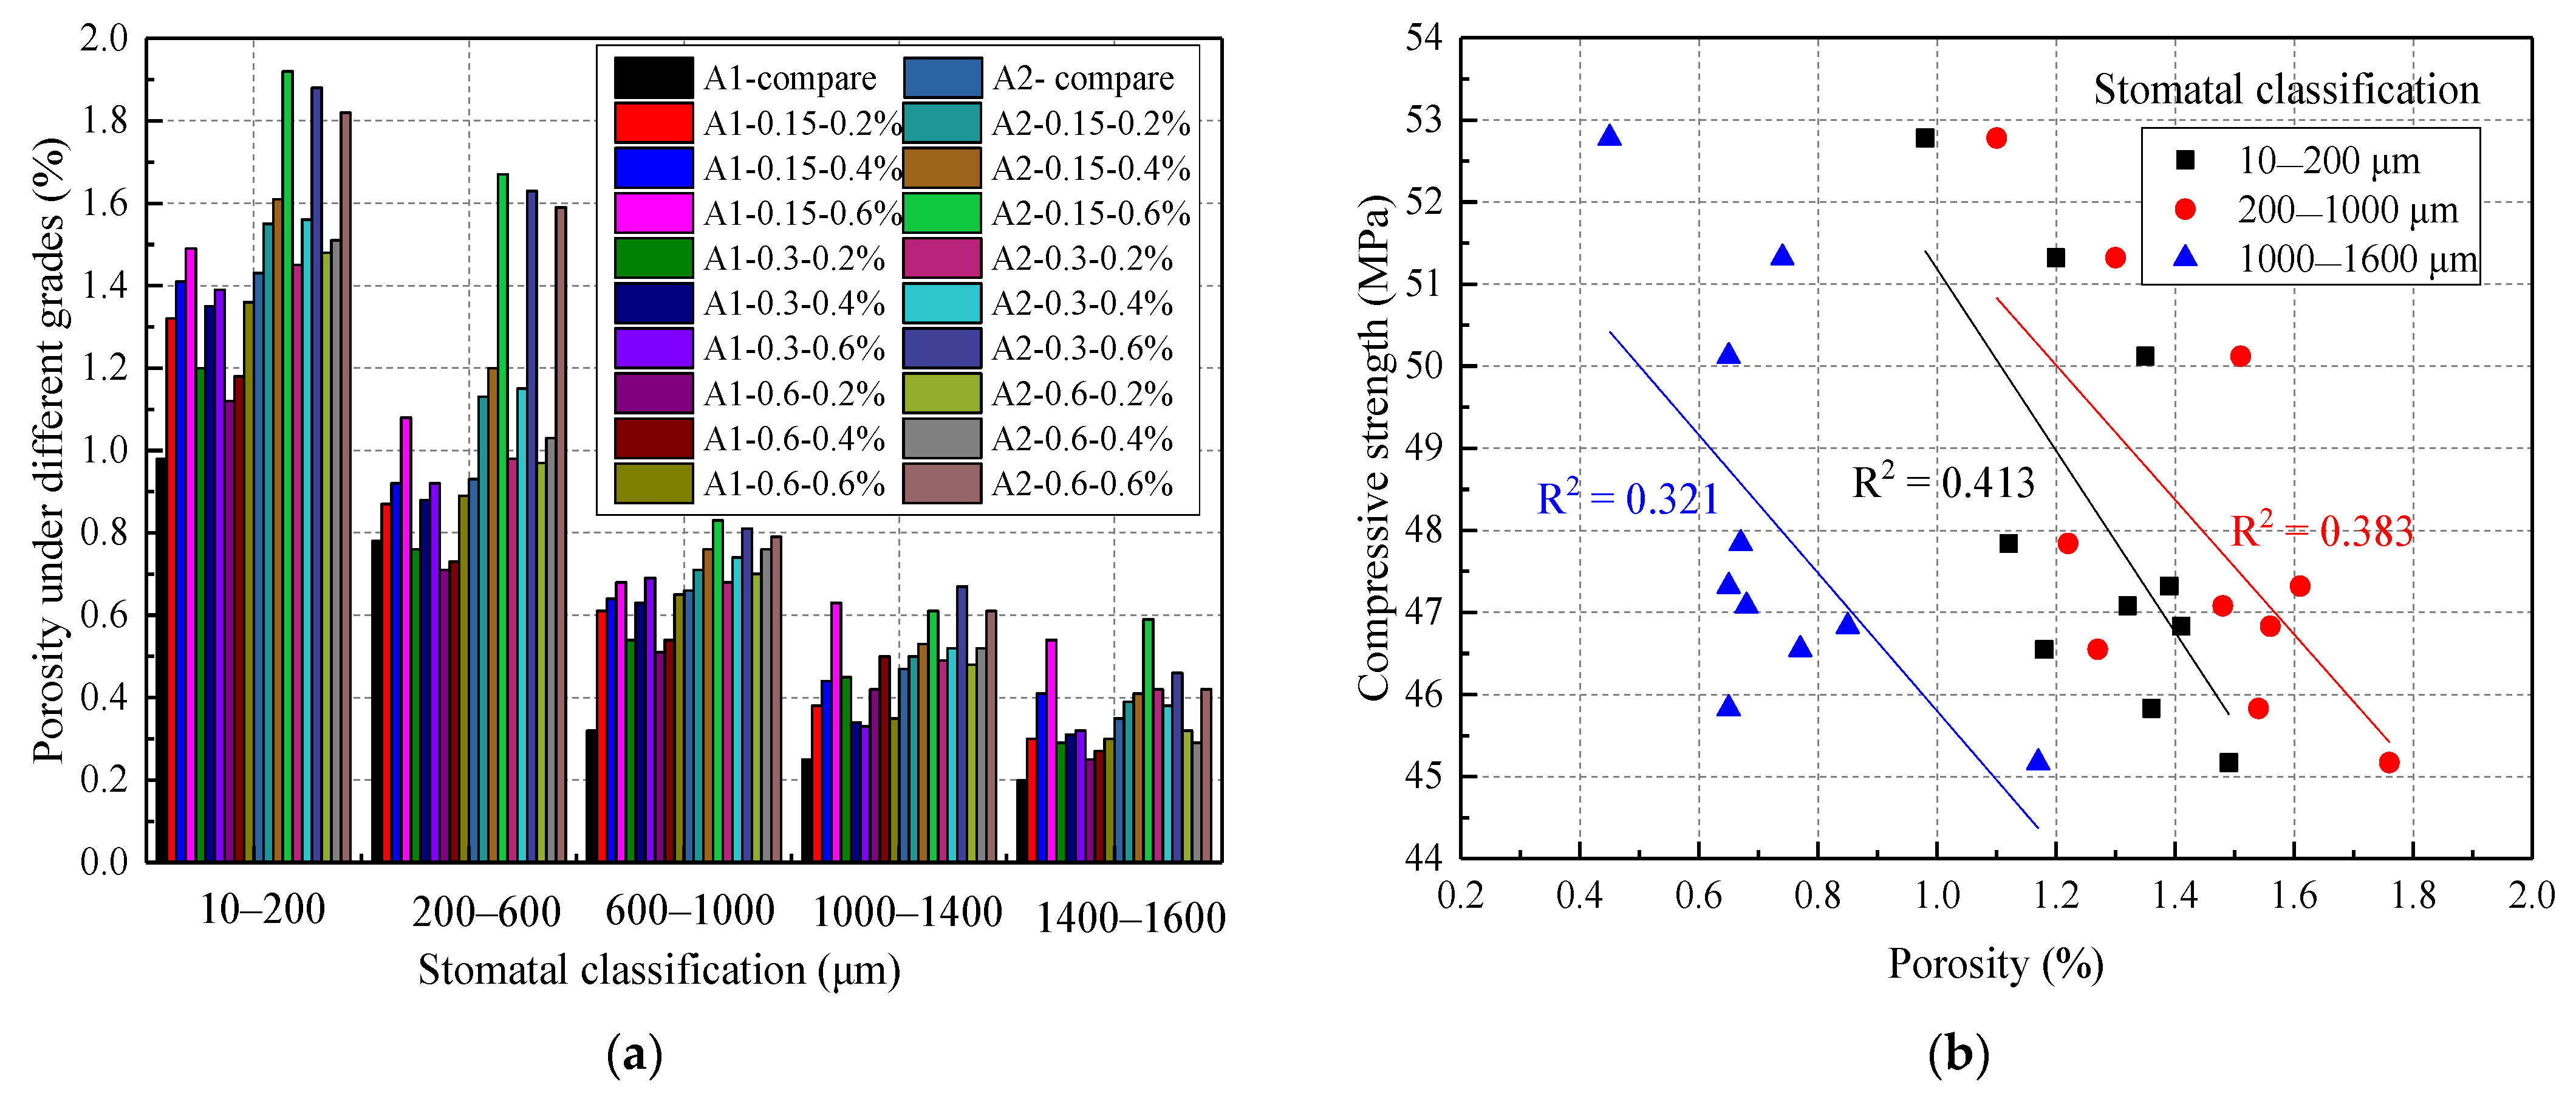
- Through the SEM research on the microscopic pore structure characteristics of SAP concrete, it has been found that the mix proportion has a significant effect on the pore structure parameters. It is also seen that the development of concrete compressive strength is mainly affected by a pore classification of fewer than 1000 μm, and the order of importance of the graded porosity has been obtained. It is determined by the use principle for SAP, which involves a low water‒cement ratio, coarse particle size, and low content. However, the optimal use principle for SAP still needs to be determined through more experimental studies, which are necessary for future work to confirm the database.
Author Contributions
Funding
Institutional Review Board Statement
Informed Consent Statement
Data Availability Statement
Conflicts of Interest
Nomenclature
| x = SAP particle size |
| y = SAP content |
| Z = Compressive strength of concrete |
| Ec = Elastic modulus |
| p1 = Load at 0.5 MPa stress |
| p2 = The ultimate failure load of 40% |
| A’ = Area |
| L = The gauge length for measuring the deformation |
| ∆L = The deformation value of the specimen under P1 to P2 load |
| f = Splitting tensile strength |
| p’ = Load |
| β = Porosity |
| Sp = Porosity area |
| S0 = Cross-sectional area |
| De = Equivalent pore diameter, |
| S = Coefficient of average pore spacing. |
| F = The volume percentage of effective slurry |
| p = The volume percentage of cement paste |
| a = Specific surface area of pores |
| A = The pore volume percentage. |
References
- Liu, L.; Cai, G.; Zhang, J.; Liu, X.; Liu, K. Evaluation of engineering properties and environmental effect of recycled waste tire-sand/soil in geotechnical engineering: A compressive review. Renew. Sustain. Energy Rev. 2020, 126, 109831. [Google Scholar] [CrossRef]
- Li, Z.; Han, M.; Liu, L.; Li, Y.; Yan, S. Corner and partition wall effects on the settlement of a historical building near a supported subway excavation in soft soil. Comput. Geotech. 2020, 128, 103805. [Google Scholar] [CrossRef]
- Dang, J.; Zhao, J.; Du, Z. Effect of superabsorbent polymer on the properties of concrete. Polymers 2017, 9, 672. [Google Scholar] [CrossRef] [Green Version]
- de Sensale, G.R.; Goncalves, A.F. Effects of fine LWA and SAP as internal water curing agents. Int. J. Concr. Struct. M. 2014, 8, 229–238. [Google Scholar] [CrossRef]
- Justs, J.; Wyrzykowski, M.; Bajare, D.; Lura, P. Internal curing by superabsorbent polymers in ultra-high performance concrete. Cem. Concr. Res. 2015, 76, 82–90. [Google Scholar] [CrossRef]
- Kang, S.; Hong, S.; Moon, J. Absorption kinetics of superabsorbent polymers (SAP) in various cement-based solutions. Cem. Concr. Res. 2017, 97, 73–83. [Google Scholar] [CrossRef]
- Mechtcherine, V. Use of superabsorbent polymers (SAP) as concrete additive. RILEM Tech. Lett. 2016, 1, 81–87. [Google Scholar] [CrossRef]
- Poluraju, P.; Rao, N. Pushover analysis of reinforced concrete frame structure using SAP 2000. Int. J. Earth Sci. Eng. 2011, 4, 684–690. [Google Scholar]
- Schröfl, C.; Snoeck, D.; Mechtcherine, V. A review of characterisation methods for superabsorbent polymer (SAP) samples to be used in cement-based construction materials: Report of the RILEM TC 260-RSC. Mater. Struct. 2017, 50, 197. [Google Scholar] [CrossRef]
- Sun, B.; Wu, H.; Song, W.; Li, Z.; Yu, J. Design methodology and mechanical properties of Superabsorbent Polymer (SAP) cement-based materials. Constr. Build. Mater. 2019, 204, 440–449. [Google Scholar] [CrossRef]
- Assmann, A. Physical Properties of Concrete Modified with Superabsorbent Polymers. Ph.D. Thesis, Stuttgart University, Stuttgart, Germany, 2013. [Google Scholar]
- Farzanian, K.; Teixeira, K.P.; Rocha, I.P.; Carneiro, L.D.S.; Ghahremaninezhad, A. The mechanical strength, degree of hydration, and electrical resistivity of cement pastes modified with superabsorbent polymers. Constr. Build. Mater. 2016, 109, 156–165. [Google Scholar] [CrossRef]
- Huang, H.; Van Tuan, N.; Ye, G. In the influence of the particle size of superabsorbent polymer on internal curing of high performance concrete. In Proceedings of the 3rd International Conference on Concrete Repair, Rehabilitation and Retrofitting (ICCRRR-2012), Cape Town, South Africa, 3–5 September 2012; CRC Press: Boca Raton, FL, USA, 2012; pp. 223–227. [Google Scholar]
- Olawuyi, B.J.; Boshoff, W.P. Influence of SAP content and curing age on air void distribution of high performance concrete using 3D volume analysis. Constr. Build. Mater. 2017, 135, 580–589. [Google Scholar] [CrossRef]
- Cunha, T.A.; Francinete, P.; Agostinho, L.B.; Silva, E.F.; Lopes, A. Study of the autogenous shrinkage in microconcretes containing superabsorbent polymer and nano-silica. In Proceedings of the 2nd International RILEM/COST Conferece on Early Age Cracking and Serviceability in Cement-Based Materials and Structures, Brussels, Belgium, 12–14 September 2017; pp. 251–256. [Google Scholar]
- Fang, J.; Mo, L.; Huang, B.; Deng, M.; Wang, A. Mitigating the autogenous shrinkage via the combination of superabsorbent polymer and MgO-based expansive additive. Adv. Cem. Res. 2020, 1–36. [Google Scholar] [CrossRef]
- Hasholt, M.T.; Jensen, O.M.; Kovler, K.; Zhutovsky, S. Can superabsorent polymers mitigate autogenous shrinkage of internally cured concrete without compromising the strength? Constr. Build. Mater. 2012, 31, 226–230. [Google Scholar] [CrossRef]
- Wang, F.; Yang, J.; Cheng, H.; Wu, J.; Liang, X. Study on mechanism of desorption behavior of saturated superabsorbent polymers in concrete. ACI Mater. J. 2015, 112, 463–469. [Google Scholar] [CrossRef]
- Baloch, H.; Usman, M.; Rizwan, S.A.; Hanif, A. Properties enhancement of super absorbent polymer (SAP) incorporated self-compacting cement pastes modified by nano silica (NS) addition. Constr. Build. Mater. 2019, 203, 18–26. [Google Scholar] [CrossRef]
- Beushausen, H.; Gillmer, M.; Alexander, M. The influence of superabsorbent polymers on strength and durability properties of blended cement mortars. Cem. Concr. Comp. 2014, 52, 73–80. [Google Scholar] [CrossRef]
- Hasholt, M.T.; Jensen, O.M. Chloride migration in concrete with superabsorbent polymers. Cem. Concr. Comp. 2015, 55, 290–297. [Google Scholar] [CrossRef] [Green Version]
- Kong, X.; Zhang, Z.; Lu, Z. Effect of pre-soaked superabsorbent polymer on shrinkage of high-strength concrete. Mater. Struct. 2015, 48, 2741–2758. [Google Scholar] [CrossRef]
- Ma, X.; Liu, J.; Wu, Z.; Shi, C. Effects of SAP on the properties and pore structure of high performance cement-based materials. Constr. Build. Mater. 2017, 131, 476–484. [Google Scholar] [CrossRef]
- Plank, J.; Sakai, E.; Miao, C.; Yu, C.; Hong, J. Chemical admixtures—Chemistry, applications and their impact on concrete microstructure and durability. Cem. Concr. Res. 2015, 78, 81–99. [Google Scholar] [CrossRef]
- Kang, S.H.; Hong, S.G.; Moon, J. The effect of superabsorbent polymer on various scale of pore structure in ultra-high performance concrete. Constr. Build. Mater. 2018, 172, 29–40. [Google Scholar] [CrossRef]
- Laustsen, S.; Hasholt, M.T.; Jensen, O.M. Void structure of concrete with superabsorbent polymers and its relation to frost resistance of concrete. Mater. Struct. 2015, 48, 357–368. [Google Scholar] [CrossRef]
- Lefever, G.; Aggelis, D.G.; De Belie, N.; Raes, M.; Hauffman, T.; Van Hemelrijck, D.; Snoeck, D. The influence of superabsorbent polymers and nanosilica on the hydration process and microstructure of cementitious mixtures. Materials 2020, 13, 5194. [Google Scholar] [CrossRef] [PubMed]
- Mousavi, S.S.; Ouellet-Plamondon, C.M.; Guizani, L.; Bhojaraju, C.; Brial, V. On mitigating rebar–concrete interface damages due to the pre-cracking phenomena using superabsorbent polymers. Constr. Build. Mater. 2020, 253, 119181. [Google Scholar] [CrossRef]
- Snoeck, D.; Schroefl, C.; Mechtcherine, V. Recommendation of RILEM TC 260-RSC: Testing sorption by superabsorbent polymers (SAP) prior to implementation in cement-based materials. Mater. Struct. 2018, 51, 116. [Google Scholar] [CrossRef]
- Mechtcherine, V.; Snoeck, D.; Schröfl, C.; De Belie, N.; Klemm, A.J.; Ichimiya, K.; Moon, J.; Wyrzykowski, M.; Lura, P.; Toropovs, N.; et al. Testing superabsorbent polymer (SAP) sorption properties prior to implementation in concrete: Results of a RILEM Round-Robin Test. Mater. Struct. 2018, 51, 28. [Google Scholar] [CrossRef]
- Lam, H.; Hooton, R.D. Effects of Internal Curing methods on Restrained Shrinkage and Permeability. Master’s Thesis, University of Toronto, Toronto, ON, Canada, 2005. [Google Scholar]
- Lura, P.; Durand, F.; Loukili, A.; Kovler, K.; Jensen, O.M. Compressive strength of cement pastes and mortars with suberabsorbent polymers. In Proceedings of the International RILEM Conference on Volume Changes of Hardening Concrete: Testing and Mitigation, Bagneux, France, 20–23 August 2006; Jensen, O.M., Lura, P., Kovler, K., Eds.; RILEM Publications SARL: Bagneux, France, 2006; pp. 117–126. [Google Scholar]
- Esteves, L.P.; Cachim, P.; Ferreira, V.M. Mechanical properties of cement mortars with superabsorbent polymers. In Advances in Construction Materials; Grosse, C.U., Ed.; Springer: Berlin/Heidelberg, Germany, 2007; pp. 451–462. [Google Scholar]
- Powers, T.C.; Brownyard, T.L. Studies of the physical properties of hardened Portland cement paste. J. Proc. 1946, 43, 101–132. [Google Scholar]
- Kovler, K. Effect of superabsorbent polymers on the mechanical properties of concrete. In Application of Super Absorbent Polymers (SAP) in Concrete Construction; Springer: Berlin/Heidelberg, Germany, 2012; pp. 99–114. [Google Scholar]
- Snoeck, D.; Schaubroeck, D.; Dubruelb, P.; De Belie, N. Effect of high amounts of superabsorbent polymers andadditional water on the workability, microstructure and strength of mortars with a water-to-cement ratio of 0.50. Constr. Build. Mater. 2014, 72, 148–157. [Google Scholar] [CrossRef]
- Olawuyi, B.; Boshoff, W. Compressive strength of high-performance concrete with absorption capacity of Super-Absorbing-Polymers (SAP). In Proceedings of the Research and Application in Structural Engineering, Mechanics and Computation, Cape Town, South Africa, 2–4 September 2013; Volume 978, pp. 2–4. [Google Scholar]
- Ding, H.; Zhang, L.; Zhang, P. Factors influencing strength of super absorbent polymer (SAP) concrete. Trans. Tianjin Univ. 2017, 23, 245–257. [Google Scholar] [CrossRef]
- Mechtcherine, V.; Gorges, M.; Schroefl, C.; Assmann, A.; Brameshuber, W.; Ribeiro, A.B.; Cusson, D.; Custódio, J.; Da Silva, E.F.; Ichimiya, K. Effect of internal curing by using superabsorbent polymers (SAP) on autogenous shrinkage and other properties of a high-performance fine-grained concrete: Results of a RILEM round-robin test. Mater. Struct. 2014, 47, 541–562. [Google Scholar] [CrossRef]
- Piérard, J.; Pollet, V.; Cauberg, N. Mitigating autogenous shrinkage in HPC by internal curing using superabsorbent polymers. In Proceedings of the International RILEM Conference on Volume Changes of Hardening Concrete: Testing and Mitigation, Lyngby, Denmark, 20–23 August 2006; RILEM Publications SARL: Bagneux, France, 2006; pp. 97–106. [Google Scholar]
- Yu, P.; Mo, L.; Deng, M. Synergetic effect of MEA and SAP on the deformation and mechanical properties of concrete. Mag. Concr. Res. 2020, 72, 1289–1296. [Google Scholar] [CrossRef]
- Zhang, M.; Aba, M.; Sakoi, Y.; Tsukinaga, Y.; Shimomukai, K.; Kuang, Y. Synergetic effect of expansive agent (KEA) and superabsorbent polymers (SAP) on the shrinkage, strength and pore structures of mortars. J. Adv. Concr. Technol. 2021, 19, 26–39. [Google Scholar] [CrossRef]
- Liu, R.; Sun, Z.; Ding, Q.; Chen, P.; Chen, K. Mitigation of early-age cracking of concrete based on a new gel-type superabsorbent polymer. J. Mater. Civil. Eng. 2017, 29, 04017151. [Google Scholar] [CrossRef]
- Lee, H.; Wong, H.; Buenfeld, N. Self-sealing of cracks in concrete using superabsorbent polymers. Cem. Concr. Res. 2016, 79, 194–208. [Google Scholar] [CrossRef] [Green Version]
- Shen, D.; Liu, C.; Jiang, J.; Kang, J.; Li, M. Influence of super absorbent polymers on early-age behavior and tensile creep of internal curing high strength concrete. Constr. Build. Mater. 2020, 258, 120068. [Google Scholar] [CrossRef]
- Fan, J.; Shen, A.; Guo, Y.; Zhao, M.; Yang, X.; Wang, X. Evaluation of the shrinkage and fracture properties of hybrid Fiber-Reinforced SAP modified concrete. Constr. Build. Mater. 2020, 256, 119491. [Google Scholar] [CrossRef]
- Reinhardt, H.-W.; Assmann, A. Effect of superabsorbent polymers on durability of concrete. In Application of Super Absorbent Polymers (SAP) in Concrete Construction; Springer: Berlin/Heidelberg, Germany, 2012; pp. 115–135. [Google Scholar]
- Yang, J.; Wang, F. Influence of assumed absorption capacity of superabsorbent polymers on the microstructure and performance of cement mortars. Constr. Build. Mater. 2019, 204, 468–478. [Google Scholar] [CrossRef]
- Zhang, S.; Cao, K.; Wang, C.; Wang, X.; Deng, G.; Wei, P. Influence of the porosity and pore size on the compressive and splitting strengths of cellular concrete with millimeter-size pores. Constr. Build. Mater. 2020, 235, 117508. [Google Scholar] [CrossRef]


| Materials | Index | 30 mesh | 50 mesh | 100 mesh | |
|---|---|---|---|---|---|
| SAP | Particle size (mm) | 0.6 | 0.3 | 0.15 | |
| Water absorption rate | 200 | 400 | 700 | ||
| Specific gravity | 1.52 | 1.51 | 1.48 | ||
| d50 | 315 | 162 | 46 | ||
| Water absorption in deionized water (g/g) | 212 | 335 | 725 | ||
| Water absorption in cement hydration solution (g/g) | 32 | 53 | 74 | ||
| Bulk density (g/mL) | 0.6–0.8 | ||||
| Cement | Density (kg/m3) | 3150 | |||
| Initial setting time (min) | 200 | ||||
| Final setting time (min) | 275 | ||||
| Compressive strength (MPa) | 3-day | 28.5 | |||
| 28-day | 51.4 | ||||
| Flexural strength (MPa) | 3-day | 5.8 | |||
| 28-day | 8.8 | ||||
| Item | Water–Cement Ratio | Material Consumption of Cubic Concrete (kg/m3) | ||||
|---|---|---|---|---|---|---|
| Cement | Sand | Pebble | Water | Additional Water | ||
| A1 | 0.3 | 550 | 705 | 1040 | 165 | 29.7 |
| A2 | 0.37 | 419 | 820 | 1030 | 155 | 20.95 |
| Item | w/c Ratio | SAP Particle Size (mm) | SAP Content (%) | Item | w/c Ratio | SAP Particle Size (mm) | SAP Content (%) |
|---|---|---|---|---|---|---|---|
| A1-control | 0.3 | 0 | 0 | A2-control | 0.37 | 0 | 0 |
| A1-0.15-0.2% | 0.3 | 0.15 | 0.2 | A2-0.15-0.2% | 0.37 | 0.15 | 0.2 |
| A1-0.15-0.4% | 0.15 | 0.4 | A2-0.15-0.4% | 0.15 | 0.4 | ||
| A1-0.15-0.6% | 0.15 | 0.6 | A2-0.15-0.6% | 0.15 | 0.6 | ||
| A1-0.3-0.2% | 0.3 | 0.3 | 0.2 | A2-0.3-0.2% | 0.37 | 0.3 | 0.2 |
| A1-0.3-0.4% | 0.3 | 0.4 | A2-0.3-0.4% | 0.3 | 0.4 | ||
| A1-0.3-0.6% | 0.3 | 0.6 | A2-0.3-0.6% | 0.3 | 0.6 | ||
| A1-0.6-0.2% | 0.3 | 0.6 | 0.2 | A2-0.6-0.2% | 0.37 | 0.6 | 0.2 |
| A1-0.6-0.4% | 0.6 | 0.4 | A2-0.6-0.4% | 0.6 | 0.4 | ||
| A1-0.6-0.6% | 0.6 | 0.6 | A2-0.6-0.6% | 0.6 | 0.6 |
| Water–Cement Ratio | Z0 | A1 | A2 | B1 | B2 | C1 | R2 | ||||||
|---|---|---|---|---|---|---|---|---|---|---|---|---|---|
| Value | SE | Value | SE | Value | SE | Value | SE | Value | SE | Value | SE | ||
| 0.3 | 2.055 | 11.748 | 51.754 | 10.352 | −34.444 | 6.268 | 0.871 | 11.586 | −5.083 | 6.924 | 1.893 | 8.547 | 0.843 |
| 0.37 | 21.806 | 13.703 | 59.687 | 12.074 | −40.284 | 7.310 | −13.867 | 13.514 | 5.604 | 8.076 | −14.690 | 9.970 | 0.912 |
| Water–Cement Ratio | Z0 | A1 | A2 | B1 | B2 | C1 | R2 | ||||||
|---|---|---|---|---|---|---|---|---|---|---|---|---|---|
| Value | SE | Value | SE | Value | SE | Value | SE | Value | SE | Value | SE | ||
| 0.3 | 1.189 | 0.676 | 5.862 | 0.595 | −3.025 | 0.361 | −0.600 | 0.666 | 0.063 | 0.398 | −1.071 | 0.492 | 0.969 |
| 0.37 | 1.093 | 0.803 | 6.338 | 0.707 | −4.580 | 0.428 | −0.025 | 0.791 | −0.188 | 0.473 | −1.095 | 0.584 | 0.974 |
| Water–Cement Ratio | Z0 | A1 | A2 | B1 | B2 | C1 | R2 | ||||||
|---|---|---|---|---|---|---|---|---|---|---|---|---|---|
| Value | SE | Value | SE | Value | SE | Value | SE | Value | SE | Value | SE | ||
| 0.3 | 0.072 | 0.740 | 6.393 | 0.652 | −3.642 | 0.395 | −0.0458 | 0.730 | −0.292 | 0.436 | −1.012 | 0.539 | 0.956 |
| 0.37 | 1.093 | 0.803 | 6.338 | 0.707 | −4.580 | 0.428 | −0.025 | 0.791 | −0.188 | 0.473 | −1.095 | 0.584 | 0.974 |
| Water–Cement Ratio | Z0 | A1 | A2 | B1 | B2 | C1 | R2 | ||||||
|---|---|---|---|---|---|---|---|---|---|---|---|---|---|
| Value | SE | Value | SE | Value | SE | Value | SE | Value | SE | Value | SE | ||
| 0.3 | −0.023 | 0.493 | 7.383 | 0.434 | −5.309 | 0.263 | −1.129 | 0.486 | 0.354 | 0.291 | 0.512 | 0.359 | 0.990 |
| 0.37 | −3.556 | 0.704 | 11.622 | 0.620 | −6.617 | 0.376 | −1.033 | 0.694 | 0.271 | 0.415 | −1.167 | 0.512 | 0.986 |
Publisher’s Note: MDPI stays neutral with regard to jurisdictional claims in published maps and institutional affiliations. |
© 2021 by the authors. Licensee MDPI, Basel, Switzerland. This article is an open access article distributed under the terms and conditions of the Creative Commons Attribution (CC BY) license (https://creativecommons.org/licenses/by/4.0/).
Share and Cite
Zheng, X.; Han, M.; Liu, L. Effect of Superabsorbent Polymer on the Mechanical Performance and Microstructure of Concrete. Materials 2021, 14, 3232. https://doi.org/10.3390/ma14123232
Zheng X, Han M, Liu L. Effect of Superabsorbent Polymer on the Mechanical Performance and Microstructure of Concrete. Materials. 2021; 14(12):3232. https://doi.org/10.3390/ma14123232
Chicago/Turabian StyleZheng, Xiaoguo, Meng Han, and Lulu Liu. 2021. "Effect of Superabsorbent Polymer on the Mechanical Performance and Microstructure of Concrete" Materials 14, no. 12: 3232. https://doi.org/10.3390/ma14123232