
A Computational Study of the Shear Behavior of Reinforced Concrete Beams Affected from Alkali–Silica Reactivity Damage

 ,
,
Abstract
:1. Introduction
2. Literature Synthesis
3. Experimental Program
4. Finite Element Modeling and Analysis
4.1. Material Models
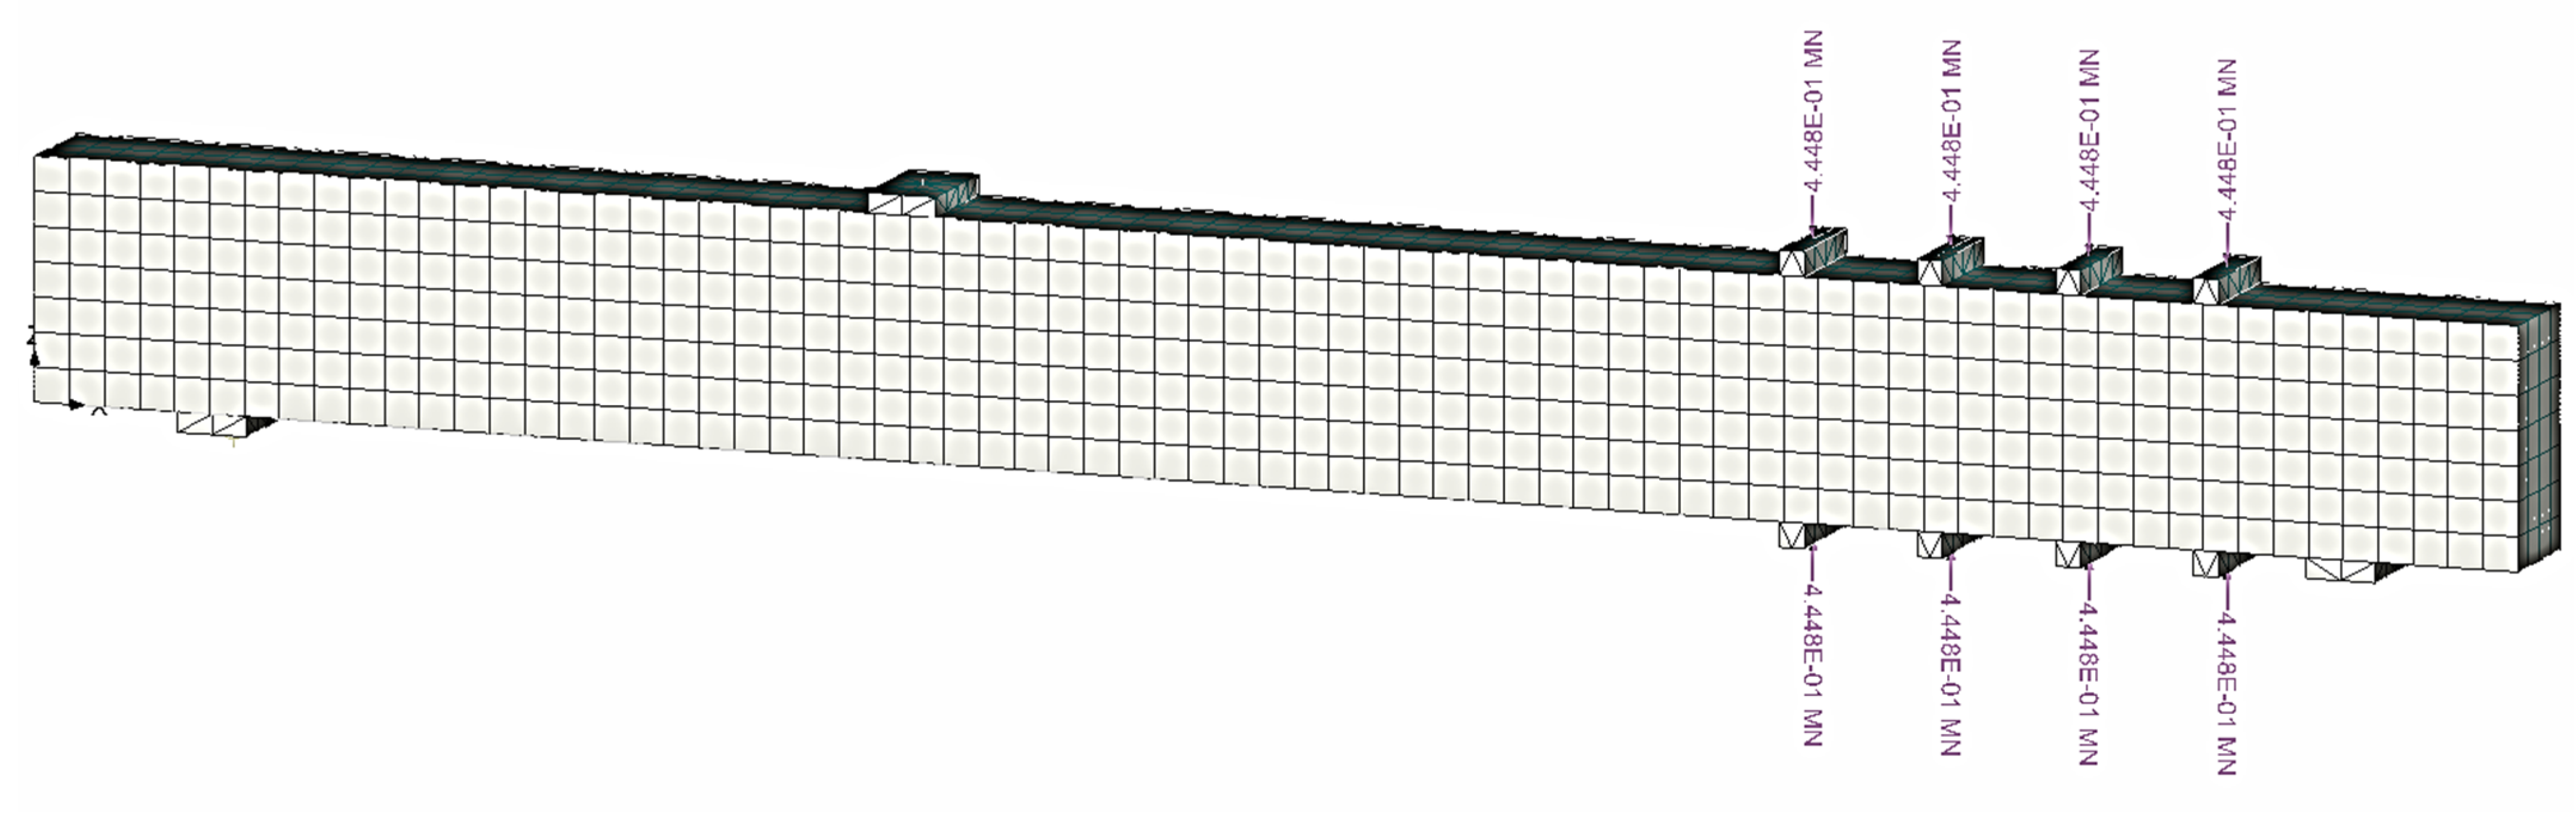
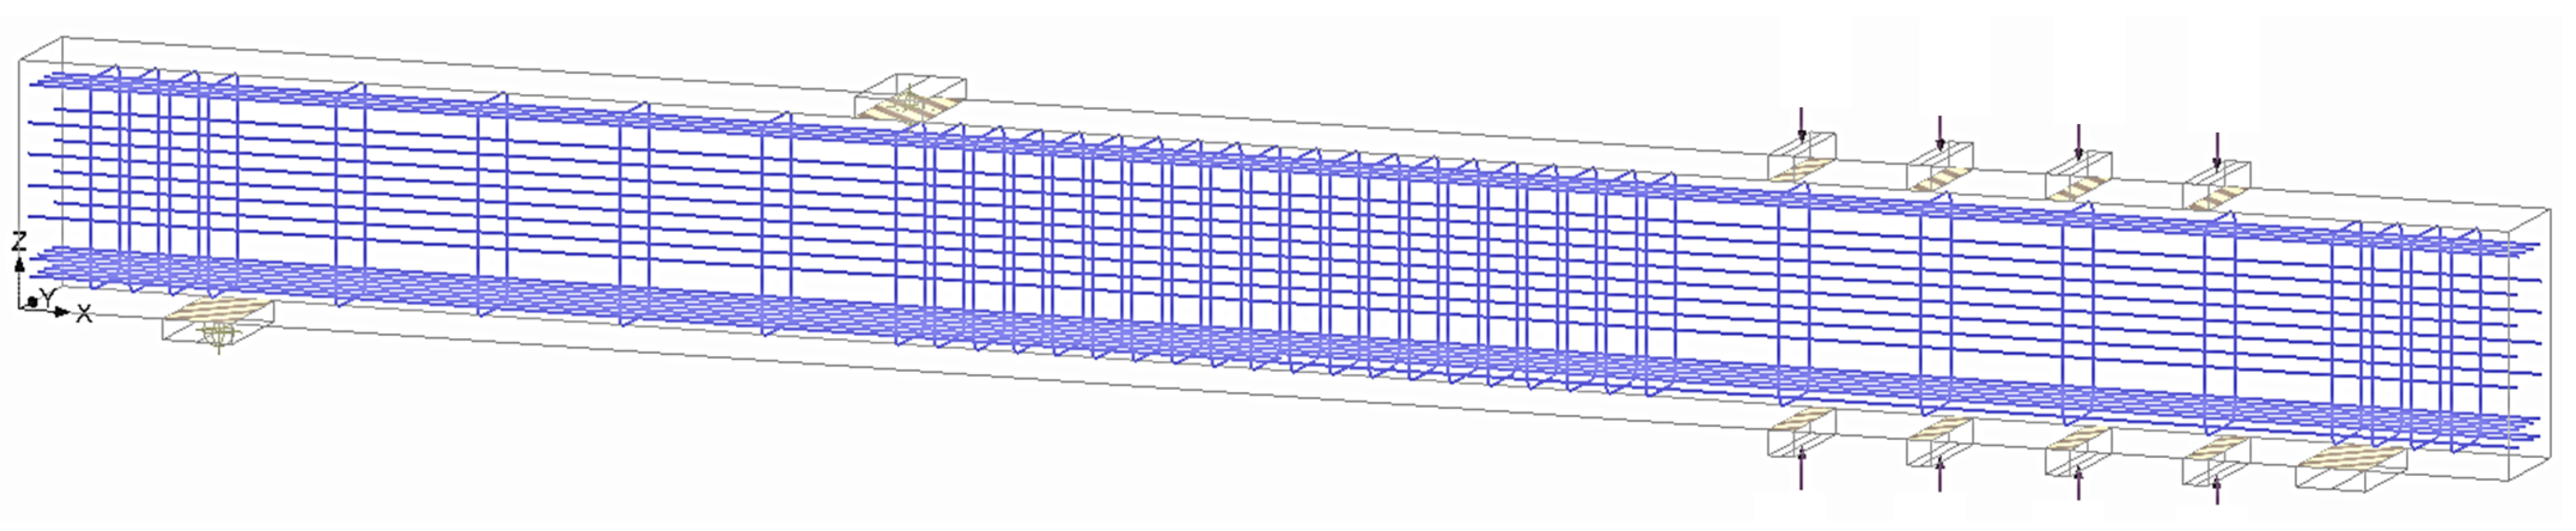
4.2. Geometry
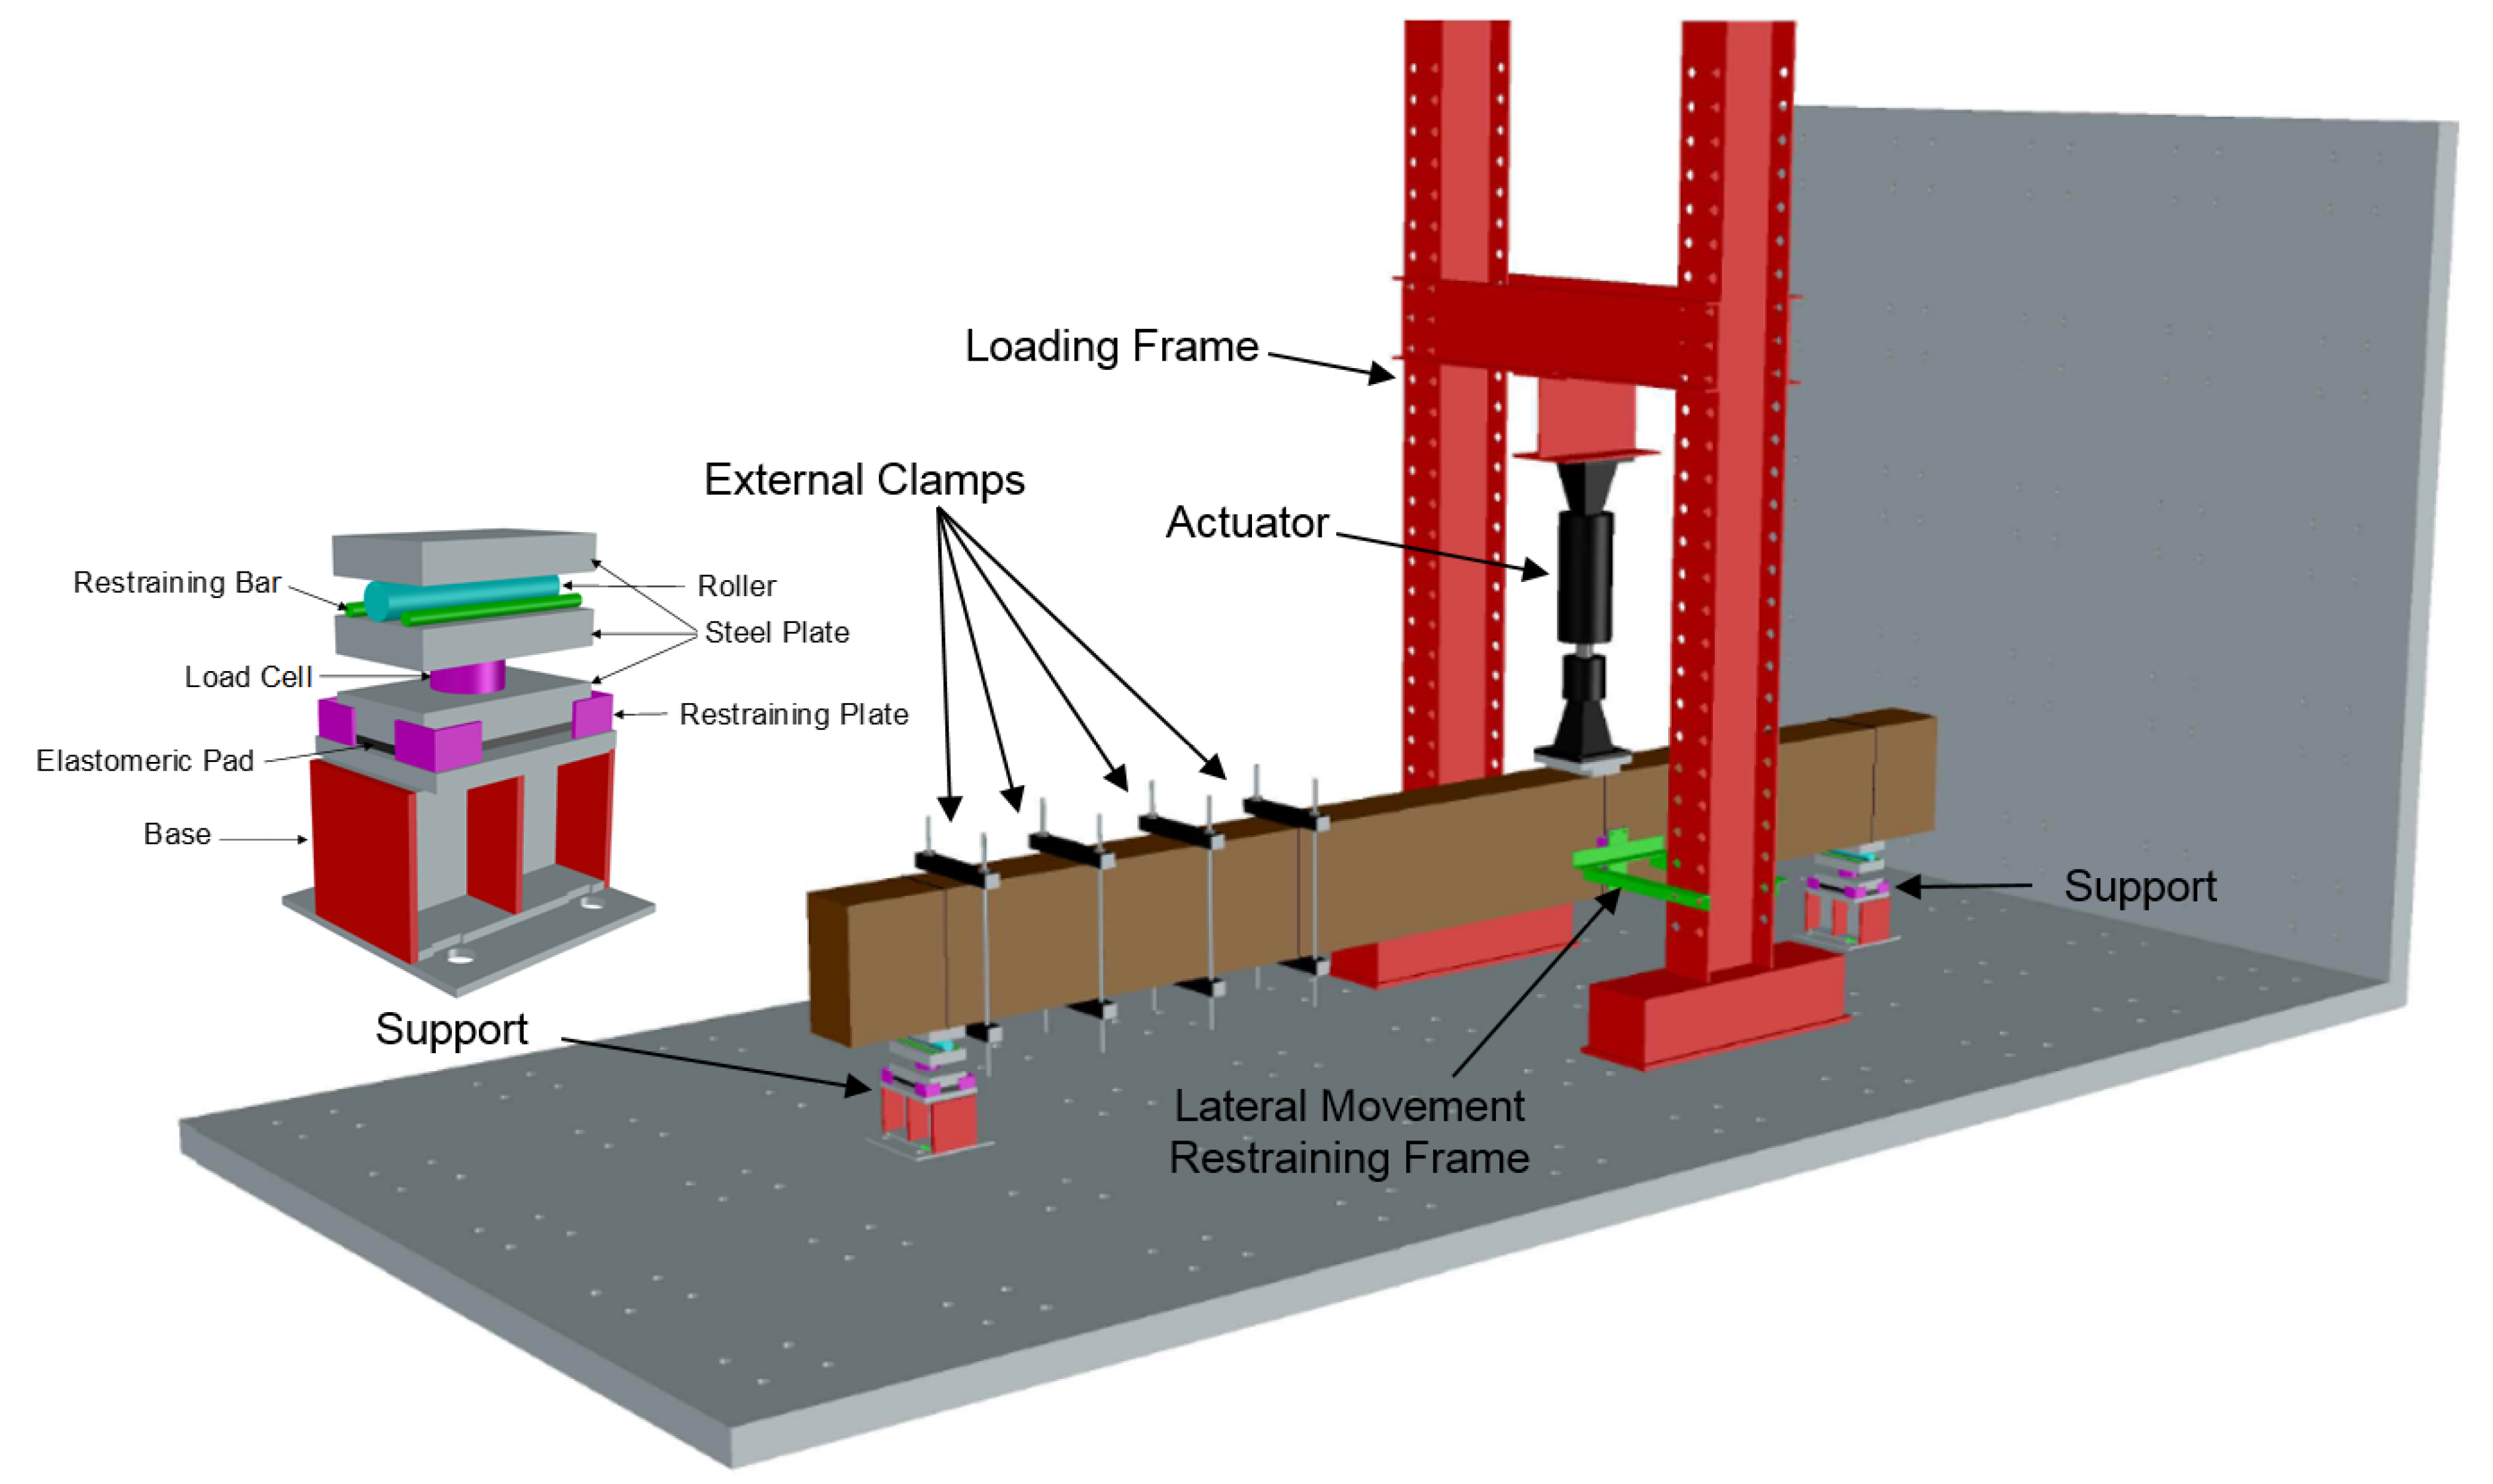
4.3. Loading and Boundary Conditions
4.4. Solution Method
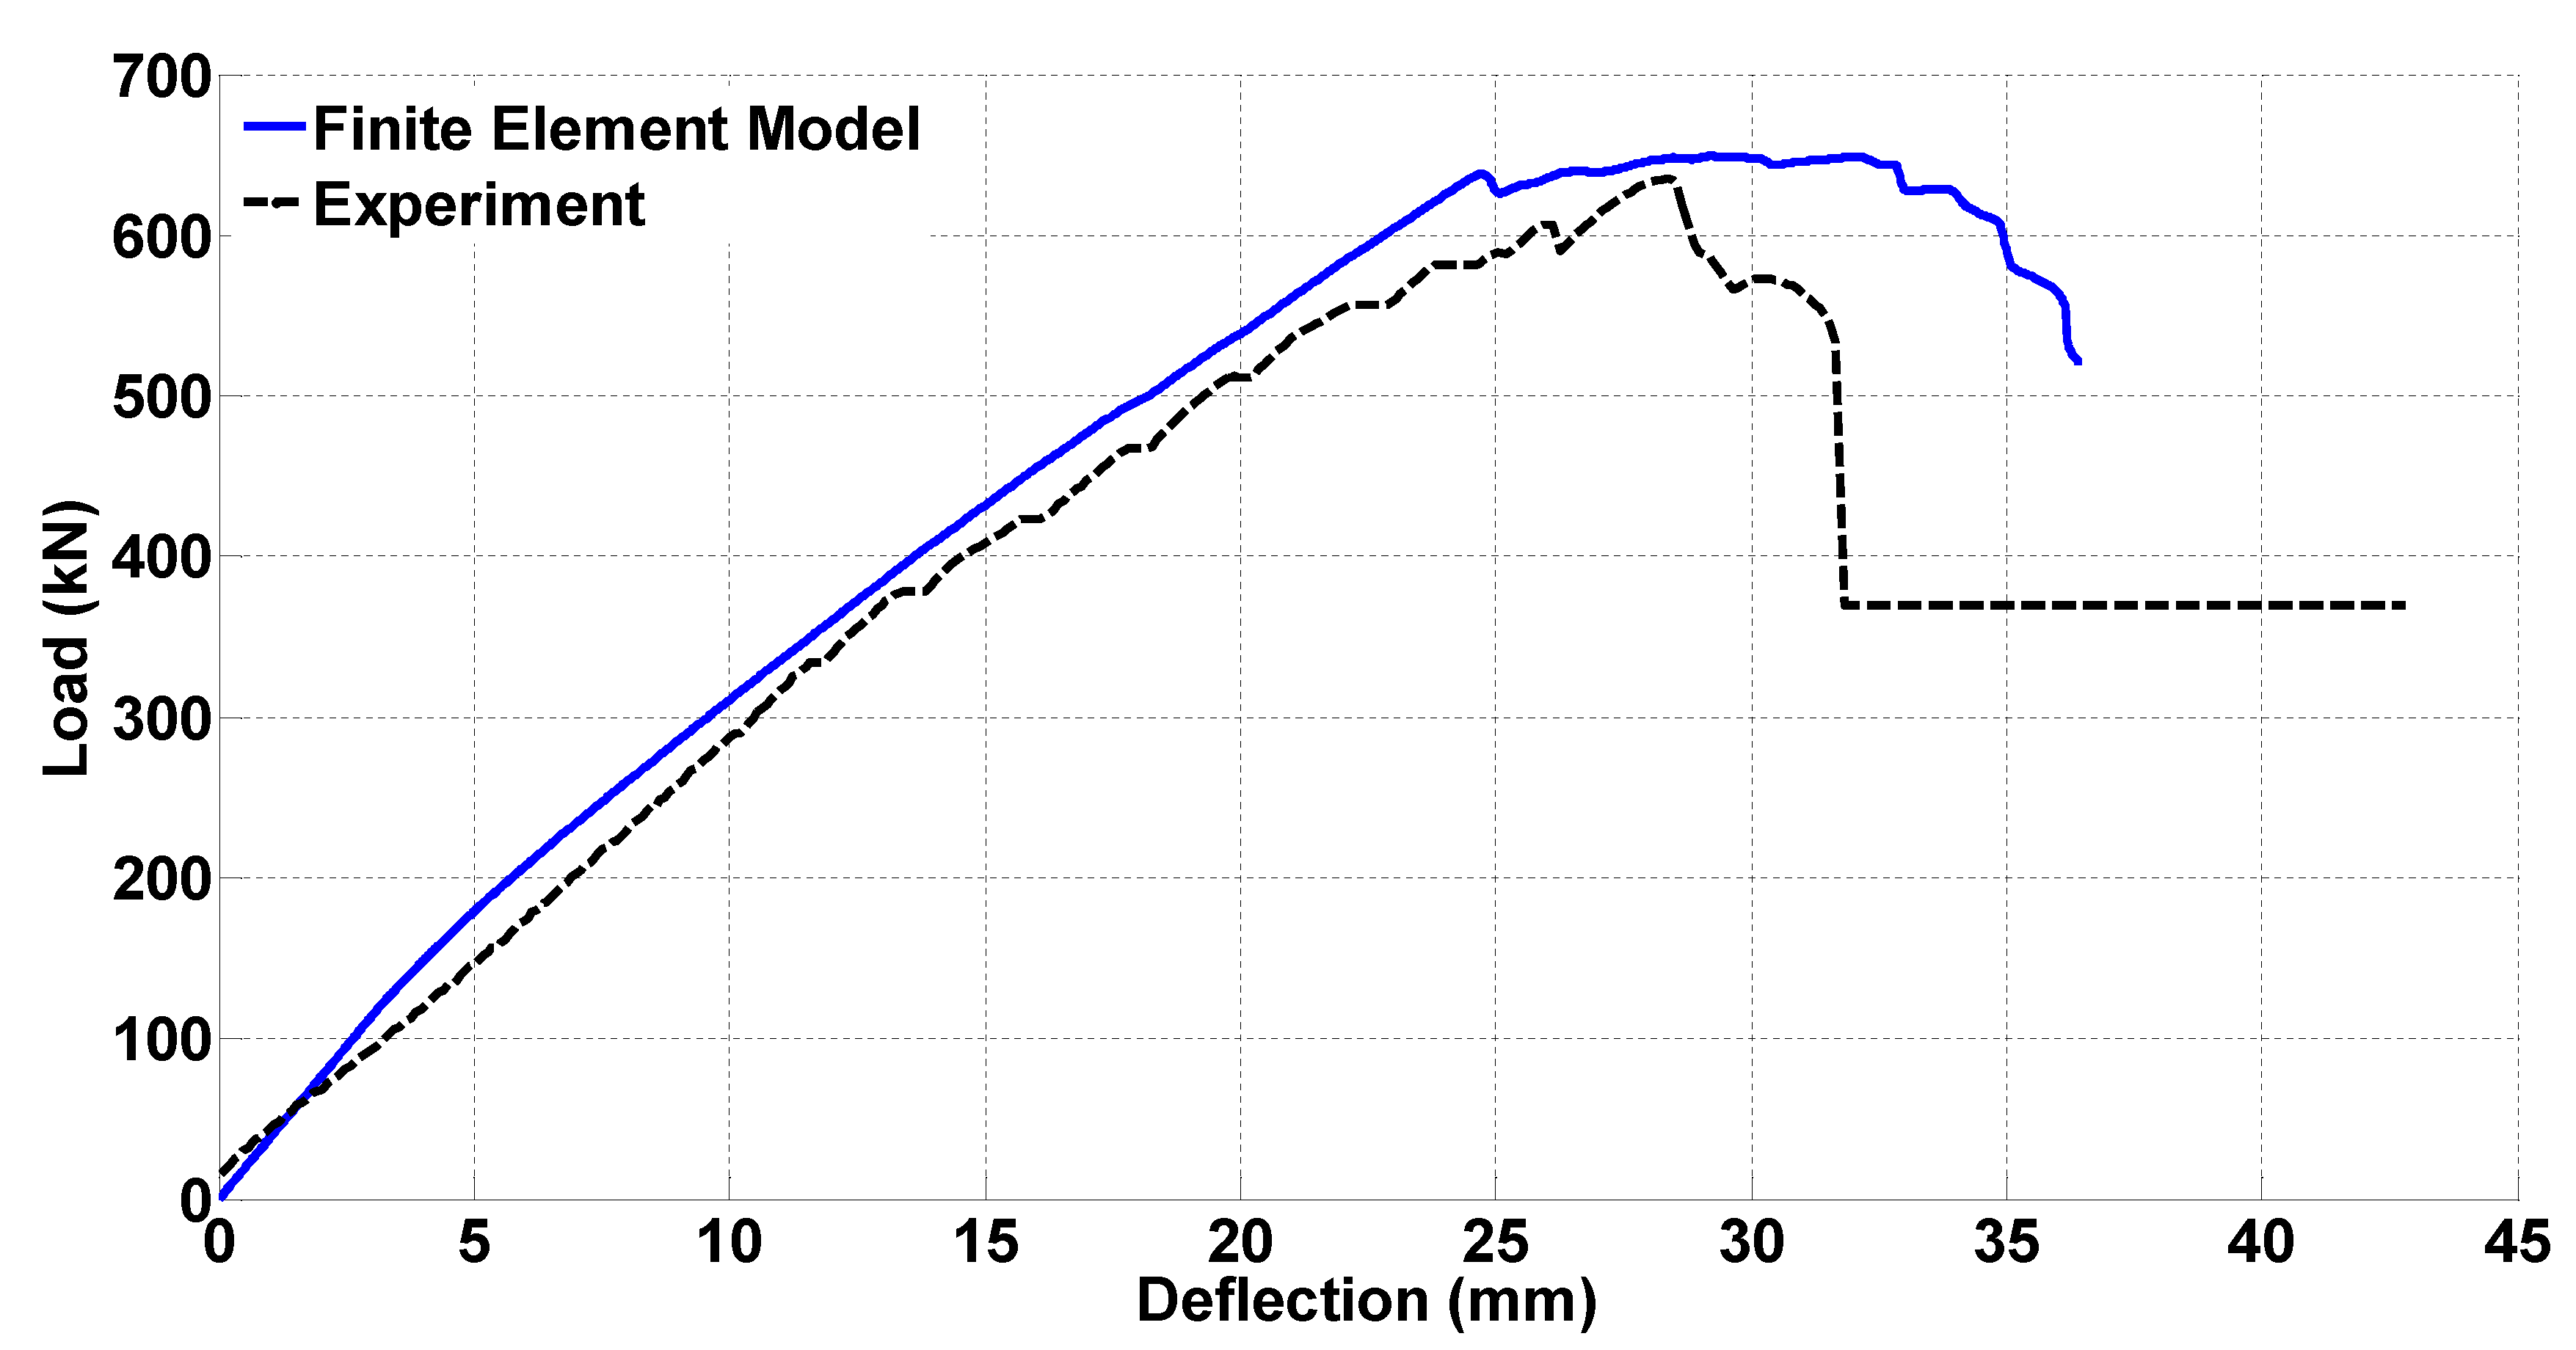
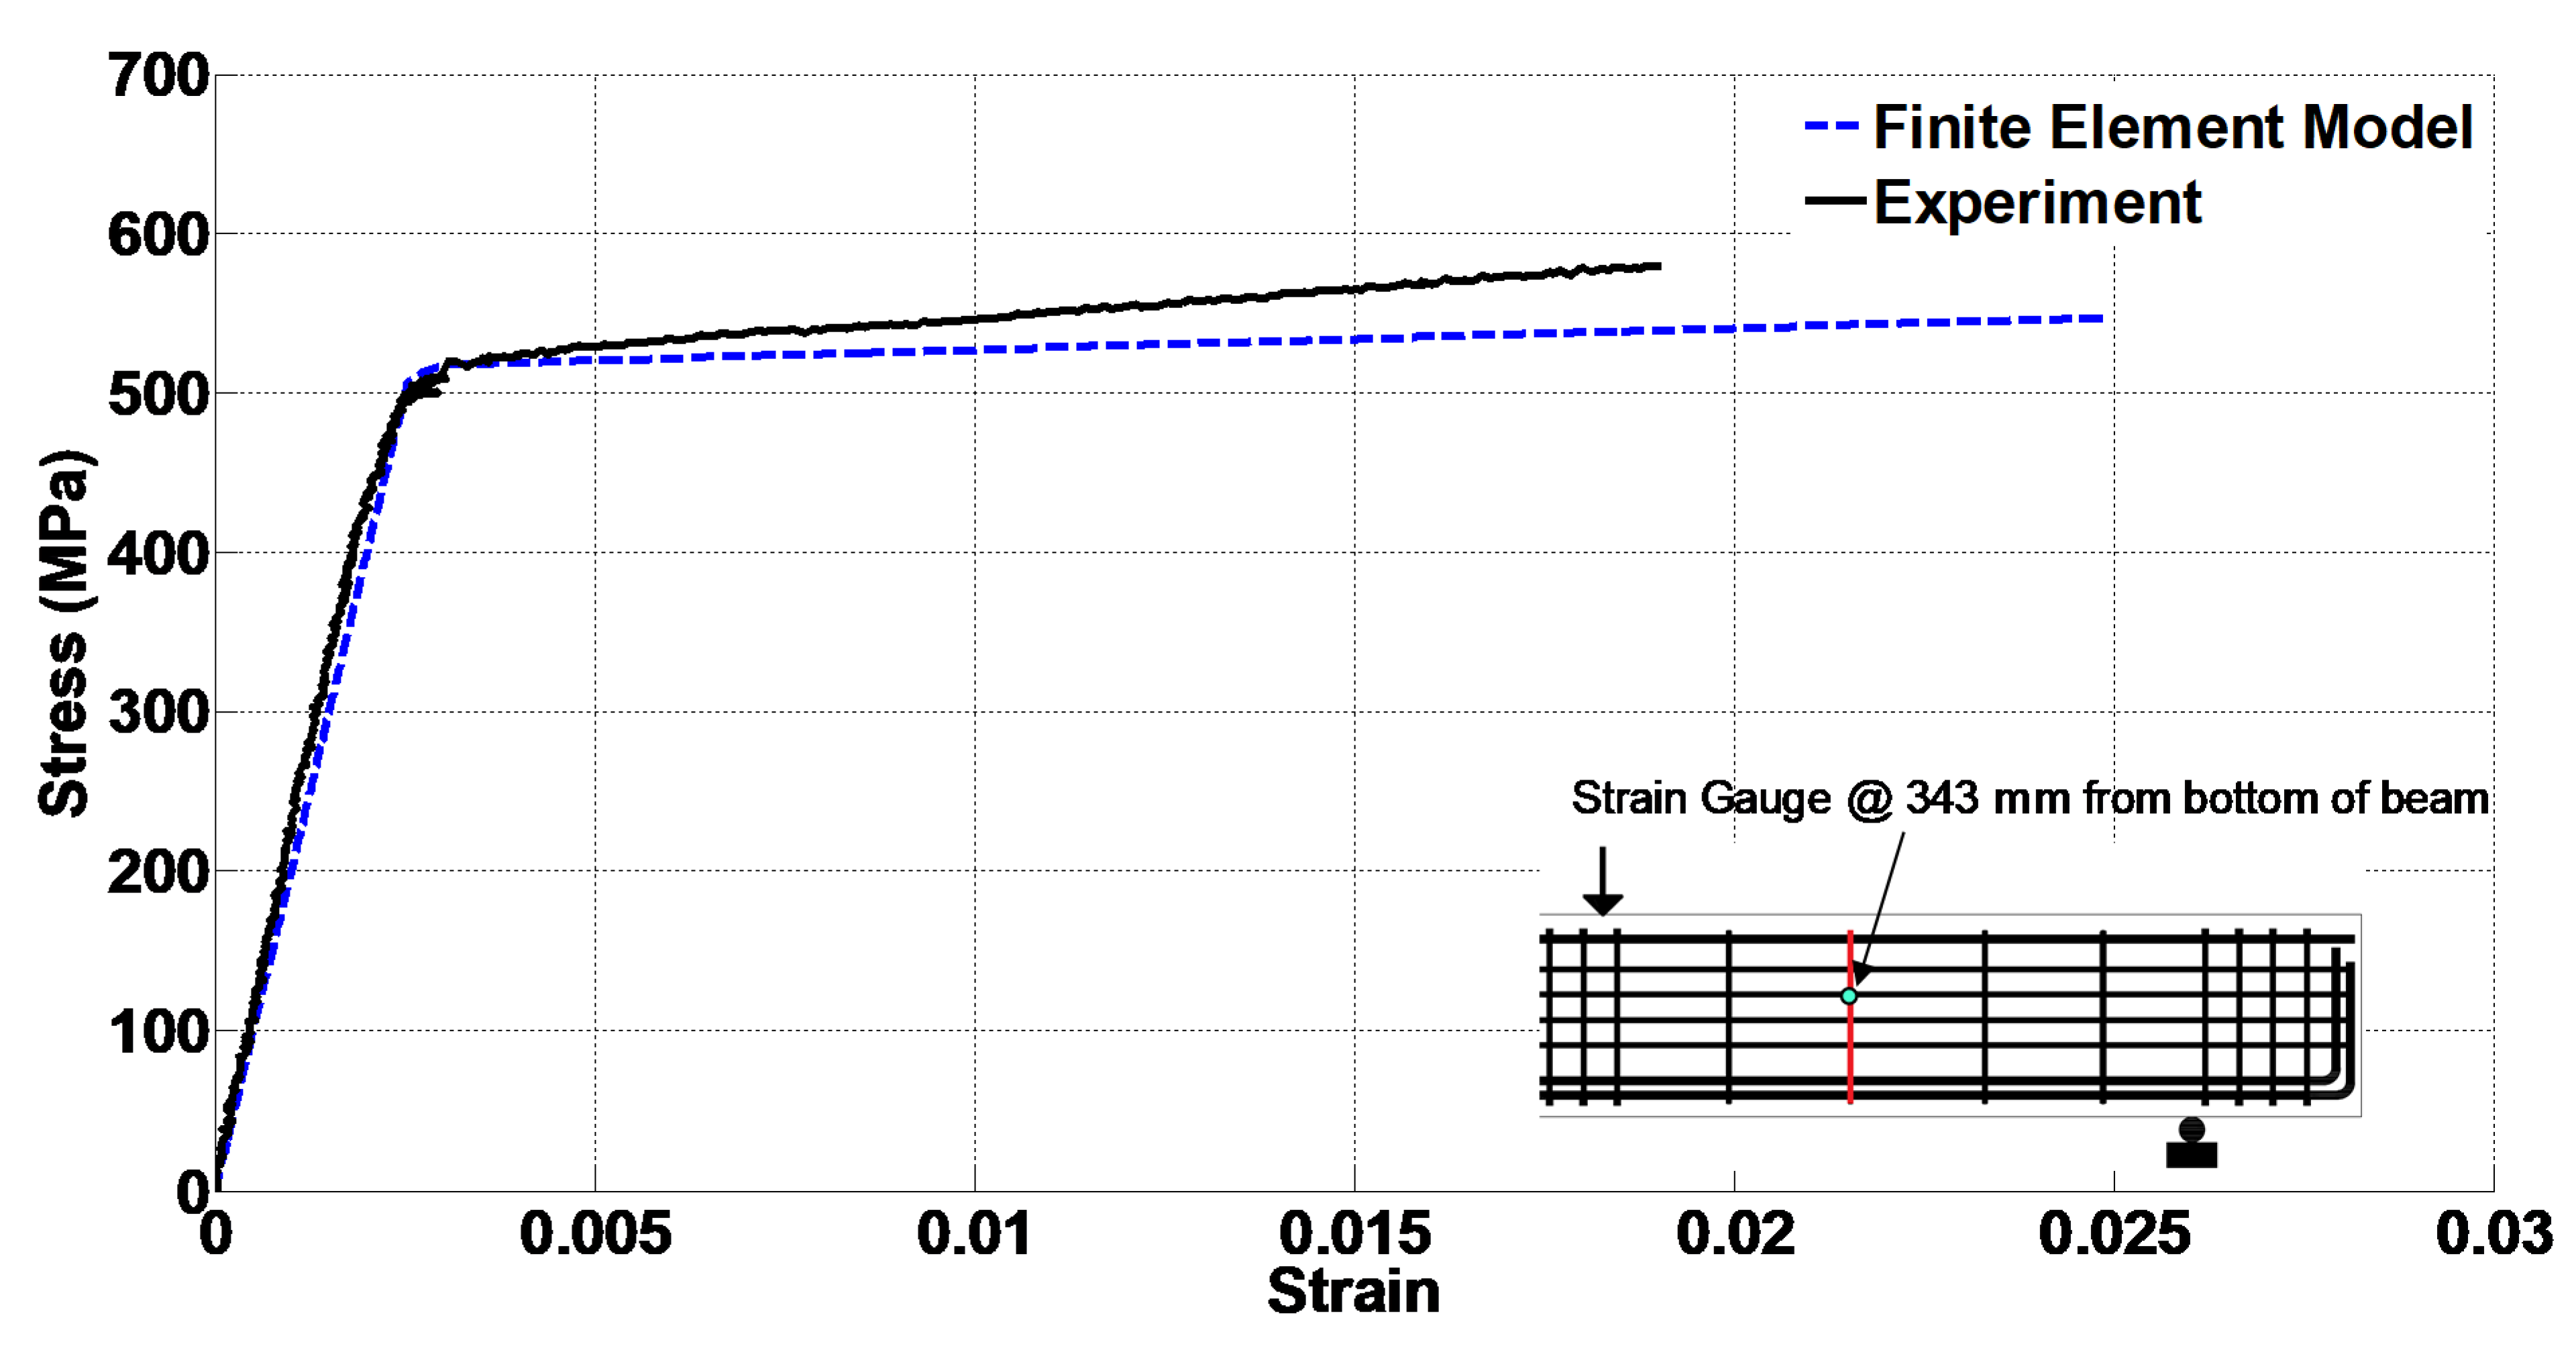
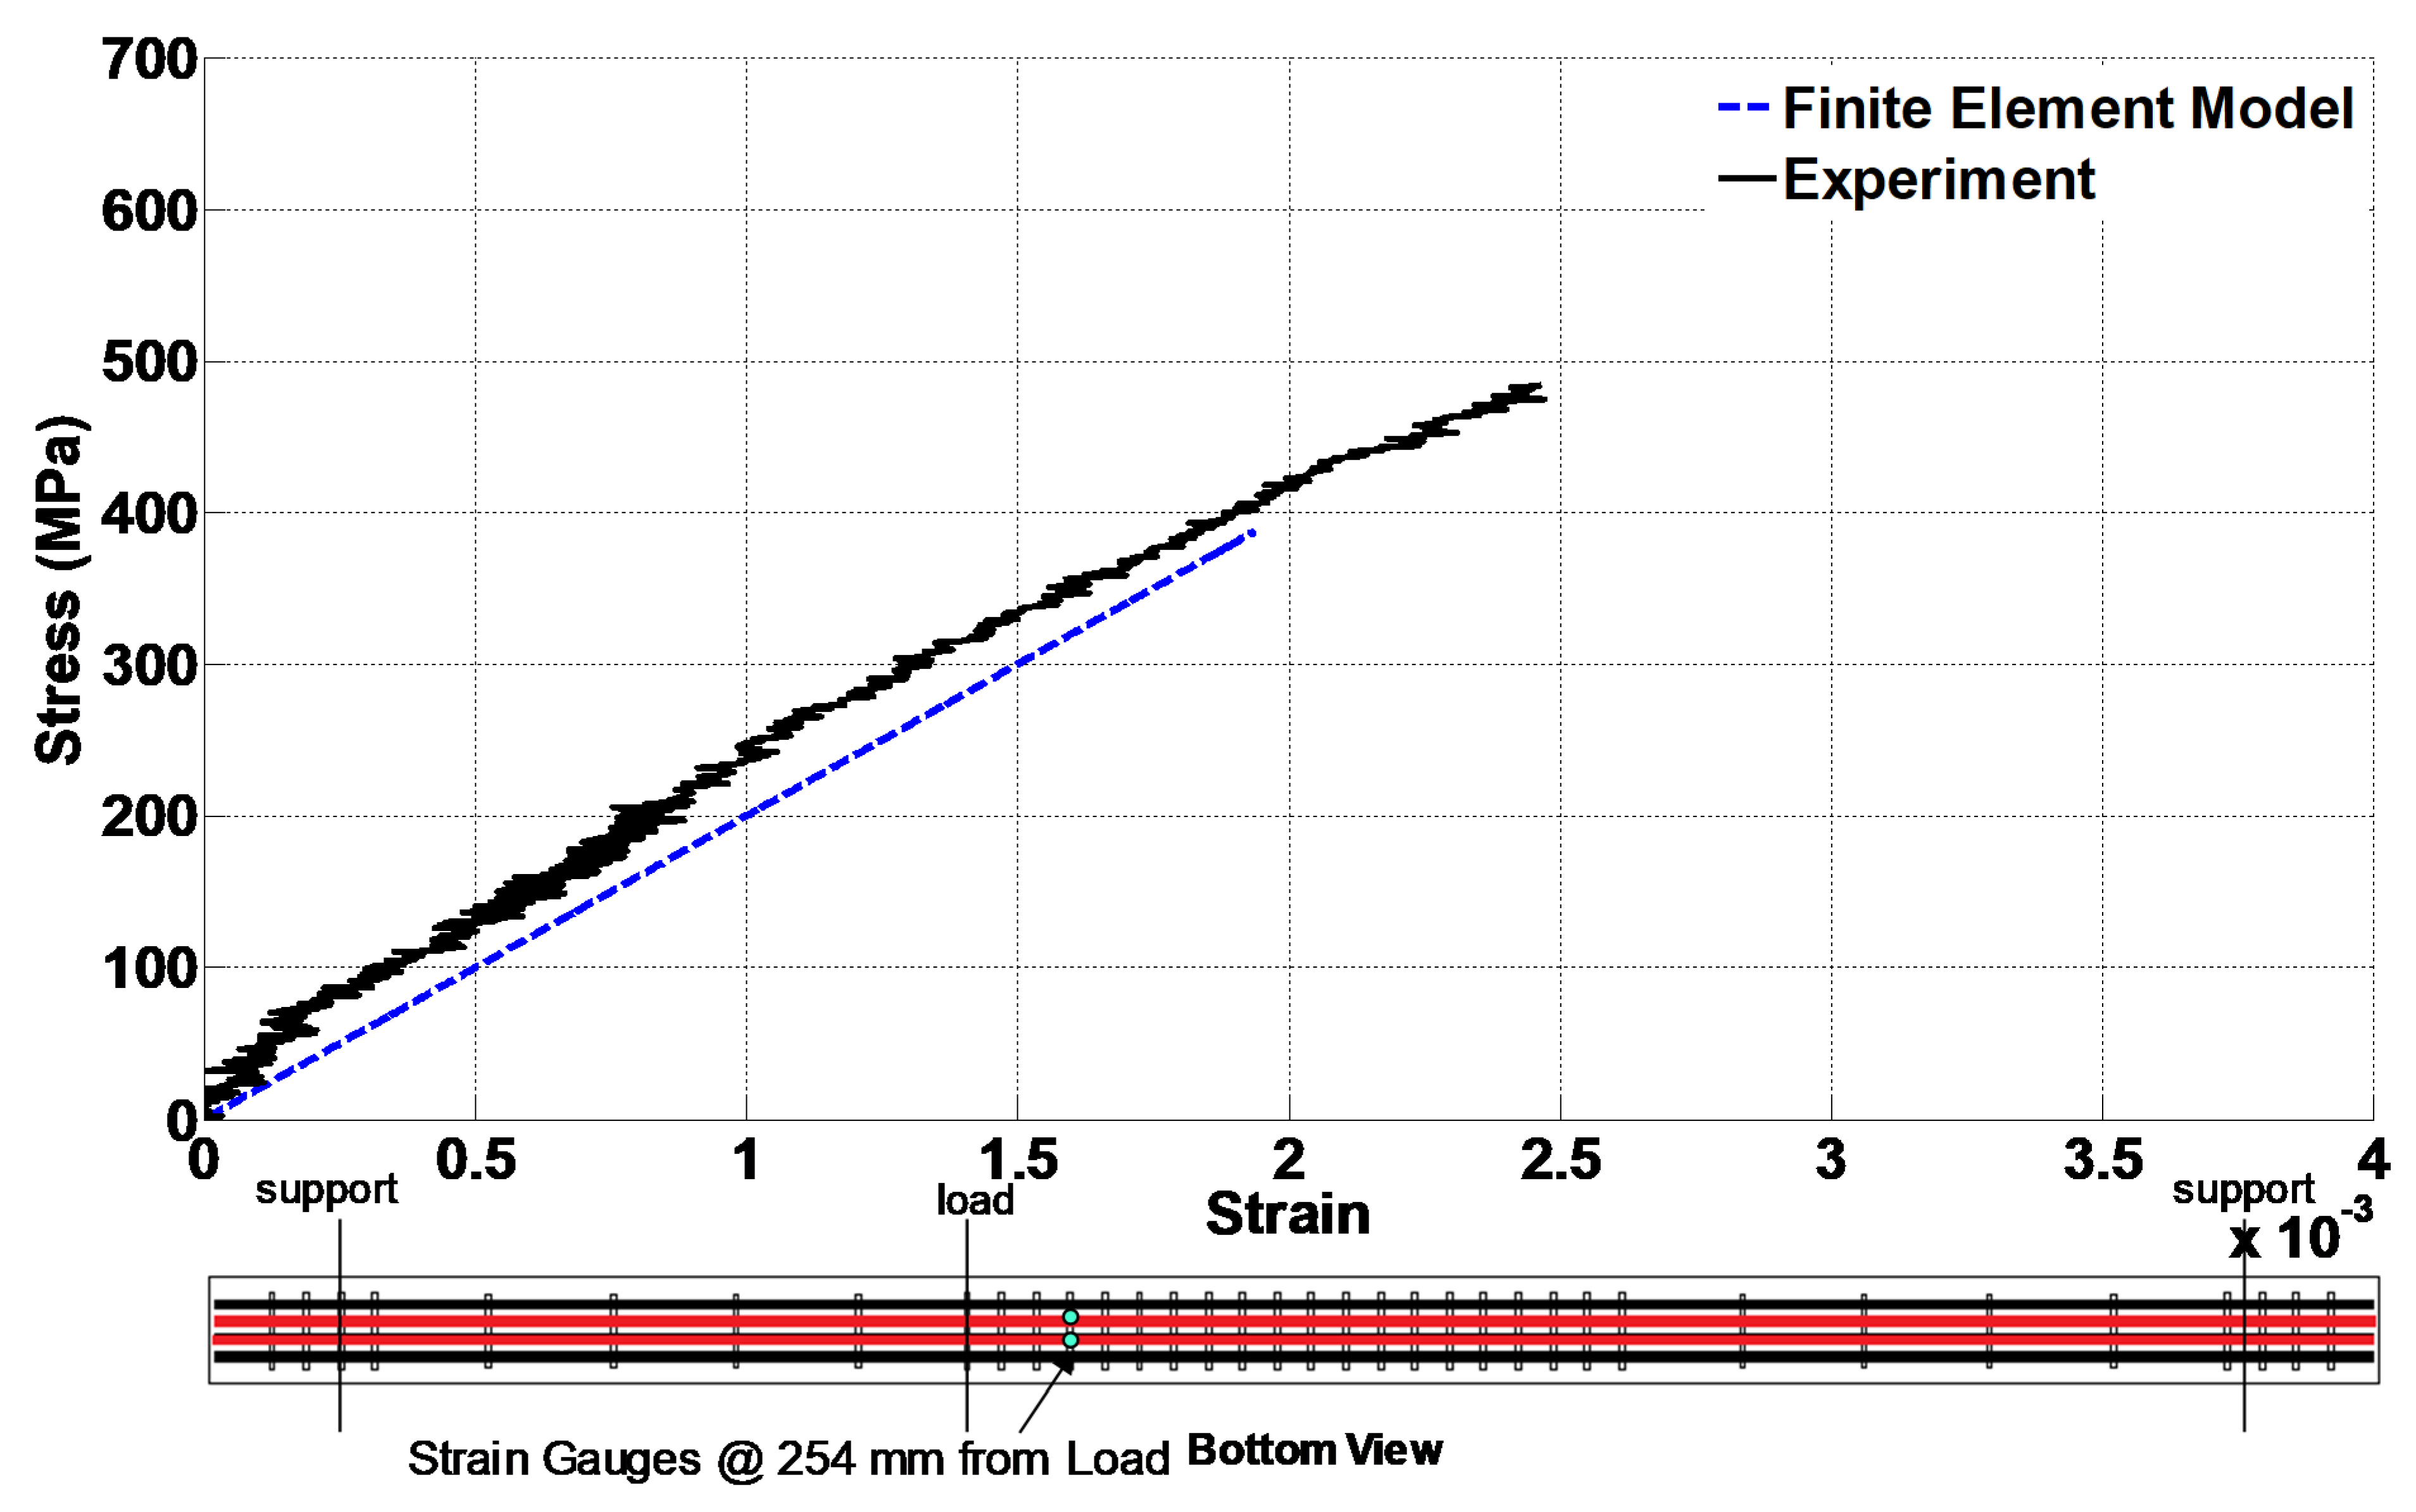
4.5. Model Validation
4.6. Parametric Study
5. Conclusions
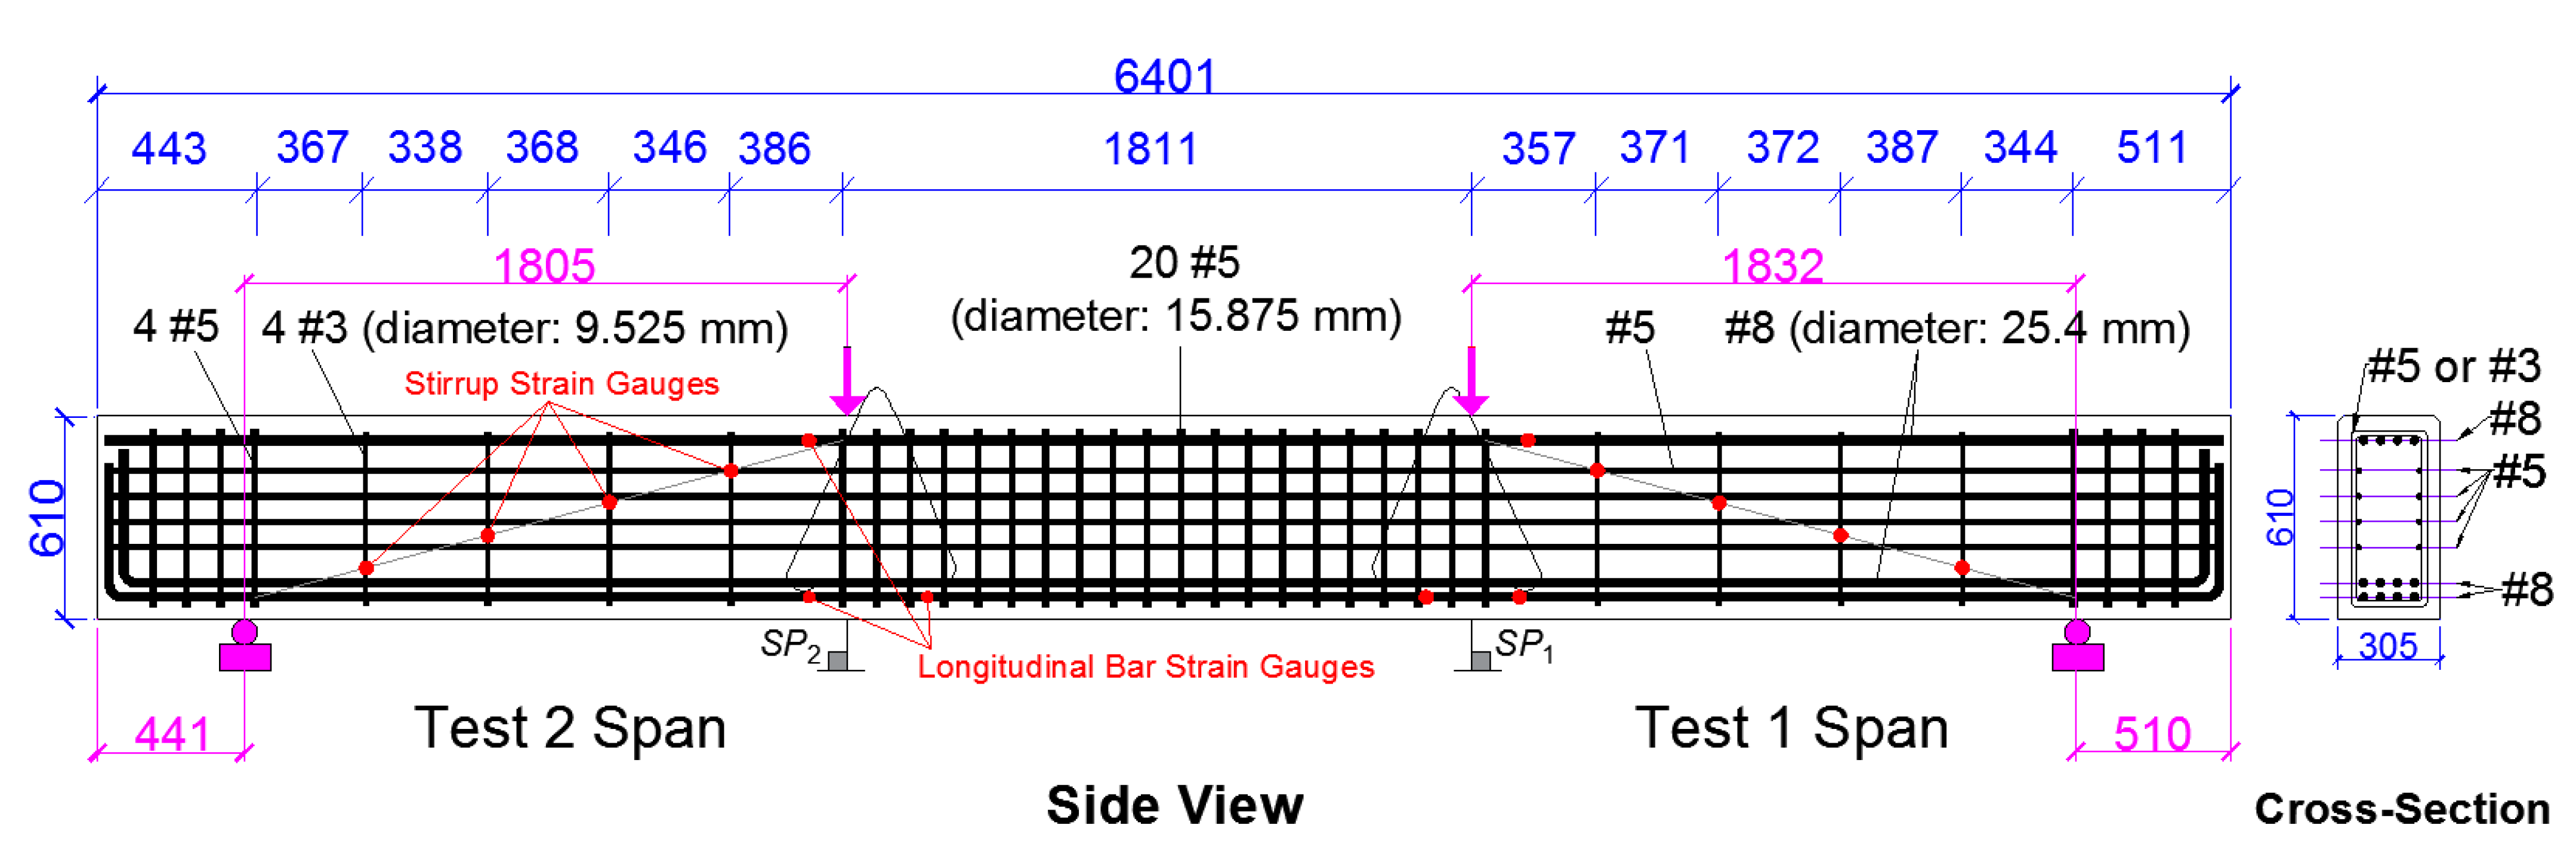
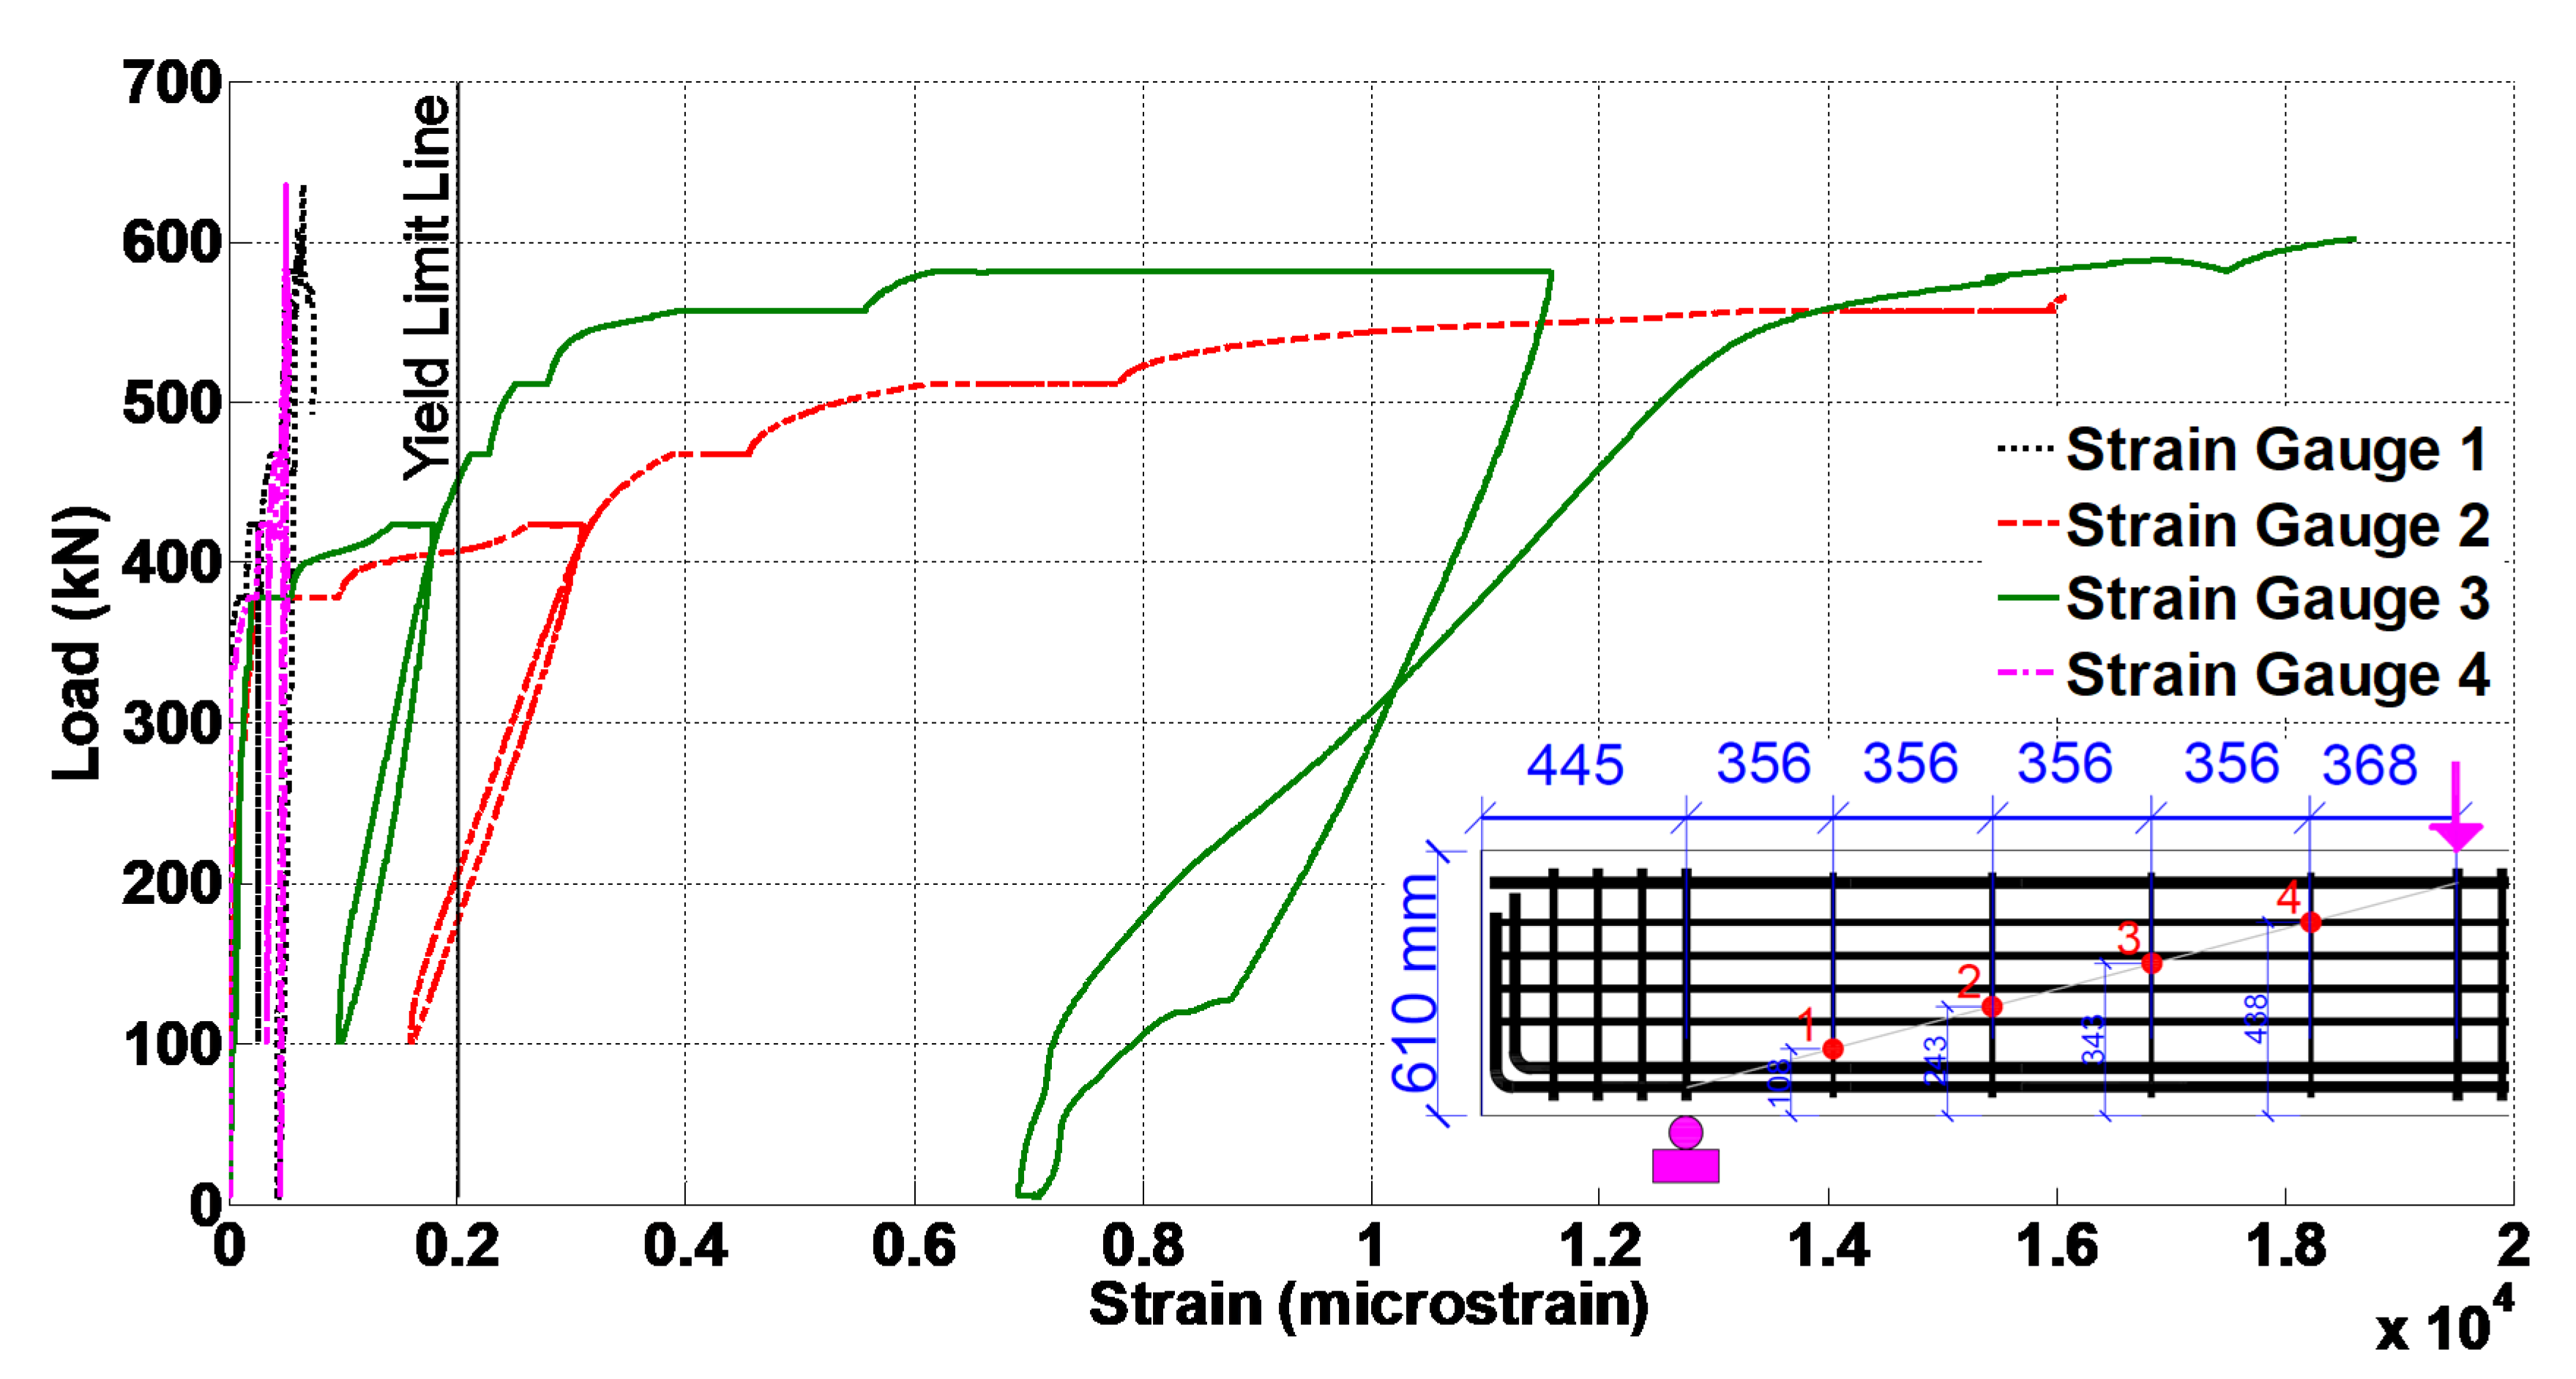
- The shear tests indicated that the nonlinear shear behavior governed the response of the beams with span to depth ratios of 2.9, a shear reinforcement ratio of 0.13%, and a longitudinal reinforcement ratio of 4.2%. This was confirmed based on the data from the strain gauges installed on the shear and longitudinal reinforcement.
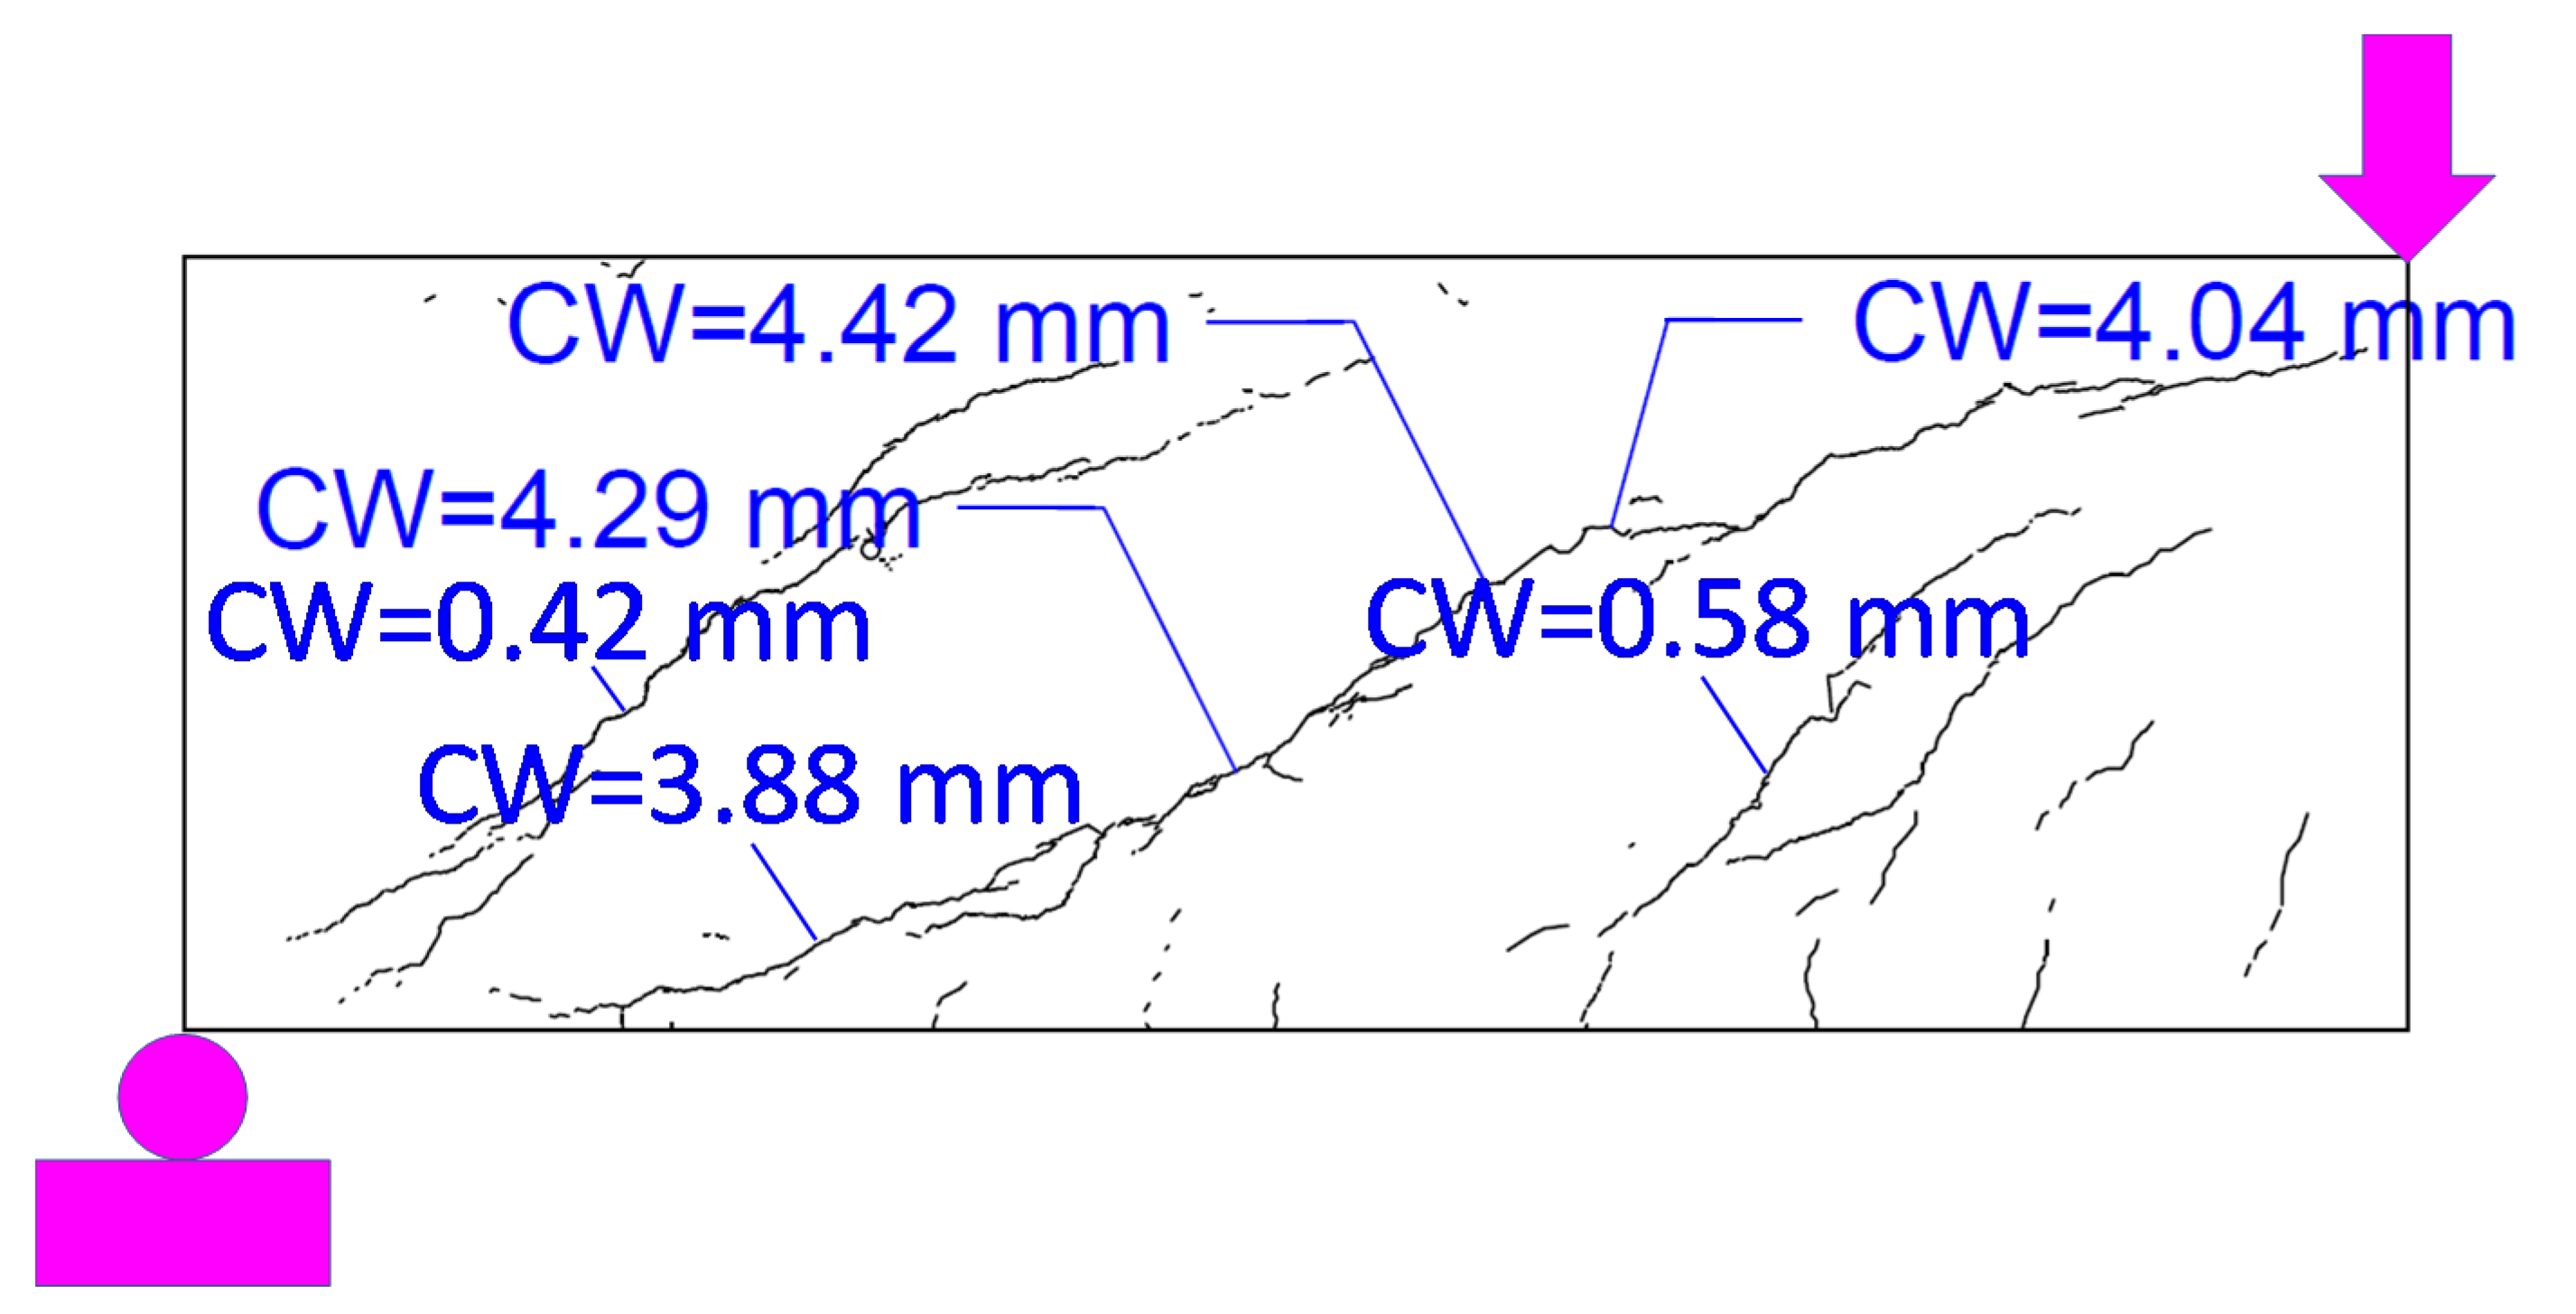
- The major diagonal shear cracks were from the top corner loading point towards the bottom corner support. Some secondary diagonal shear cracks also occurred between the top corner loading point and the middle of the span at the bottom and between the bottom corner support and the middle of the span at the top.
- The major shear cracks were more concentrated in the middle of shear span than towards the ends. Similarly, the stirrups close to the middle of shear span yielded while the stirrups close to the loading point and support remained elastic throughout the test.
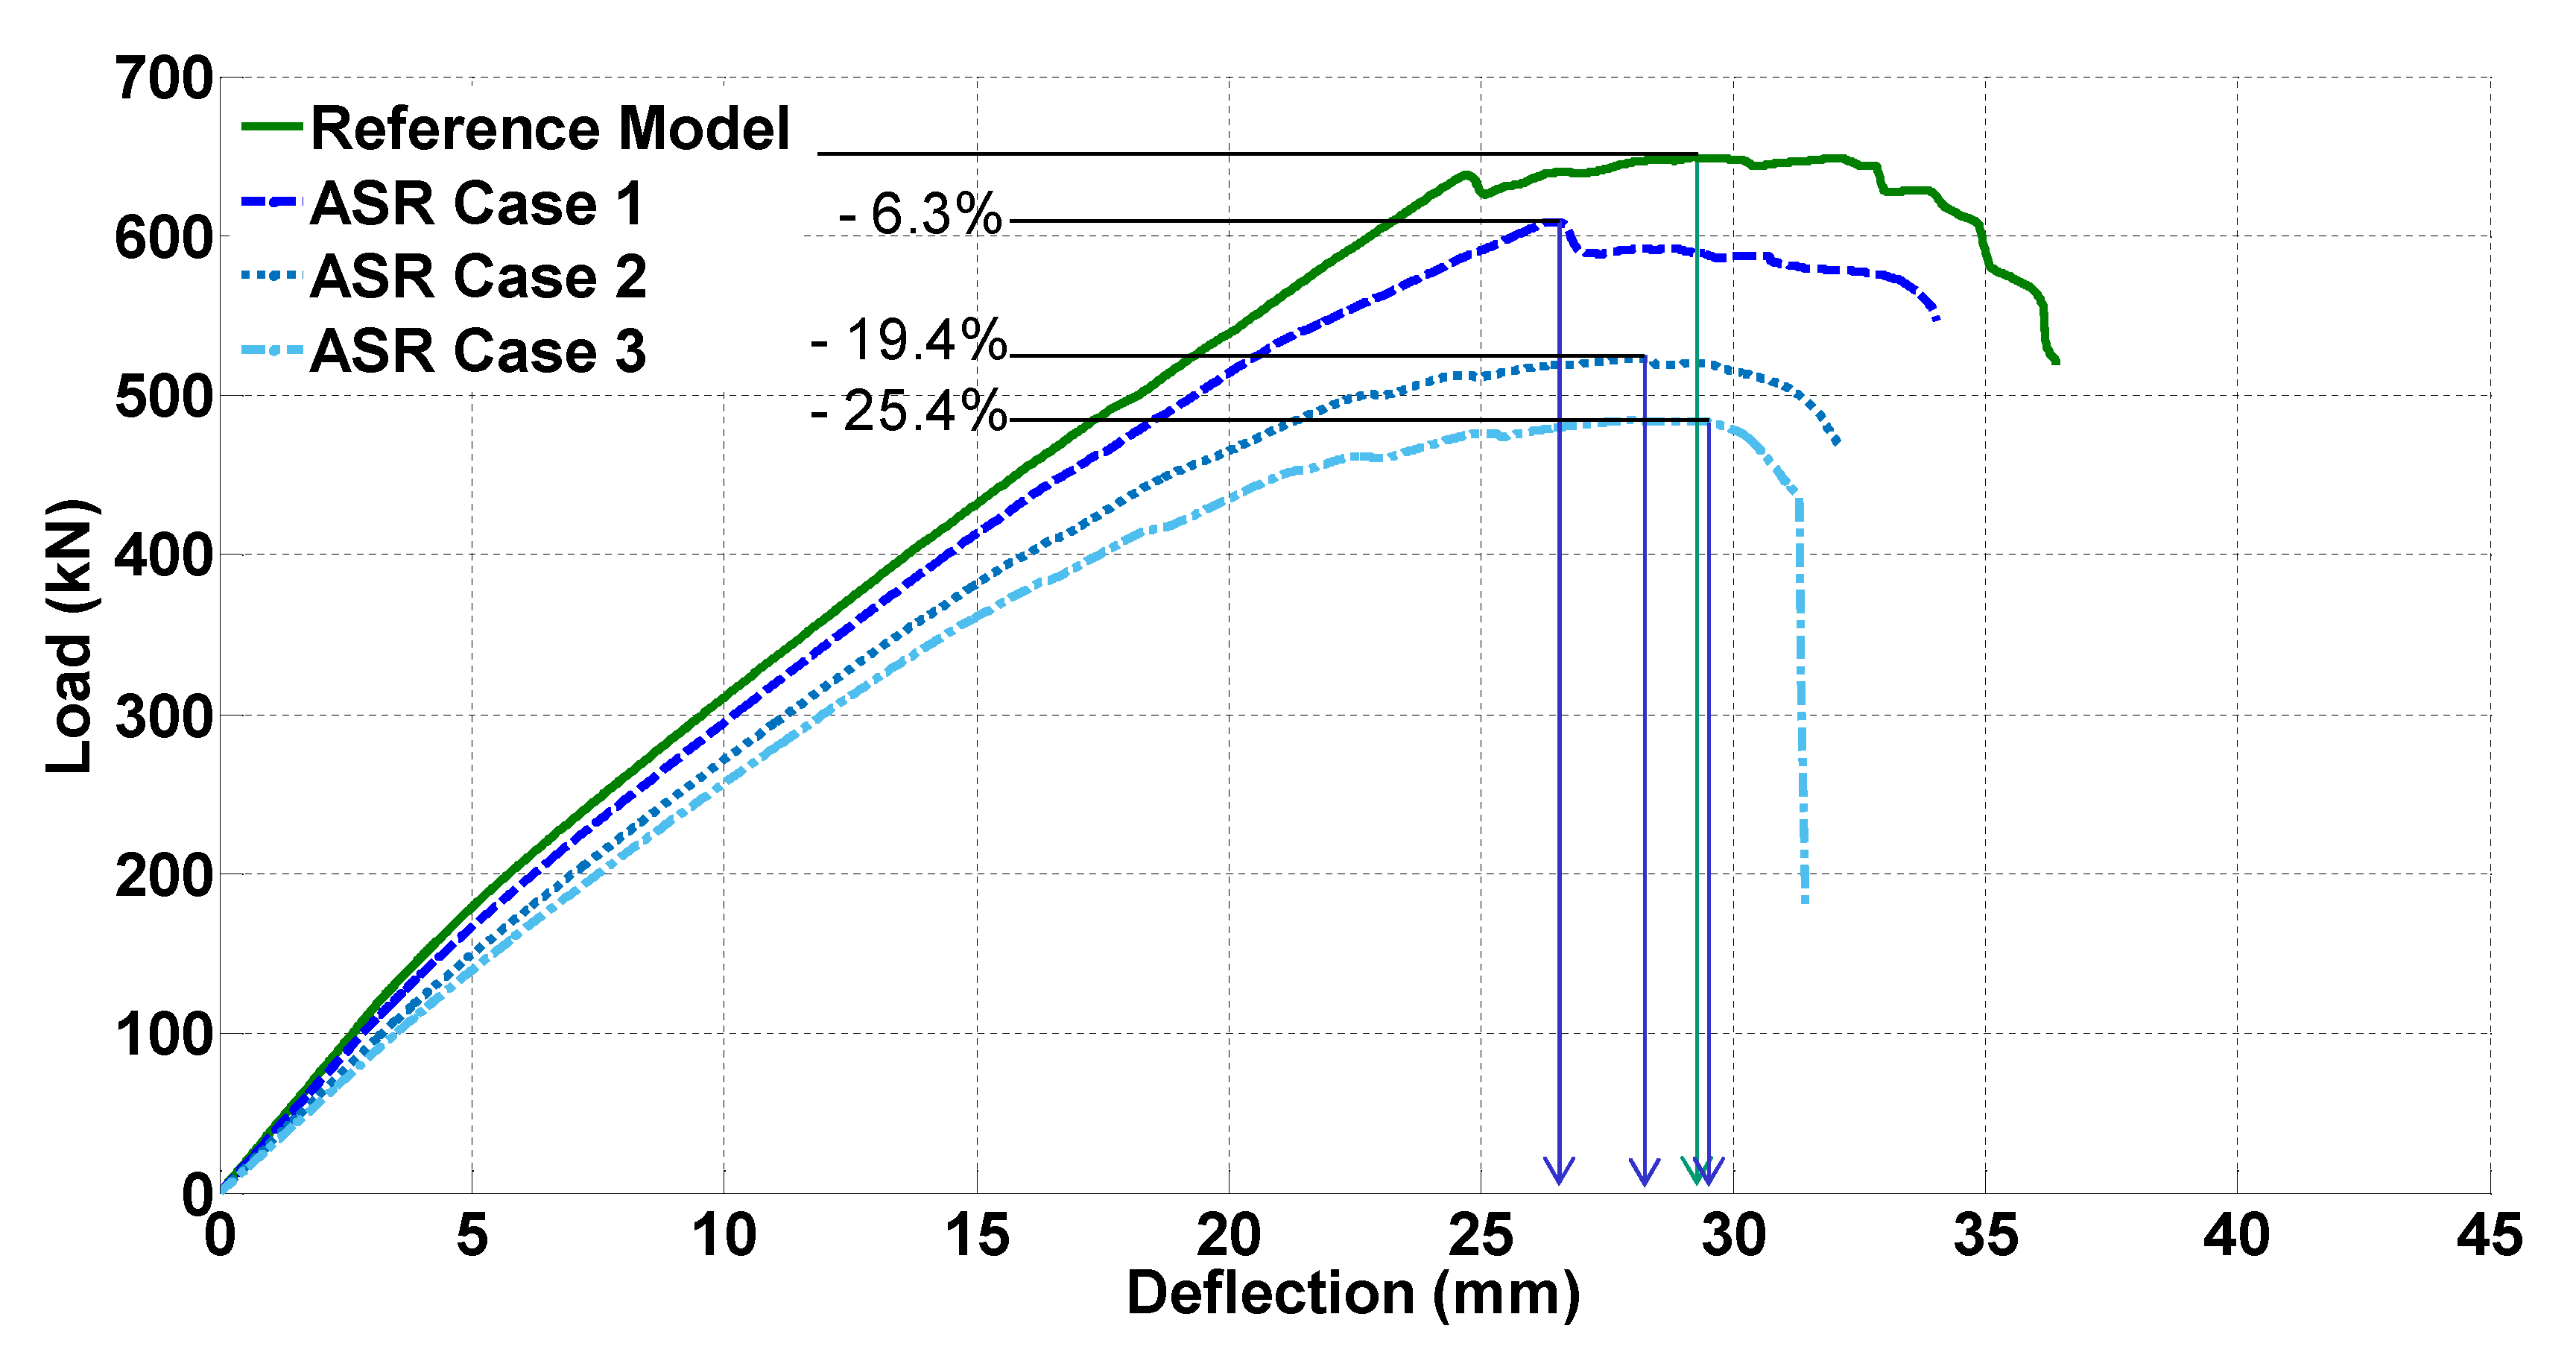
- According to the parametric study using the validated FEM, 0.2%, 0.4%, and 0.6% of ASR expansion induced 6.3%, 19.4%, and 25.4% reduction in the shear capacity of the beams.
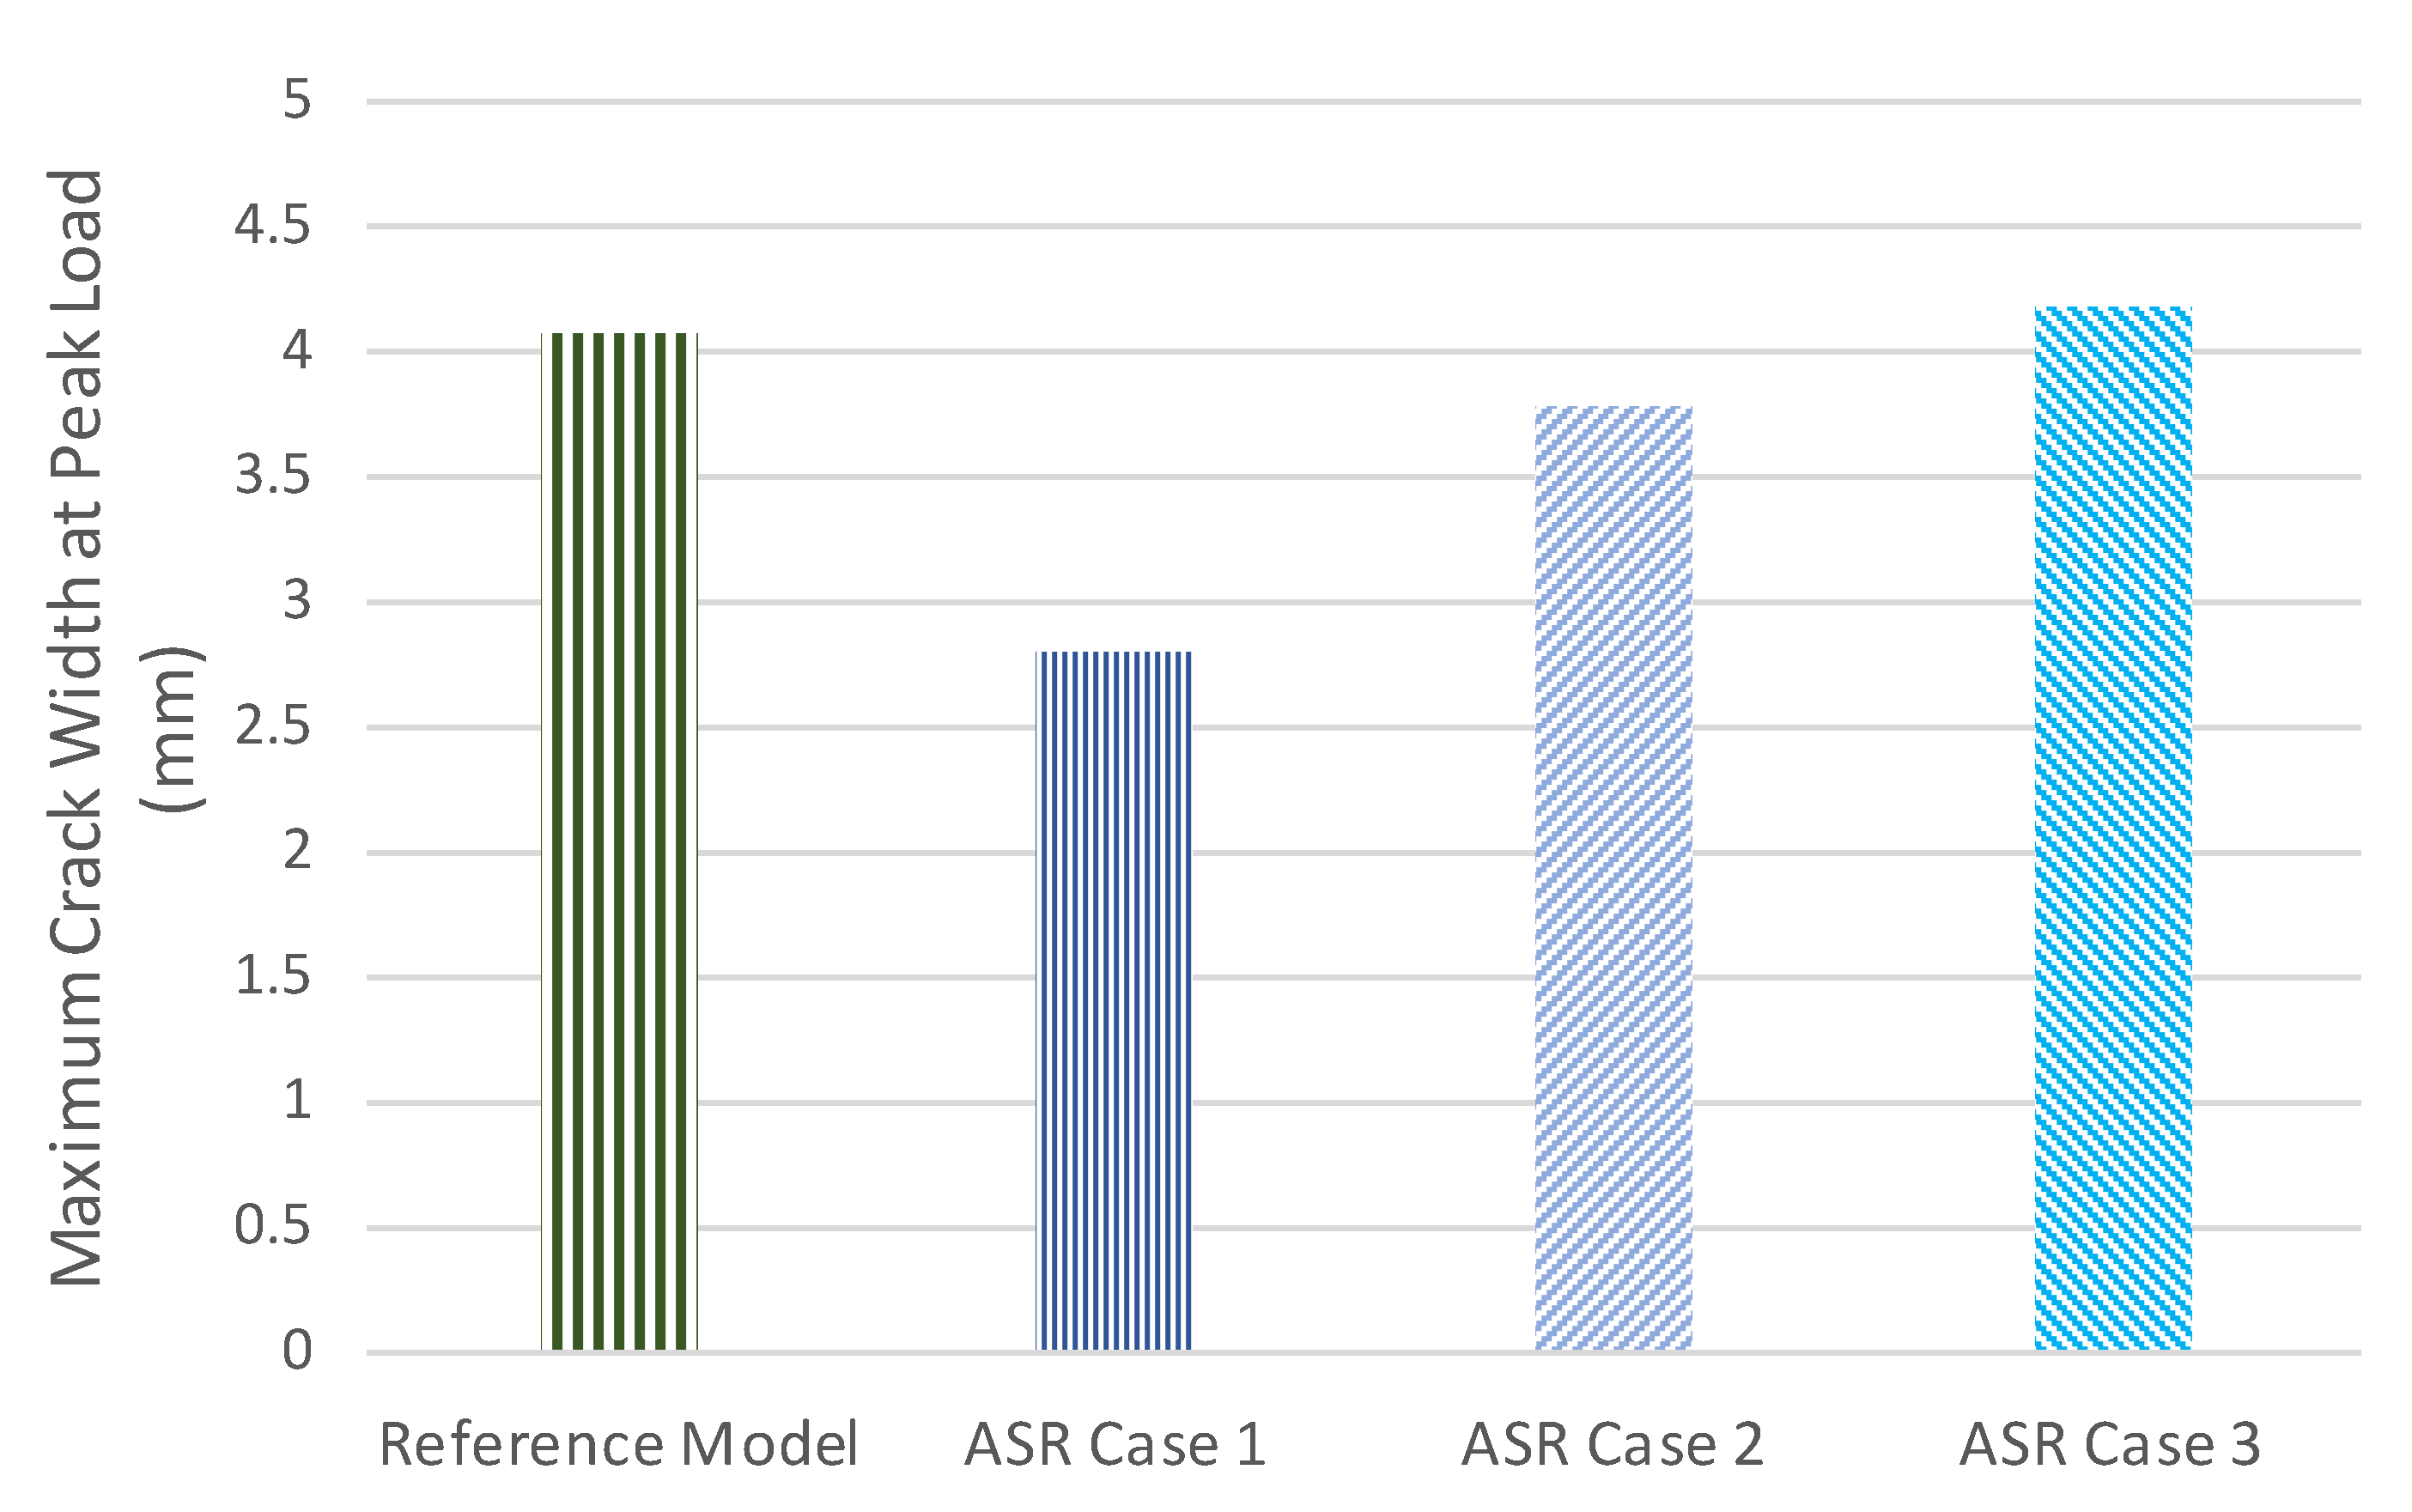
- For ASR degradation less than 0.4% expansion, the maximum crack width at peak load decreased compared to the reference model but as the ASR degradation progressed, the maximum crack width at peak load increased. For the highest level of ASR degradation with 0.6% expansion, the maximum crack width at peak load slightly exceeded that of the reference model. This happened due to the significant reduction in the beam stiffness, which caused higher deflection at a much lower peak load.
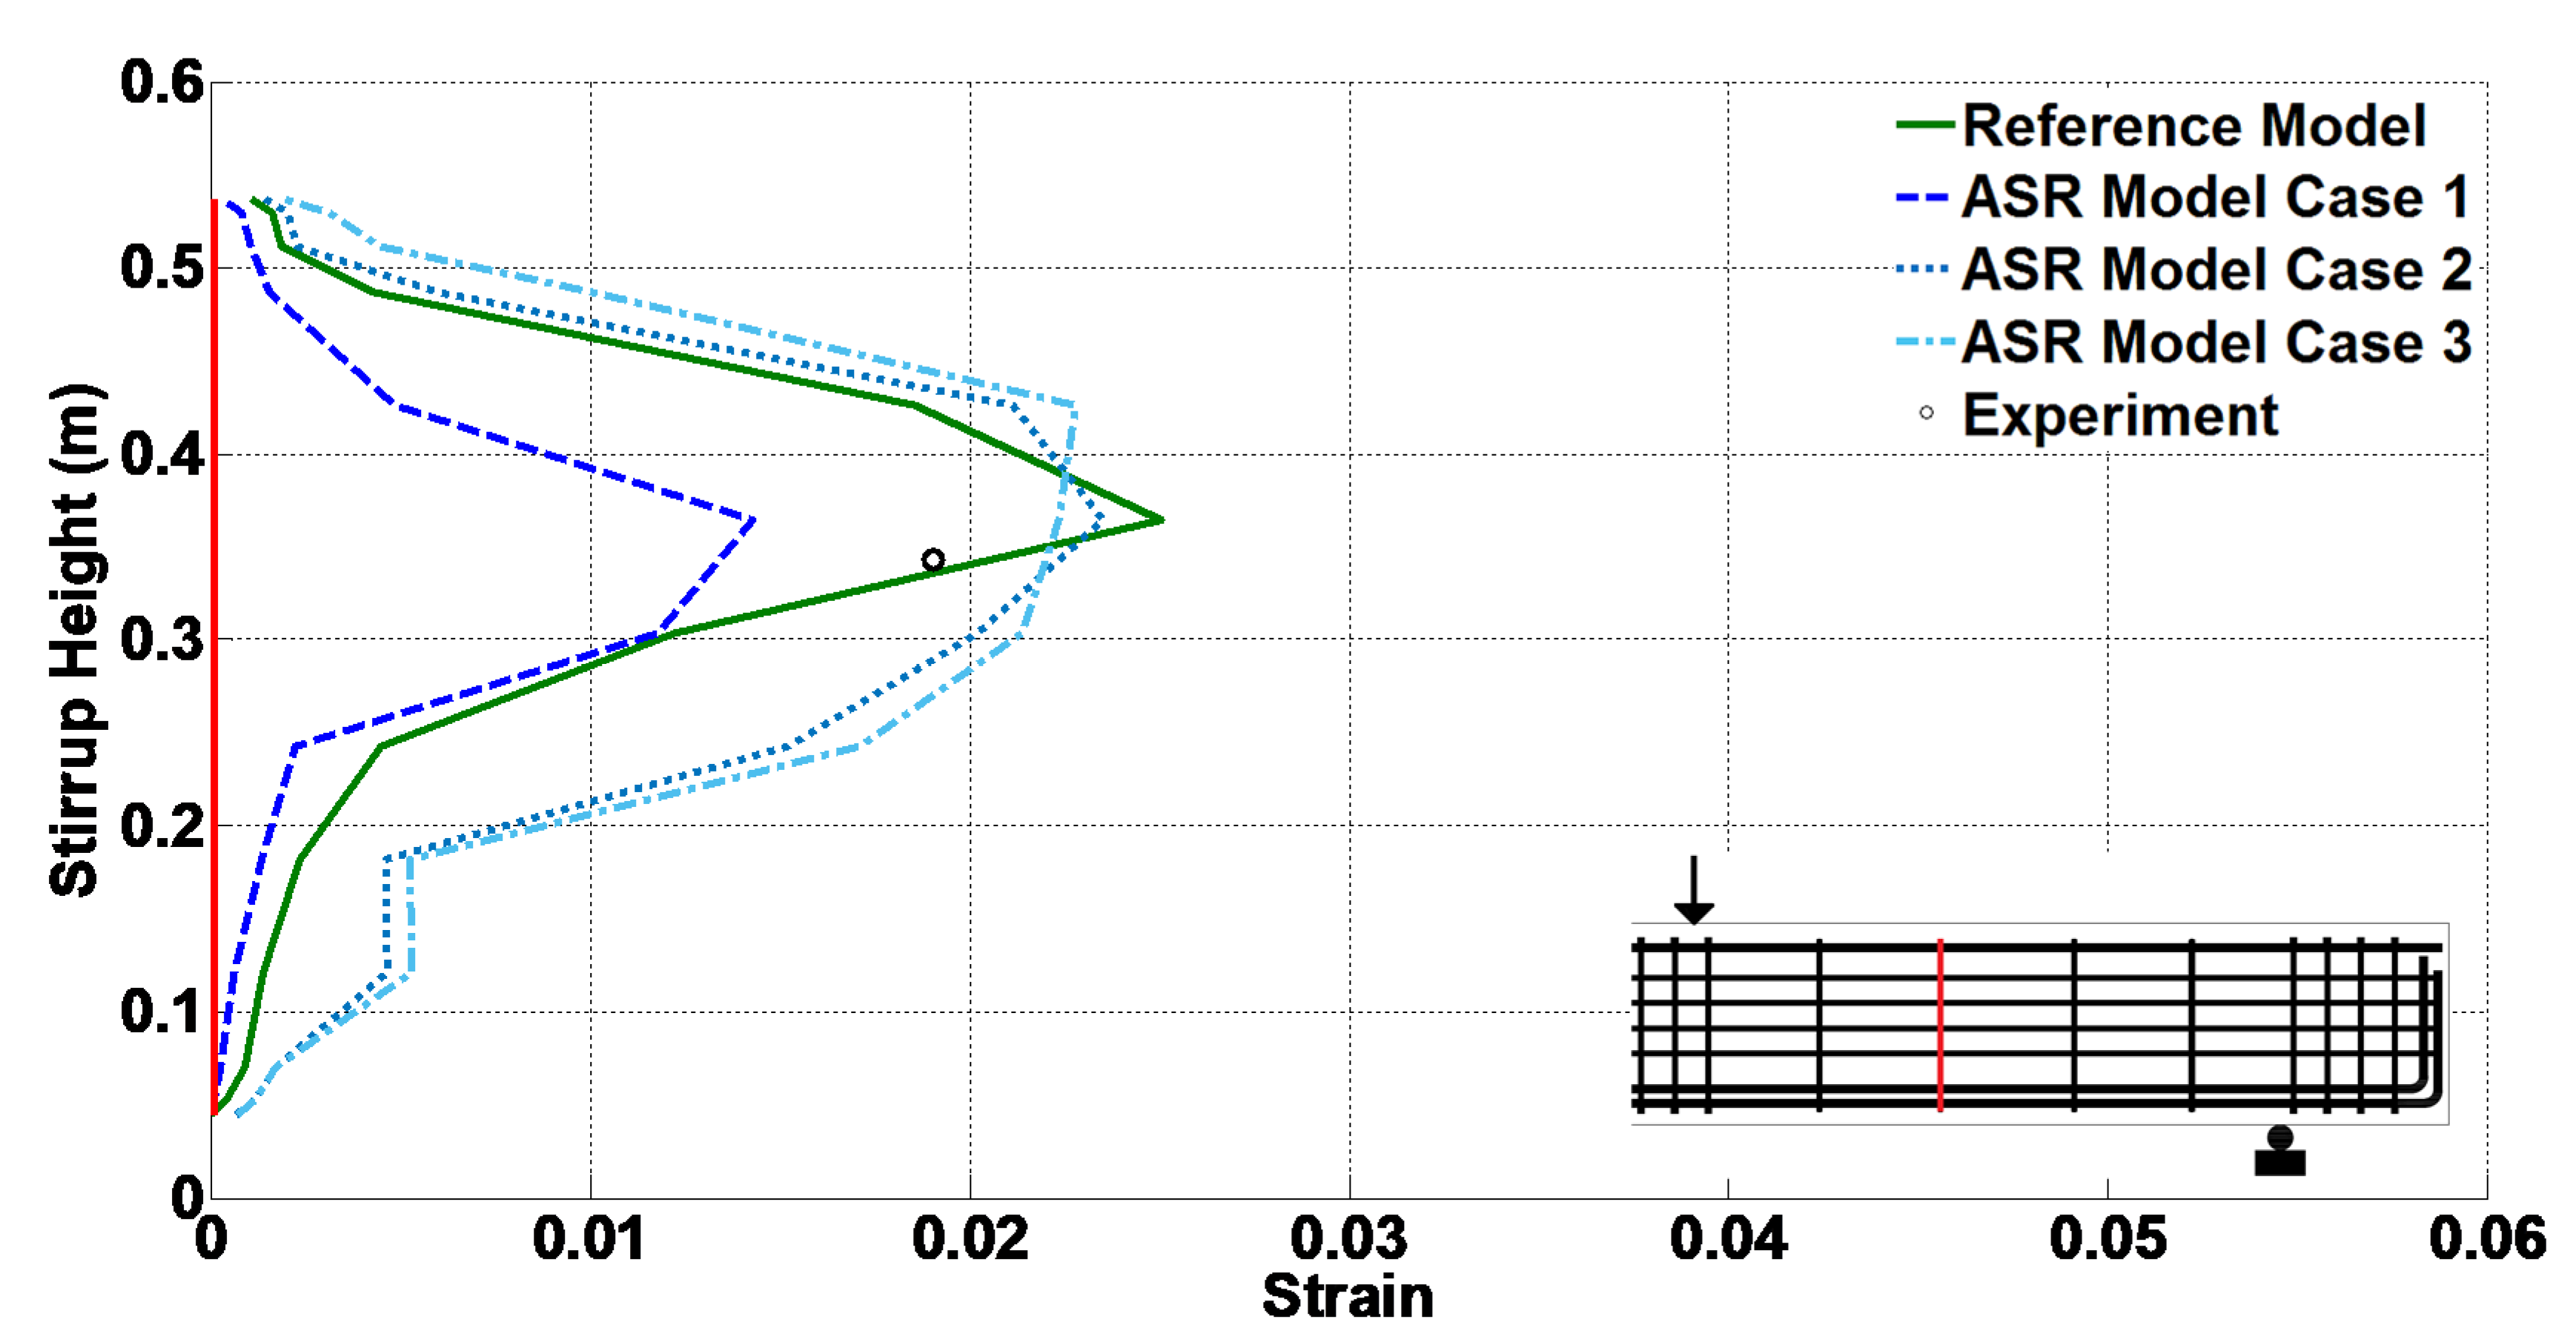
- For ASR degradation less than 0.2% expansion, the stirrup strain at peak load is reduced compared to the no ASR case. However, for higher levels of ASR with 0.4% and 0.6% expansion, the strains of the stirrups exceeded the strains in the reference model. This is because the stirrup strain is related to the deflection. The deflection at peak load is smaller at the early stages of ASR but then it increases as the ASR further develops due to further reduction in the material properties. Early-stage ASR results in a slightly lower peak load and corresponding deflection. Higher ASR degradation considerably affects the beam shear performance and reduces the peak load and stiffness. This causes more deflection in the beam and higher stirrups strain.
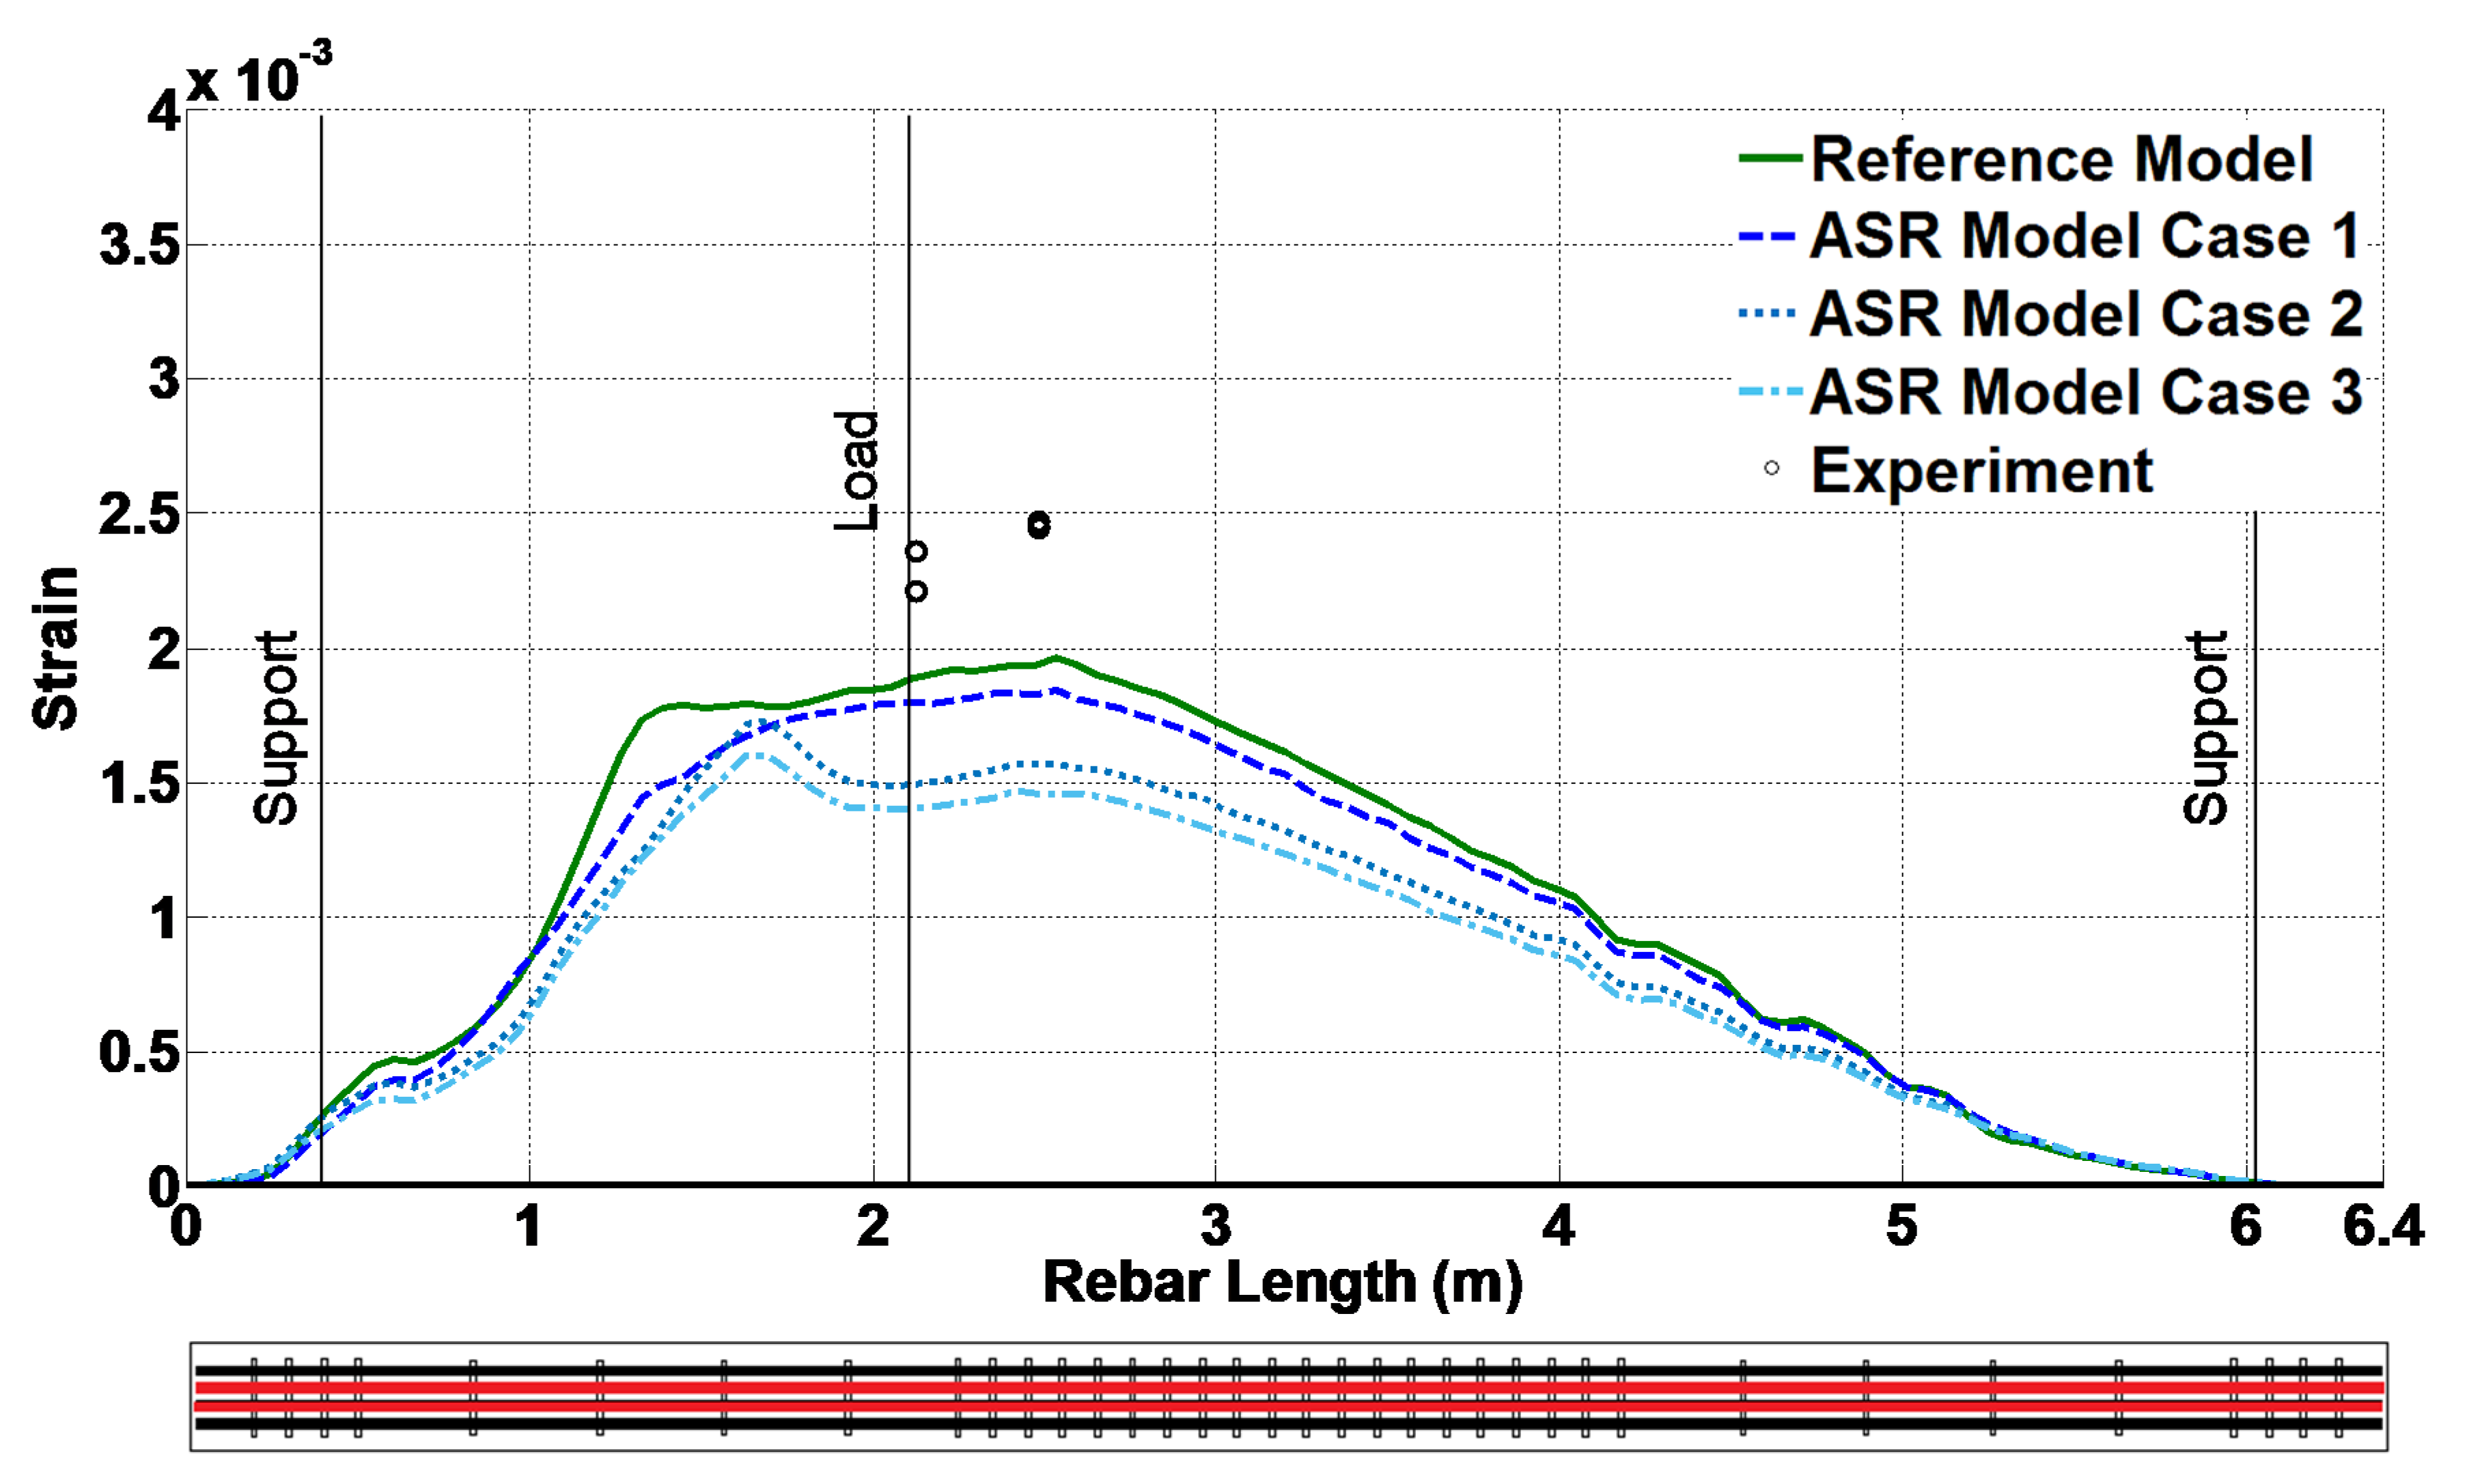
- For different levels of ASR degradation, no significant variation in the top longitudinal reinforcement strain at peak load was observed. On the other hand, as the level of ASR degradation increased, the strain of the bottom longitudinal reinforcement at peak load decreased. Unlike the stirrup strains, which were correlated to the deflection at peak load, the strain of the bottom longitudinal reinforcement was correlated to the peak load.
Author Contributions
Funding
Institutional Review Board Statement
Informed Consent Statement
Data Availability Statement
Acknowledgments
Conflicts of Interest
References
- Swamy, R.N. The Alkali-Silica Reaction in Concrete; Van Nostrand Renhold: New York, NY, USA, 1992. [Google Scholar]
- U.S. NRC. Special NRC Oversight at Seabrook Nuclear Power Plant: Concrete Degradation. Available online: https://www.nrc.gov/reactors/operating/ops-experience/concrete-degradation.html (accessed on 1 November 2020).
- Murazumi, Y.; Watanabe, Y.; Matsumoto, N.; Mitsugi, S.; Takiguchi, K.; Masuda, Y. Study on the influence of alkali-silica reaction on structural behavior of reinforced concrete members. In Proceedings of the 18th International Conference on Structural Mechanics in Reactor Technology, Beijing, China, 7–12 August 2005. [Google Scholar]
- Fournier, B.; Berube, M.-A.; Folliard, K.J.; Thomas, M. Report on the Diagnosis, Prognosis, and Mitigation of Alkali-Silica Reaction (ASR) in Transportation Structures; U.S. Department of Transportation, Federal Highway Administration: Washington, DC, USA, 2010. [Google Scholar]
- Miyagawa, T.; Seto, K.; Sasaki, K.; Mikata, Y.; Kuzume, K.; Minami, T. Fracture of Reinforcing Steels in Concrete Structures Damaged by Alkali-Silica Reaction. J. Adv. Concr. Technol. 2006, 4, 339–355. [Google Scholar] [CrossRef]
- Attar, A.; Gencturk, B.; Aryan, H.; Wei, J. Impact of Laboratory-Accelerated Aging Methods to Study Alkali–Silica Reaction and Reinforcement Corrosion on the Properties of Concrete. Materials 2020, 13, 3273. [Google Scholar] [CrossRef]
- Thomas, M.; Fournier, B.; Folliard, K.; Ideker, J.; Shehata, M. Test methods for evaluating preventive measures for controlling expansion due to alkali–silica reaction in concrete. Cem. Concr. Res. 2006, 36, 1842–1856. [Google Scholar] [CrossRef] [Green Version]
- Alnaggar, M.; Cusatis, G.; Di Luzio, G. Lattice discrete particle modeling (LDPM) of alkali silica reaction (ASR) deterioration of concrete structures. Cem. Concr. Compos. 2013, 41, 45–59. [Google Scholar] [CrossRef]
- Cusatis, C.; Rezakhani, R.; Alnaggar, M.; Zhou, X.; Pelessone, D. Multiscale computational models for the simulation of concrete materials and structures. Comput. Model. Concr. Struct. 2014, 1, 23–38. [Google Scholar]
- Alnaggar, M.; Luzio, G.D.; Cusatis, G. Modeling time-dependent behavior of concrete affected by alkali silica reaction in variable environmental conditions. Materials 2017, 10, 471. [Google Scholar] [CrossRef] [Green Version]
- Sucharda, O. Identification of Fracture Mechanic Properties of Concrete and Analysis of Shear Capacity of Reinforced Concrete Beams without Transverse Reinforcement. Materials 2020, 13, 2788. [Google Scholar] [CrossRef]
- Conforti, A.; Minelli, F. Compression field modelling of fibre reinforced concrete shear critical deep beams: A numerical study. Mater. Struct. 2016, 49, 3369–3383. [Google Scholar] [CrossRef]
- Wu, Y.F.; Hu, B. Shear Strength Components in Reinforced Concrete Members. J. Struct. Eng. 2017, 143, 04017092. [Google Scholar] [CrossRef]
- Domenico, D.D.; Ricciardi, G. Shear strength of RC beams with stirrups using an improved Eurocode 2 truss model with two variable-inclination compression struts. Eng. Struct. 2019, 198, 109359. [Google Scholar] [CrossRef]
- Schmidt, J.W.; Hansen, S.G.; Barbosa, R.A.; Henriksen, A. Novel shear capacity testing of ASR damaged full scale concrete bridge. Eng. Struct. 2014, 79, 365–374. [Google Scholar] [CrossRef]
- Barbosa, R.A.; Hansen, S.G.; Hoang, L.C.; Hansen, K.K. Residual shear strength of a severely ASR-damaged flat slab bridge. Eng. Struct. 2018, 161, 82–95. [Google Scholar] [CrossRef]
- Sanchez, L.; Fournier, B.; Jolin, M.; Mitchell, D.; Bastien, J. Overall assessment of Alkali-Aggregate Reaction (AAR) in concretes presenting different strengths and incorporating a wide range of reactive aggregate types and natures. Cem. Concr. Res. 2017, 93, 17–31. [Google Scholar] [CrossRef]
- Attoh-Okine, N.; Atique, F. Service Life Assessment of Concrete with ASR and Possible Mitigation; Delaware Center for Transportation, University of Delaware: Newark, DE, USA, 2006. [Google Scholar]
- Attar, A.; Gencturk, B.; Hanifehzadeh, M.; Willam, K. Accelerated Aging of Concrete Dry Cask Storage Systems for Nuclear Waste. J. Adv. Concr. Technol. 2016, 14, 299–310. [Google Scholar] [CrossRef] [Green Version]
- Temuujin, J.; Williams, R.; Van Riessen, A. Effect of mechanical activation of fly ash on the properties of geopolymer cured at ambient temperature. J. Mater. Process. Technol. 2009, 209, 5276–5280. [Google Scholar] [CrossRef]
- Nuruddin, F.; Demie, S.; Memon, F.; Shafiq, N. Effect of superplasticizer and NaOH molarity on workability, compressive strength and microstructure properties of self-compacting geopolymer concrete. World Acad. Sci. Eng. Technol. 2011, 5, 187–194. [Google Scholar]
- Al Bakri, A.M.; Kamarudin, H.; Bnhussain, M.; Nizar, I.K.; Rafiza, A.; Zarina, Y. Microstructure of different NaOH molarity of fly ash-based green polymeric cement. J. Eng. Technol. Res. 2011, 3, 44–49. [Google Scholar]
- Fournier, B.; Bérubé, M.-A. Alkali-aggregate reaction in concrete: A review of basic concepts and engineering implications. Can. J. Civ. Eng. 2000, 27, 167–191. [Google Scholar] [CrossRef]
- Esposito, R.; Anaç, C.; Hendriks, M.A.; Çopuroğlu, O. Influence of the alkali-silica reaction on the mechanical degradation of concrete. J. Mater. Civ. Eng. 2016, 28, 04016007. [Google Scholar] [CrossRef] [Green Version]
- Fan, S.; Hanson, J.M. Effect of Deleterious ASR Expansion on the Structural Behavior of Reinforced Concrete Elements; North Carolina State University: Raleigh, NC, USA, 1996. [Google Scholar]
- Gautam, B.P.; Panesar, D.K.; Sheikh, S.A.; Vecchio, F.J.; Orbovic, N. Alkali Aggregate Reaction in Nuclear Concrete Structures: Part 2: Concrete Materials Aspects. In Proceedings of the 23rd Conference on Structural Mechanics in Reactor Technology, Manchester, UK, 10–14 August 2015. [Google Scholar]
- Ahmed, T.; Burley, E.; Rigden, S.; Abu-Tair, A.I. The effect of alkali reactivity on the mechanical properties of concrete. Constr. Build. Mater. 2003, 17, 123–144. [Google Scholar] [CrossRef]
- BSI. BS 6319-7 Testing of Resin Compositions for Use in Construction Part 7: Method for Measurement of Tensile Strength; BSI Group: London, UK, 1985. [Google Scholar]
- Sargolzahi, M.; Kodjo, S.A.; Rivard, P.; Rhazi, J. Effectiveness of nondestructive testing for the evaluation of alkali–silica reaction in concrete. Constr. Build. Mater. 2010, 24, 1398–1403. [Google Scholar] [CrossRef]
- Canadian Standards Association. CAN/CSA-A23.2-14A-14 Potential Expansivity of Aggregates; Procedure for Length Change Due to Alkali-Aggregate Reaction in Concrete Prisms; Canadian Standards Association: Mississauga, ON, Canada, 2014. [Google Scholar]
- Saint-Pierre, F.; Rivard, P.; Ballivy, G. Measurement of alkali–silica reaction progression by ultrasonic waves attenuation. Cem. Concr. Res. 2007, 37, 948–956. [Google Scholar] [CrossRef]
- Smaoui, N.; Bérubé, M.; Fournier, B.; Bissonnette, B.; Durand, B. Effects of alkali addition on the mechanical properties and durability of concrete. Cem. Concr. Res. 2005, 35, 203–212. [Google Scholar] [CrossRef]
- Multon, S.; Seignol, J.-F.; Toutlemonde, F. Structural behavior of concrete beams affected by alkali-silica reaction. Aci Mater. J. 2005, 102, 67. [Google Scholar]
- Giannini, E.; Folliard, K. Stiffness damage and mechanical testing of core specimens for the evaluation of structures affected by ASR. In Proceedings of the 14th International Conference on Alkali–Aggregate Reaction in Concrete, Austin, TX, USA, 20–25 May 2012. [Google Scholar]
- Smaoui, N.; Bissonnette, B.; Bérubé, M.-A.; Fournier, B.; Durand, B. Mechanical properties of ASR-affected concrete containing fine or coarse reactive aggregates. J. ASTM Int. 2005, 3, 1–16. [Google Scholar]
- Fan, S.; Hanson, J.M. Length expansion and cracking of plain and reinforced concrete prisms due to alkali-silica reaction. Mater. J. 1998, 95, 480–487. [Google Scholar]
- Giaccio, G.; Bossio, M.; Torrijos, M.; Zerbino, R. Contribution of fiber reinforcement in concrete affected by alkali–silica reaction. Cem. Concr. Res. 2015, 67, 310–317. [Google Scholar] [CrossRef]
- Giaccio, G.; Zerbino, R.; Ponce, J.; Batic, O.R. Mechanical behavior of concretes damaged by alkali-silica reaction. Cem. Concr. Res. 2008, 38, 993–1004. [Google Scholar] [CrossRef]
- Swamy, R.; Al-Asali, M. Engineering properties of concrete affected by alkali-silica reaction. Mater. J. 1988, 85, 367–374. [Google Scholar]
- Larive, C. Apports Combinés de L’expérimentation et de la Modélisation à la Compréhension de L’alcali-Réaction et de ses Effets Mécaniques; Ecole Nationale des Ponts et Chaussées: Marne-la-Vallée, France, 1997. [Google Scholar]
- Monette, L.J.-G. Effects of the Alkali-Silica Reaction on Unloaded, Statically Loaded and Dynamically Loaded Reinforced Concrete Beams; University of Ottawa: Ottawa, ON, Canada, 1998. [Google Scholar]
- Multon, S. Evaluation Expérimentale et Théorique des Effets Mécaniques de L’alcali-Réaction sur des Structures Modèles; Université de Marne-la-Vallée: Marne-la-Vallée, France, 2003. [Google Scholar]
- Ben Haha, M. Mechanical Effects of Alkali Silica Reaction in Concrete Studied by SEM-Image Analysis; EPFL: Lausanne, Switzerland, 2006. [Google Scholar]
- Lindgård, J. Alkali-Silica Reaction (ASR)–Performance Testing; Norwegian University of Science and Technology: Trondheim, Norway, 2013. [Google Scholar]
- Sanchez, L.; Fournier, B.; Jolin, M.; Bastien, J. Evaluation of the stiffness damage test (SDT) as a tool for assessing damage in concrete due to ASR: Test loading and output responses for concretes incorporating fine or coarse reactive aggregates. Cem. Concr. Res. 2014, 56, 213–229. [Google Scholar] [CrossRef]
- Aryan, H.; Gencturk, B. Influence of alkali-silica reaction on the shear capacity of reinforced concrete beams with minimum transverse reinforcement. Eng. Struct. 2021, 235, 112020. [Google Scholar] [CrossRef]
- BASF. Concrete Admixture Provider. Available online: https://www.master-builders-solutions.com/en-us/ (accessed on 26 December 2020).
- ASTM. ASTM C39/C39M-16b Standard Test Method for Compressive Strength of Cylindrical Concrete Specimens; ASTM International: West Conshohocken, PA, USA, 2016. [Google Scholar]
- ASTM. ASTM C496/C496M-17 Standard Test Method for Splitting Tensile Strength of Cylindrical Concrete Specimens; ASTM International: West Conshohocken, PA, USA, 2017. [Google Scholar]
- ASTM. ASTM C469/C469M-14e1 Standard Test Method for Static Modulus of Elasticity and Poisson’s Ratio of Concrete in Compression; ASTM International: West Conshohocken, PA, USA, 2014. [Google Scholar]
- ASTM. ASTM C78/C78M-18 Standard Test Method for Flexural Strength of Concrete Using Simple Beam with Third-Point Loading; ASTM International: West Conshohocken, PA, USA, 2018. [Google Scholar]
- Cervenka, V.; Jendele, L.; Cervenka, J. ATENA Program Documentation, Part 1: Theory; Cervenka Consulting: Prague, Czech Republic, 2007; p. 231. [Google Scholar]
- Taerwe, L.; Matthys, S. Fib Model Code for Concrete Structures; International Federation for Structural Concrete: Lausanne, Switzerland, 2013. [Google Scholar]


| Reference | Reactive Aggregate Type | Cement Content (kg/m3) | w/c 1 Ratio | Alkaline Dosage (%) 2 | Maximum Expansion (%) |
|---|---|---|---|---|---|
| Current study | El Paso Sand | 291 | 0.52 | 1.25 | 0.18 |
| Attar et al. [19] | El Paso sand | 427 | 0.33 | 1.25 | 0.10 |
| Smaoui et al. [35] | Texas sand | 420 | 0.4 | 1.25 | 0.39 |
| Smaoui et al. [35] | Québec City limestone | 420 | 0.4 | 1.25 | 0.17 |
| Esposito et al. [24] | Quartzite, quartz, chert, volcanic rock | 380 | 0.45 | 1.17 | 0.11 |
| Esposito et al. [24] | Quartz, quartzite, gneiss, metarhyolite | 380 | 0.45 | 1.17 | 0.18 |
| Sargolzehi et al. [29] | Spratt limestone | 345 | 0.5 | 1.25 | 0.08 |
| Fan et al. [36] | Gold Hill coarse aggregate | 403 | 0.47 | - 3 | 0.17 4 |
| Saint-Pierre et al. [31] | Spratt limestone | 350 | 0.5 | 5.25 5 | 0.2 |
| Giaccio et al. [37] | Crushed quartzitic sandstone | 380 | 0.42 | 4.0 5 | 0.22 |
| Giaccio et al. [38] | Granitic stone with feldspars, quartz, etc. | 420 | 0.42 | 1.24 | 0.28 |
| Multon et al. [33] | Limestone | 410 | 0.5 | 1.25 | 0.26 |
| Giannini et al. [34] | Dolomite, carbonate, siliceous volcanics | 420 | 0.42 | 1.25 | 0.14 |
| Giannini et al. [34] | El Paso sand | _ | _ | _ | 0.42 |
| Swamy and Al-Asali [39] | Amorphous fused silica sand | 520 | 0.44 | 1.00 | 0.62 |
| Larive [40] | Tournaisis limestone | 410 | 0.44 | 1.25 | 0.21 |
| Monette [41] | Siliceous limestone | 423 | 0.61 | 1.25 | 0.35 |
| Ahmed et al. [27] | Thames Valley sand (50% chert) and fused silica | 400 | 0.5 | 1.75 | 0.15 |
| Multon [42] | Calcareous stones with silica | 410 | 0.5 | 1.25 | 0.1 |
| Ben Haha [43] | Chlorite interleaved with quartz and feldspar | _ | 0.46 | 0.4 | 0.16 |
| Lindgård [44] | Ottersbo cataclasite with crypto and quartz | 550 | 0.3 | 0.67 | 0.08 |
| Lindgård [44] | Ottersbo cataclasite with crypto and quartz | 400 | 0.45 | 0.93 | 0.23 |
| Lindgård [44] | Ottersbo cataclasite with crypto and quartz | 315 | 0.6 | 1.17 | 0.28 |
| Sanchez et al. [45] | Volcanics and chert sand | 314 | 0.61 | 1.25 | 0.3 |
| Sanchez et al. [45] | Volcanics and chert coarse aggregate | 314 | 0.61 | 1.25 | 0.2 |
| Mechanical Property, y | Property, y as a Function of Expansion Percentage, x |
|---|---|
| Elastic Modulus | y = 1.0189 × 10−1.224x |
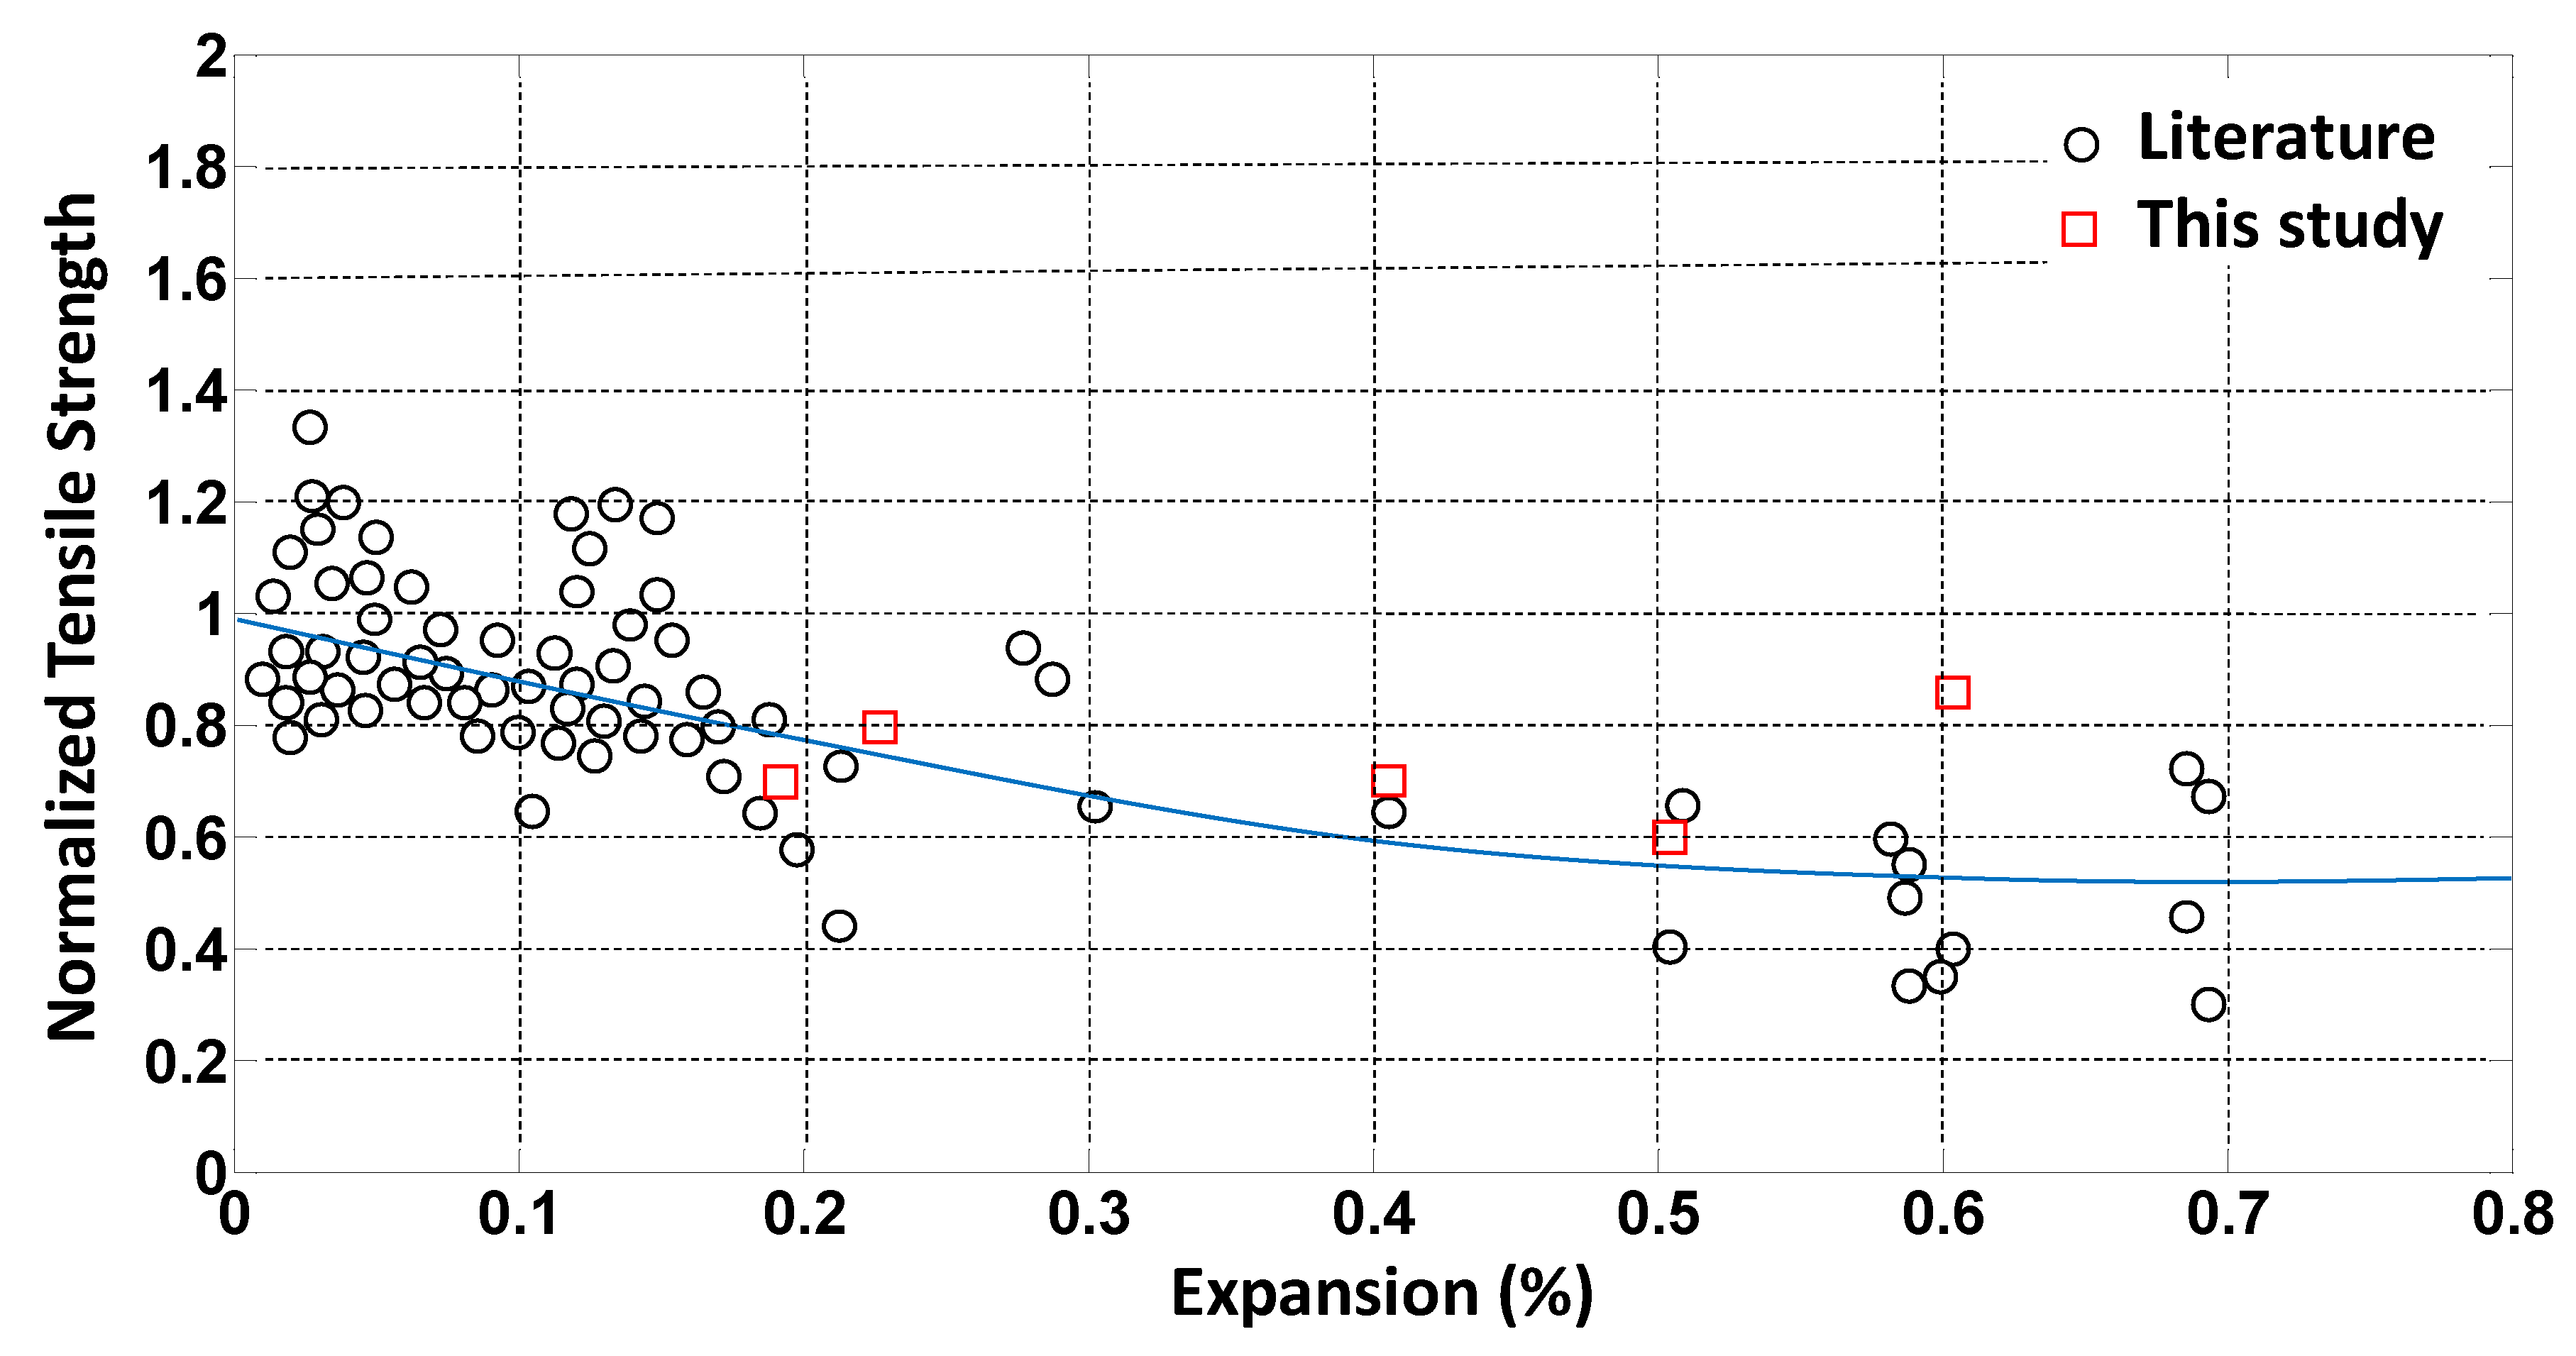
| Tensile Strength | y = 0.9830 × 10−1.068x |
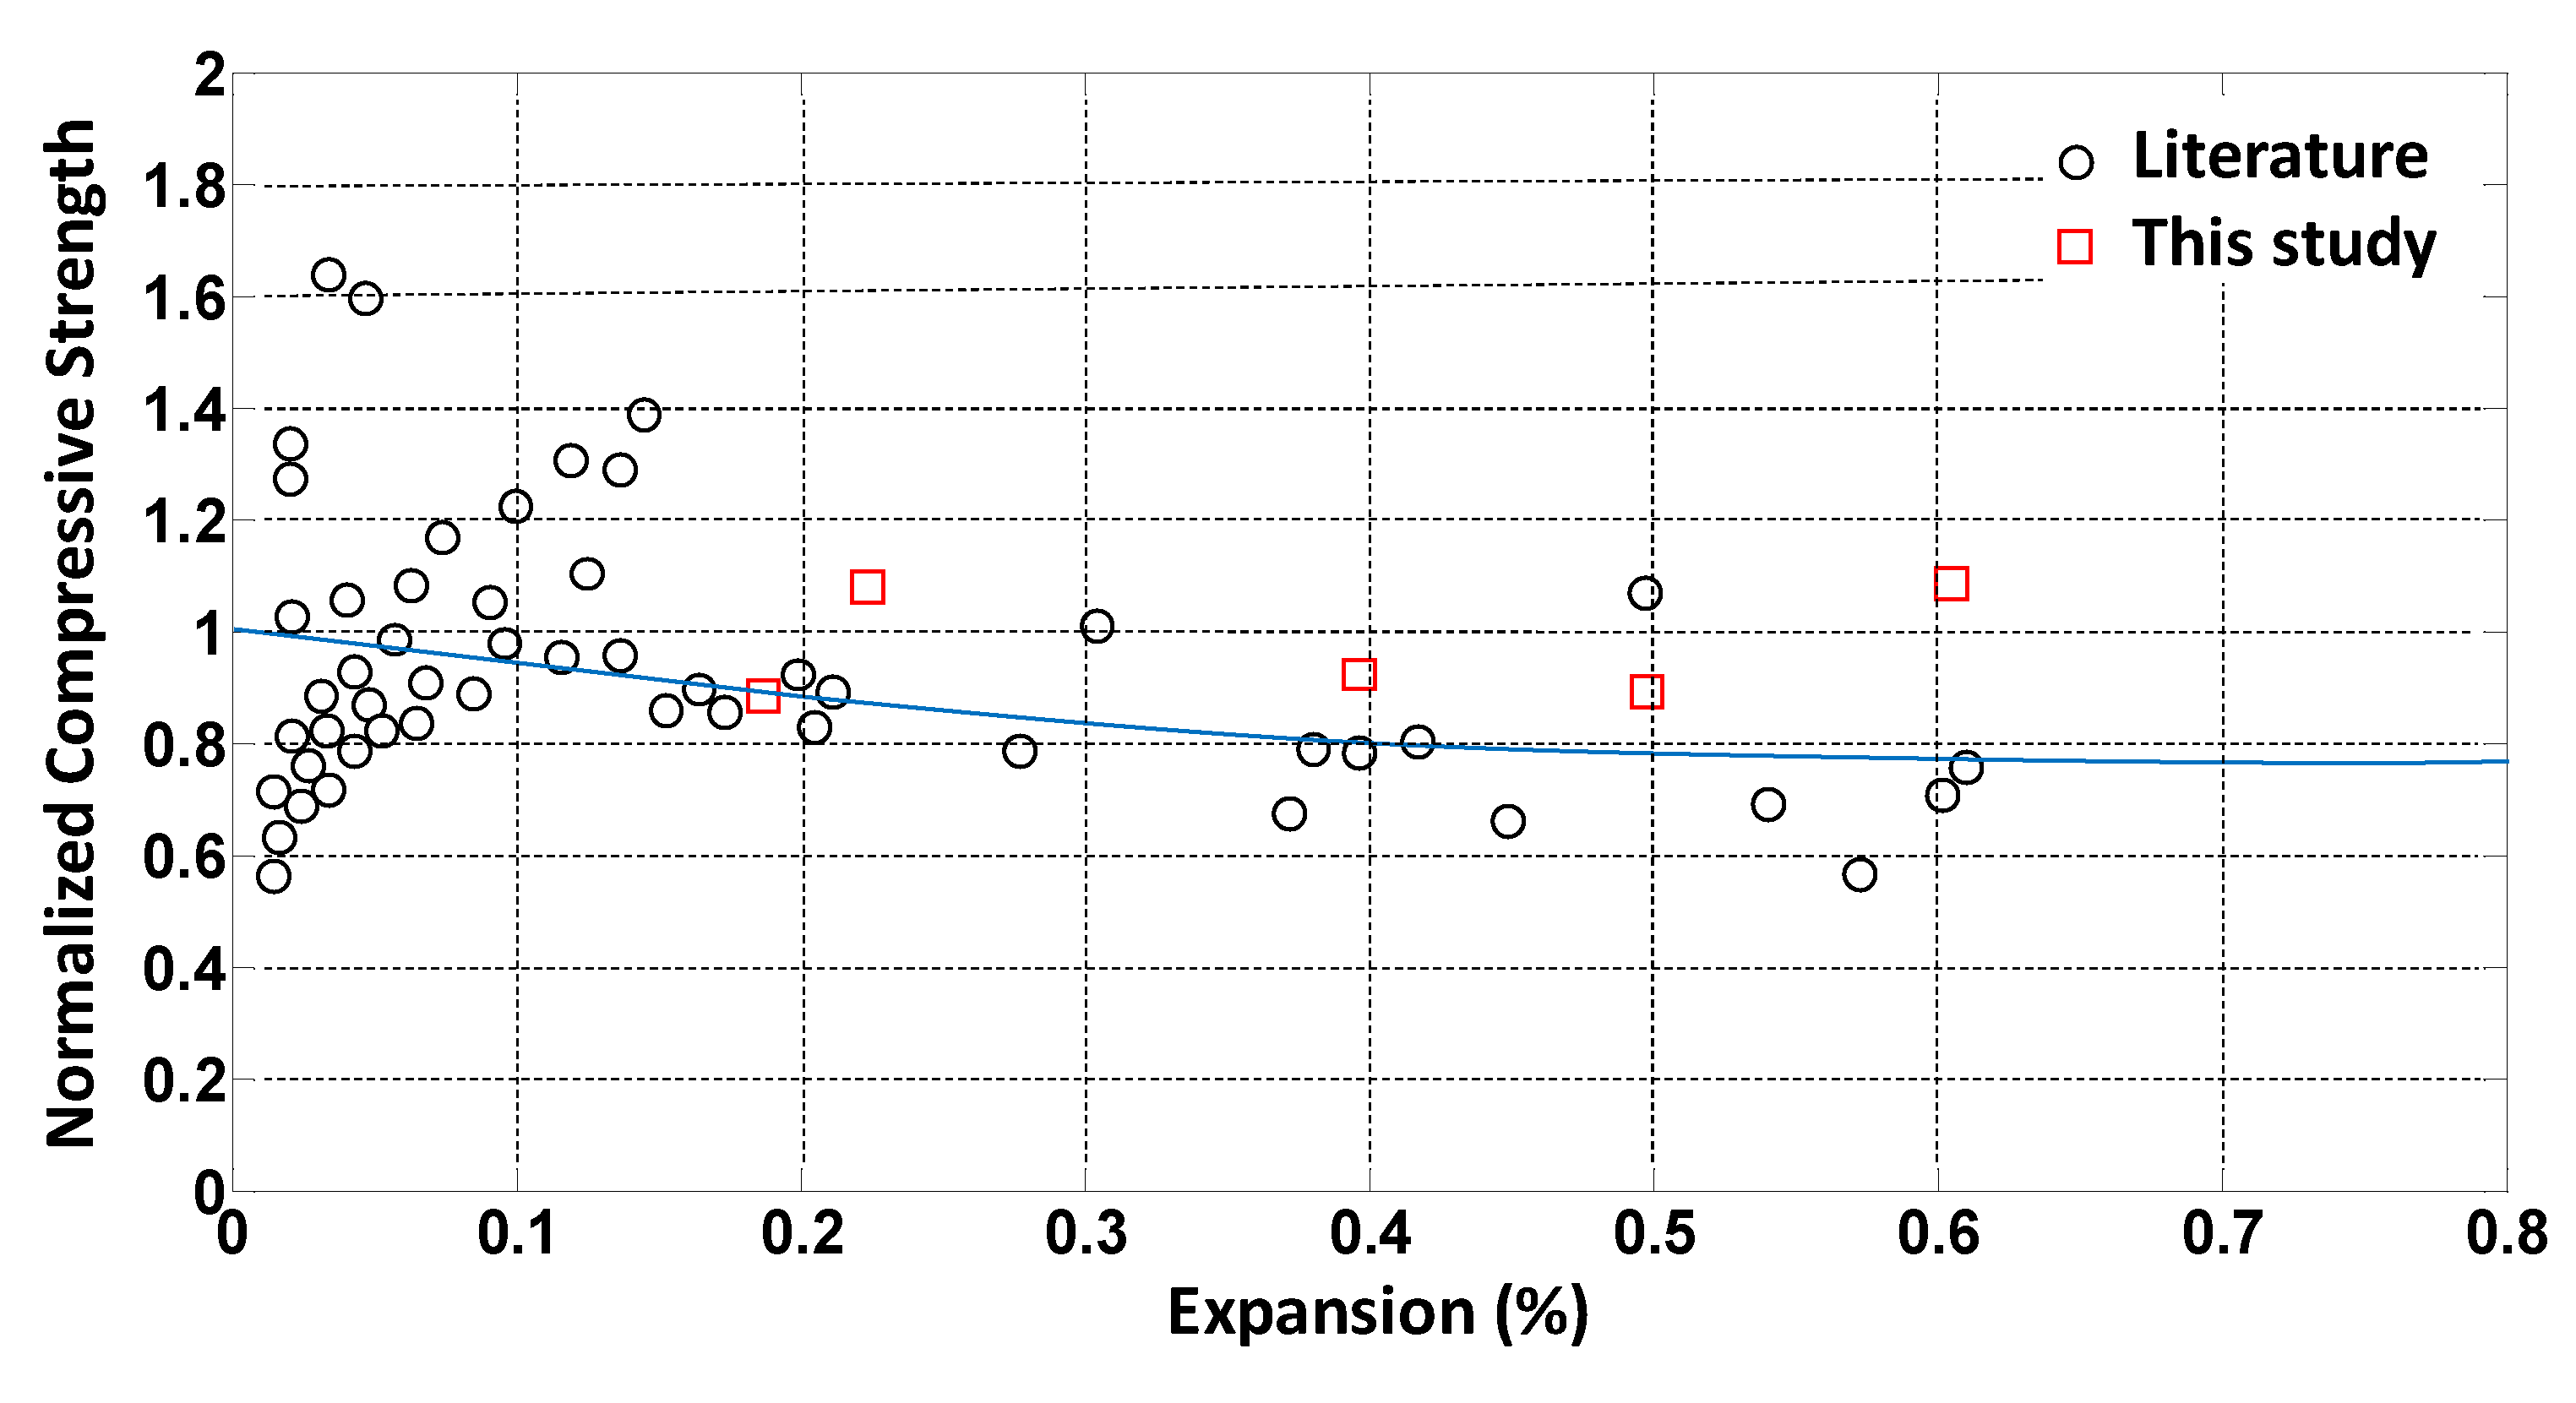
| Compressive Strength | y = 1.0111 × 10−0.482x |
| Material | Amount |
|---|---|
| Mixing Water, kg/m3 | 154 |
| Type II Low Alkali Portland Cement, kg/m3 | 291 |
| 19 mm Coarse Aggregate, kg/m3 | 1038 |
| 9.5 mm Coarse Aggregate, kg/m3 | 208 |
| Reactive Sand from El Paso, Texas, kg/m3 | 727 |
| Pozzolith 8 1, g/m3 | 1187 |
| Glenium 3400 NV 1, g/m3 | 1557 |
| Property | Age | No. of Tests at Each Age | Standard | |
|---|---|---|---|---|
| 28 Days | 210 days | |||
| Compressive Strength (MPa) | 38.5 | 40.0 | 3 | ASTM C39 [48] |
| Split Tensile Strength (MPa) | 4.6 | 3.5 | 3 | ASTM C496 [49] |
| Elastic Modulus (GPa) | 17.7 | 19.0 | 3 | ASTM C469 [50] |
| Modulus of Rupture (MPa) | 4.7 1 | 4.8 | 2 | ASTM C78 [51] |
| Parameter | Symbol | Unit | Value |
|---|---|---|---|
| Elastic Modulus | E | MPa | 1.896 × 10⁴ |
| Poisson’s Ratio | μ | - | 0.20 |
| Tensile Strength | ft | MPa | 4.00 |
| Compressive Strength | fc | MPa | −40.00 |
| Specific Fracture Energy | GF | MN/m | 2.000 × 10⁻⁴ |
| Tension Stiffening | cts | - | 0.04 |
| Critical Compressive Displacement | Wd | m | −1.050 × 10⁻³ |
| Plastic Strain at Compressive Strength | εcp | - | −3.200 × 10⁻³ |
| Reduction of Compressive Strength Due to Cracks | rc,lim | - | 0.80 |
| Crack Shear Stiffness Factor | SF | - | 20.00 |
| Aggregate Size | - | m | 0.019 |
| Failure Surface Eccentricity | - | - | 0.52 |
| Multiplier for The Plastic Flow Direction | β | - | 0.00 |
| Specific Material Weight | ρ | MN/m3 | 2.30 × 10⁻² |
| Fixed Crack Model Coefficient | - | - | 1.00 |
| Material Characteristic | Unit | #5 Stirrup | #5 Longitudinal Rebar | #8 Longitudinal Rebar | #3 Stirrup |
|---|---|---|---|---|---|
| Elastic Modulus, E | MPa | 200,000 | 200,000 | 200,000 | 200,000 |
| Yield Strength, σy | MPa | 483 | 500 | 490 | 517 |
| Maximum Stress, σt | MPa | 680 | 676 | 672 | 648 |
| Maximum Strain, εlim | - | 0.2 | 0.2 | 0.3 | 0.1 |
| Specific Material Weight, ρ | MN/m3 | 0.0785 | 0.0785 | 0.0785 | 0.0785 |
| Model Component | Element Shape | Element Size | Element Type | No. of Elements |
|---|---|---|---|---|
| Concrete | Brick | 60 mm | Linear | 5300 |
| Steel | Tetrahedral | 12 mm | Linear | 50,436 |
| Rebar | Line | 60 mm | 2-D truss | 3290 |
| Title | Parameter | Value |
|---|---|---|
| General | Iteration limit per analysis step | 500 |
| Displacement error tolerance | 0.010000 | |
| Residual error tolerance | 0.010000 | |
| Absolute residual error tolerance | 0.010000 | |
| Energy error tolerance | 0.000100 | |
| Line Search | Unbalanced energy limit | 0.800 |
| Limit of line search iterations | 2 | |
| Line search limit—min. | 0.010 | |
| Line search limit—max. | 1.000 |
| Properties | Case | ||
|---|---|---|---|
| 1 0.2% Expansion | 2 0.4% Expansion | 3 0.6% Expansion | |
| Compressive Strength | 92% (36.8 MPa) | 83% (33.2 MPa) | 76% (30.4 MPa) |
| Elastic Modulus | 80% (15.2 GPa) | 62% (11.8 GPa) | 49% (9.3 GPa) |
| Tensile Strength | 79% (3.2 MPa) | 64% (2.6 MPa) | 52% (2.1 MPa) |
| Fracture Energy | 98.5% (0.197 kN/m) | 96.7% (0.193 kN/m) | 95.1% (0.190 kN/m) |
| FE Model | Maximum Strain (×10−3) | |||||
|---|---|---|---|---|---|---|
| Bottom Longitudinal Rebar | Top Longitudinal Rebar | Stirrup No. 1 | Stirrup No. 2 | Stirrup No. 3 | Stirrup No. 4 | |
| Reference | 1.96 | −1.34 | 6.56 | 17.30 | 25.14 | 5.38 |
| Case 1 | 1.85 | −1.35 | 4.50 | 15.25 | 14.43 | 2.96 |
| Case 2 | 1.73 | −1.32 | 9.94 | 22.41 | 23.62 | 10.10 |
| Case 3 | 1.60 | −1.34 | 9.82 | 22.43 | 22.86 | 9.37 |
Publisher’s Note: MDPI stays neutral with regard to jurisdictional claims in published maps and institutional affiliations. |
© 2021 by the authors. Licensee MDPI, Basel, Switzerland. This article is an open access article distributed under the terms and conditions of the Creative Commons Attribution (CC BY) license (https://creativecommons.org/licenses/by/4.0/).
Share and Cite
Gencturk, B.; Aryan, H.; Hanifehzadeh, M.; Chambreuil, C.; Wei, J. A Computational Study of the Shear Behavior of Reinforced Concrete Beams Affected from Alkali–Silica Reactivity Damage. Materials 2021, 14, 3346. https://doi.org/10.3390/ma14123346
Gencturk B, Aryan H, Hanifehzadeh M, Chambreuil C, Wei J. A Computational Study of the Shear Behavior of Reinforced Concrete Beams Affected from Alkali–Silica Reactivity Damage. Materials. 2021; 14(12):3346. https://doi.org/10.3390/ma14123346
Chicago/Turabian StyleGencturk, Bora, Hadi Aryan, Mohammad Hanifehzadeh, Clotilde Chambreuil, and Jianqiang Wei. 2021. "A Computational Study of the Shear Behavior of Reinforced Concrete Beams Affected from Alkali–Silica Reactivity Damage" Materials 14, no. 12: 3346. https://doi.org/10.3390/ma14123346