Appendix A
Table A1.
Concrete mix designs for the variation of the water/cement ratio.
Table A1.
Concrete mix designs for the variation of the water/cement ratio.
| Parameter | Unit | 32-55-300-00 | 32-65-300-00 |
|---|
| CEM I 32.5 R | kg/m3 | 300.0 | 300.0 |
| GGBS | - | - |
| Water | 165.0 | 195.0 |
| Aggregates | 1888.9 | 1810.0 |
| Water/cement ratio | - | 0.55 | 0.65 |
| Grain size distribution | A/B16 | A/B16 |
| Steel fibre type | Macrofibre 60 mm | Macrofibre 60 mm |
| Steel fibre content | kg/m3 | 0 to 80 | 0 to 80 |
Table A2.
Concrete mix designs for the variation of the binder content.
Table A2.
Concrete mix designs for the variation of the binder content.
| Parameter | Unit | 32-60-270-00 | 32-60-330-00 |
|---|
| CEM I 32.5 R | kg/m3 | 270.0 | 330.0 |
| GGBS | - | - |
| Water | 180.0 | 180.0 |
| Aggregates | 1922.3 | 1776.7 |
| Water/cement ratio | - | 0.60 | 0.60 |
| Grain size distribution | A/B16 | A/B16 |
| Steel fibre type | Macrofibre 60 mm | Macrofibre 60 mm |
| Steel fibre content | kg/m3 | 0 to 80 | 0 to 80 |
Table A3.
Concrete mix designs for the variation of the cement type.
Table A3.
Concrete mix designs for the variation of the cement type.
| Parameter | Unit | 42-60-300-00 | 52-60-300-00 |
|---|
| CEM I 42.5 R | kg/m3 | 300.0 | - |
| CEM I 52.5 R | - | 300.0 |
| GGBS | - | - |
| Water | 180.0 | 180.0 |
| Aggregates | 1849.5 | 1849.5 |
| Water/cement ratio | - | 0.60 | 0.60 |
| Grain size distribution | A/B16 | A/B16 |
| Steel fibre type | Macrofibre 60 mm | Macrofibre 60 mm |
| Steel fibre content | kg/m3 | 0 to 80 | 0 to 80 |
Table A4.
Concrete mix designs for the variation of the content of GGBS.
Table A4.
Concrete mix designs for the variation of the content of GGBS.
| Parameter | Unit | 32-60-300-35 | 32-60-300-65 |
|---|
| CEM I 32.5 R | kg/m3 | 195.0 | 105.0 |
| GGBS | 105.0 | 195.0 |
| Water | 180.0 | 180.0 |
| Aggregates | 1843.7 | 1838.7 |
| Water/cement ratio | - | 0.60 | 0.60 |
| Grain size distribution | A/B16 | A/B16 |
| Steel fibre type | Macrofibre 60 mm | Macrofibre 60 mm |
| Steel fibre content | kg/m3 | 0 to 80 | 0 to 80 |
Table A5.
Concrete mix designs for the variation of the steel fibre type.
Table A5.
Concrete mix designs for the variation of the steel fibre type.
| Parameter | Unit | 32-60-300-00-F2 | 32-60-300-00-F3 |
|---|
| CEM I 32.5 R | kg/m3 | 300.0 | 300.0 |
| GGBS | - | - |
| Water | 180.0 | 180.0 |
| Aggregates | 1849.5 | 1849.5 |
| Water/cement ratio | - | 0.60 | 0.60 |
| Grain size distribution | A/B16 | A/B16 |
| Steel fibre type | Macrofibre 35 mm | Microfibre 8 mm |
| Steel fibre content | kg/m3 | 0 to 80 | 0 to 80 |
Table A6.
Concrete mix designs for the multiple parameter variation—part 1.
Table A6.
Concrete mix designs for the multiple parameter variation—part 1.
| Parameter | Unit | 32-55-270-35 | 32-65-330-65 |
|---|
| CEM I 32.5 R | kg/m3 | 175.5 | 115.5 |
| CEM I 42.5 R | - | - |
| CEM I 52.5 R | - | - |
| GGBS | 94.5 | 214.5 |
| Water | 148.5 | 214.5 |
| Aggregates | 1952.5 | 1721.4 |
| Water/cement ratio | - | 0.55 | 0.65 |
| Grain size distribution | A/B16 | A/B16 |
| Steel fibre type | Macrofibre 60 mm | Macrofibre 60 mm |
| Steel fibre content | kg/m3 | 0 to 80 | 0 to 80 |
Table A7.
Concrete mix designs for the multiple parameter variation—part 2.
Table A7.
Concrete mix designs for the multiple parameter variation—part 2.
| Parameter | Unit | 42-55-330-00 | 42-60-270-65 |
|---|
| CEM I 32.5 R | kg/m3 | - | - |
| CEM I 42.5 R | 330.0 | 94.5 |
| CEM I 52.5 R | - | - |
| GGBS | - | 175.5 |
| Water | 181.5 | 162.0 |
| Aggregates | 1820.1 | 1912.6 |
| Water/cement ratio | - | 0.55 | 0.60 |
| Grain size distribution | A/B16 | A/B16 |
| Steel fibre type | Macrofibre 60 mm | Macrofibre 60 mm |
| Steel fibre content | kg/m3 | 0 to 80 | 0 to 80 |
Table A8.
Concrete mix designs for the multiple parameter variation—part 3.
Table A8.
Concrete mix designs for the multiple parameter variation—part 3.
| Parameter | Unit | 42-65-300-35 | 52-55-300-65 |
|---|
| CEM I 32.5 R | kg/m3 | - | - |
| CEM I 42.5 R | 195.0 | - |
| CEM I 52.5 R | - | 105.0 |
| GGBS | 105.0 | 195.0 |
| Water | 195.0 | 165.0 |
| Aggregates | 1804.2 | 1878.1 |
| Water/cement ratio | - | 0.65 | 0.55 |
| Grain size distribution | A/B16 | A/B16 |
| Steel fibre type | Macrofibre 60 mm | Macrofibre 60 mm |
| Steel fibre content | kg/m3 | 0 to 80 | 0 to 80 |
Table A9.
Concrete mix designs for the multiple parameter variation—part 4.
Table A9.
Concrete mix designs for the multiple parameter variation—part 4.
| Parameter | Unit | 52-60-330-35 | 52-65-270-00 |
|---|
| CEM I 32.5 R | kg/m3 | - | - |
| CEM I 42.5 R | - | - |
| CEM I 52.5 R | 214.5 | 270.0 |
| GGBS | 115.5 | - |
| Water | 198.0 | 175.5 |
| Aggregates | 1770.3 | 1886.8 |
| Water/cement ratio | - | 0.60 | 0.65 |
| Grain size distribution | A/B16 | A/B16 |
| Steel fibre type | Macrofibre 60 mm | Macrofibre 60 mm |
| Steel fibre content | kg/m3 | 0 to 80 | 0 to 80 |
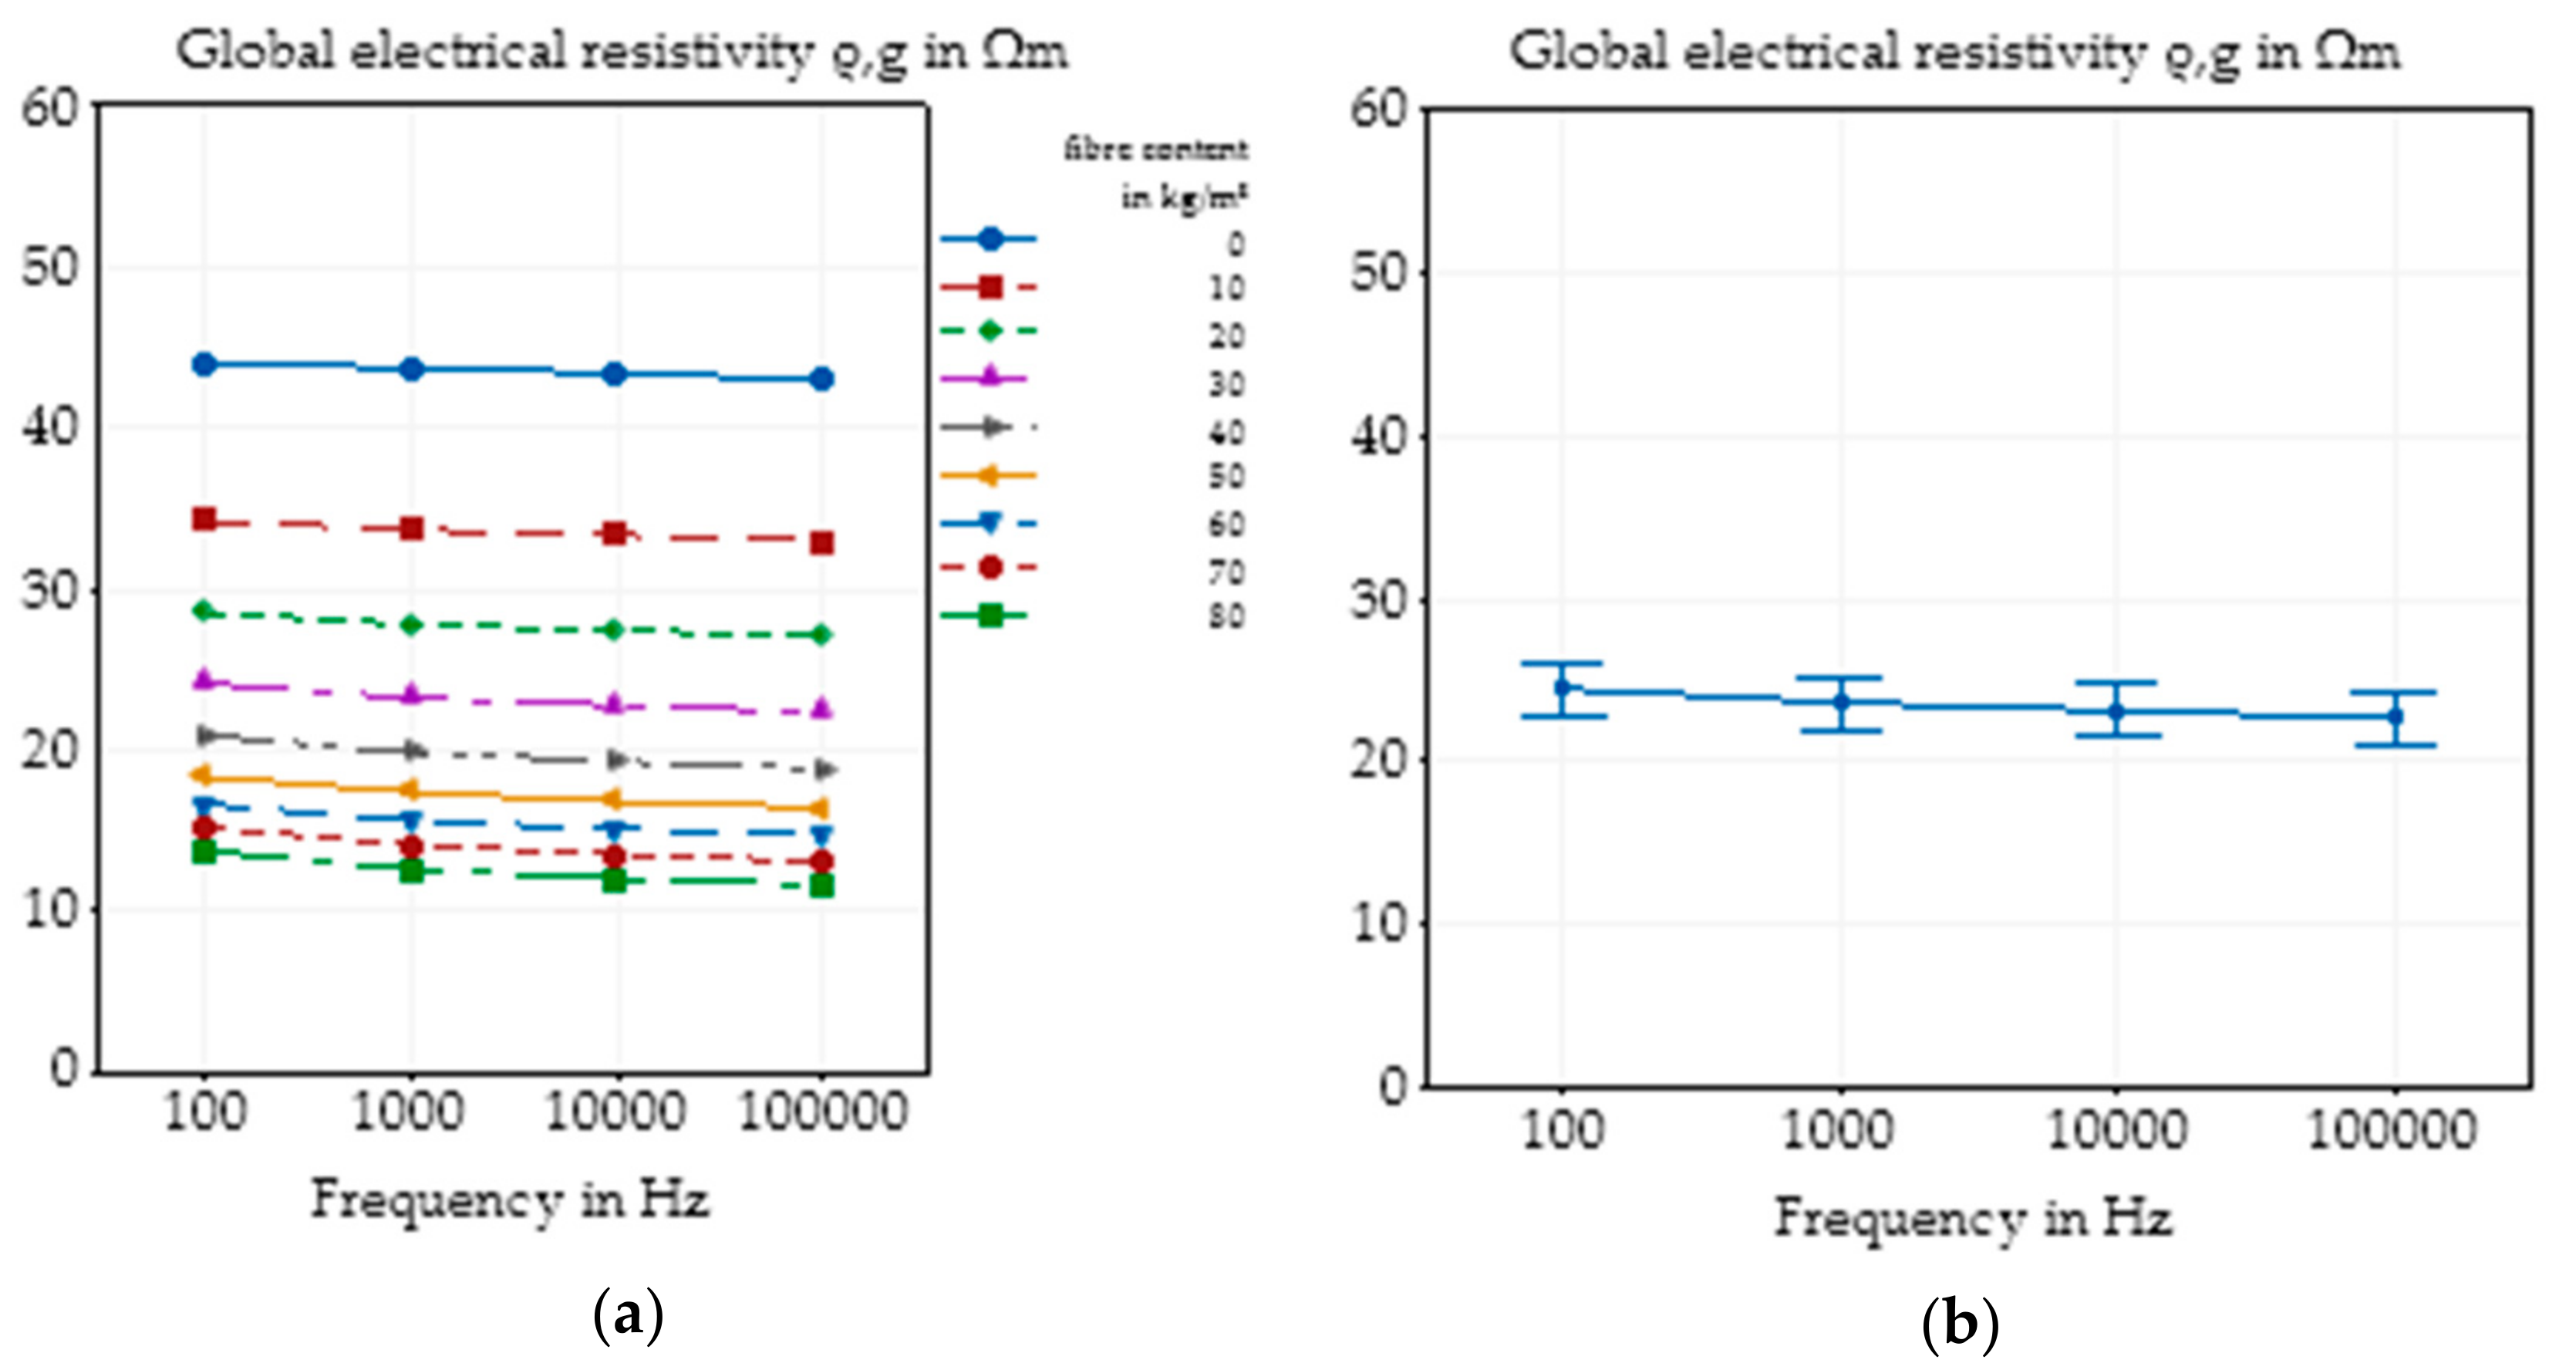
Table A10.
Results of the resistivity measurements of the basic concrete mixture (32-60-300-00).
Table A10.
Results of the resistivity measurements of the basic concrete mixture (32-60-300-00).
| Fibre Content in kg/m3 | Global Electrical Resistivity in Ωm at a Frequency of |
|---|
| 100 Hz | 120 Hz | 1 kHz | 10 kHz | 100 kHz |
|---|
| 0 | 44.1 | 44.0 | 43.7 | 43.4 | 43.0 |
| 10 | 34.2 | 34.2 | 33.7 | 33.3 | 32.9 |
| 20 | 28.5 | 28.4 | 27.8 | 27.4 | 27.1 |
| 30 | 24.1 | 24.0 | 23.2 | 22.7 | 22.3 |
| 40 | 20.9 | 20.7 | 19.8 | 19.3 | 18.8 |
| 50 | 18.3 | 18.2 | 17.4 | 16.8 | 16.4 |
| 60 | 16.6 | 16.5 | 15.6 | 15.1 | 14.7 |
| 70 | 15.2 | 15.0 | 14.1 | 13.5 | 13.1 |
| 80 | 13.7 | 13.5 | 12.5 | 12.0 | 11.6 |
Table A11.
Results of the resistivity measurements of the concrete mixture 32-55-300-00.
Table A11.
Results of the resistivity measurements of the concrete mixture 32-55-300-00.
| Fibre Content in kg/m3 | Global Electrical Resistivity in Ωm at a Frequency of |
|---|
| 100 Hz | 120 Hz | 1 kHz | 10 kHz | 100 kHz |
|---|
| 0 | 50.5 | 50.6 | 50.3 | 49.8 | 49.2 |
| 10 | 41.1 | 41.1 | 40.6 | 40.2 | 39.6 |
| 20 | 33.1 | 32.9 | 32.3 | 31.7 | 31.1 |
| 30 | 27.2 | 27.0 | 26.3 | 25.6 | 25.1 |
| 40 | 25.6 | 25.4 | 24.7 | 24.1 | 23.6 |
| 50 | 23.4 | 23.2 | 22.4 | 21.7 | 21.1 |
| 60 | 20.9 | 20.7 | 19.7 | 19.0 | 18.3 |
| 70 | 18.1 | 17.9 | 16.9 | 16.1 | 15.5 |
| 80 | 17.7 | 17.5 | 16.7 | 16.0 | 15.4 |
Table A12.
Results of the resistivity measurements of the concrete mixture 32-65-300-00.
Table A12.
Results of the resistivity measurements of the concrete mixture 32-65-300-00.
| Fibre Content in kg/m3 | Global Electrical Resistivity in Ωm at a Frequency of |
|---|
| 100 Hz | 120 Hz | 1 kHz | 10 kHz | 100 kHz |
|---|
| 0 | 40.5 | 40.6 | 40.3 | 40.0 | 39.6 |
| 10 | 32.2 | 32.1 | 31.9 | 31.5 | 31.1 |
| 20 | 26.7 | 26.6 | 26.0 | 25.5 | 25.0 |
| 30 | 24.9 | 24.7 | 24.1 | 23.4 | 23.0 |
| 40 | 20.8 | 20.7 | 20.1 | 19.5 | 18.9 |
| 50 | 18.6 | 18.4 | 17.7 | 17.1 | 16.7 |
| 60 | 17.2 | 17.0 | 16.3 | 15.4 | 14.8 |
| 70 | 17.1 | 16.9 | 16.1 | 15.2 | 14.9 |
| 80 | 16.3 | 16.1 | 15.3 | 14.6 | 14.2 |
Table A13.
Results of the resistivity measurements of the concrete mixture 32-60-270-00.
Table A13.
Results of the resistivity measurements of the concrete mixture 32-60-270-00.
| Fibre Content in kg/m3 | Global Electrical Resistivity in Ωm at a Frequency of |
|---|
| 100 Hz | 120 Hz | 1 kHz | 10 kHz | 100 kHz |
|---|
| 0 | 50.2 | 50.1 | 49.9 | 49.5 | 48.8 |
| 10 | 34.2 | 34.0 | 33.7 | 33.3 | 32.7 |
| 20 | 28.8 | 28.6 | 28.1 | 27.5 | 27.0 |
| 30 | 26.0 | 25.8 | 25.2 | 24.6 | 24.0 |
| 40 | 22.5 | 22.3 | 21.8 | 21.0 | 20.4 |
| 50 | 20.5 | 20.3 | 19.7 | 18.8 | 18.2 |
| 60 | 19.3 | 19.1 | 18.3 | 17.4 | 16.8 |
| 70 | 18.1 | 17.8 | 17.4 | 16.7 | 15.9 |
| 80 | 15.7 | 15.4 | 14.9 | 14.1 | 13.6 |
Table A14.
Results of the resistivity measurements of the concrete mixture 32-60-330-00.
Table A14.
Results of the resistivity measurements of the concrete mixture 32-60-330-00.
| Fibre Content in kg/m3 | Global Electrical Resistivity in Ωm at a Frequency of |
|---|
| 100 Hz | 120 Hz | 1 kHz | 10 kHz | 100 kHz |
|---|
| 0 | 36.7 | 36.7 | 36.3 | 36.2 | 35.9 |
| 10 | 27.7 | 27.7 | 27.1 | 27.0 | 26.7 |
| 20 | 21.8 | 21.8 | 21.1 | 20.8 | 20.5 |
| 30 | 19.9 | 19.7 | 19.0 | 18.6 | 18.3 |
| 40 | 16.5 | 16.4 | 15.7 | 15.2 | 14.9 |
| 50 | 14.8 | 14.7 | 13.9 | 13.4 | 13.1 |
| 60 | 13.7 | 13.5 | 12.6 | 12.1 | 11.8 |
| 70 | 12.2 | 12.1 | 11.2 | 10.6 | 10.3 |
| 80 | 11.3 | 11.1 | 10.3 | 9.7 | 9.3 |
Table A15.
Results of the resistivity measurements of the concrete mixture 42-60-300-00.
Table A15.
Results of the resistivity measurements of the concrete mixture 42-60-300-00.
| Fibre Content in kg/m3 | Global Electrical Resistivity in Ωm at a Frequency of |
|---|
| 100 Hz | 120 Hz | 1 kHz | 10 kHz | 100 kHz |
|---|
| 0 | 55.7 | 55.6 | 55.3 | 54.7 | 53.8 |
| 10 | 38.8 | 38.7 | 38.3 | 37.9 | 37.3 |
| 20 | 33.1 | 33.0 | 32.5 | 31.9 | 31.2 |
| 30 | 29.9 | 29.7 | 29.4 | 28.6 | 27.9 |
| 40 | 26.1 | 25.8 | 25.4 | 24.8 | 24.1 |
| 50 | 22.9 | 22.7 | 22.1 | 21.4 | 20.9 |
| 60 | 21.5 | 21.3 | 20.7 | 20.0 | 19.4 |
| 70 | 21.3 | 21.1 | 20.5 | 19.8 | 19.3 |
| 80 | 20.2 | 20.0 | 19.3 | 18.5 | 17.8 |
Table A16.
Results of the resistivity measurements of the concrete mixture 52-60-300-00.
Table A16.
Results of the resistivity measurements of the concrete mixture 52-60-300-00.
| Fibre Content in kg/m3 | Global Electrical Resistivity in Ωm at a Frequency of |
|---|
| 100 Hz | 120 Hz | 1 kHz | 10 kHz | 100 kHz |
|---|
| 0 | 39.6 | 39.5 | 39.5 | 38.9 | 38.4 |
| 10 | 35.4 | 35.2 | 35.0 | 34.3 | 33.7 |
| 20 | 28.8 | 28.6 | 28.0 | 27.2 | 26.5 |
| 30 | 27.5 | 27.3 | 26.8 | 26.2 | 25.5 |
| 40 | 24.4 | 24.2 | 23.6 | 22.7 | 22.0 |
| 50 | 21.8 | 21.6 | 21.0 | 20.3 | 19.7 |
| 60 | 20.7 | 20.5 | 20.0 | 19.1 | 18.5 |
| 70 | 19.6 | 19.3 | 18.8 | 18.0 | 17.3 |
| 80 | 18.8 | 18.6 | 18.1 | 17.3 | 16.7 |
Table A17.
Results of the resistivity measurements of the concrete mixture 32-60-300-35.
Table A17.
Results of the resistivity measurements of the concrete mixture 32-60-300-35.
| Fibre Content in kg/m3 | Global Electrical Resistivity in Ωm at a Frequency of |
|---|
| 100 Hz | 120 Hz | 1 kHz | 10 kHz | 100 kHz |
|---|
| 0 | 40.3 | 40.3 | 40.0 | 39.7 | 39.3 |
| 10 | 31.0 | 30.8 | 30.4 | 30.0 | 29.7 |
| 20 | 26.0 | 25.8 | 25.3 | 25.0 | 24.8 |
| 30 | 23.0 | 22.9 | 22.3 | 21.8 | 21.5 |
| 40 | 18.5 | 18.3 | 17.8 | 17.4 | 17.2 |
| 50 | 17.4 | 17.2 | 16.6 | 16.2 | 15.9 |
| 60 | 16.3 | 16.2 | 15.5 | 15.1 | 14.7 |
| 70 | 14.0 | 14.0 | 13.3 | 12.8 | 12.5 |
| 80 | 13.2 | 13.0 | 12.3 | 11.8 | 11.5 |
Table A18.
Results of the resistivity measurements of the concrete mixture 32-60-300-65.
Table A18.
Results of the resistivity measurements of the concrete mixture 32-60-300-65.
| Fibre Content in kg/m3 | Global Electrical Resistivity in Ωm at a Frequency of |
|---|
| 100 Hz | 120 Hz | 1 kHz | 10 kHz | 100 kHz |
|---|
| 0 | 54.5 | 54.3 | 53.9 | 53.6 | 52.8 |
| 10 | 43.3 | 43.2 | 42.6 | 42.1 | 41.6 |
| 20 | 36.1 | 35.9 | 35.3 | 34.8 | 34.3 |
| 30 | 28.6 | 28.5 | 27.8 | 27.4 | 26.9 |
| 40 | 25.0 | 24.8 | 23.9 | 23.4 | 22.9 |
| 50 | 23.5 | 23.3 | 22.4 | 21.9 | 21.4 |
| 60 | 20.1 | 20.0 | 19.2 | 18.7 | 18.2 |
| 70 | 18.9 | 18.8 | 18.1 | 17.7 | 17.2 |
| 80 | 16.9 | 16.9 | 16.1 | 15.5 | 15.1 |
Table A19.
Results of the resistivity measurements of the concrete mixture 32-60-300-00-F2.
Table A19.
Results of the resistivity measurements of the concrete mixture 32-60-300-00-F2.
| Fibre Content in kg/m3 | Global Electrical Resistivity in Ωm at a Frequency of |
|---|
| 100 Hz | 120 Hz | 1 kHz | 10 kHz | 100 kHz |
|---|
| 0 | 43.1 | 43.0 | 42.7 | 42.5 | 42.1 |
| 10 | 36.4 | 36.4 | 35.8 | 35.4 | 35.0 |
| 20 | 31.0 | 30.9 | 30.2 | 29.7 | 29.4 |
| 30 | 25.8 | 25.7 | 25.0 | 24.5 | 24.0 |
| 40 | 22.8 | 22.7 | 21.5 | 20.8 | 20.3 |
| 50 | 21.1 | 20.9 | 19.7 | 19.0 | 18.6 |
| 60 | 19.0 | 18.8 | 17.6 | 16.9 | 16.5 |
| 70 | 17.5 | 17.2 | 15.9 | 15.2 | 14.7 |
| 80 | 16.1 | 15.9 | 14.6 | 13.8 | 13.3 |
Table A20.
Results of the resistivity measurements of the concrete mixture 32-60-300-00-F3.
Table A20.
Results of the resistivity measurements of the concrete mixture 32-60-300-00-F3.
| Fibre Content in kg/m3 | Global Electrical Resistivity in Ωm at a Frequency of |
|---|
| 100 Hz | 120 Hz | 1 kHz | 10 kHz | 100 kHz |
|---|
| 0 | 44.1 | 44.0 | 43.8 | 43.5 | 43.1 |
| 10 | 36.4 | 36.1 | 34.9 | 34.4 | 33.9 |
| 20 | 30.5 | 30.2 | 28.4 | 27.7 | 27.2 |
| 30 | 26.1 | 25.6 | 23.6 | 22.6 | 22.1 |
| 40 | 22.6 | 22.3 | 20.0 | 19.0 | 18.3 |
| 50 | 19.9 | 19.5 | 17.2 | 16.1 | 15.4 |
| 60 | 17.5 | 17.1 | 14.9 | 13.7 | 13.1 |
| 70 | 15.8 | 15.5 | 13.2 | 12.0 | 11.4 |
| 80 | 14.5 | 14.1 | 11.9 | 10.7 | 10.1 |
Table A21.
Results of the resistivity measurements of the concrete mixture 32-60-300-00-F1.
Table A21.
Results of the resistivity measurements of the concrete mixture 32-60-300-00-F1.
| Fibre Content in kg/m3 | Electrical Resistivity in Horizontal Direction in Ωm at a Frequency of |
|---|
| 100 Hz | 120 Hz | 1 kHz | 10 kHz | 100 kHz |
|---|
| 0 | 43.7 | 43.7 | 43.4 | 43.1 | 42.7 |
| 10 | 31.7 | 31.6 | 31.1 | 30.7 | 30.4 |
| 20 | 24.8 | 24.7 | 24.1 | 23.7 | 23.4 |
| 30 | 20.4 | 20.3 | 19.5 | 19.1 | 18.7 |
| 40 | 17.4 | 17.2 | 16.5 | 15.9 | 15.6 |
| 50 | 14.4 | 14.3 | 13.6 | 13.1 | 12.8 |
| 60 | 13.1 | 12.9 | 12.2 | 11.8 | 11.5 |
| 70 | 11.8 | 11.7 | 10.9 | 10.5 | 10.1 |
| 80 | 10.5 | 10.2 | 9.5 | 9.1 | 8.7 |
Table A22.
Results of the resistivity measurements of the concrete mixture 32-60-300-00-F2.
Table A22.
Results of the resistivity measurements of the concrete mixture 32-60-300-00-F2.
| Fibre Content in kg/m3 | Electrical Resistivity in Horizontal Direction in Ωm at a Frequency of |
|---|
| 100 Hz | 120 Hz | 1 kHz | 10 kHz | 100 kHz |
|---|
| 0 | 43.3 | 43.3 | 43.0 | 42.7 | 42.3 |
| 10 | 34.4 | 34.4 | 33.7 | 33.3 | 33.0 |
| 20 | 28.2 | 28.1 | 27.3 | 26.8 | 26.5 |
| 30 | 22.1 | 21.9 | 21.4 | 21.0 | 20.4 |
| 40 | 18.9 | 18.7 | 17.6 | 16.9 | 16.5 |
| 50 | 17.6 | 17.4 | 16.3 | 15.7 | 15.3 |
| 60 | 15.3 | 15.1 | 14.1 | 13.4 | 13.1 |
| 70 | 14.0 | 13.8 | 12.7 | 12.0 | 11.5 |
| 80 | 12.5 | 12.4 | 11.3 | 10.7 | 10.3 |
Table A23.
Results of the resistivity measurements of the concrete mixture 32-60-300-00-F3.
Table A23.
Results of the resistivity measurements of the concrete mixture 32-60-300-00-F3.
| Fibre Content in kg/m3 | Electrical Resistivity in Horizontal Direction in Ωm at a Frequency of |
|---|
| 100 Hz | 120 Hz | 1 kHz | 10 kHz | 100 kHz |
|---|
| 0 | 44.2 | 44.1 | 43.8 | 43.6 | 43.1 |
| 10 | 35.5 | 35.2 | 33.9 | 33.4 | 33.0 |
| 20 | 29.0 | 28.8 | 26.9 | 26.2 | 25.7 |
| 30 | 24.4 | 23.9 | 22.0 | 21.0 | 20.5 |
| 40 | 20.7 | 20.4 | 18.2 | 17.2 | 16.5 |
| 50 | 18.1 | 17.7 | 15.6 | 14.5 | 13.9 |
| 60 | 15.7 | 15.2 | 13.2 | 12.2 | 11.6 |
| 70 | 14.2 | 13.9 | 11.9 | 10.7 | 10.1 |
| 80 | 12.7 | 12.3 | 10.4 | 9.3 | 8.8 |
Table A24.
Results of the resistivity measurements of the concrete mixture 32-60-300-00-F1.
Table A24.
Results of the resistivity measurements of the concrete mixture 32-60-300-00-F1.
| Fibre Content in kg/m3 | Electrical Resistivity in Vertical Direction in Ωm at a Frequency of |
|---|
| 100 Hz | 120 Hz | 1 kHz | 10 kHz | 100 kHz |
|---|
| 0 | 44.7 | 44.6 | 44.3 | 44.0 | 43.6 |
| 10 | 39.4 | 39.4 | 38.8 | 38.5 | 38.1 |
| 20 | 36.0 | 35.9 | 35.2 | 34.9 | 34.4 |
| 30 | 31.6 | 31.4 | 30.5 | 30.1 | 29.6 |
| 40 | 27.9 | 27.7 | 26.6 | 25.9 | 25.3 |
| 50 | 26.1 | 26.0 | 24.8 | 24.2 | 23.7 |
| 60 | 23.7 | 23.6 | 22.3 | 21.6 | 21.1 |
| 70 | 21.9 | 21.7 | 20.3 | 19.5 | 18.9 |
| 80 | 20.2 | 20.0 | 18.7 | 17.8 | 17.3 |
Table A25.
Results of the resistivity measurements of the concrete mixture 32-60-300-00-F2.
Table A25.
Results of the resistivity measurements of the concrete mixture 32-60-300-00-F2.
| Fibre Content in kg/m3 | Electrical Resistivity in Vertical Direction in Ωm at a Frequency of |
|---|
| 100 Hz | 120 Hz | 1 kHz | 10 kHz | 100 kHz |
|---|
| 0 | 42.6 | 42.5 | 42.2 | 42.0 | 41.6 |
| 10 | 40.4 | 40.3 | 39.8 | 39.6 | 39.1 |
| 20 | 36.7 | 36.6 | 36.1 | 35.6 | 35.2 |
| 30 | 33.4 | 33.2 | 32.2 | 31.6 | 31.1 |
| 40 | 30.8 | 30.6 | 29.2 | 28.4 | 28.0 |
| 50 | 28.0 | 27.8 | 26.4 | 25.6 | 25.1 |
| 60 | 26.5 | 26.2 | 24.7 | 24.0 | 23.5 |
| 70 | 24.5 | 24.2 | 22.5 | 21.6 | 21.0 |
| 80 | 23.3 | 23.0 | 21.1 | 20.2 | 19.5 |
Table A26.
Results of the resistivity measurements of the concrete mixture 32-60-300-00-F3.
Table A26.
Results of the resistivity measurements of the concrete mixture 32-60-300-00-F3.
| Fibre Content in kg/m3 | Electrical Resistivity in Vertical Direction in Ωm at a Frequency of |
|---|
| 100 Hz | 120 Hz | 1 kHz | 10 kHz | 100 kHz |
|---|
| 0 | 44.0 | 43.9 | 43.7 | 43.4 | 43.0 |
| 10 | 38.2 | 37.9 | 36.8 | 36.3 | 35.8 |
| 20 | 33.5 | 33.2 | 31.5 | 30.7 | 30.3 |
| 30 | 29.5 | 29.1 | 26.9 | 25.9 | 25.4 |
| 40 | 26.5 | 26.0 | 23.7 | 22.5 | 21.9 |
| 50 | 23.4 | 22.9 | 20.4 | 19.2 | 18.5 |
| 60 | 21.3 | 20.9 | 18.2 | 16.9 | 16.2 |
| 70 | 19.1 | 18.7 | 16.0 | 14.6 | 13.9 |
| 80 | 18.1 | 17.6 | 15.0 | 13.6 | 12.8 |
Table A27.
Results of the resistivity measurements of the concrete mixture 32-55-270-35.
Table A27.
Results of the resistivity measurements of the concrete mixture 32-55-270-35.
| Fibre Content in kg/m3 | Global Electrical Resistivity in Ωm at a Frequency of |
|---|
| 100 Hz | 120 Hz | 1 kHz | 10 kHz | 100 kHz |
|---|
| 0 | 48.2 | 48.1 | 47.7 | 47.5 | 47.0 |
| 10 | 39.4 | 39.4 | 38.9 | 38.5 | 38.1 |
| 20 | 31.4 | 31.3 | 30.7 | 30.3 | 29.8 |
| 30 | 25.5 | 25.3 | 24.7 | 24.3 | 24.0 |
| 40 | 21.4 | 21.3 | 20.7 | 20.2 | 19.8 |
| 50 | 20.1 | 19.9 | 19.3 | 18.8 | 18.4 |
| 60 | 17.0 | 16.9 | 16.2 | 15.7 | 15.3 |
| 70 | 16.2 | 16.1 | 15.4 | 15.0 | 14.6 |
| 80 | 15.7 | 15.6 | 14.9 | 14.4 | 14.0 |
Table A28.
Results of the resistivity measurements of the concrete mixture 32-65-330-65.
Table A28.
Results of the resistivity measurements of the concrete mixture 32-65-330-65.
| Fibre Content in kg/m3 | Global Electrical Resistivity in Ωm at a Frequency of |
|---|
| 100 Hz | 120 Hz | 1 kHz | 10 kHz | 100 kHz |
|---|
| 0 | 46.8 | 46.7 | 46.3 | 46.0 | 45.5 |
| 10 | 37.6 | 37.5 | 37.1 | 36.8 | 36.3 |
| 20 | 30.0 | 29.9 | 29.3 | 29.0 | 28.7 |
| 30 | 26.2 | 26.1 | 25.5 | 25.1 | 24.7 |
| 40 | 20.3 | 20.1 | 19.4 | 18.9 | 18.6 |
| 50 | 19.0 | 18.8 | 18.1 | 17.6 | 17.3 |
| 60 | 17.1 | 17.0 | 16.3 | 15.9 | 15.5 |
| 70 | 15.5 | 15.4 | 14.7 | 14.3 | 13.8 |
| 80 | 14.7 | 14.7 | 14.1 | 13.5 | 13.2 |
Table A29.
Results of the resistivity measurements of the concrete mixture 42-55-330-00.
Table A29.
Results of the resistivity measurements of the concrete mixture 42-55-330-00.
| Fibre Content in kg/m3 | Global Electrical Resistivity in Ωm at a Frequency of |
|---|
| 100 Hz | 120 Hz | 1 kHz | 10 kHz | 100 kHz |
|---|
| 0 | 42.0 | 42.0 | 41.7 | 41.5 | 40.9 |
| 10 | 33.3 | 33.2 | 32.8 | 32.5 | 32.1 |
| 20 | 27.3 | 27.2 | 26.7 | 26.3 | 26.0 |
| 30 | 22.5 | 22.3 | 21.8 | 21.4 | 21.0 |
| 40 | 19.7 | 19.6 | 19.0 | 18.7 | 18.4 |
| 50 | 18.0 | 17.9 | 17.4 | 17.0 | 16.7 |
| 60 | 14.9 | 14.8 | 14.1 | 13.7 | 13.4 |
| 70 | 14.2 | 14.0 | 13.4 | 12.9 | 12.5 |
| 80 | 12.7 | 12.6 | 11.9 | 11.4 | 11.1 |
Table A30.
Results of the resistivity measurements of the concrete mixture 42-60-270-65.
Table A30.
Results of the resistivity measurements of the concrete mixture 42-60-270-65.
| Fibre Content in kg/m3 | Global Electrical Resistivity in Ωm at a Frequency of |
|---|
| 100 Hz | 120 Hz | 1 kHz | 10 kHz | 100 kHz |
|---|
| 0 | 68.2 | 68.1 | 67.7 | 67.2 | 66.2 |
| 10 | 52.6 | 52.5 | 51.8 | 51.3 | 50.4 |
| 20 | 42.1 | 42.0 | 41.3 | 40.8 | 40.1 |
| 30 | 35.9 | 35.8 | 34.9 | 34.4 | 33.7 |
| 40 | 30.2 | 30.0 | 29.2 | 28.8 | 28.2 |
| 50 | 26.7 | 26.6 | 25.8 | 25.2 | 24.6 |
| 60 | 23.7 | 23.5 | 22.6 | 22.0 | 21.5 |
| 70 | 21.3 | 21.1 | 20.3 | 19.7 | 19.2 |
| 80 | 19.3 | 19.1 | 18.2 | 17.7 | 17.2 |
Table A31.
Results of the resistivity measurements of the concrete mixture 42-65-300-35.
Table A31.
Results of the resistivity measurements of the concrete mixture 42-65-300-35.
| Fibre Content in kg/m3 | Global Electrical Resistivity in Ωm at a Frequency of |
|---|
| 100 Hz | 120 Hz | 1 kHz | 10 kHz | 100 kHz |
|---|
| 0 | 33.0 | 32.9 | 32.7 | 32.5 | 32.2 |
| 10 | 26.3 | 26.3 | 25.9 | 25.6 | 25.3 |
| 20 | 21.6 | 21.6 | 21.2 | 20.9 | 20.6 |
| 30 | 18.6 | 18.5 | 17.9 | 17.6 | 17.3 |
| 40 | 16.5 | 16.3 | 15.8 | 15.5 | 15.3 |
| 50 | 13.7 | 13.6 | 13.0 | 12.7 | 12.5 |
| 60 | 12.2 | 12.1 | 11.5 | 11.2 | 10.9 |
| 70 | 12.2 | 12.1 | 11.4 | 11.4 | 11.0 |
| 80 | 10.4 | 10.3 | 9.8 | 9.5 | 9.2 |
Table A32.
Results of the resistivity measurements of the concrete mixture 52-55-300-65.
Table A32.
Results of the resistivity measurements of the concrete mixture 52-55-300-65.
| Fibre Content in kg/m3 | Global Electrical Resistivity in Ωm at a Frequency of |
|---|
| 100 Hz | 120 Hz | 1 kHz | 10 kHz | 100 kHz |
|---|
| 0 | 36.2 | 36.2 | 36.0 | 35.8 | 35.5 |
| 10 | 31.0 | 30.9 | 30.4 | 30.2 | 29.8 |
| 20 | 24.4 | 24.2 | 23.7 | 23.4 | 23.0 |
| 30 | 20.0 | 19.9 | 19.3 | 18.9 | 18.7 |
| 40 | 19.4 | 19.2 | 18.4 | 17.8 | 17.5 |
| 50 | 16.1 | 16.0 | 15.3 | 14.8 | 14.5 |
| 60 | 13.6 | 13.5 | 12.8 | 12.3 | 12.1 |
| 70 | 13.3 | 13.2 | 12.4 | 12.0 | 11.7 |
| 80 | 12.2 | 12.1 | 11.5 | 11.1 | 10.8 |
Table A33.
Results of the resistivity measurements of the concrete mixture 52-60-330-35.
Table A33.
Results of the resistivity measurements of the concrete mixture 52-60-330-35.
| Fibre Content in kg/m3 | Global Electrical Resistivity in Ωm at a Frequency of |
|---|
| 100 Hz | 120 Hz | 1 kHz | 10 kHz | 100 kHz |
|---|
| 0 | 24.5 | 24.4 | 24.3 | 24.2 | 24.0 |
| 10 | 20.8 | 20.7 | 20.4 | 20.2 | 19.9 |
| 20 | 17.5 | 17.4 | 16.9 | 16.6 | 16.4 |
| 30 | 15.5 | 15.4 | 14.9 | 14.6 | 14.3 |
| 40 | 13.8 | 13.6 | 13.0 | 12.7 | 12.5 |
| 50 | 12.5 | 12.4 | 11.8 | 11.5 | 11.2 |
| 60 | 11.3 | 11.2 | 10.6 | 10.2 | 10.0 |
| 70 | 10.2 | 10.1 | 9.5 | 9.2 | 8.9 |
| 80 | 9.1 | 9.0 | 8.4 | 8.0 | 7.8 |
Table A34.
Results of the resistivity measurements of the concrete mixture 52-65-270-00.
Table A34.
Results of the resistivity measurements of the concrete mixture 52-65-270-00.
| Fibre Content in kg/m3 | Global Electrical Resistivity in Ωm at a Frequency of |
|---|
| 100 Hz | 120 Hz | 1 kHz | 10 kHz | 100 kHz |
|---|
| 0 | 36.8 | 36.8 | 36.5 | 36.2 | 35.9 |
| 10 | 29.4 | 29.3 | 28.8 | 28.5 | 28.1 |
| 20 | 23.3 | 23.2 | 22.5 | 22.1 | 21.8 |
| 30 | 20.3 | 20.1 | 19.3 | 18.8 | 18.5 |
| 40 | 17.3 | 17.1 | 16.4 | 15.9 | 15.5 |
| 50 | 16.0 | 15.8 | 14.9 | 14.5 | 14.1 |
| 60 | 14.2 | 14.0 | 13.2 | 12.8 | 12.4 |
| 70 | 13.2 | 13.1 | 12.2 | 11.7 | 11.3 |
| 80 | 12.3 | 12.1 | 11.3 | 10.8 | 10.4 |
Table A35.
Results of the resistivity measurements of the concrete mixture 32-60-300-00 after storage in H2O for 7 days for the investigations of possible leaching effects.
Table A35.
Results of the resistivity measurements of the concrete mixture 32-60-300-00 after storage in H2O for 7 days for the investigations of possible leaching effects.
| Fibre Content in kg/m3 | Global Electrical Resistivity in Ωm at a Frequency of |
|---|
| 100 Hz | 120 Hz | 1 kHz | 10 kHz | 100 kHz |
|---|
| 0 | 40.0 | 40.0 | 39.7 | 39.5 | 39.1 |
| 40 | 20.1 | 19.9 | 19.2 | 18.8 | 18.4 |
| 80 | 12.7 | 12.6 | 11.9 | 11.5 | 11.1 |
Table A36.
Results of the resistivity measurements of the concrete mixture 32-60-300-00 after storage in H2O for 14 days for the investigations of possible leaching effects.
Table A36.
Results of the resistivity measurements of the concrete mixture 32-60-300-00 after storage in H2O for 14 days for the investigations of possible leaching effects.
| Fibre Content in kg/m3 | Global Electrical Resistivity in Ωm at a Frequency of |
|---|
| 100 Hz | 120 Hz | 1 kHz | 10 kHz | 100 kHz |
|---|
| 0 | 46.2 | 46.1 | 45.9 | 45.6 | 45.1 |
| 40 | 21.4 | 21.4 | 20.6 | 20.1 | 19.7 |
| 80 | 13.9 | 13.8 | 13.1 | 12.6 | 12.3 |
Table A37.
Results of the resistivity measurements of the concrete mixture 32-60-300-00 after storage in H2O for 28 days for the investigations of possible leaching effects.
Table A37.
Results of the resistivity measurements of the concrete mixture 32-60-300-00 after storage in H2O for 28 days for the investigations of possible leaching effects.
| Fibre Content in kg/m3 | Global Electrical Resistivity in Ωm at a Frequency of |
|---|
| 100 Hz | 120 Hz | 1 kHz | 10 kHz | 100 kHz |
|---|
| 0 | 50.5 | 51.4 | 51.3 | 51.0 | 50.5 |
| 40 | 23.8 | 23.7 | 22.9 | 22.3 | 21.8 |
| 80 | 15.3 | 15.2 | 14.4 | 13.9 | 13.5 |
Table A38.
Results of the resistivity measurements of the concrete mixture 32-60-300-00 after storage in H2O for 56 days for the investigations of possible leaching effects.
Table A38.
Results of the resistivity measurements of the concrete mixture 32-60-300-00 after storage in H2O for 56 days for the investigations of possible leaching effects.
| Fibre Content in kg/m3 | Global Electrical Resistivity in Ωm at a Frequency of |
|---|
| 100 Hz | 120 Hz | 1 kHz | 10 kHz | 100 kHz |
|---|
| 0 | 57.0 | 56.9 | 56.6 | 56.1 | 55.0 |
| 40 | 26.5 | 26.4 | 25.3 | 24.5 | 23.5 |
| 80 | 15.8 | 15.7 | 14.9 | 14.3 | 13.9 |
Table A39.
Results of the resistivity measurements of the concrete mixture 32-60-300-00 after storage in H2O for 91 days for the investigations of possible leaching effects.
Table A39.
Results of the resistivity measurements of the concrete mixture 32-60-300-00 after storage in H2O for 91 days for the investigations of possible leaching effects.
| Fibre Content in kg/m3 | Global Electrical Resistivity in Ωm at a Frequency of |
|---|
| 100 Hz | 120 Hz | 1 kHz | 10 kHz | 100 kHz |
|---|
| 0 | 63.0 | 63.0 | 62.3 | 61.2 | 59.2 |
| 40 | 30.1 | 30.0 | 28.5 | 27.0 | 25.5 |
| 80 | 16.3 | 16.1 | 15.2 | 14.6 | 14.2 |
Table A40.
Results of the resistivity measurements of the concrete mixture 32-60-300-00 after storage in H2O for 185 days for the investigations of possible leaching effects.
Table A40.
Results of the resistivity measurements of the concrete mixture 32-60-300-00 after storage in H2O for 185 days for the investigations of possible leaching effects.
| Fibre Content in kg/m3 | Global Electrical Resistivity in Ωm at a Frequency of |
|---|
| 100 Hz | 120 Hz | 1 kHz | 10 kHz | 100 kHz |
|---|
| 0 | 78.3 | 78.2 | 74.8 | 70.4 | 66.3 |
| 40 | 42.7 | 42.3 | 38.2 | 33.3 | 29.3 |
| 80 | 19.2 | 19.0 | 17.7 | 16.5 | 15.4 |
Table A41.
Results of the resistivity measurements of the concrete mixture 32-60-300-00 after storage in Ca(OH)2 for 7 days for the investigations of possible leaching effects.
Table A41.
Results of the resistivity measurements of the concrete mixture 32-60-300-00 after storage in Ca(OH)2 for 7 days for the investigations of possible leaching effects.
| Fibre Content in kg/m3 | Global Electrical Resistivity in Ωm at a Frequency of |
|---|
| 100 Hz | 120 Hz | 1 kHz | 10 kHz | 100 kHz |
|---|
| 0 | 39.4 | 39.4 | 39.1 | 38.9 | 38.5 |
| 40 | 18.9 | 18.8 | 18.2 | 17.7 | 17.4 |
| 80 | 12.6 | 12.4 | 11.8 | 11.4 | 11.1 |
Table A42.
Results of the resistivity measurements of the concrete mixture 32-60-300-00 after storage in Ca(OH)2 for 14 days for the investigations of possible leaching effects.
Table A42.
Results of the resistivity measurements of the concrete mixture 32-60-300-00 after storage in Ca(OH)2 for 14 days for the investigations of possible leaching effects.
| Fibre Content in kg/m3 | Global Electrical Resistivity in Ωm at a Frequency of |
|---|
| 100 Hz | 120 Hz | 1 kHz | 10 kHz | 100 kHz |
|---|
| 0 | 44.8 | 44.8 | 44.5 | 44.2 | 43.8 |
| 40 | 20.9 | 20.9 | 20.2 | 19.7 | 19.4 |
| 80 | 13.2 | 13.1 | 12.4 | 12.1 | 11.8 |
Table A43.
Results of the resistivity measurements of the concrete mixture 32-60-300-00 after storage in Ca(OH)2 for 28 days for the investigations of possible leaching effects.
Table A43.
Results of the resistivity measurements of the concrete mixture 32-60-300-00 after storage in Ca(OH)2 for 28 days for the investigations of possible leaching effects.
| Fibre Content in kg/m3 | Global Electrical Resistivity in Ωm at a Frequency of |
|---|
| 100 Hz | 120 Hz | 1 kHz | 10 kHz | 100 kHz |
|---|
| 0 | 49.6 | 49.6 | 49.3 | 49.0 | 48.4 |
| 40 | 22.2 | 22.1 | 21.4 | 20.9 | 20.5 |
| 80 | 14.3 | 14.2 | 13.5 | 13.0 | 12.7 |
Table A44.
Results of the resistivity measurements of the concrete mixture 32-60-300-00 after storage in Ca(OH)2 for 56 days for the investigations of possible leaching effects.
Table A44.
Results of the resistivity measurements of the concrete mixture 32-60-300-00 after storage in Ca(OH)2 for 56 days for the investigations of possible leaching effects.
| Fibre Content in kg/m3 | Global Electrical Resistivity in Ωm at a Frequency of |
|---|
| 100 Hz | 120 Hz | 1 kHz | 10 kHz | 100 kHz |
|---|
| 0 | 53.7 | 53.7 | 53.3 | 53.0 | 52.1 |
| 40 | 23.6 | 23.5 | 22.8 | 22.3 | 21.8 |
| 80 | 15.8 | 15.7 | 14.8 | 14.0 | 13.2 |
Table A45.
Results of the resistivity measurements of the concrete mixture 32-60-300-00 after storage in Ca(OH)2 for 91 days for the investigations of possible leaching effects.
Table A45.
Results of the resistivity measurements of the concrete mixture 32-60-300-00 after storage in Ca(OH)2 for 91 days for the investigations of possible leaching effects.
| Fibre Content in kg/m3 | Global Electrical Resistivity in Ωm at a Frequency of |
|---|
| 100 Hz | 120 Hz | 1 kHz | 10 kHz | 100 kHz |
|---|
| 0 | 59.2 | 59.2 | 58.7 | 57.7 | 56.2 |
| 40 | 26.1 | 25.9 | 25.1 | 24.5 | 24.1 |
| 80 | 18.8 | 18.6 | 17.3 | 15.7 | 14.4 |
Table A46.
Results of the resistivity measurements of the concrete mixture 32-60-300-00 after storage in Ca(OH)2 for 185 days for the investigations of possible leaching effects.
Table A46.
Results of the resistivity measurements of the concrete mixture 32-60-300-00 after storage in Ca(OH)2 for 185 days for the investigations of possible leaching effects.
| Fibre Content in kg/m3 | Global Electrical Resistivity in Ωm at a Frequency of |
|---|
| 100 Hz | 120 Hz | 1 kHz | 10 kHz | 100 kHz |
|---|
| 0 | 68.0 | 67.9 | 67.1 | 65.5 | 63.1 |
| 40 | 30.3 | 30.2 | 29.0 | 27.9 | 26.6 |
| 80 | 24.8 | 24.7 | 21.9 | 18.5 | 15.9 |
Table A47.
Results of the resistivity measurements of the concrete mixture 32-60-300-00 after storage in synthetical pore solution for 7 days for the investigations of possible leaching effects.
Table A47.
Results of the resistivity measurements of the concrete mixture 32-60-300-00 after storage in synthetical pore solution for 7 days for the investigations of possible leaching effects.
| Fibre Content in kg/m3 | Global Electrical Resistivity in Ωm at a Frequency of |
|---|
| 100 Hz | 120 Hz | 1 kHz | 10 kHz | 100 kHz |
|---|
| 0 | 36.6 | 36.6 | 36.4 | 36.1 | 35.8 |
| 40 | 16.0 | 15.8 | 15.2 | 14.7 | 14.4 |
| 80 | 9.1 | 8.9 | 8.2 | 7.8 | 7.6 |
Table A48.
Results of the resistivity measurements of the concrete mixture 32-60-300-00 after storage in synthetical pore solution for 14 days for the investigations of possible leaching effects.
Table A48.
Results of the resistivity measurements of the concrete mixture 32-60-300-00 after storage in synthetical pore solution for 14 days for the investigations of possible leaching effects.
| Fibre Content in kg/m3 | Global Electrical Resistivity in Ωm at a Frequency of |
|---|
| 100 Hz | 120 Hz | 1 kHz | 10 kHz | 100 kHz |
|---|
| 0 | 42.2 | 42.1 | 42.0 | 41.6 | 41.1 |
| 40 | 17.5 | 17.5 | 16.6 | 16.2 | 15.8 |
| 80 | 9.7 | 9.6 | 8.8 | 8.3 | 8.1 |
Table A49.
Results of the resistivity measurements of the concrete mixture 32-60-300-00 after storage in synthetical pore solution for 28 days for the investigations of possible leaching effects.
Table A49.
Results of the resistivity measurements of the concrete mixture 32-60-300-00 after storage in synthetical pore solution for 28 days for the investigations of possible leaching effects.
| Fibre Content in kg/m3 | Global Electrical Resistivity in Ωm at a Frequency of |
|---|
| 100 Hz | 120 Hz | 1 kHz | 10 kHz | 100 kHz |
|---|
| 0 | 48.6 | 48.5 | 48.3 | 48.0 | 47.3 |
| 40 | 19.7 | 19.5 | 18.7 | 18.2 | 17.8 |
| 80 | 11.6 | 11.4 | 10.6 | 10.1 | 9.7 |
Table A50.
Results of the resistivity measurements of the concrete mixture 32-60-300-00 after storage in synthetical pore solution for 56 days for the investigations of possible leaching effects.
Table A50.
Results of the resistivity measurements of the concrete mixture 32-60-300-00 after storage in synthetical pore solution for 56 days for the investigations of possible leaching effects.
| Fibre Content in kg/m3 | Global Electrical Resistivity in Ωm at a Frequency of |
|---|
| 100 Hz | 120 Hz | 1 kHz | 10 kHz | 100 kHz |
|---|
| 0 | 52.3 | 52.3 | 52.0 | 51.6 | 50.9 |
| 40 | 21.8 | 21.6 | 20.7 | 20.1 | 19.5 |
| 80 | 12.7 | 12.6 | 11.6 | 11.0 | 10.4 |
Table A51.
Results of the resistivity measurements of the concrete mixture 32-60-300-00 after storage in synthetical pore solution for 91 days for the investigations of possible leaching effects.
Table A51.
Results of the resistivity measurements of the concrete mixture 32-60-300-00 after storage in synthetical pore solution for 91 days for the investigations of possible leaching effects.
| Fibre Content in kg/m3 | Global Electrical Resistivity in Ωm at a Frequency of |
|---|
| 100 Hz | 120 Hz | 1 kHz | 10 kHz | 100 kHz |
|---|
| 0 | 54.6 | 54.6 | 54.3 | 53.9 | 52.9 |
| 40 | 23.2 | 23.1 | 22.1 | 21.4 | 20.6 |
| 80 | 13.5 | 13.4 | 12.4 | 11.6 | 10.8 |
Table A52.
Results of the resistivity measurements of the concrete mixture 32-60-300-00 after storage in synthetical pore solution for 185 days for the investigations of possible leaching effects.
Table A52.
Results of the resistivity measurements of the concrete mixture 32-60-300-00 after storage in synthetical pore solution for 185 days for the investigations of possible leaching effects.
| Fibre Content in kg/m3 | Global Electrical Resistivity in Ωm at a Frequency of |
|---|
| 100 Hz | 120 Hz | 1 kHz | 10 kHz | 100 kHz |
|---|
| 0 | 62.1 | 62.0 | 61.6 | 60.8 | 59.4 |
| 40 | 27.2 | 27.0 | 25.8 | 24.9 | 23.8 |
| 80 | 18.7 | 18.5 | 16.5 | 15.0 | 13.7 |
Figure A1.
Interaction plot of the effects of the concrete composition on the global electrical resistivity of SFRC calculated by Minitab based on the mixtures of the multiple parameter variation.
Figure A1.
Interaction plot of the effects of the concrete composition on the global electrical resistivity of SFRC calculated by Minitab based on the mixtures of the multiple parameter variation.
Figure A2.
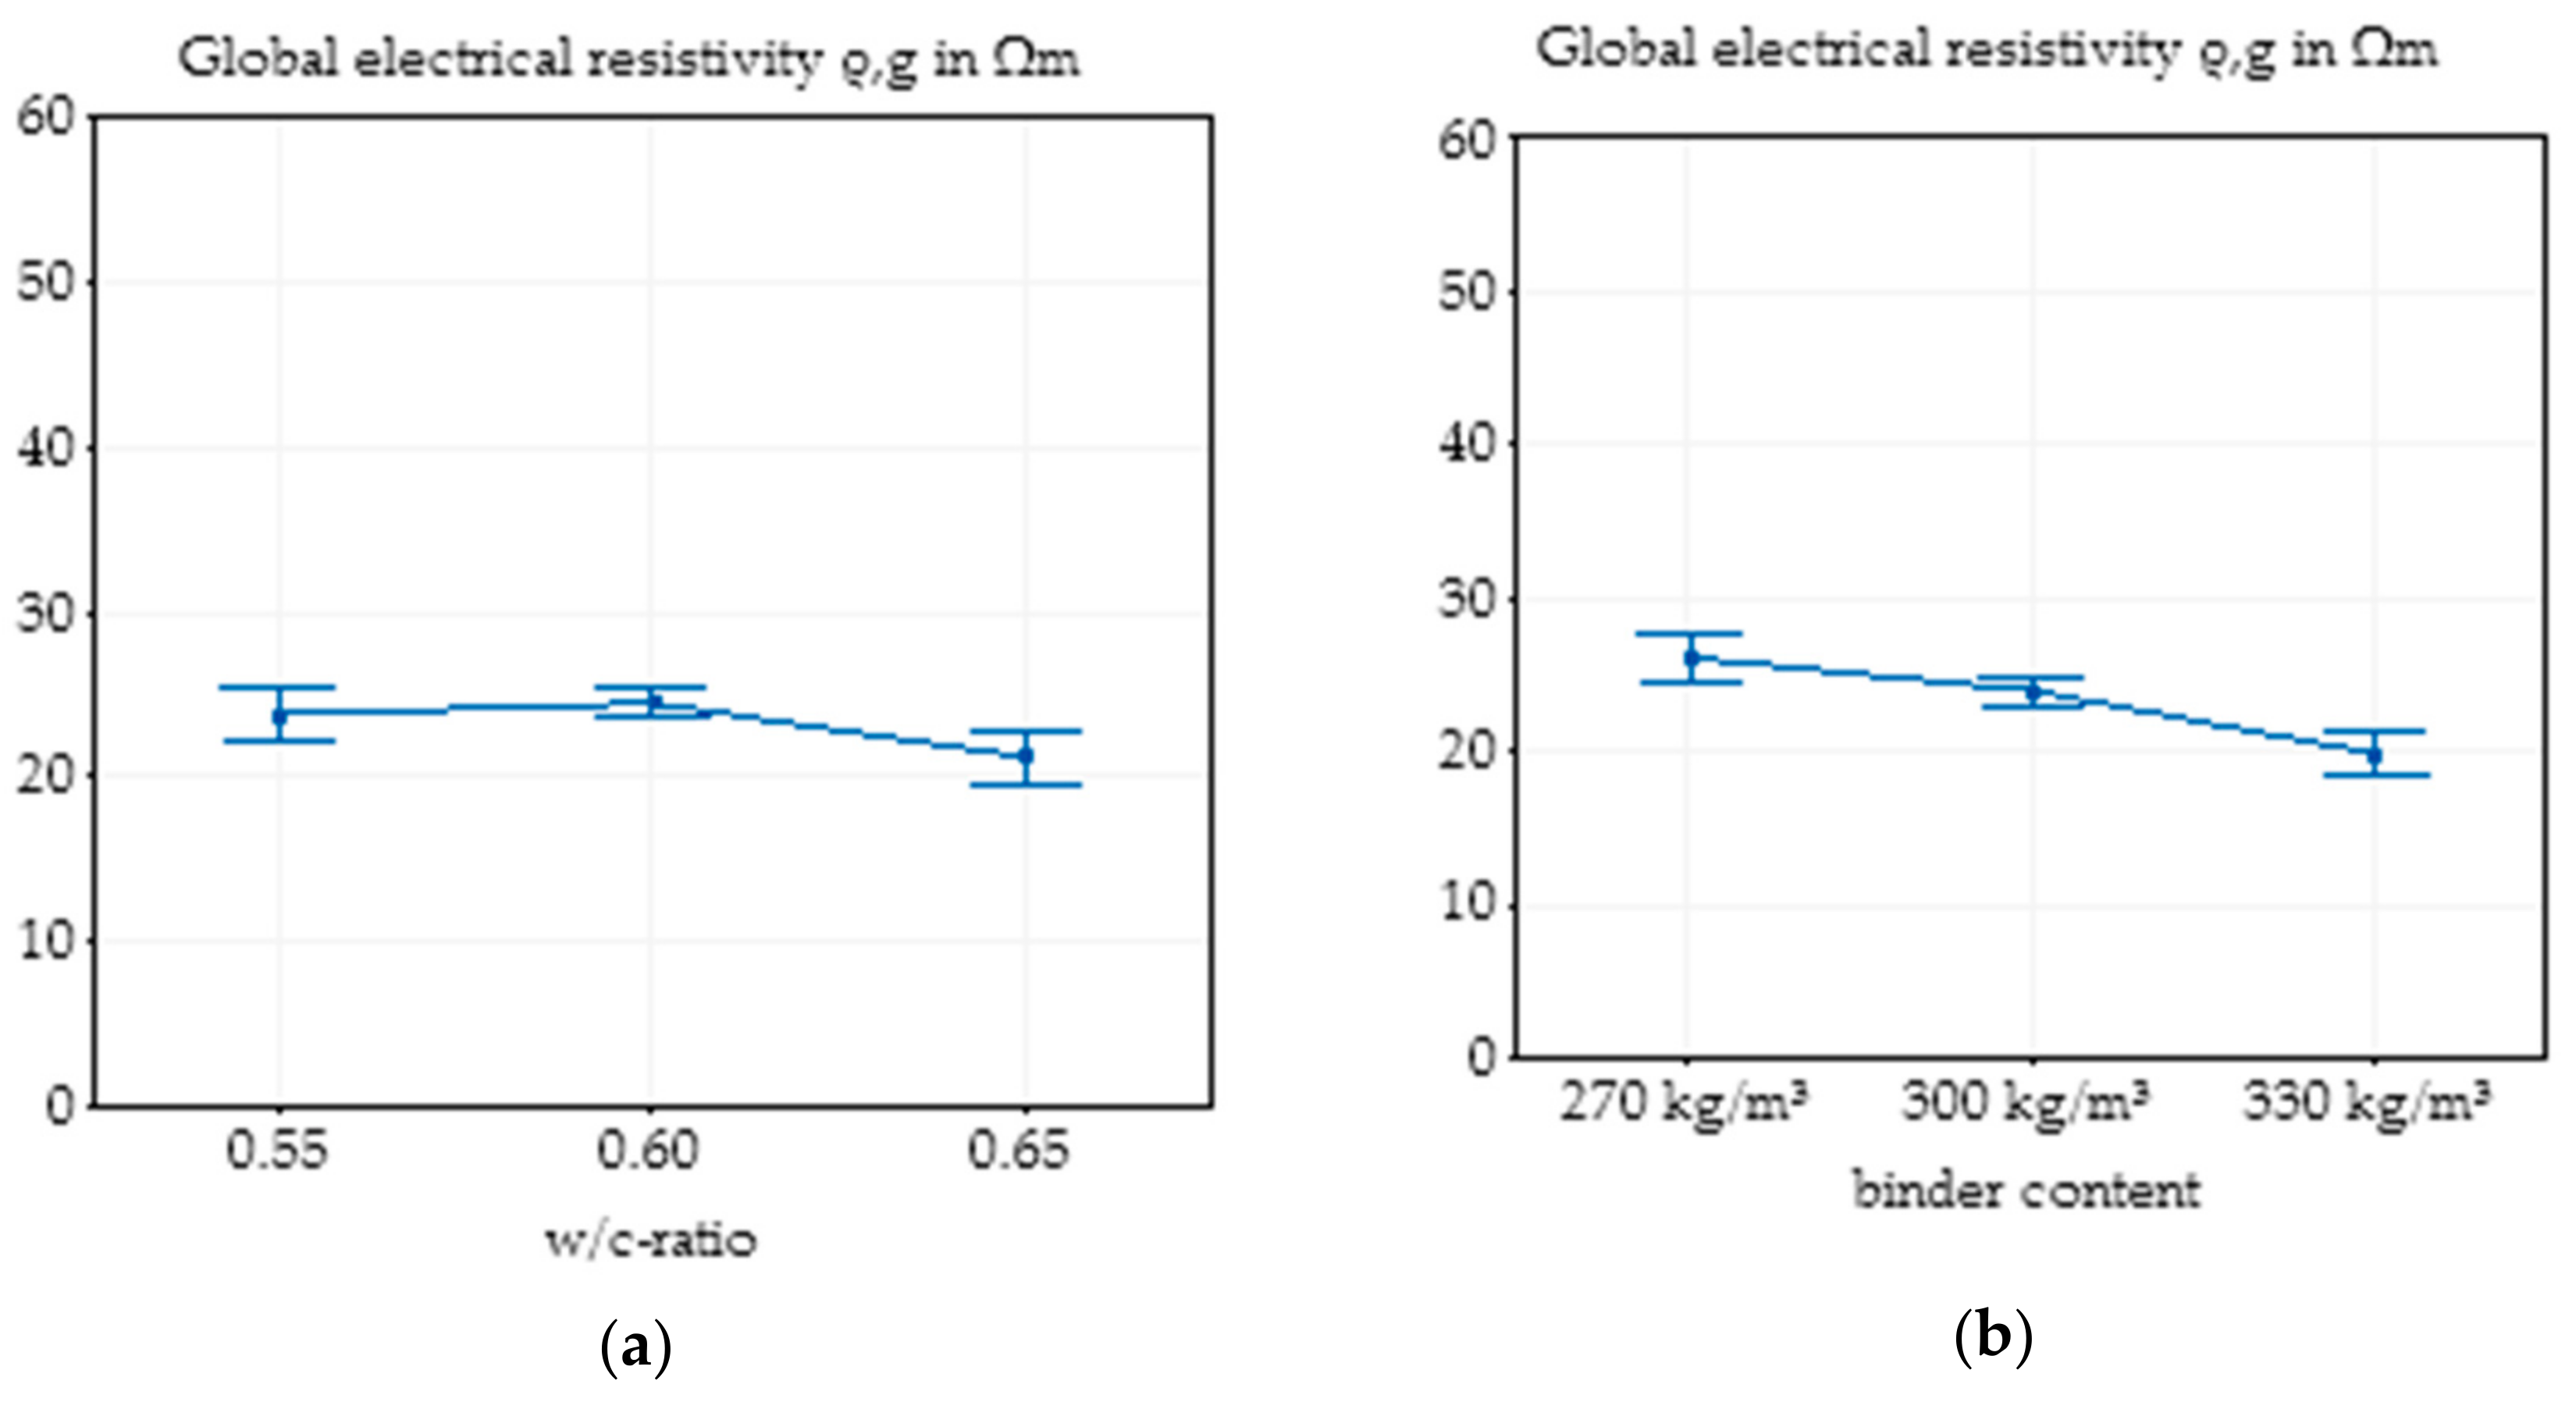
Main effect plot with 95% confidence interval of the w/c ratio on the global electrical resistivity of SFRC calculated by Minitab based on all experimental data (a) and main effect plot with 95% confidence interval of the binder content on the global electrical resistivity of SFRC calculated by Minitab based on all experimental data (b).
Figure A2.
Main effect plot with 95% confidence interval of the w/c ratio on the global electrical resistivity of SFRC calculated by Minitab based on all experimental data (a) and main effect plot with 95% confidence interval of the binder content on the global electrical resistivity of SFRC calculated by Minitab based on all experimental data (b).
Figure A3.
Main effect plot with 95% confidence interval of the cement type on the global electrical resistivity of SFRC calculated by Minitab based on all experimental data (a) and main effect plot with 95% confidence interval of the GGBS content on the global electrical resistivity of SFRC calculated by Minitab based on all experimental data (b).


