
Construction of a Three-Dimensional BaTiO3 Network for Enhanced Permittivity and Energy Storage of PVDF Composites

 , , , ,
Abstract
:1. Introduction
2. Materials and Methods
2.1. Materials
2.2. Preparation of 3D BT Network
2.3. Preparation of 3D BT/PVDF Composites
2.4. Characterization
3. Results and Discussions
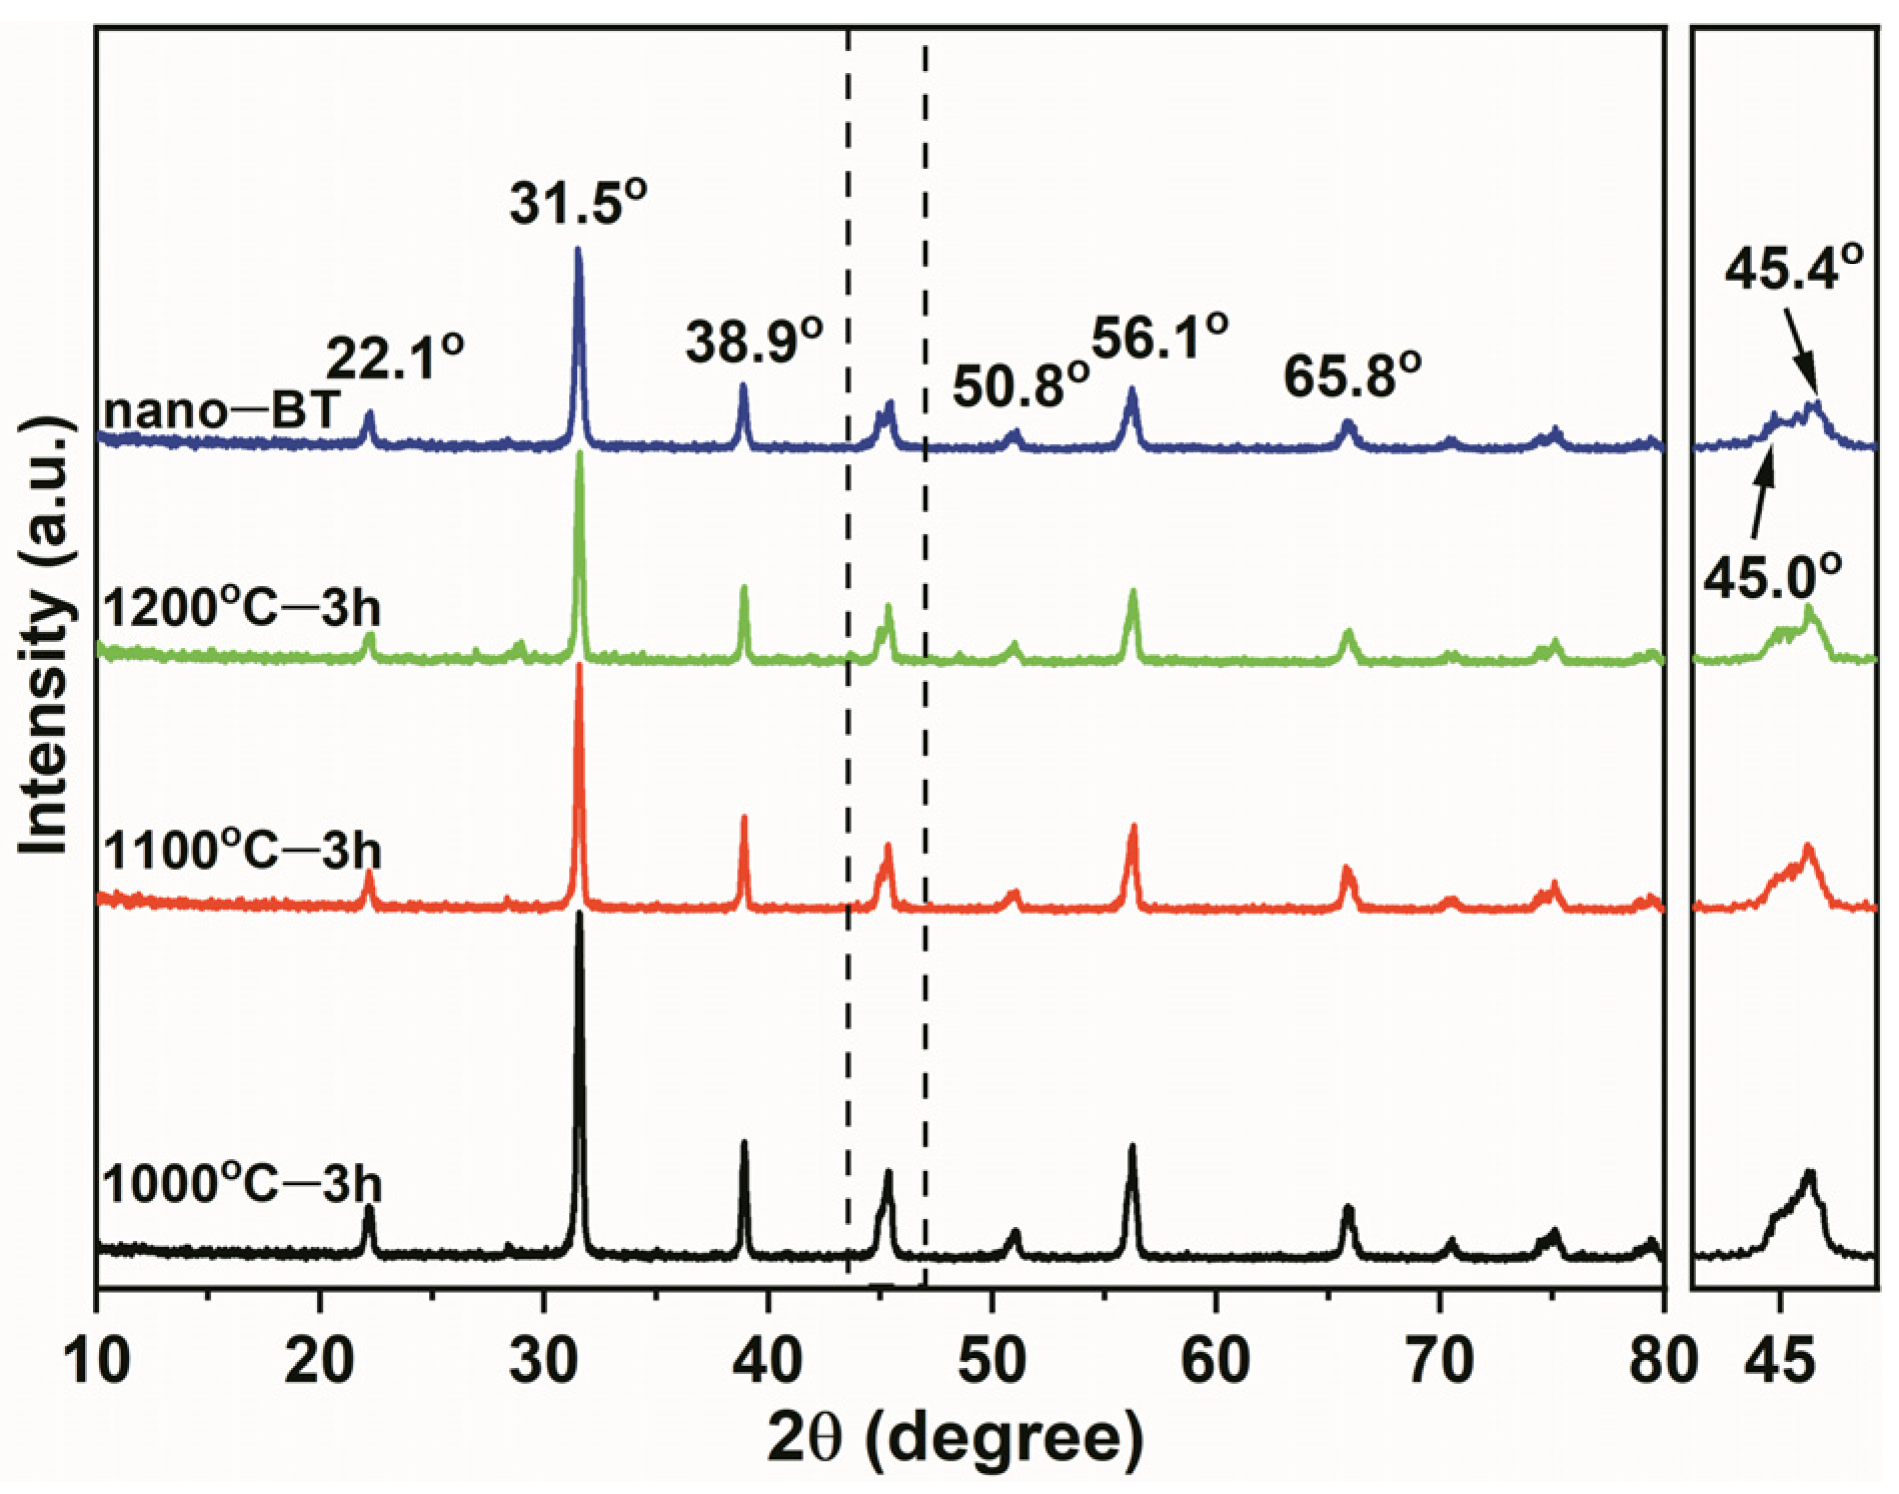
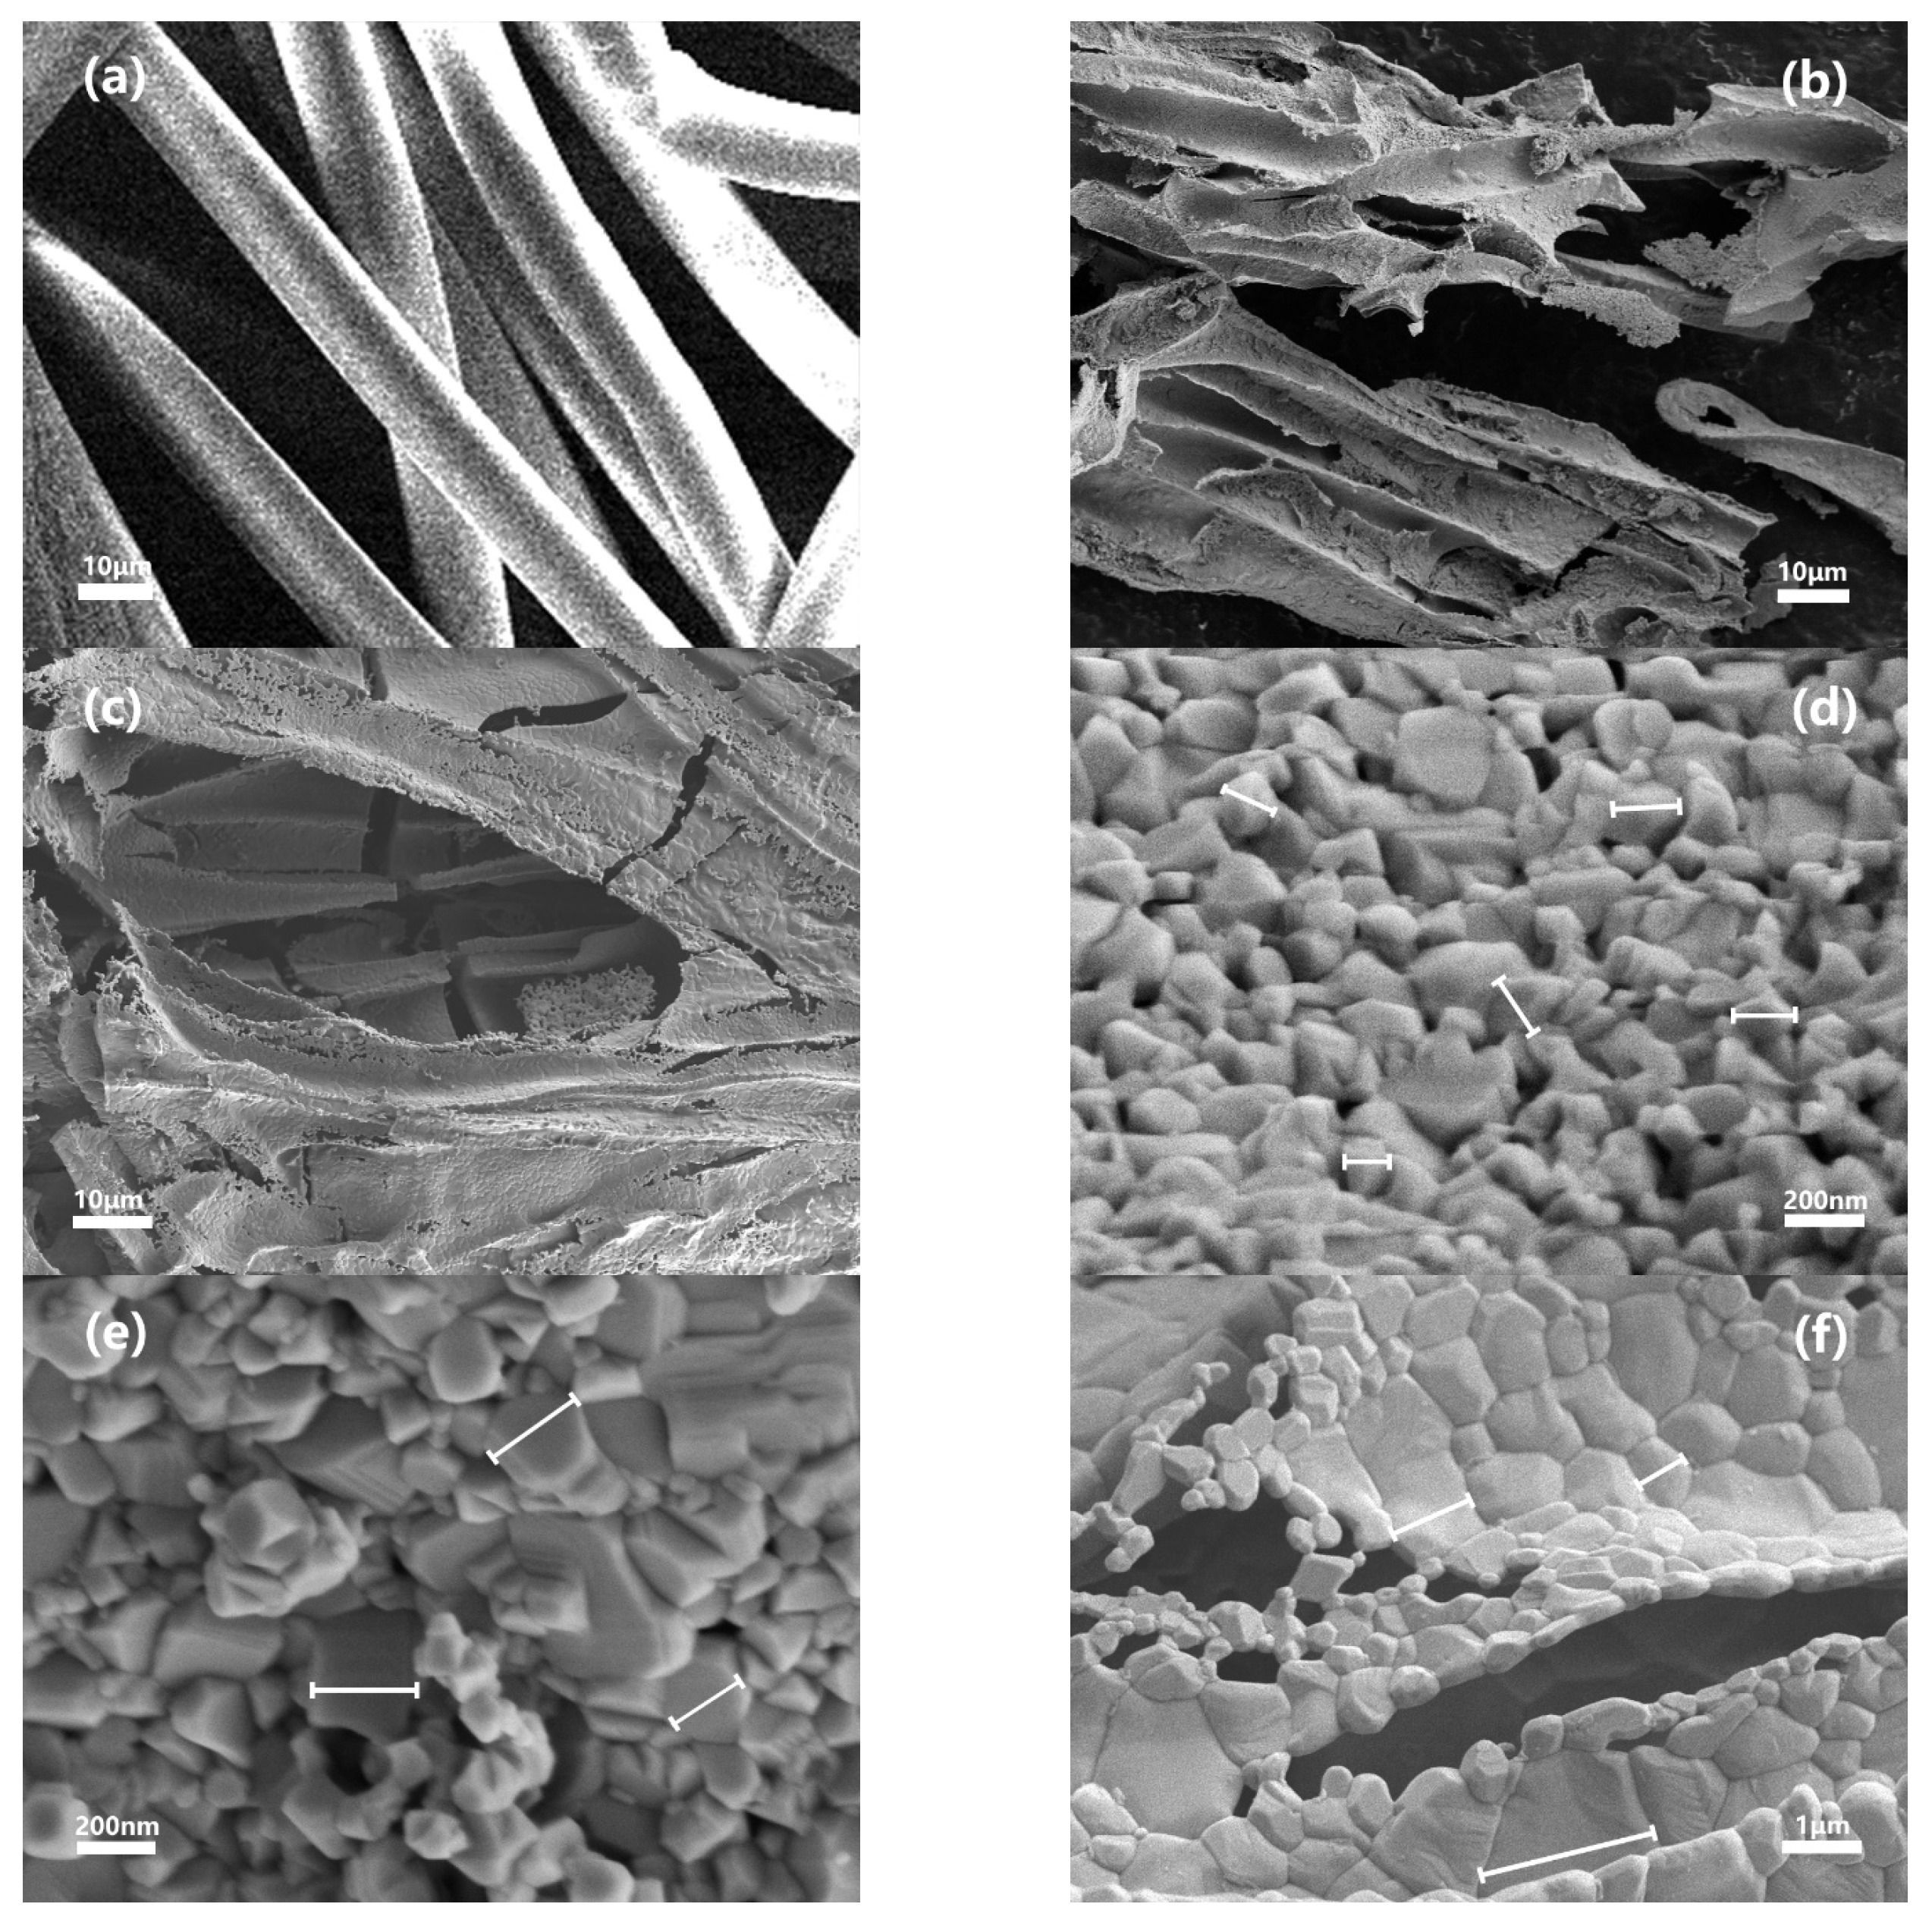
3.1. Structure and Morphology of 3D BT Network
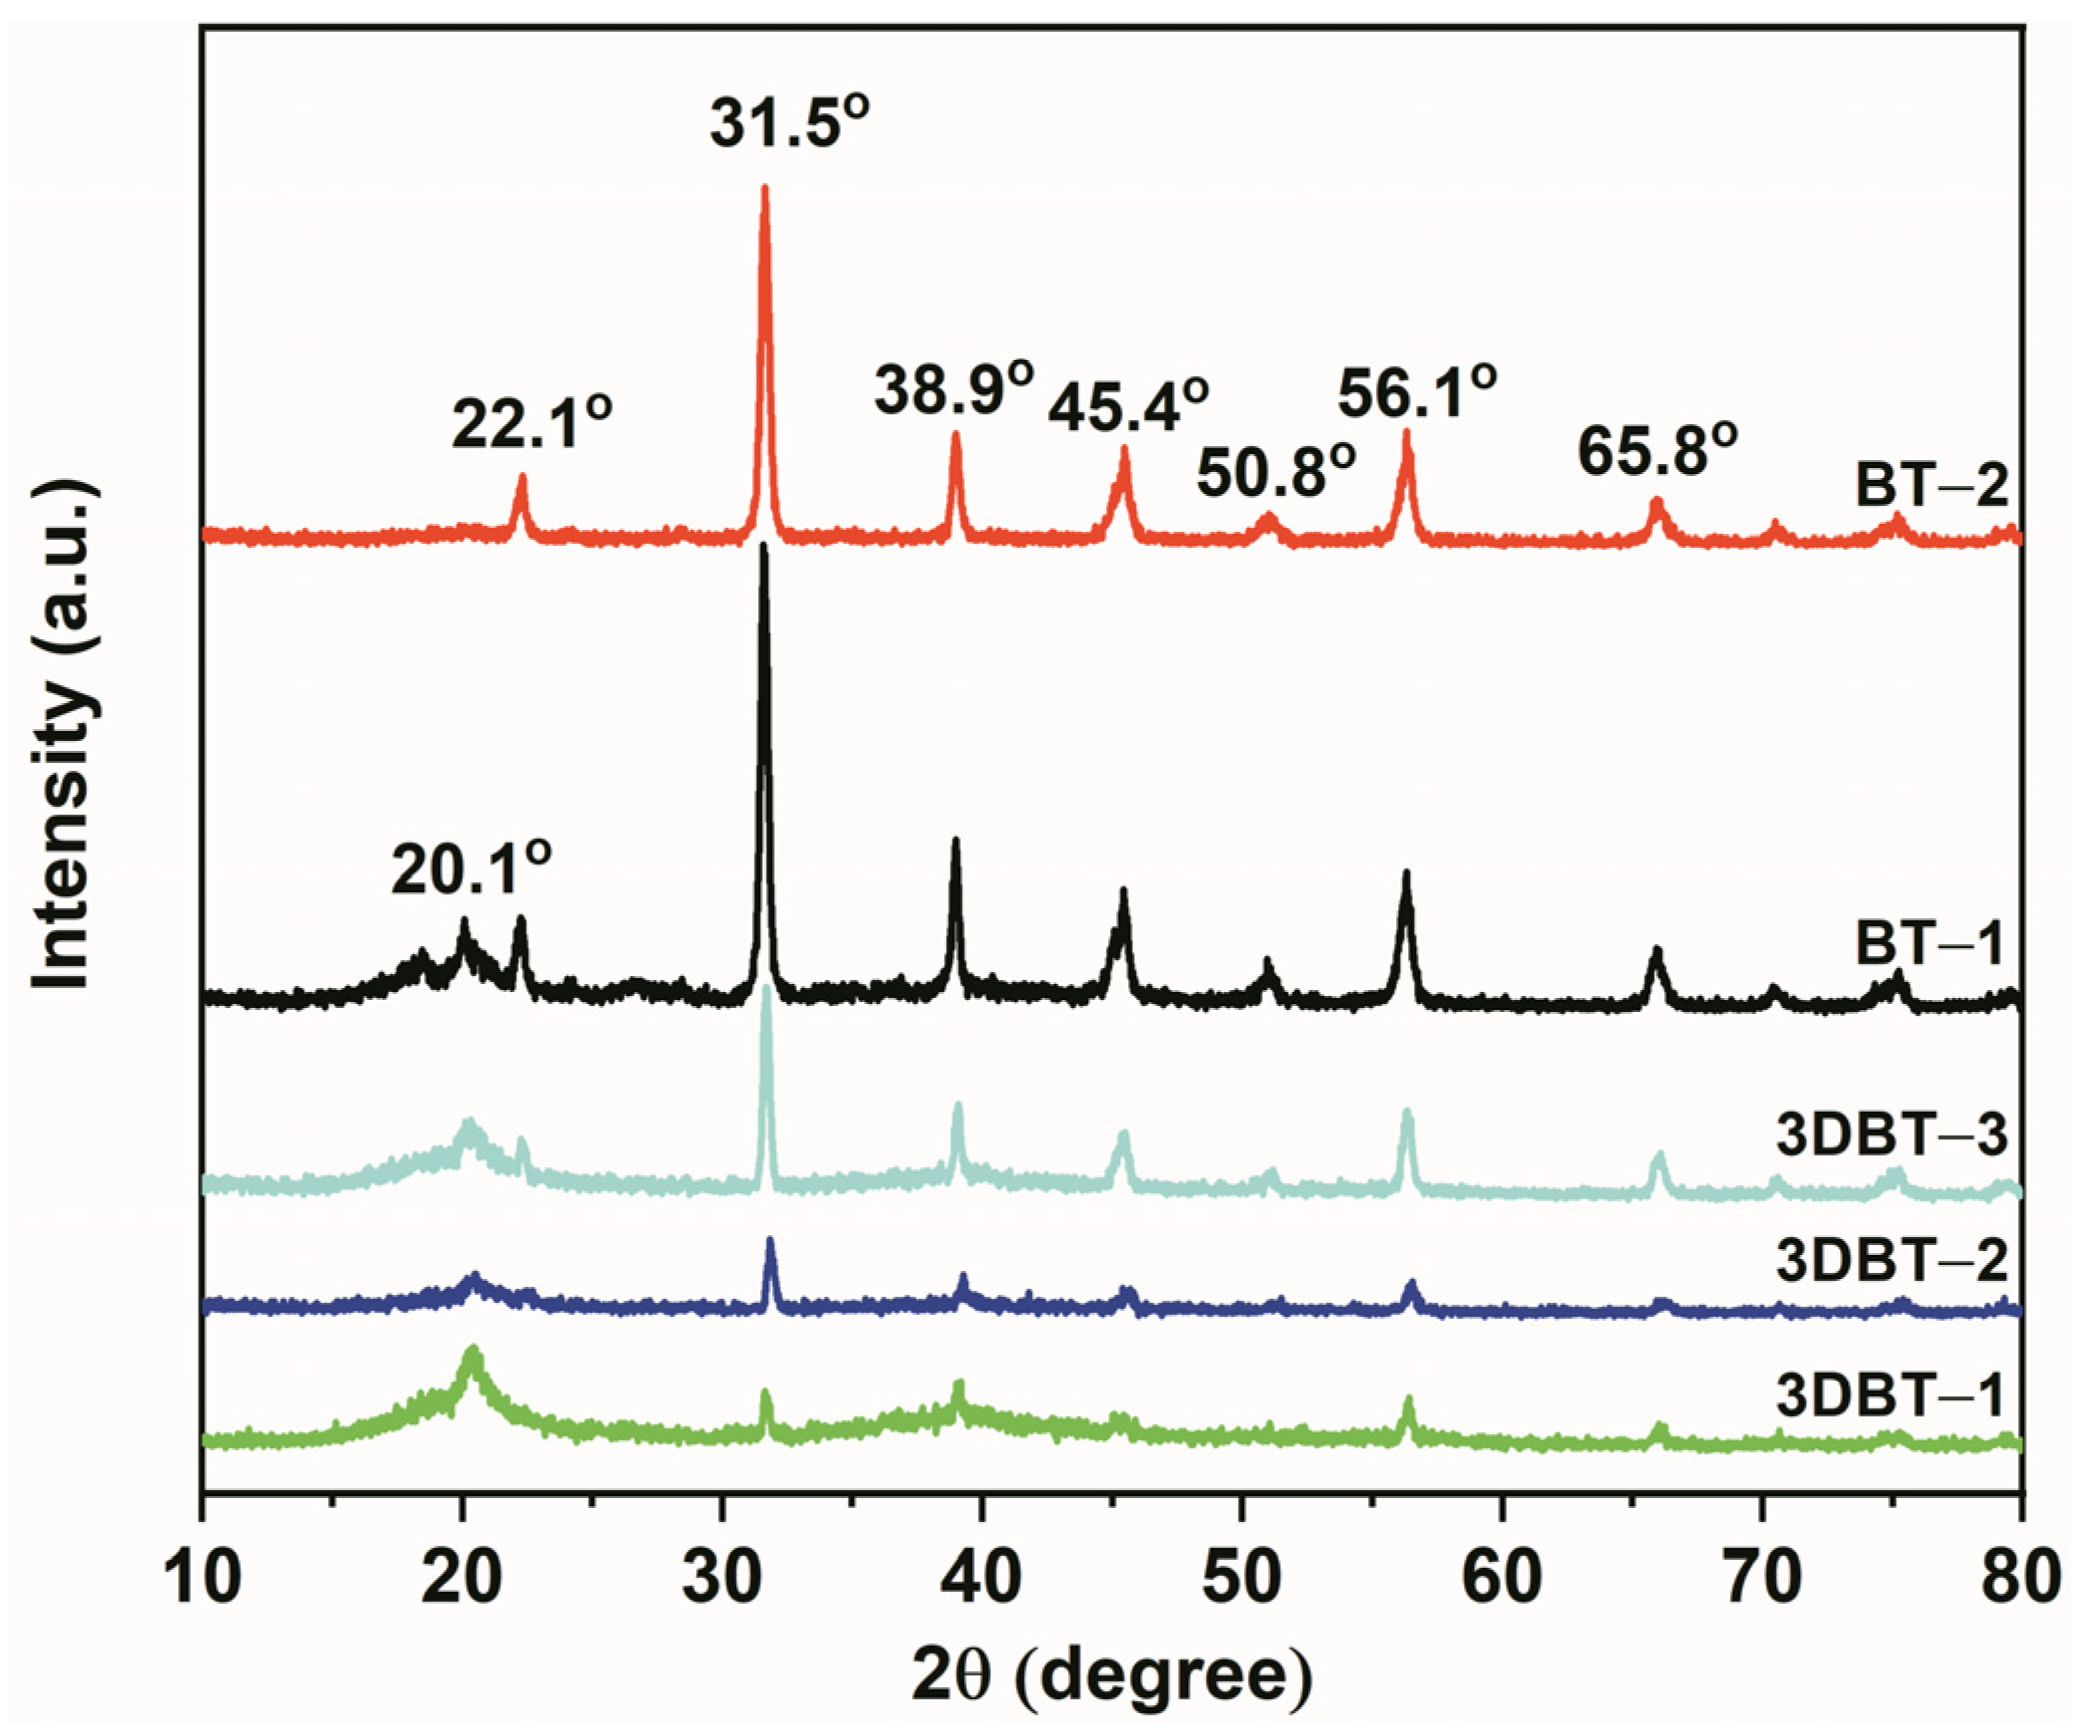
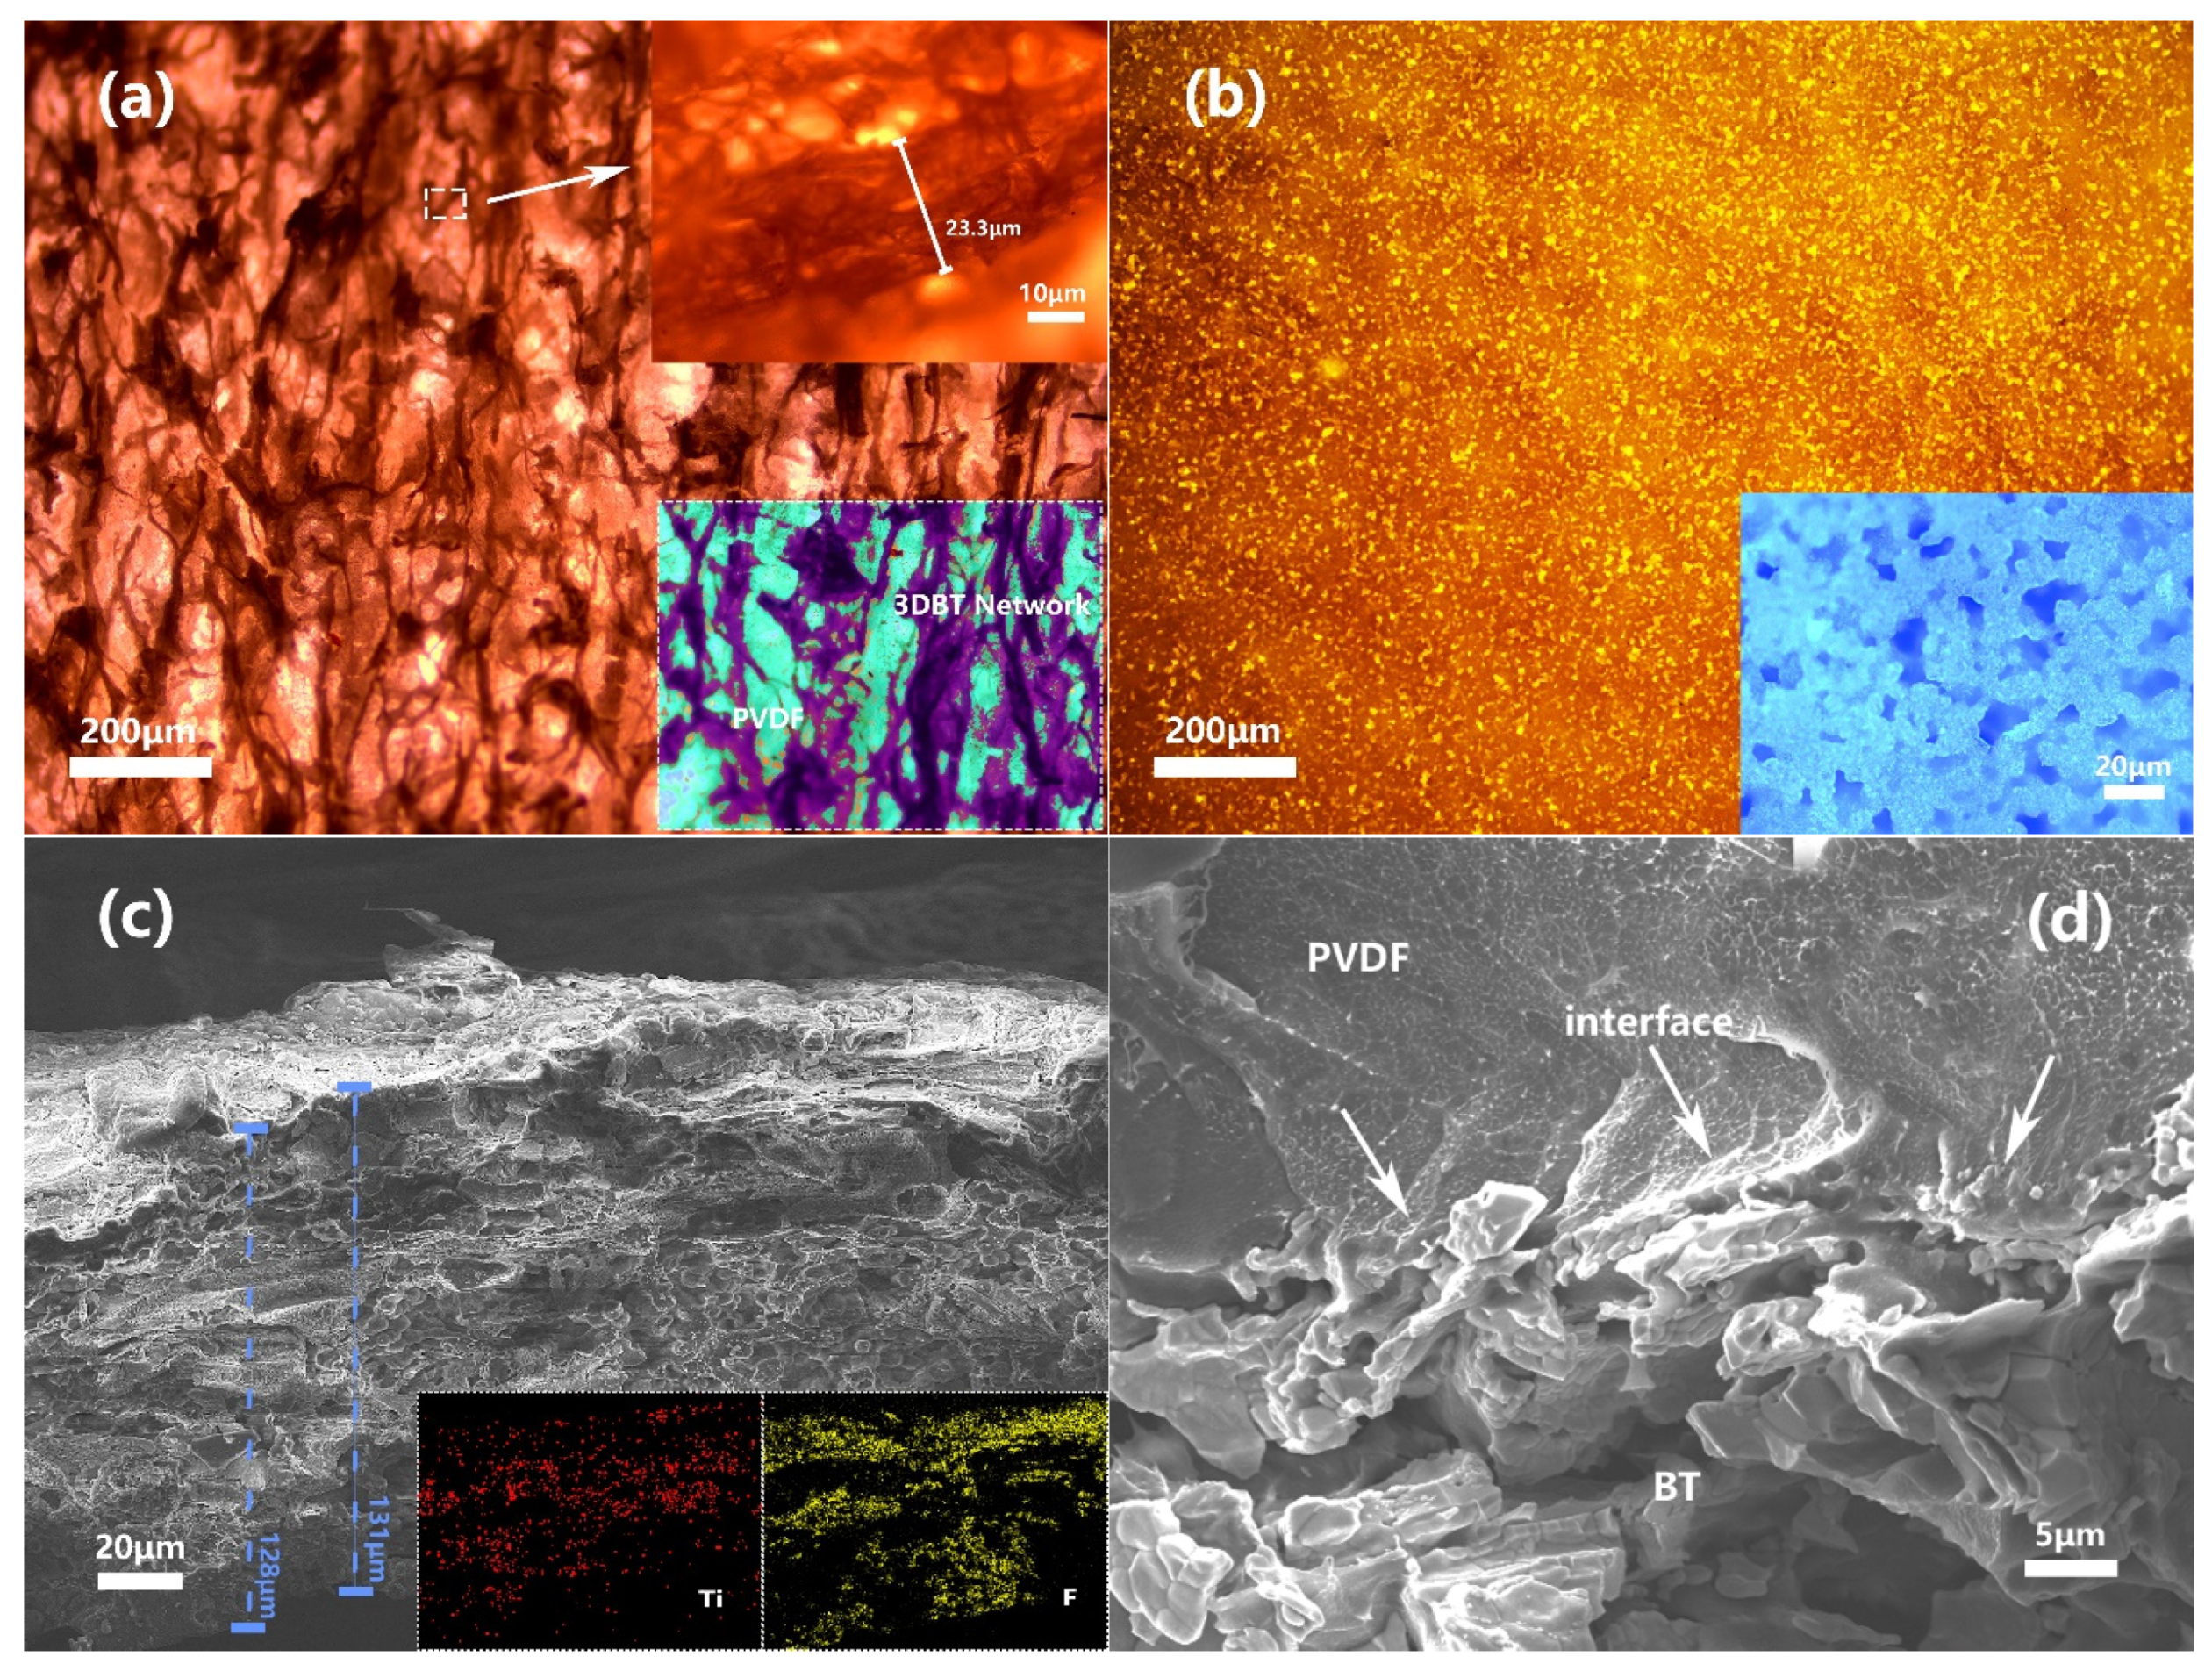
3.2. Structure and Morphology of 3D BT/PVDF Composites
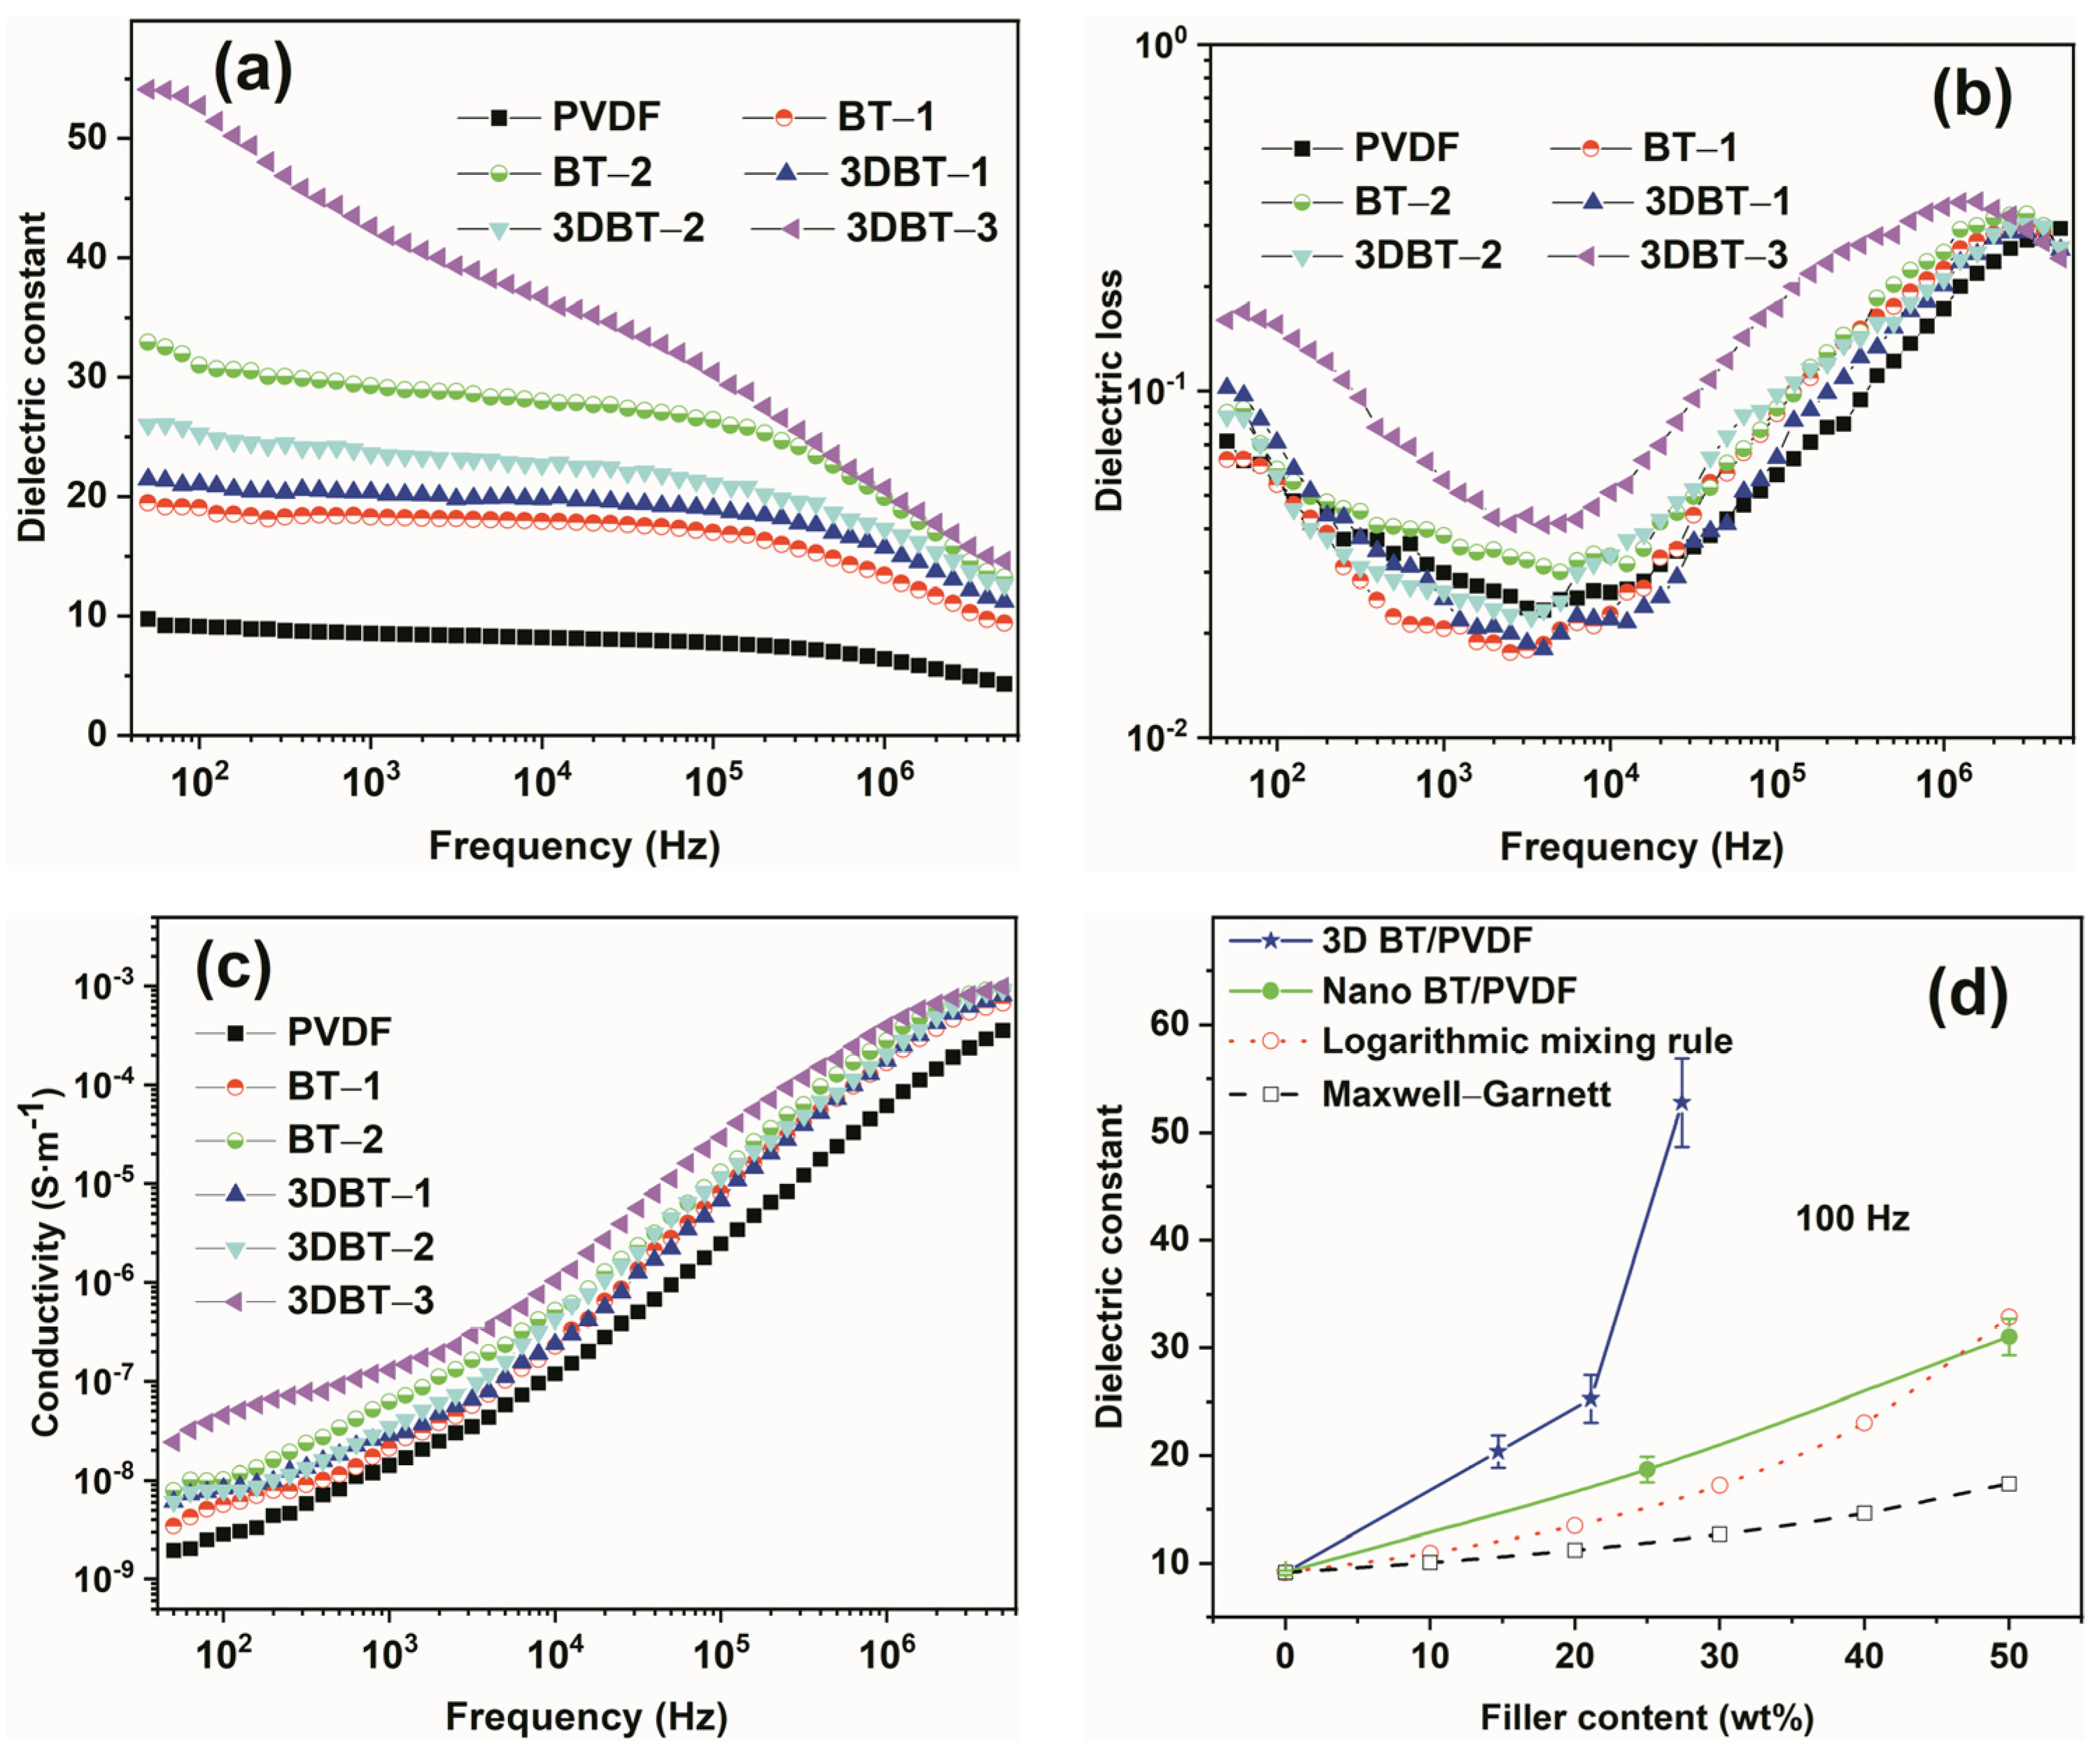
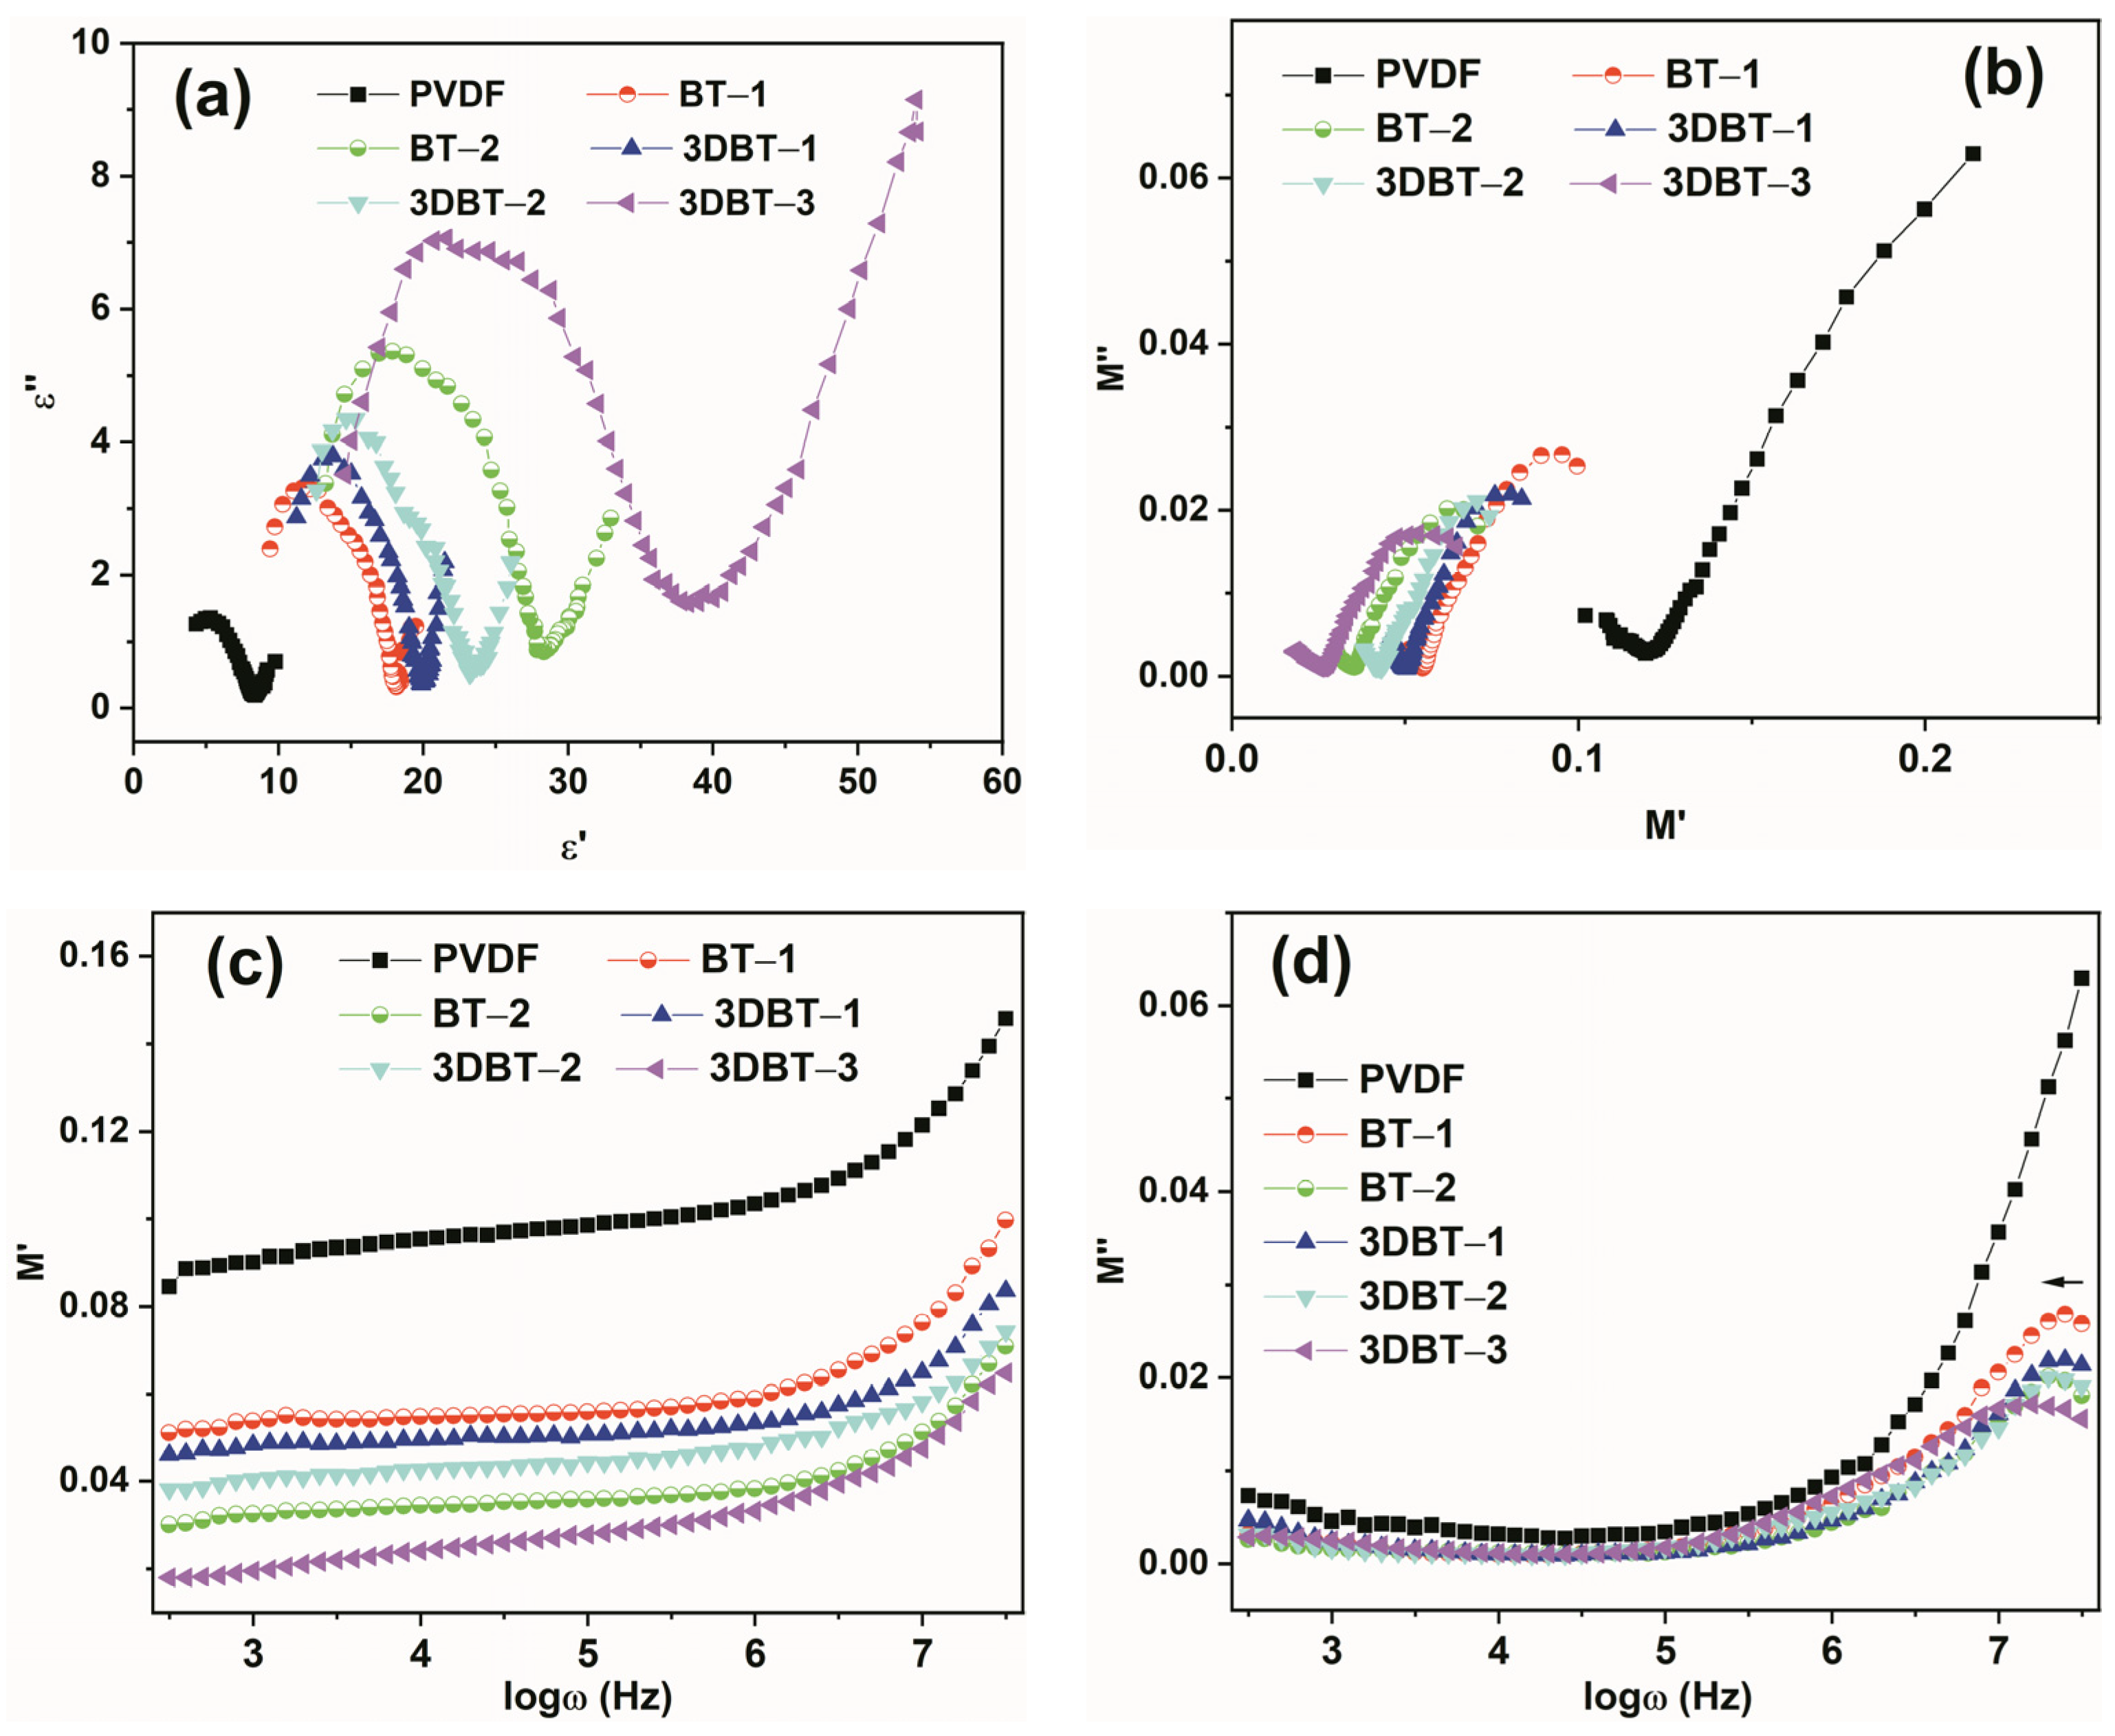
3.3. Electrical Properties
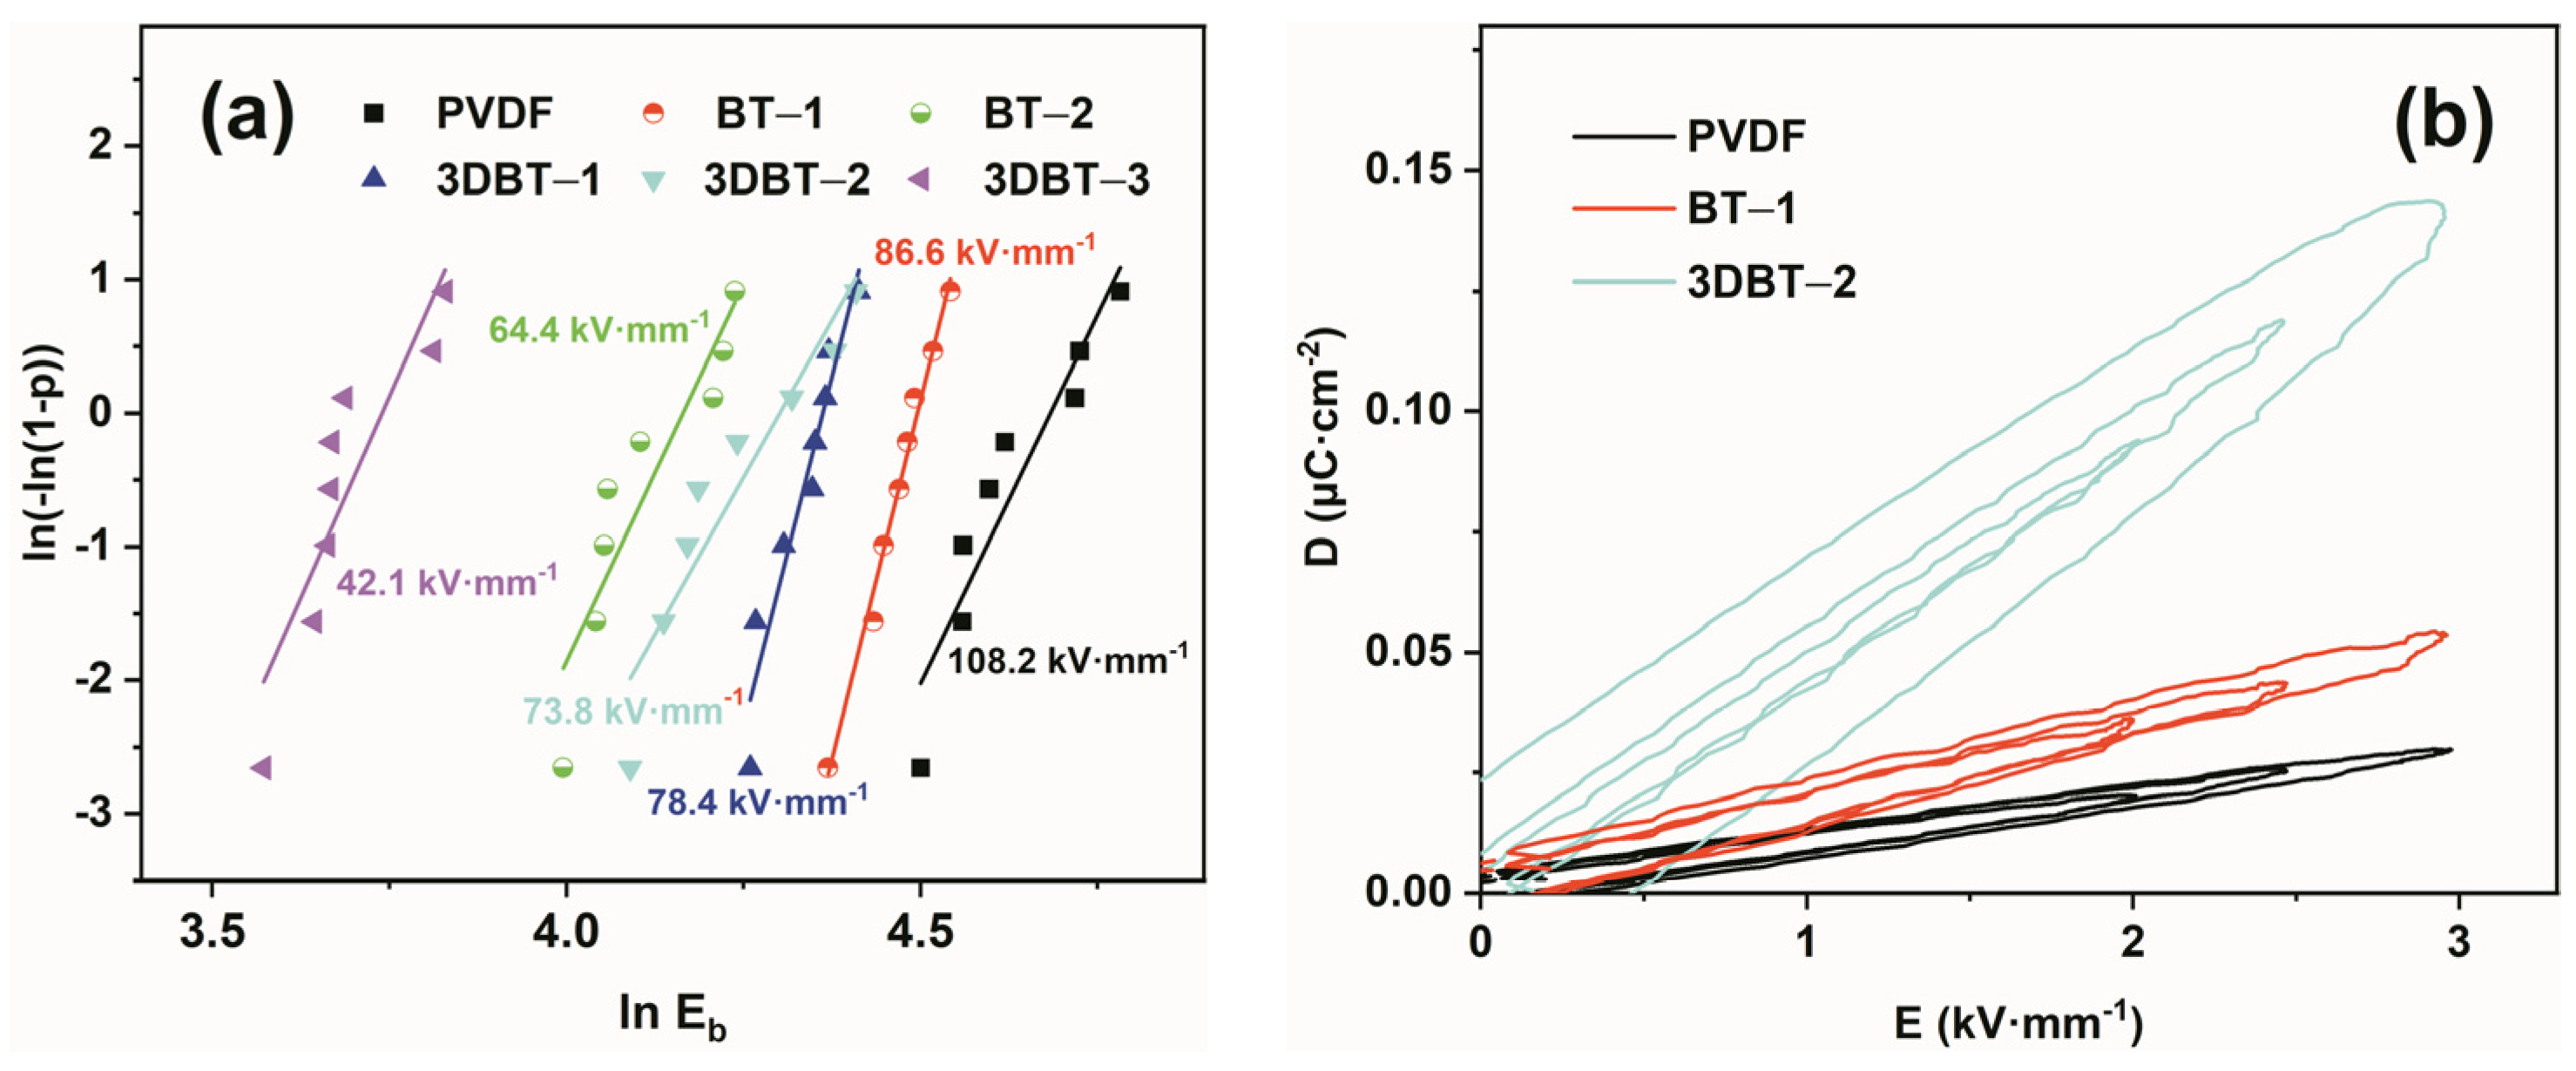
3.4. Breakdown Strength and Energy Storage
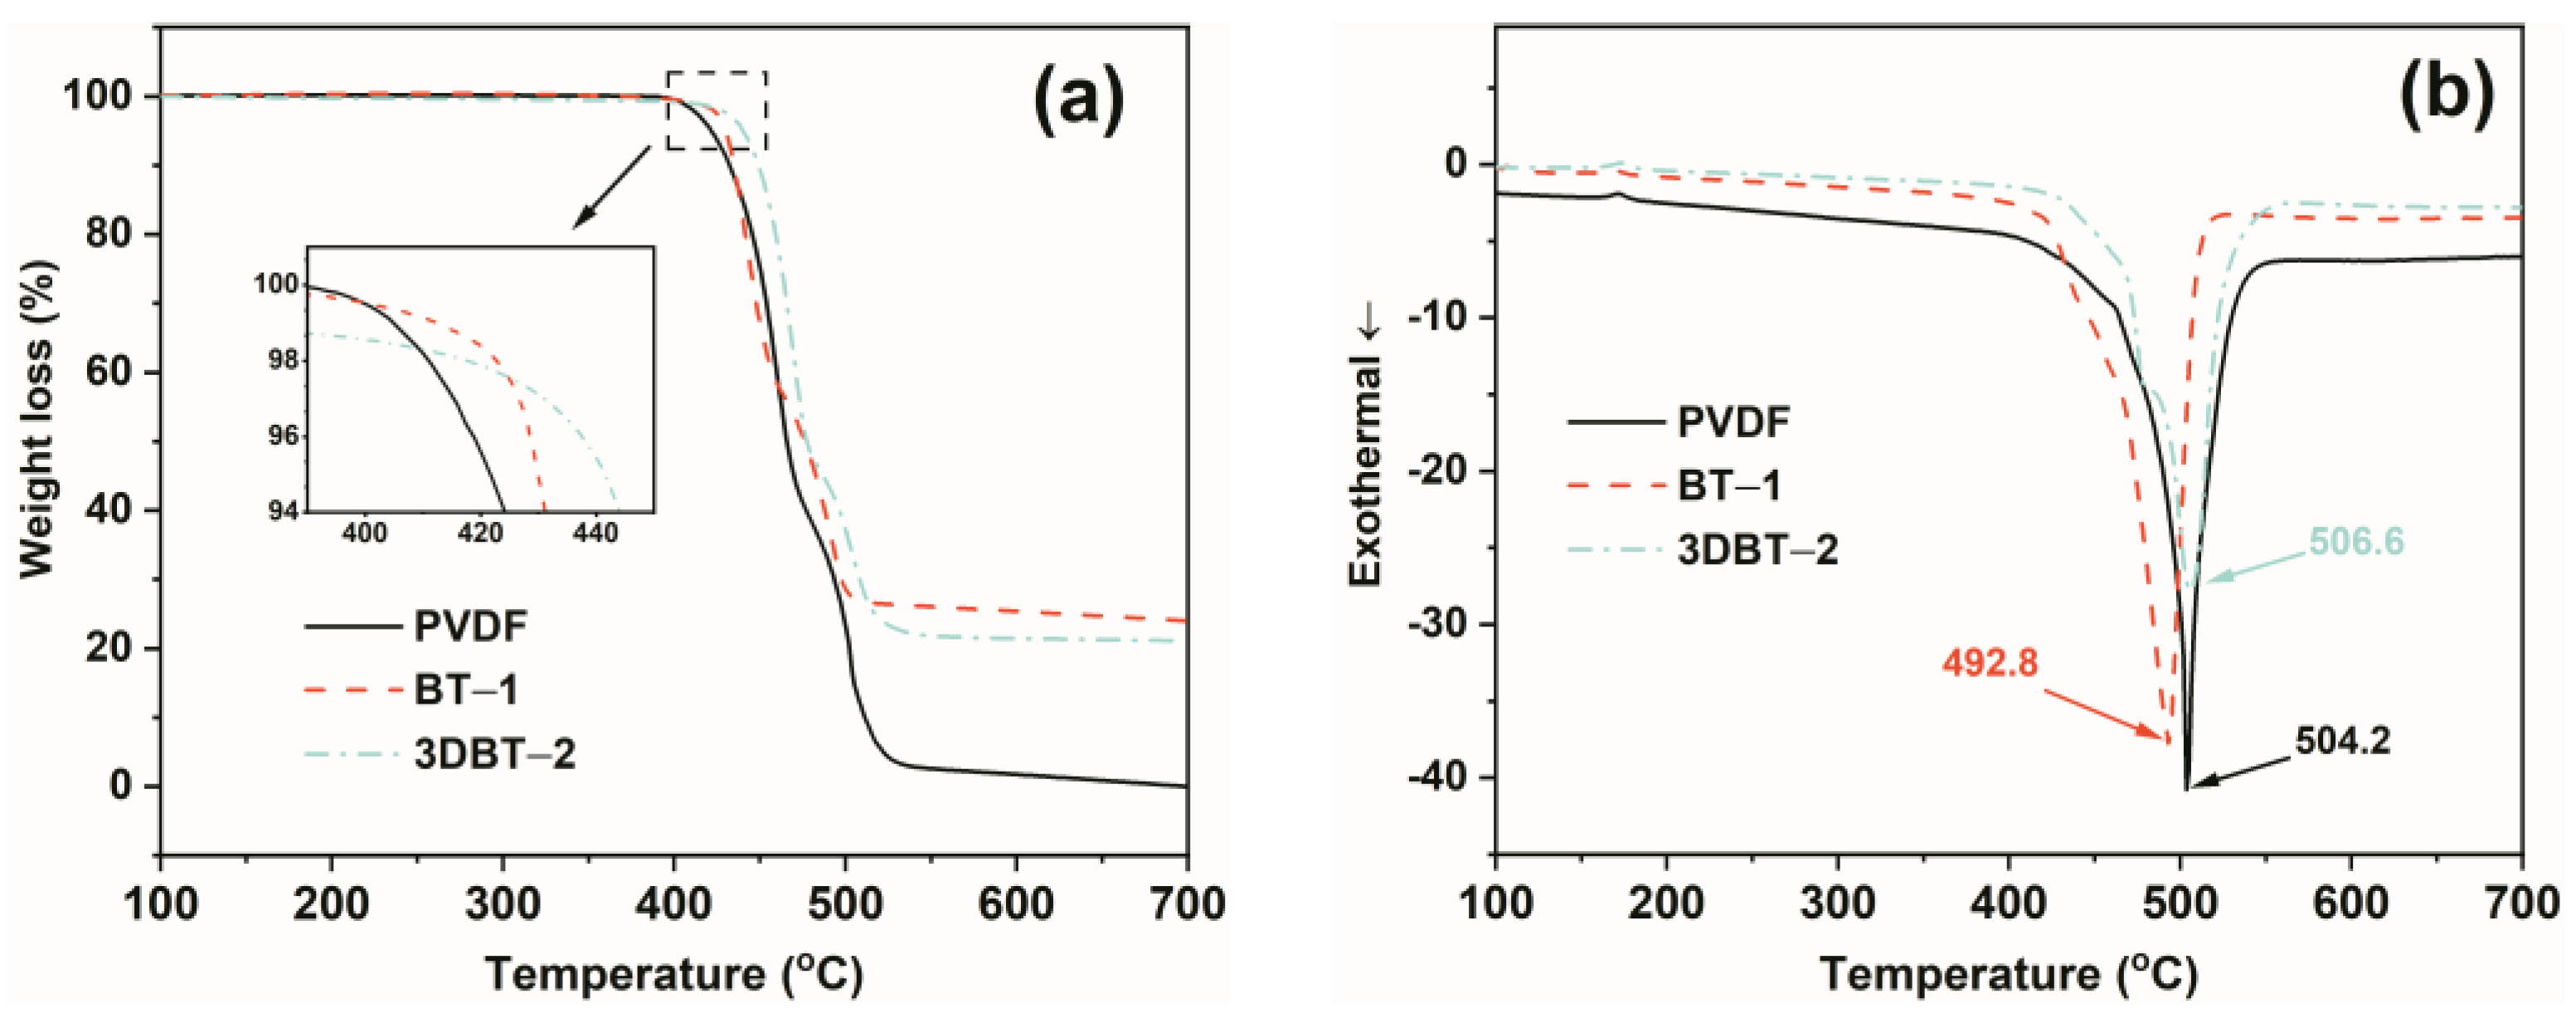
3.5. Thermal Stability
4. Conclusions
Supplementary Materials
Author Contributions
Funding
Institutional Review Board Statement
Informed Consent Statement
Data Availability Statement
Acknowledgments
Conflicts of Interest
References
- Kim, H.; Johnson, J.; Chavez, L.A.; Rosales, C.A.G.; Tseng, T.-L.B.; Lin, Y. Enhanced Dielectric Properties of Three Phase Dielectric MWCNTs/BaTiO3/PVDF Nanocomposites for Energy Storage Using Fused Deposition Modeling 3D Printing. Ceram. Int. 2018, 44, 9037–9044. [Google Scholar] [CrossRef]
- Dang, Z.-M.; Zheng, M.-S.; Zha, J.-W. 1D/2D Carbon Nanomaterial-Polymer Dielectric Composites With High Permittivity for Power Energy Storage Applications. Small 2016, 12, 1688–1701. [Google Scholar] [CrossRef] [PubMed]
- Bao, Z.; Hou, C.; Shen, Z.; Sun, H.; Zhang, G.; Luo, Z.; Dai, Z.; Wang, C.; Chen, X.; Li, L.; et al. Negatively Charged Nanosheets Significantly Enhance the Energy-Storage Capability of Polymer-Based Nanocomposites. Adv. Mater. 2020, 32, e1907227. [Google Scholar] [CrossRef]
- Zhu, L. Exploring Strategies for High Dielectric Constant and Low Loss Polymer Dielectrics. J. Phys. Chem. Lett. 2014, 5, 3677–3687. [Google Scholar] [CrossRef] [PubMed]
- Liab, Y.; Bia, X.; Wanga, S.; Zhana, Y.; Liub, H.-Y.; Maib, Y.-W.; Liaoc, C.; Luc, Z.; Liaod, Y. Core-Shell Structured Polyethylene Glycol Functionalized Graphene for Energy-Storage Polymer Dielectrics: Combined Mechanical and Dielectric Performances. Compos. Sci. Technol. 2020, 199, 108341. [Google Scholar] [CrossRef]
- Hu, G.; Gao, F.; Kong, J.; Yang, S.; Zhang, Q.; Liu, Z.; Zhang, Y.; Sun, H. Preparation and Dielectric Properties of poly(vinylidene fluoride)/Ba0.6Sr0.4TiO3 Composites. J. Alloys Compd. 2015, 619, 686–692. [Google Scholar] [CrossRef]
- Luo, S.; Yu, S.; Sun, R.; Wong, C.-P. Nano Ag-Deposited BaTiO3 Hybrid Particles as Fillers for Polymeric Dielectric Composites: Toward High Dielectric Constant and Suppressed Loss. ACS Appl. Mater. Interfaces 2014, 6, 176–182. [Google Scholar] [CrossRef]
- Xie, X.; Yang, C.; Qi, X.-D.; Yang, J.-H.; Zhou, Z.-W.; Wang, Y. Constructing Polymeric Interlayer With Dual Effects Toward High Dielectric Constant and Low Dielectric Loss. Chem. Eng. J. 2019, 366, 378–389. [Google Scholar] [CrossRef]
- Wang, Y.; Cui, J.; Wang, L.; Yuan, Q.; Niu, Y.; Chen, J.; Wang, Q.; Wang, H. Compositional Tailoring Effect on Electric Field Distribution for Significantly Enhanced Breakdown Strength and Restrained Conductive Loss in Sandwich-Structured ceramic/Polymer Nanocomposites. J. Mater. Chem. A 2017, 5, 4710–4718. [Google Scholar] [CrossRef]
- Luo, S.; Shen, Y.; Yu, S.; Wan, Y.; Liao, W.-H.; Sun, R.; Wong, C.-P. Construction of a 3D-BaTiO3 Network Leading to Significantly Enhanced Dielectric Permittivity and Energy Storage Density of Polymer Composites. Energy Environ. Sci. 2016, 10, 137–144. [Google Scholar] [CrossRef]
- Fu, X.; Li, Y.; Liao, C.; Gong, W.; Yang, M.; Li, R.K.Y.; Tjong, S.C.; Lu, Z. Enhanced Electrochemical Performance of Solid PEO/LiClO4 Electrolytes With a 3D Porous Li6.28La3Zr2Al0.24O12 Network. Compos. Sci. Technol. 2019, 184, 107863. [Google Scholar] [CrossRef]
- Li, Y.; Tjong, S.C. Structure and Electrical Characteristics of poly(vinylidene Fluoride) Filled With Beta Silicon Carbide Nanoparticles. J. Nanosci. Nanotechnol. 2011, 11, 5148–5153. [Google Scholar] [CrossRef]
- Mallick, S.; Ahmad, Z.; Qadir, K.; Rehman, A.; Shakoor, R.; Touati, F.; Al-Muhtaseb, S. Effect of BaTiO3 on the Sensing Properties of PVDF Composite-Based Capacitive Humidity Sensors. Ceram. Int. 2020, 46, 2949–2953. [Google Scholar] [CrossRef]
- Chen, C.; Hao, H.; Wang, T.; Cheng, J.; Luo, Z.; Zhang, L.; Cao, M.; Yao, Z.; Liu, H. Nano-BaTiO3 Phase Transition Behavior in Coated BaTiO3-Based Dielectric Ceramics. Ceram. Int. 2019, 45, 7166–7172. [Google Scholar] [CrossRef]
- Qiu, K.; Yan, H.; Zhang, D.; Lu, Y.; Cheng, J.; Lu, M.; Wang, C.; Zhang, Y.; Liu, X.; Luo, Y. Hierarchical 3D Co3O4@MnO2 core/Shell Nanoconch Arrays on Ni Foam for Enhanced Electrochemical Performance. J. Solid State Electrochem. 2014, 19, 391–401. [Google Scholar] [CrossRef]
- Tang, H.; Zhou, Z.; Sodano, H.A. Relationship Between BaTiO3 Nanowire Aspect Ratio and the Dielectric Permittivity of Nanocomposites. ACS Appl. Mater. Interfaces 2014, 6, 5450–5455. [Google Scholar] [CrossRef] [PubMed]
- Raghuram, N.; Rao, T.S.; Naidu, K.C.B. Electrical and Impedance Spectroscopy Properties of Hydrothermally Synthesized Ba0.2Sr0.8-yLayFe12O19 (y = 0.2–0.8) Nanorods. Ceram. Int. 2020, 46, 5894–5906. [Google Scholar] [CrossRef]
- Chaves, A.; Azadani, J.G.; Alsalman, H.; Da Costa, D.R.; Frisenda, R.; Chaves, A.J.; Song, S.H.; Kim, Y.D.; He, D.; Zhou, J.; et al. Bandgap engineering of two-dimensional semiconductor materials. npj 2D Mater. Appl. 2020, 4, 29. [Google Scholar] [CrossRef]
- Panomsuwan, G.; Manuspiya, H. Dielectric Properties and Discharge Energy Density of Epoxy Composites With 3D BaTiO3 Network Structure. Mater. Lett. 2020, 270, 127695. [Google Scholar] [CrossRef]
- Hayashida, K. Highly Improved Dielectric Properties of polymer/α-Fe2O3composites at Elevated Temperatures. RSC Adv. 2016, 6, 64871–64878. [Google Scholar] [CrossRef] [Green Version]
- Das, A.; Hatada, R.; Ensinger, W.; Flege, S.; Baba, K.; Meikap, A. Dielectric Constant, AC Conductivity and Impedance Spectroscopy of Zinc-Containing Diamond-Like Carbon Film UV Photodetector. J. Alloys Compd. 2018, 758, 194–205. [Google Scholar] [CrossRef]
- Tong, H.; Liu, X.-J.; Zheng, M.-S.; Dang, Z.-M.; Zha, J.-W. Dual Functionalized Janus Structural PVDF Nanocomposite with Surface-Modified Dielectric and Magnetic Nanoparticles. Appl. Phys. Lett. 2020, 117, 112903. [Google Scholar] [CrossRef]
- Tantis, I.; Psarras, G.C.; Tasis, D. Functionalized Graphene—Poly(vinyl Alcohol) Nanocomposites: Physical and Dielectric Properties. Express Polym. Lett. 2012, 6, 283–292. [Google Scholar] [CrossRef]
- Yang, K.; Huang, X.; He, J.; Jiang, P. Strawberry-like Core-Shell Ag@Polydopamine@BaTiO3Hybrid Nanoparticles for High-kPolymer Nanocomposites with High Energy Density and Low Dielectric Loss. Adv. Mater. Interfaces 2015, 2, 150036-1–150036-10. [Google Scholar] [CrossRef]
- Zhao, M.; Fu, Q.; Hou, Y.; Luo, L.; Li, W. BaTiO3/MWNTs/Polyvinylidene Fluoride Ternary Dielectric Composites with Excellent Dielectric Property, High Breakdown Strength, and High-Energy Storage Density. ACS Omega 2019, 4, 1000–1006. [Google Scholar] [CrossRef] [PubMed] [Green Version]


| Composites | Designation | Content |
|---|---|---|
| 3D BT/PVDF (2 mL) | 3DBT–1 | 14.7 wt% (5.0 vol%) 3D BT |
| 3D BT/PVDF (1.5 mL) | 3DBT–2 | 21.1 wt% (7.5 vol%) 3D BT |
| 3D BT/PVDF (1 mL) | 3DBT–3 | 27.4 wt% (10.3 vol%) 3D BT |
| nano–BT (0.94g)/PVDF (30 mL) | BT–1 | 25 wt% (9.2 vol%) nano–BT |
| nano–BT (2.81g)/PVDF (30 mL) | BT–2 | 50 wt% (23.3 vol%) nano–BT |
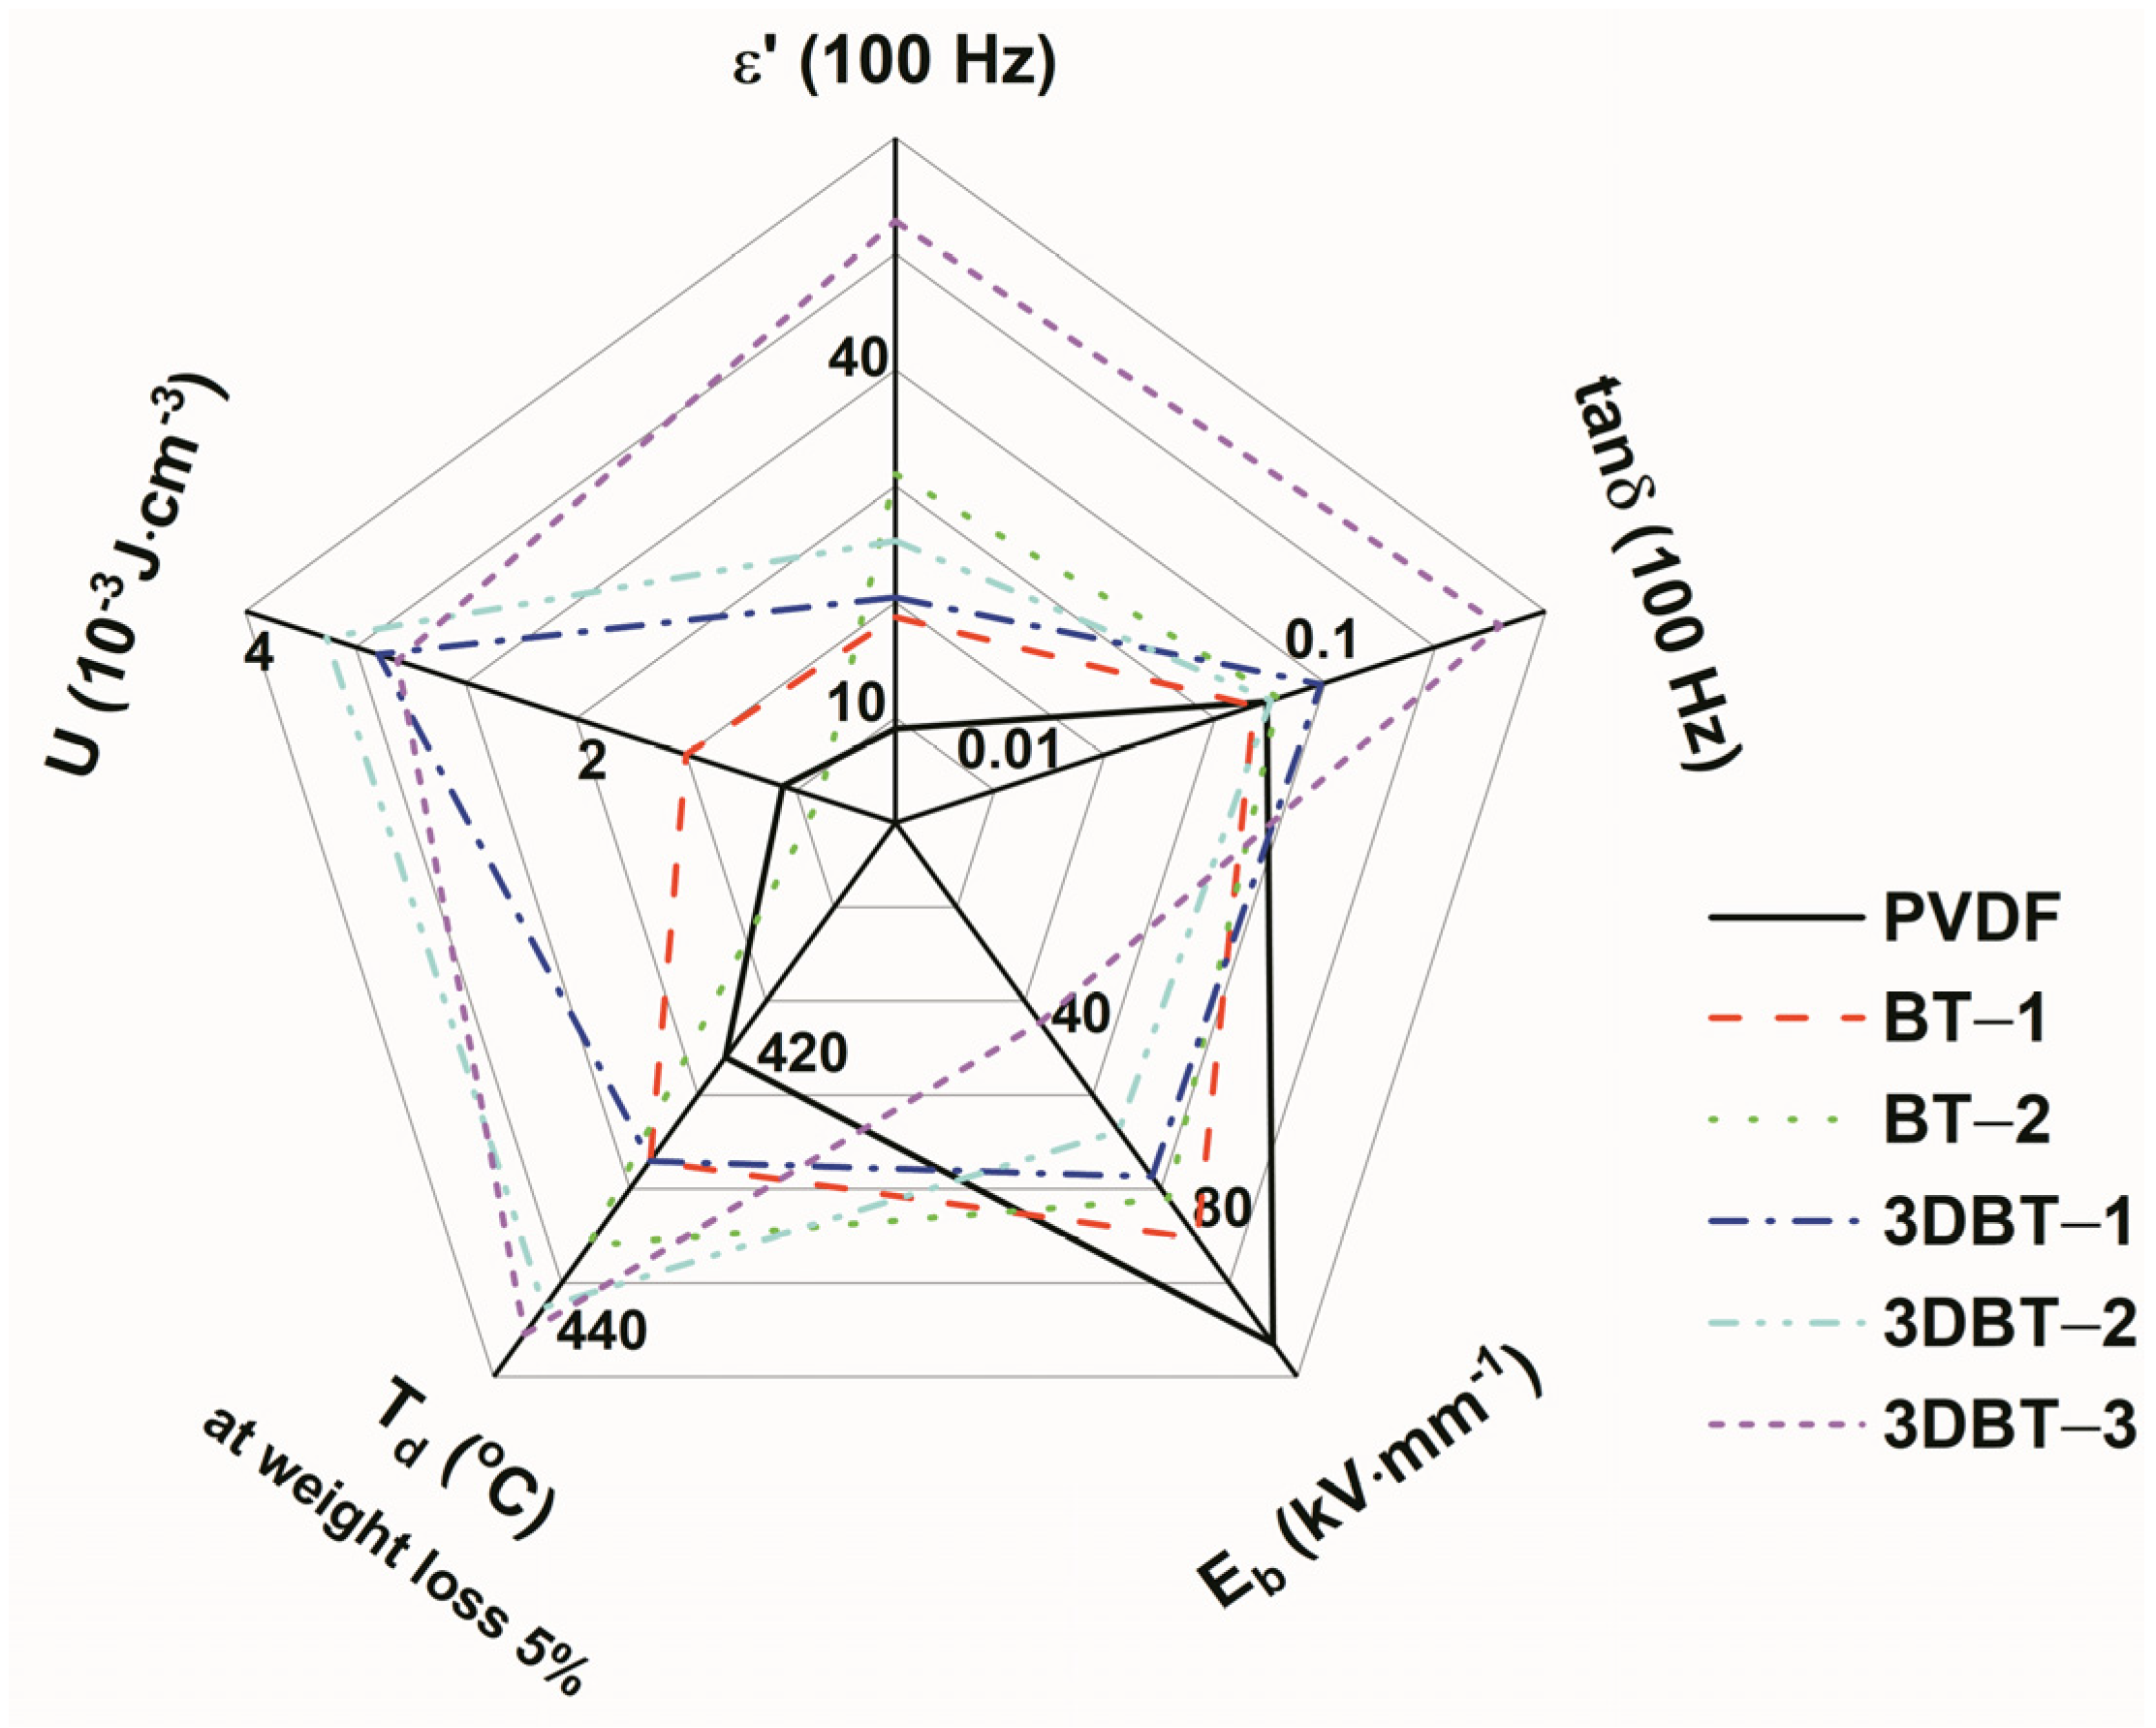
| Sample | ε’ (100 Hz) | tanδ (100 Hz) | Eb (kV·mm−1) | U (10−3 J·cm−3) at 3 kV·mm−1 | Td (5 % Weight Loss) |
|---|---|---|---|---|---|
| PVDF | 9.1 ± 0.2 | 0.056 ± 0.02 | 108.2 | 0.359 ± 0.02 | 421.9 |
| BT–1 | 18.7 ± 1.2 | 0.053 ± 0.003 | 86.6 | 0.676 ± 0.03 | 429.4 |
| BT–2 | 31 ± 1.7 | 0.059 ± 0.003 | 64.4 | 0.272 ± 0.02 | 435.5 |
| 3DBT–1 | 20.4 ± 1.5 | 0.071 ± 0.007 | 78.4 | 1.566 ± 0.08 | 429.4 |
| 3DBT–2 | 25.3 ± 2.2 | 0.057 ± 0.006 | 73.8 | 1.604 ± 0.03 | 440.0 |
| 3DBT–3 | 52.8 ± 4.7 | 0.156 ± 0.006 | 42.1 | 1.469 ± 0.04 | 442.0 |
Publisher’s Note: MDPI stays neutral with regard to jurisdictional claims in published maps and institutional affiliations. |
© 2021 by the authors. Licensee MDPI, Basel, Switzerland. This article is an open access article distributed under the terms and conditions of the Creative Commons Attribution (CC BY) license (https://creativecommons.org/licenses/by/4.0/).
Share and Cite
Bi, X.; Yang, L.; Wang, Z.; Zhan, Y.; Wang, S.; Zhang, C.; Li, Y.; Miao, Y.; Zha, J. Construction of a Three-Dimensional BaTiO3 Network for Enhanced Permittivity and Energy Storage of PVDF Composites. Materials 2021, 14, 3585. https://doi.org/10.3390/ma14133585
Bi X, Yang L, Wang Z, Zhan Y, Wang S, Zhang C, Li Y, Miao Y, Zha J. Construction of a Three-Dimensional BaTiO3 Network for Enhanced Permittivity and Energy Storage of PVDF Composites. Materials. 2021; 14(13):3585. https://doi.org/10.3390/ma14133585
Chicago/Turabian StyleBi, Xueqing, Lujia Yang, Zhen Wang, Yanhu Zhan, Shuangshuang Wang, Chunmei Zhang, Yuchao Li, Yinggang Miao, and Junwei Zha. 2021. "Construction of a Three-Dimensional BaTiO3 Network for Enhanced Permittivity and Energy Storage of PVDF Composites" Materials 14, no. 13: 3585. https://doi.org/10.3390/ma14133585