Article

Analysis of Flexural Vibrations of a Piezoelectric Semiconductor Nanoplate Driven by a Time-Harmonic Force

1
School of Mechanics and Safety Engineering, Zhengzhou University, Zhengzhou 450001, China
2
Henan Key Engineering Laboratory for Anti-Fatigue Manufacturing Technology, Zhengzhou University, Zhengzhou 450001, China
3
School of Mechanical and Power Engineering, Zhengzhou University, Zhengzhou 450001, China
*
Author to whom correspondence should be addressed.
Materials 2021, 14(14), 3926; https://doi.org/10.3390/ma14143926
Submission received: 26 April 2021 / Revised: 20 June 2021 / Accepted: 5 July 2021 / Published: 14 July 2021

Abstract

:
The performance of devices fabricated from piezoelectric semiconductors, such as sensors and actuators in microelectromechanical systems, is superior; furthermore, plate structures are the core components of these smart devices. It is thus important to analyze the electromechanical coupling properties of piezoelectric semiconductor nanoplates. We established a nanoplate model for the piezoelectric semiconductor plate structure by extending the first-order shear deformation theory. The flexural vibrations of nanoplates subjected to a transversely time-harmonic force were investigated. The vibrational modes and natural frequencies were obtained by using the matrix eigenvalue solver in COMSOL Multiphysics 5.3a, and the convergence analysis was carried out to guarantee accurate results. In numerical cases, the tuning effect of the initial electron concentration on mechanics and electric properties is deeply discussed. The numerical results show that the initial electron concentration greatly affects the natural frequency and electromechanical fields of piezoelectric semiconductors, and a high initial electron concentration can reduce the electromechanical fields and the stiffness of piezoelectric semiconductors due to the electron screening effect. We analyzed the flexural vibration of typical piezoelectric semiconductor plate structures, which provide theoretical guidance for the development of new piezotronic devices.

1. Introduction

In 1960, Hutson discovered the piezoelectric effect in ZnO and CdS semiconductors [1]. However, owing to the weak piezoelectricity of piezoelectric semiconductors (PSCs), researchers early on usually treated them as normal semiconductor materials. With the development of micro and nanoscale fabrication technologies, PSC structures with larger piezoelectric effects were fabricated, such as ZnO fibers, films, bands, belts, spirals, and tubes [2,3,4]. Multifunctional devices now include sensing, driving, carrier transport, and photoelectron excitation in single PSC structures. Hence, PSCs enable considerable potential in new intelligent and multifunctional electronic devices [5,6,7,8]. However, basic problems in PSCs were found, such as electromechanical fields in fibers [9,10], near-field cracks [11,12], I–V characteristics of positive-negative carrier junctions [13,14], flexural and vibration of beams [15], thermal effects [16,17], and waves propagations [18,19].
In microelectromechanical systems, such as semiconductor devices, plate structures are the important core components. The theory studies on PSC plates also attracted much attention. For example, Yang and Zhou [20] derived two-dimensional (2D) equations coupled extensional, flexural, and thickness-shear motions of PSC thin plates from the three-dimensional equations by power series expansions in the plate thickness coordinate. They also analyzed the propagation of thickness-shear waves and the amplification effect of an electric field on thickness-shear waves. Similarly, Yang et al. [21] derived 2D equations coupled extensional, flexural, and thickness-shear motions of PSC laminated plates, and the amplification effect of an electric field on thickness-shear waves was analyzed. Li et al. [22] studied the thickness-extensional vibration of a piezoelectric semiconductor plate, the effect of semiconduction on mechanical-to-electrical energy conversion was investigated. Tian et al. [23] analyzed the characteristics of elastic waves in a PSC plate structure with Stroh theory, effects of the initial carrier density, plate thickness, and biasing electric field on the wave speed and attenuation were deeply discussed. Tian et al. [24] obtained analytical solutions of SH waves in transversely isotropic multilayered PSC plates and discussed the effect of the mechanical imperfect interface on the dispersion behavior of SH waves. Luo et al. [25] obtained the analytical solutions of electromechanical fields for an elastic and PSC laminated thin film with a pair of infinite opposite sides under a static flexural load and numerically investigated tuning effects of the initial electron concentration. Luo et al. [26] then studied the same PSC plate model as reference [25] under periodic loads and derived the first three-order natural frequencies. Zhao et al. [27] analyzed a thermal piezoelectric semiconductor plate with a shooting method and obtained the numerical solutions of the electromechanical field and temperature along a thickness-extensional direction.
During the service process, PSC devices are usually subjected to periodic loads. However, in current researches on PSC plates under periodic loads, PSC plates are restrictedly regarded as infinite plates. These steady vibration problems are then simplified as the one-dimensional (1D) extensional or flexural problems. Motivated by this, we derived the 2D equations of the finite PSC plate with coupled flexural and thickness-shear motions and investigated its flexural vibrations driven by a time-harmonic force. The modal analysis of the PSC plate was performed via COMSOL Multiphysics 5.3a. Natural frequencies and vibration modes of the electromechanical fields of the PSC plate were obtained, and the effect of the initial electron concentration on the vibrational properties was discussed. Basic equations for the PSCs plate are given in Section 2, and the forced vibration analysis is introduced in Section 3. The convergence analysis and numerical results are discussed in Section 4 and summarized in Section 5.

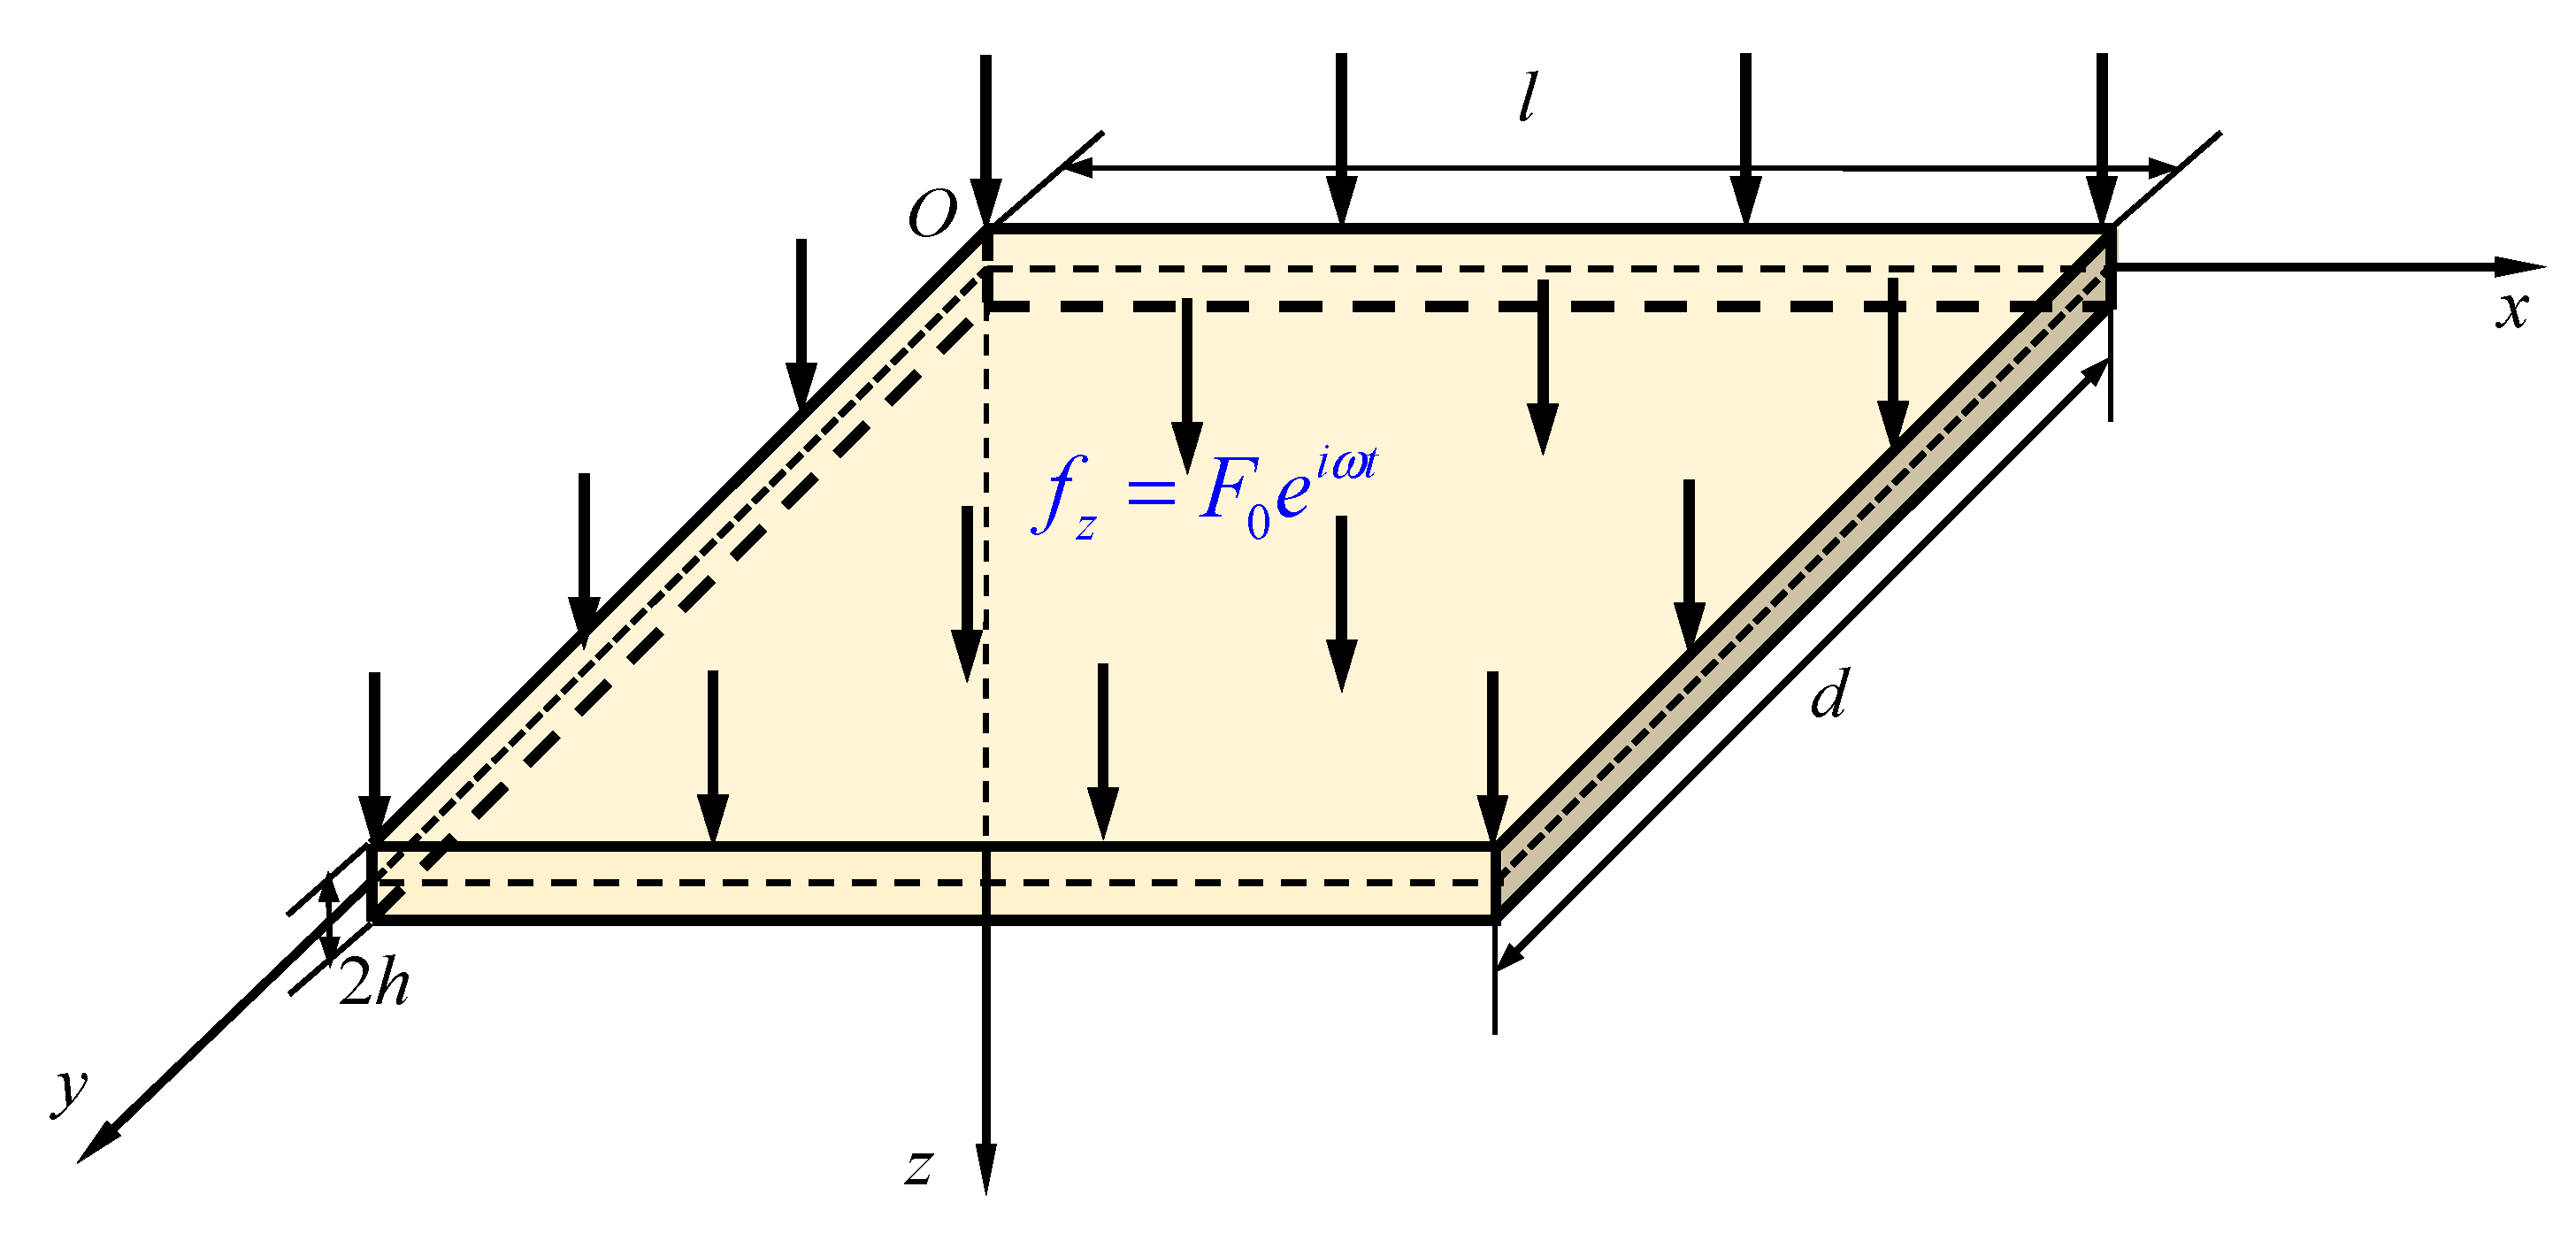
2. Piezoelectric Semiconductor Plate Model

For an n-type PSC without body force and free of electric charge, the three-dimensional (3D) basic theory can be described with Cartesian tensor notation. The equations of motion, Gauss’s law of electrostatics, and the equation of charge conservation can be written as [20]
σ j i , j = ρ u ¨ i , D i , i = q ( N D + n ) ,     ( i , j = 1 , 2 , 3   or   x , y , z ) , J i , i = q n ˙ ,
where σji, Di, and Ji are the stress tensor, electric displacement component, and electric current density component, respectively; ρ and ui denote the mass density and displacement components, respectively; q, N D + , and n denote the unit electric charge (1.602 × 10⁻¹⁹ C), donor impurity and electron concentrations, respectively. Moreover, the comma in the subscript indicates the partial differentiation, u ¨ i and n ˙ respectively denote the 2-order and 1-order partial differentiation with respect to the time independent t.
The constitutive relations for 3D PSCs are given by:
σ i j = c i j k l ε k l e k i j E k , D i = e i k l ε k l + κ i k E k , J i = q n μ i j E j + q D i j n , j ,
where εkl and Ek are the strain tensor and electric field components, respectively, cijkl, ekij, and κik are the elastic, piezoelectric, and dielectric constants, respectively, and μij and Dij are the electron mobility and diffusion coefficients, respectively. The strains εij and electric fields Ei are related to the displacement ui and the electric potential Φi through
ε i j = ( u i . j + u j , i ) / 2 , E i = ϕ , i .
The electron concentration n can be written as n = n0 + Δn, where Δn is the electron concentration perturbation, n0 is the initial electron concentration. For a small electron concentration perturbation, the constitutive relations in Equation (2) can be linearized as
σ i j = c i j k l ε k l e k i j E k , D i = e i k l ε k l + κ i k E k , J i = q n 0 μ i j E j + q D i j ( Δ n ) , j ,
In a natural state, n 0 = N D + , thus, Equation (1) becomes
σ j i , j = ρ u ¨ i , D i , i = q Δ n , J i , i = q Δ n ˙ .
We now consider a transversely isotropic PSC plate with thickness 2 h, length l, and width d (2 h < < l, d) under a transversely time-harmonic force fz, the reference coordinate plane o-xy is in the geometric middle plane of the plate, as depicted in Figure 1.
To overcome the complexity of a 3D PSC plate and describe the transient behaviors correctly, we simplify it to a 2D PSC plate model by extending the first-order shear deformation theory, in which shear and flexural motions in the plate thickness direction are considered. The mechanical displacements, electric potential, and electron concentration perturbation are approximated by [20]
u x z ψ x ( x , y , t ) ,   u y z ψ y ( x , y , t ) , u z w ( x , y , t ) , ϕ ϕ ( x , y , t ) , Δ n Δ n ( x , y , t ) ,
where ux, uy, and uz are the mechanical displacements, Ψx and Ψy are the plate-thickness shear displacements, and w is the deflection. Substitution of Equation (6) into Equation (3), the relevant strains can be expressed as
ε x = u x x z ψ x x ,   ε y = u y y z ψ y y ,   γ x y = u x y + u y x z ( ψ x y + ψ y x ) , γ z x = u x z + u z x ψ x + w x , γ z y = u y z + u z y ψ y + w y .
By introducing the stress relaxation approximation of σz = 0 into Equation (2), we have the following expression
ε z = ( c 33 k l ε k l c 3333 ε 33 e k 33 E k ) / c 3333
By substituting Equations (7) and (8) into Equation (4), the constitutive equations can be rewritten as
σ x = z ( c ¯ 11 ψ x x + c ¯ 12 ψ y y ) , σ y = z ( c ¯ 12 ψ x x + c ¯ 11 ψ y y ) , τ x y = c 66 z ( ψ x y + ψ y x ) , τ z x = c 44 ( ψ x + w x ) + e 15 ϕ x , τ z y = c 44 ( ψ y + w y ) + e 15 ϕ y , D x = e 15 ( ψ x + w x ) κ 11 ϕ x , D y = e 15 ( ψ y + w y ) κ 11 ϕ y , J x = q n 0 μ 11 ϕ x + q D 11 Δ n x , J y = q n 0 μ 11 ϕ y + q D 11 Δ n y ,
where the effective material constants are defined by
c ¯ 11 = c 11 c 13 2 c 33 ,   c ¯ 12 = c 12 c 13 2 c 33 .
To make the 2D plate model yield the same natural frequencies as the 3D PSC structure, two shear correction factors k1 and k2 must be introduced to moderate the excessive transverse shear strain energy. The replaced strains γxz and γzy are written as [20]
γ z x k 1 γ z x ,   γ z y k 2 γ z y .
Integrating Equation (9) through the thickness, the extended inner forces of the PSC plate are defined by
M x = h h z σ x d z ,       M y = h h z σ y d z   ,       M x y = h h z τ x y d z ,     Q z x = h h τ z x d z ,       Q z y = h h τ z y d z , d x = h h D x d z ,       d y = h h D y d z ,         j x = h h J x d z ,         j y = h h J y d z ,      
where Mx, My, and Mxy are the bending moments and torque, Qzx and Qzy are shear stresses, dx and dy are surface electric charges, and jx and jy are surface electric current densities. Then, we have
M x = 2 3 h 3 ( c ¯ 11 ψ x x + c ¯ 12 ψ y y ) , M y = 2 3 h 3 ( c ¯ 12 ψ x x + c ¯ 11 ψ y y ) , M x y = 2 3 h 3 c 66 ( ψ x y + ψ y x ) , Q z x = 2 h   [ k 1 2 c 44 ( ψ x + w x ) + k 1 e 15 ϕ x ] , Q z y = 2 h   [ k 2 2 c 44 ( ψ y + w y ) + k 2 e 15 ϕ y ] , d x = 2 h   [ k 1 e 15 ( ψ x + w x ) κ 11 ϕ x ] , d y = 2 h   [ k 2 e 15 ( ψ y + w y ) κ 11 ϕ y ] , j x = 2 h q ( n 0 μ 11 ϕ x + D 11 Δ n x ) , j y = 2 h q ( n 0 μ 11 ϕ y + D 11 Δ n y ) .
By integrating Equation (5) with z through the plate thickness, the equations of shear and flexural motions, Gauss’s law, and charge conservation for the 2D plate model are given by
M x x + M x y y Q z x + f x = 2 ρ h 3 3 2 ψ x t 2 , M x y x + M y y Q z y + f y = 2 ρ h 3 3 2 ψ y t 2 , Q z x x + Q z y y + f z = 2 h ρ 2 w t 2 , d x x + d y y + ϖ = 2 h q Δ n , j x x + j y y + ϑ = 2 h q Δ n t ,
where fx, fy, fz, ϖ, and ϑ are the equivalent surface loads, surface electric charge, and surface electric current density, respectively. They are defined by
f x = [ z τ z x ] h h ,   f y = [ z τ z y ] h h ,   f z = [ σ z ] h h ,     ϖ = [ D z ] h h ,   ϑ = [ J z ] h h .        
When the plate is subjected to a transverse time-harmonic force fz, then fx = fy = 0, ϖ = 0, and ϑ = 0. The substitution of Equation (13) into Equation (14) yields the governing equations for the PSC plate
c ¯ 11 2 ψ x x 2 + c 66 2 ψ x y 2 + ( c ¯ 12 + c 66 ) 2 ψ y x y 3 h 2 k 2 c 44 ( ψ x + w x ) 3 h 2 k e 15 ϕ x = ρ 2 ψ x t 2 , c 66 2 ψ y x 2 + c ¯ 11 2 ψ y y 2 + ( c ¯ 12 + c 66 ) 2 ψ x x y 3 h 2 k 2 c 44 ( ψ y + w y ) 3 h 2 k e 15 ϕ y = ρ 2 ψ y t 2 , k 2 c 44 ( ψ x x + 2 w x 2 ) + k e 15 2 ϕ x 2 + k 2 c 44 ( ψ y y + 2 w y 2 ) + k e 15 2 ϕ y 2 + f z = ρ 2 w t 2 , κ 11 2 ϕ x 2 + k e 15 ( ψ x x + 2 w x 2 ) κ 11 2 ϕ y 2 + k e 15 ( ψ y y + 2 w y 2 ) = q Δ n , n 0 μ 11 2 ϕ x 2 + D 11 2 Δ n x 2 n 0 μ 11 2 ϕ y 2 + D 11 2 Δ n y 2 = Δ n t .
It is assumed that the four plate edges are fixed, and that contact between metals and the PSC plate is ohmic. Then, the boundary conditions for the PSC plate are given by
ψ x = 0 ,   ψ y = 0 ,   w = 0 ,   ϕ = 0 ,   Δ n = 0 ,     x = 0     and     l , ψ x = 0 ,   ψ y = 0 ,   w = 0 ,   ϕ = 0 ,   Δ n = 0 ,     y = 0     and     d .
In addition, the initial state of the PSC plate is considered static, that is
ψ x = 0 ,   ψ y = 0   w = 0 ,   Δ n = 0 ,                                                                                                                 t = 0 ψ x t = 0 ,     ψ y t = 0 ,       w t = 0 ,

3. Modal Analysis

As shown in Figure 1, the upper surface of the PSC plate is under a transverse time-harmonic force fz = F0 eiωt, where ω is the excitation frequency. For harmonic motion, the solutions of the governing equations are
{ ψ x ψ y w ϕ Δ n } = { Ψ x Ψ y W Φ Δ N } e i ω t ,
where Ψx, Ψy, W, Φ, and ΔN are extended mode shapes. By substitution of Equation (19) into Equation (16), the common factor of eiωt can be canceled from the differential equations Equation (16), then governing equations for Ψx, Ψy, W, Φ, and ΔN can be rewritten as
ρ ω 2 Ψ x + c ¯ 11 2 Ψ x x 2 + c 66 2 Ψ x y 2 + ( c ¯ 12 + c 66 ) 2 Ψ y x y 3 h 2 k 2 c 44 ( Ψ x + W x ) 3 h 2 k e 15 Φ x = 0 , ρ ω 2 Ψ y + c 66 2 Ψ y x 2 + c ¯ 11 2 Ψ y y 2 + ( c ¯ 12 + c 66 ) 2 Ψ x x y 3 h 2 k 2 c 44 ( Ψ y + W y ) 3 h 2 k e 15 Φ y = 0 , ρ ω 2 W + k 2 c 44 ( Ψ x x + 2 W x 2 ) + k e 15 2 Φ x 2 + k 2 c 44 ( Ψ y y + 2 W y 2 ) + k e 15 2 Φ y 2 + F 0 = 0 , κ 11 2 Φ x 2 + k e 15 ( Ψ x x + 2 W x 2 ) κ 11 2 Φ y 2 + k e 15 ( Ψ y y + 2 W y 2 ) = q Δ N , i ω Δ N n 0 μ 11 2 Φ x 2 + D 11 2 Δ N x 2 n 0 μ 11 2 Φ y 2 + D 11 2 Δ N y 2 = 0 .
The Formula (20) is a partial differential equation set that is hard to solve analytically with boundary conditions in Formula (17); therefore, the advanced numerical simulation software COMSOL Multiphysics (version 5.3a) is chosen to solve this steady vibration problem in PSC plate. With the use of the eigenvalue solver, vibration modals including nature frequencies ω and extended vibration modes (Ψx, Ψy, W, Φ, and ΔN) can be derived, and the extended internal forces (Mx, My, Mxy, Qzx, Qzy, dx, dy, jx, and jy) can also be derived.

4. Numerical Examples

As one kind of third-generation semiconductor material, gallium nitride (GaN) is widely used in new types of intelligent and multifunctional electronic devices due to its wide bandgap, high piezoelectric, and other excellent functional properties. Therefore, in the following numerical cases, a GaN plate with a thickness of 2 h = 1 μm, length of l = 10 μm, and width of d = 10 μm is examined. The material constants of the GaN plate are listed in Table 1 [28], and the shear correction factors k1 and k2 are set as k1= k2 = 0.9069 [20]. We assume that the applied time-harmonic force fz is a sine wave, and its amplitude is a constant as F0 = 103 N/m2.

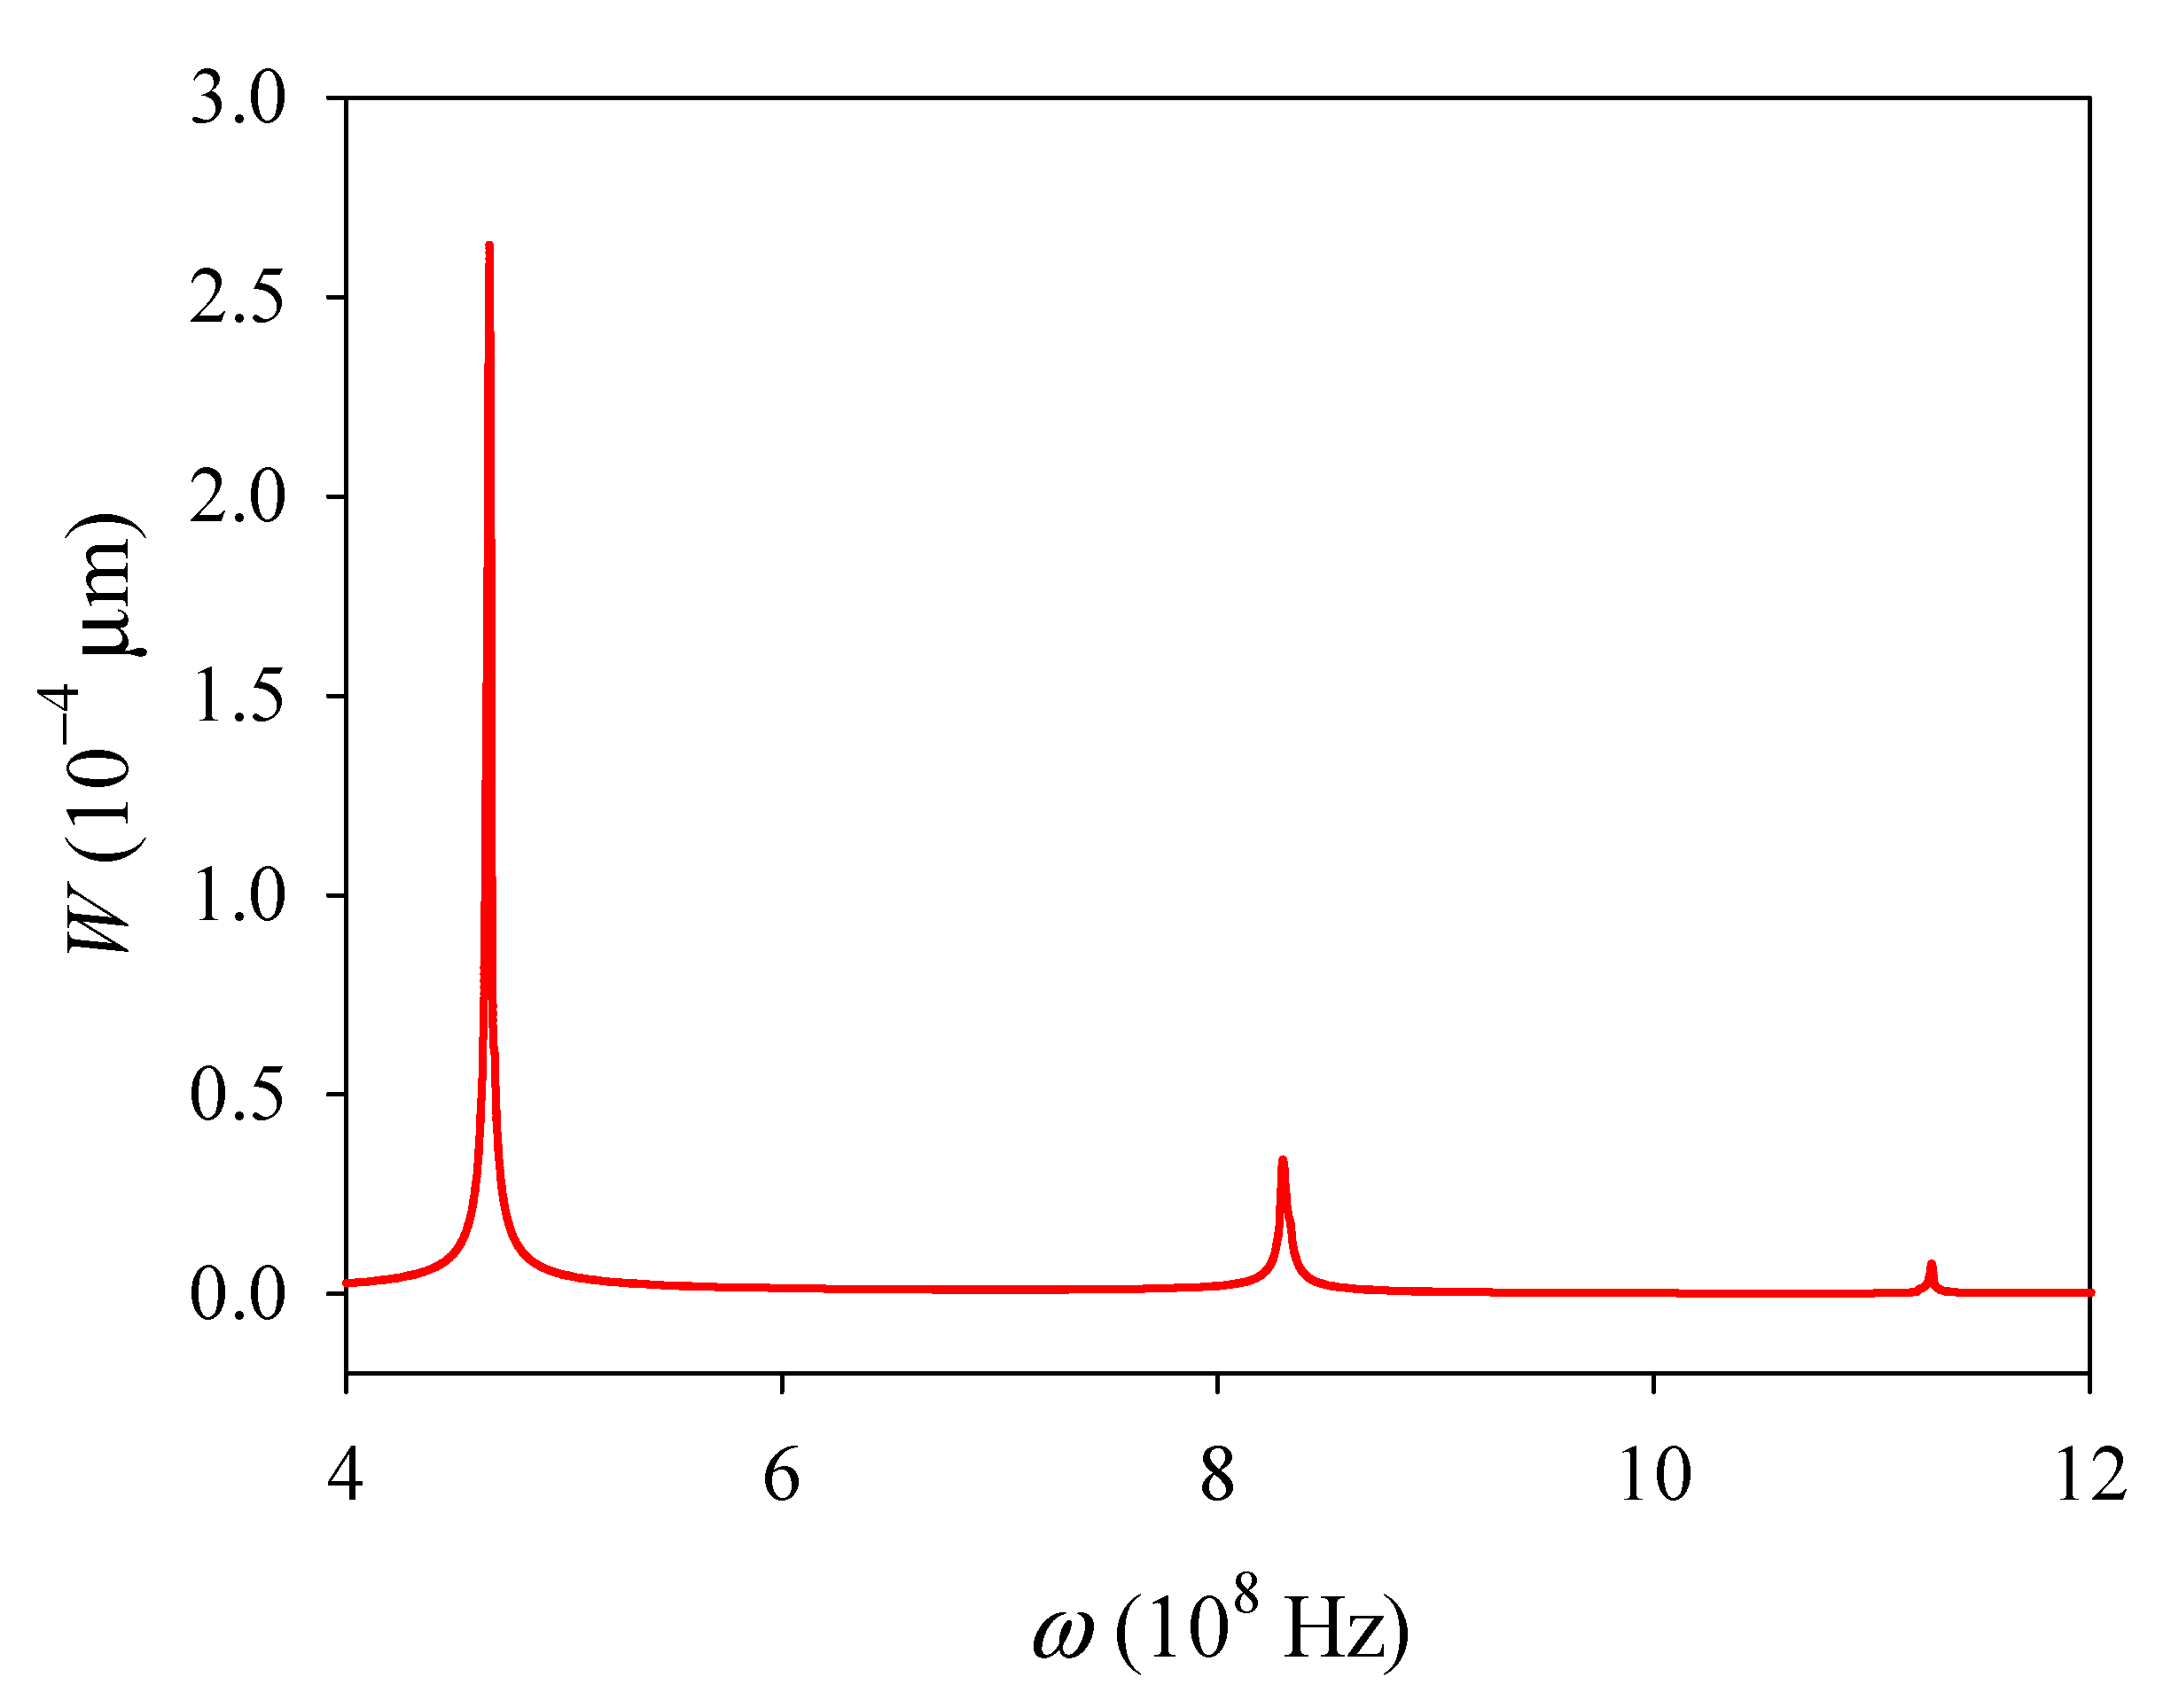
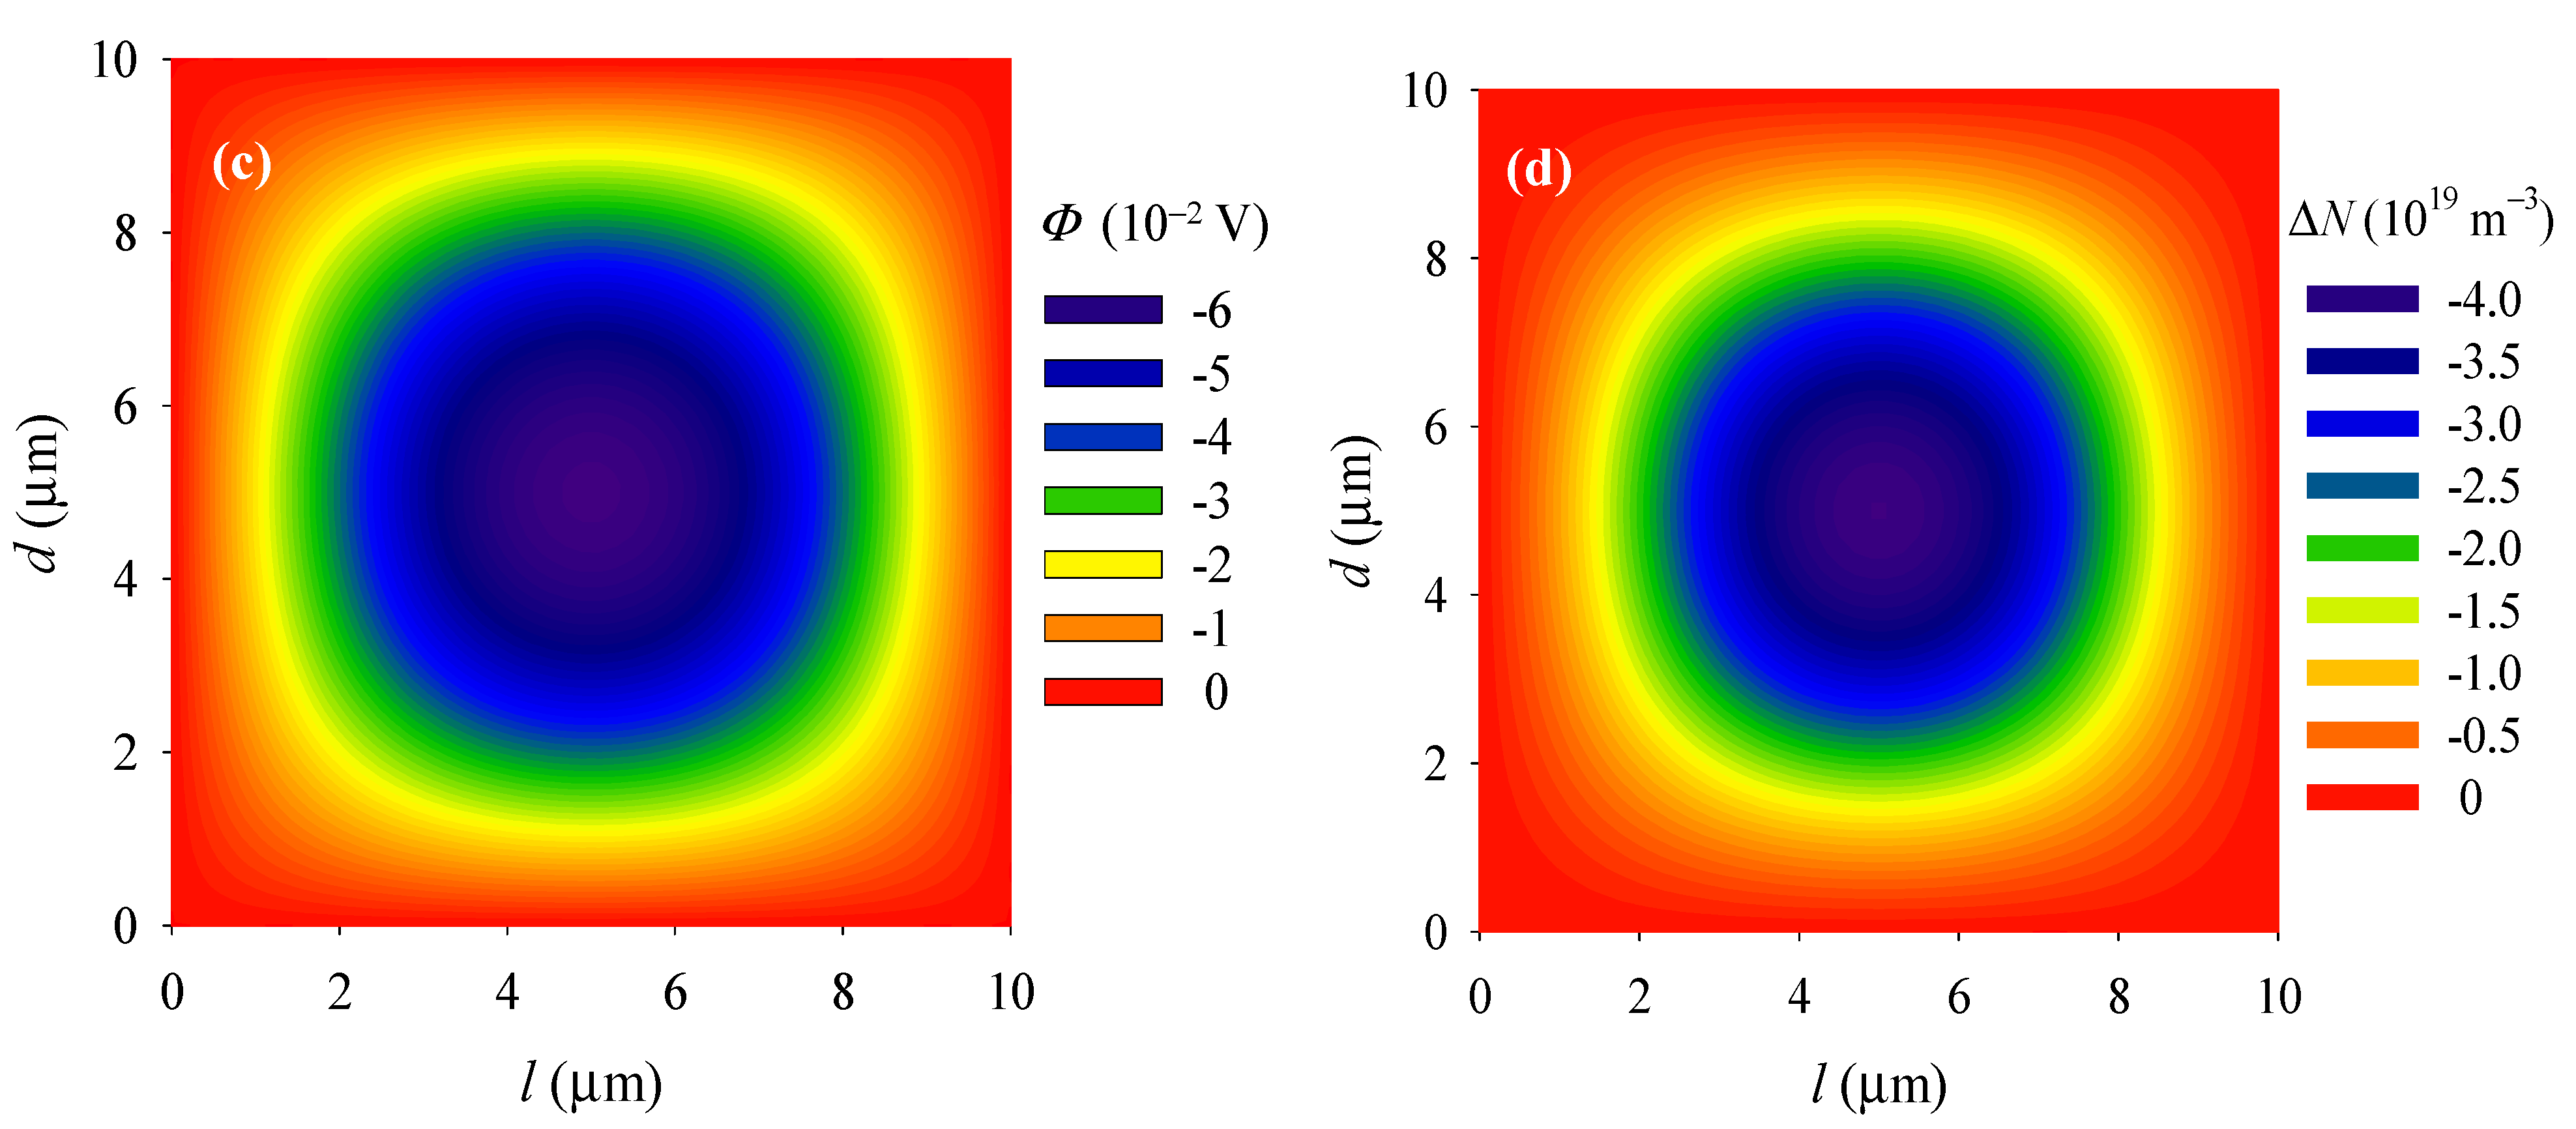
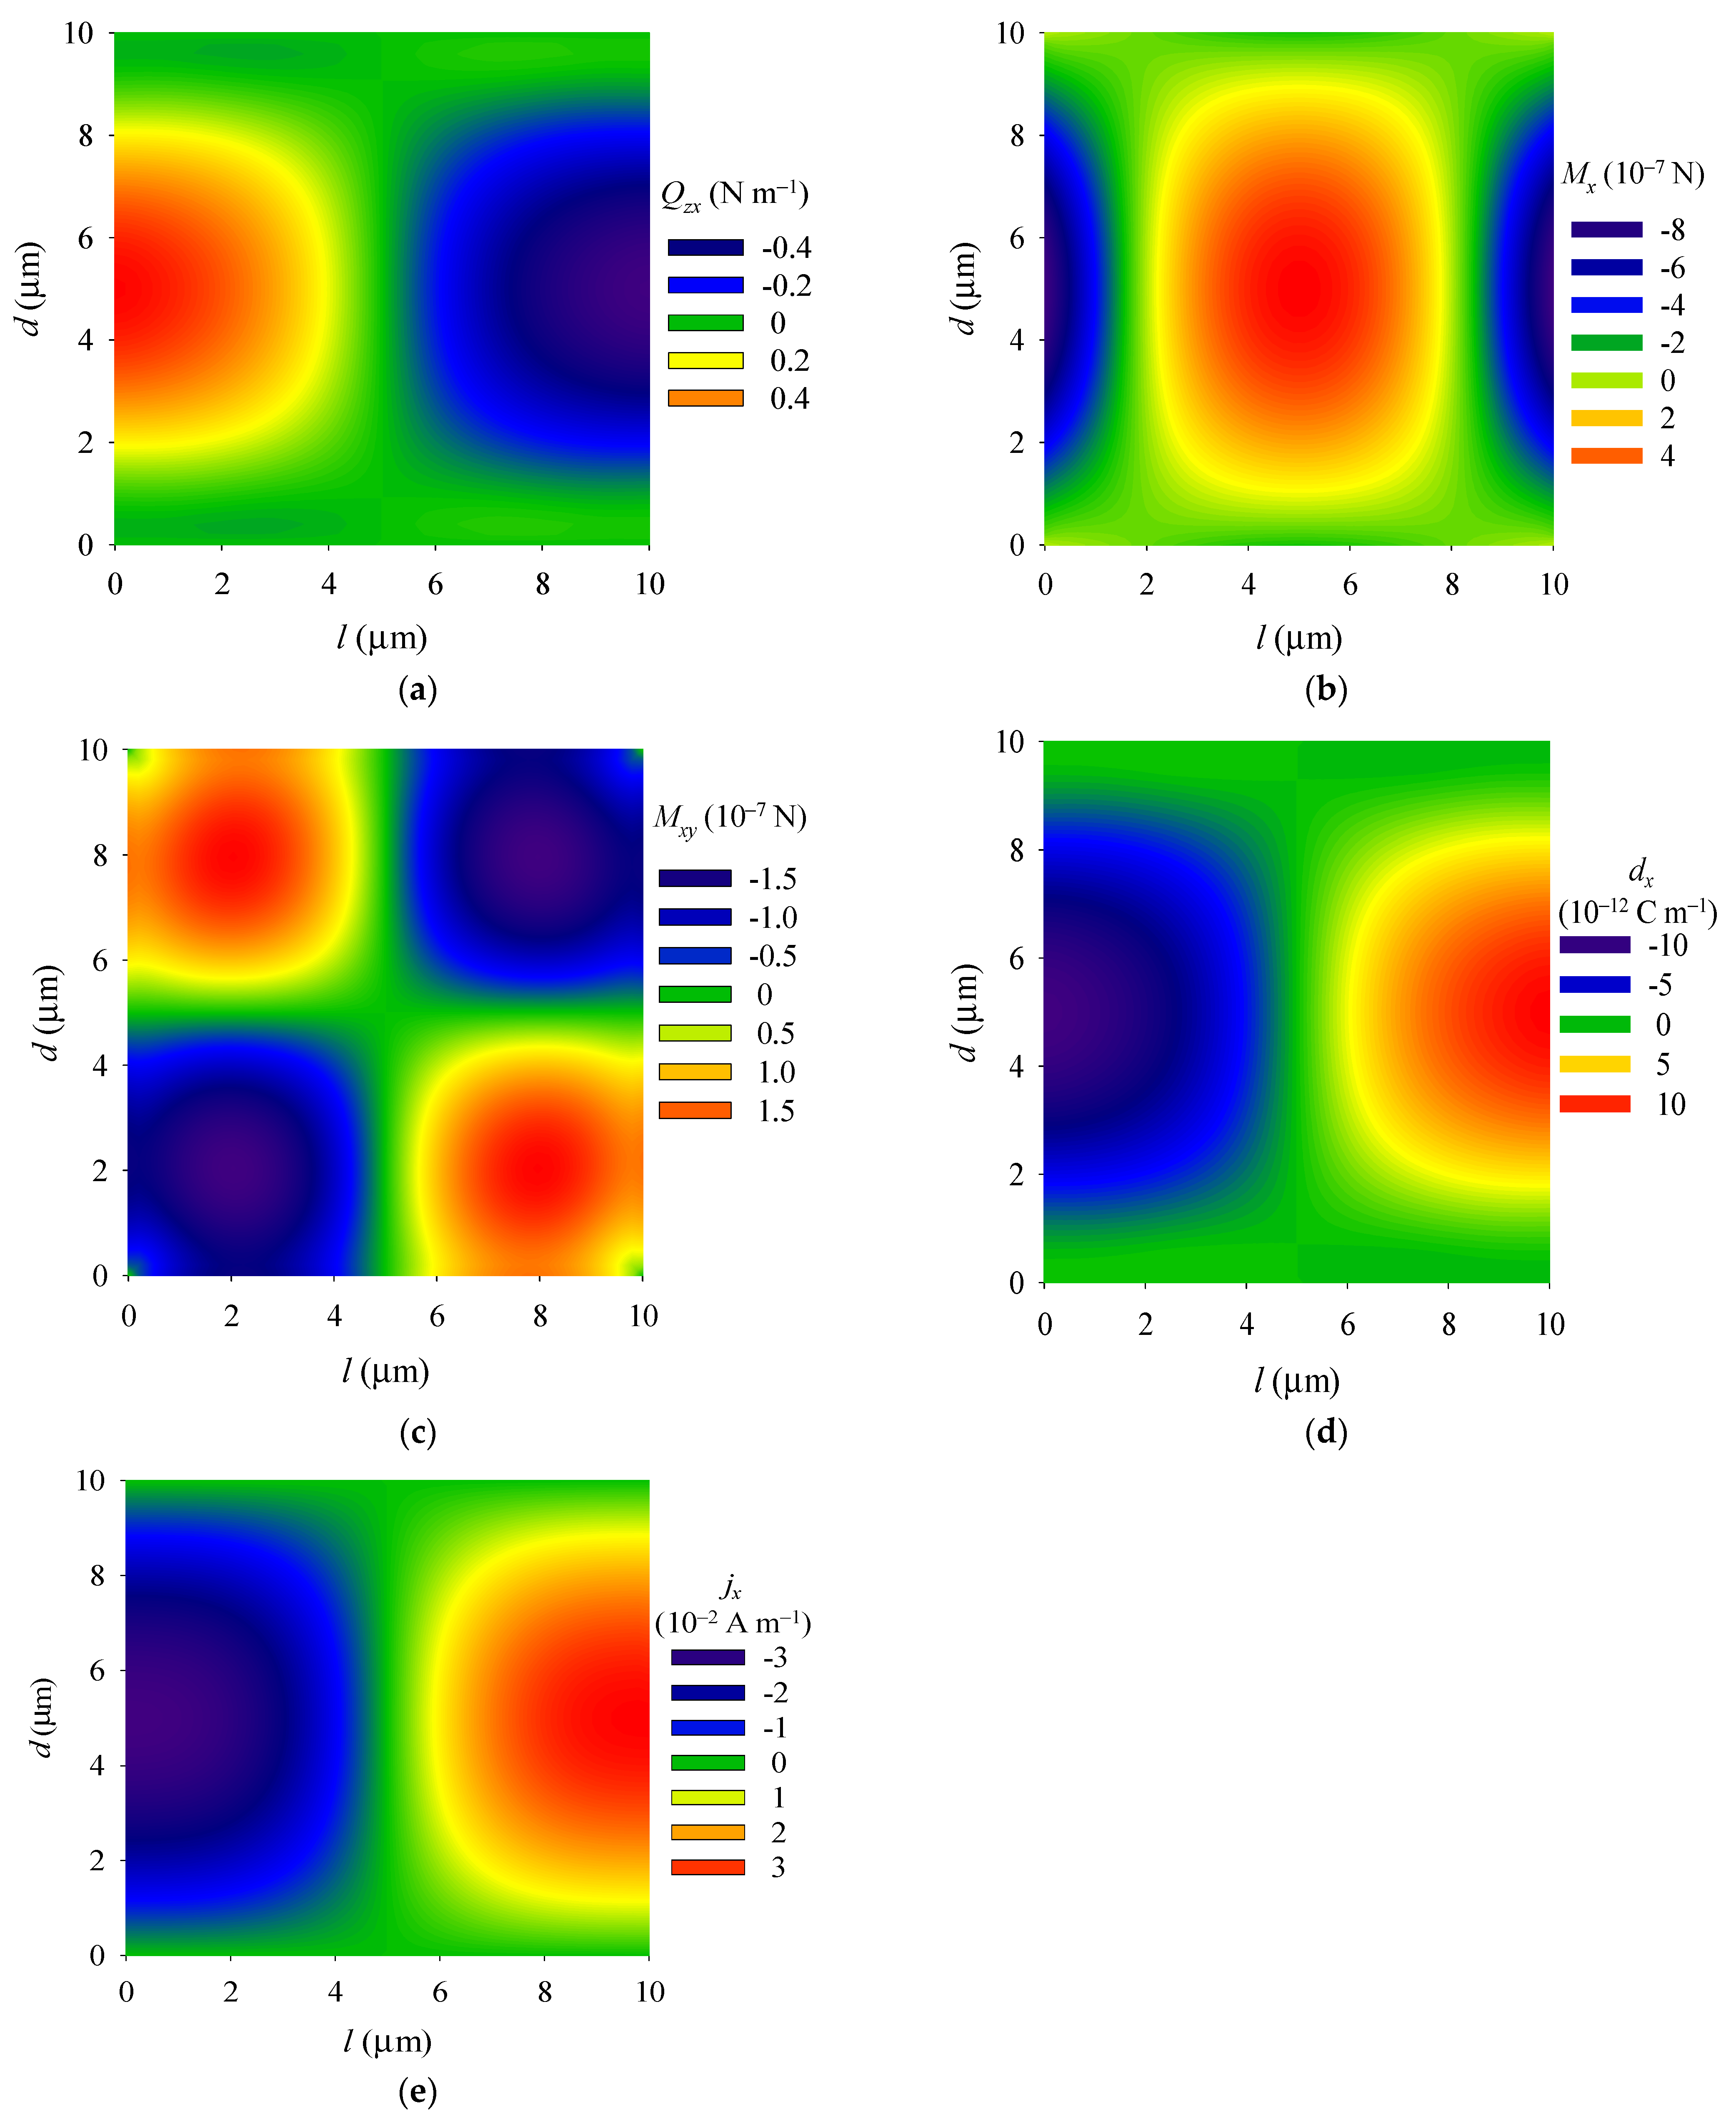
4.1. Vibration Behaviors

The initial electron concentration n0 was fixed at 1020 m−3 to ensure converged numerical results. The extended vibration modes (W, Φ, and ΔN) of the central point (l/2, d/2) in the plate versus the total element number NE were calculated (see Table 2). In the following calculation, we used NE = 300 × 300 to discretize the PSC plate in consideration of both the calculation accuracy and efficiency.
For the central point (l/2, d/2) of the plate, the absolute value of the deflection W versus the excitation frequency ω is plotted in Figure 2. Three peaks W occur because of the resonance and correspond to the first three order natural frequencies ω1, ω2, and ω3, with values 4.653 × 10⁸ rad/s, 8.305 × 10⁸ rad/s, and 11.265 × 10⁸ rad/s, respectively. In addition, the electric potential and electron concentration perturbation corresponding to resonance frequencies also reaches their peaks. In general, a high energy conversion efficiency for conversing mechanical energy into electrical energy can be realized in a resonance state; this can be used in the piezoelectric vibration energy harvesters.
We then used the first-order natural frequency as the driving frequency (ω = ω1) and examined the first-order modal of the PSC plate. Due to the symmetry, all the distribution patterns of the electromechanical fields along the x-direction are the same as those along the y-direction. Therefore, only the electromechanical fields along the x-direction were analyzed. Shear displacement ψx is antisymmetrically distributed around the central line x = l/2 (see Figure 3a), and extreme values occur at points (l/4, d/2) and (3 l/4, d/2). The distributions of the deflection W, electric potential Φ, and electron concentration perturbation ΔN are similar, and all change uniformly. Extreme values all occur at the central point (see Figure 3b–d) due to the uniformly distributed load and the fixed boundary conditions. In addition, in Figure 3d, an electron redistribution phenomenon can be clearly observed. This phenomenon occurs due to electrons spontaneously move to the high potential region.
The shear stress Qzx, surface electric charge dx, and surface electric current density jx are antisymmetric distribution around the central line x = l/2 (see Figure 4a,d,e), and extreme values of Qzx, dx, and jx all occur at the central points in the left and right fixed boundaries. The bending moment Mx is symmetrically distributed around the y-axis (see Figure 4b). The extreme values also occur at the central points of the left and right fixed boundaries, and the torque Mxy is symmetrically distributed around the diagonal lines of the plate (see Figure 4c).

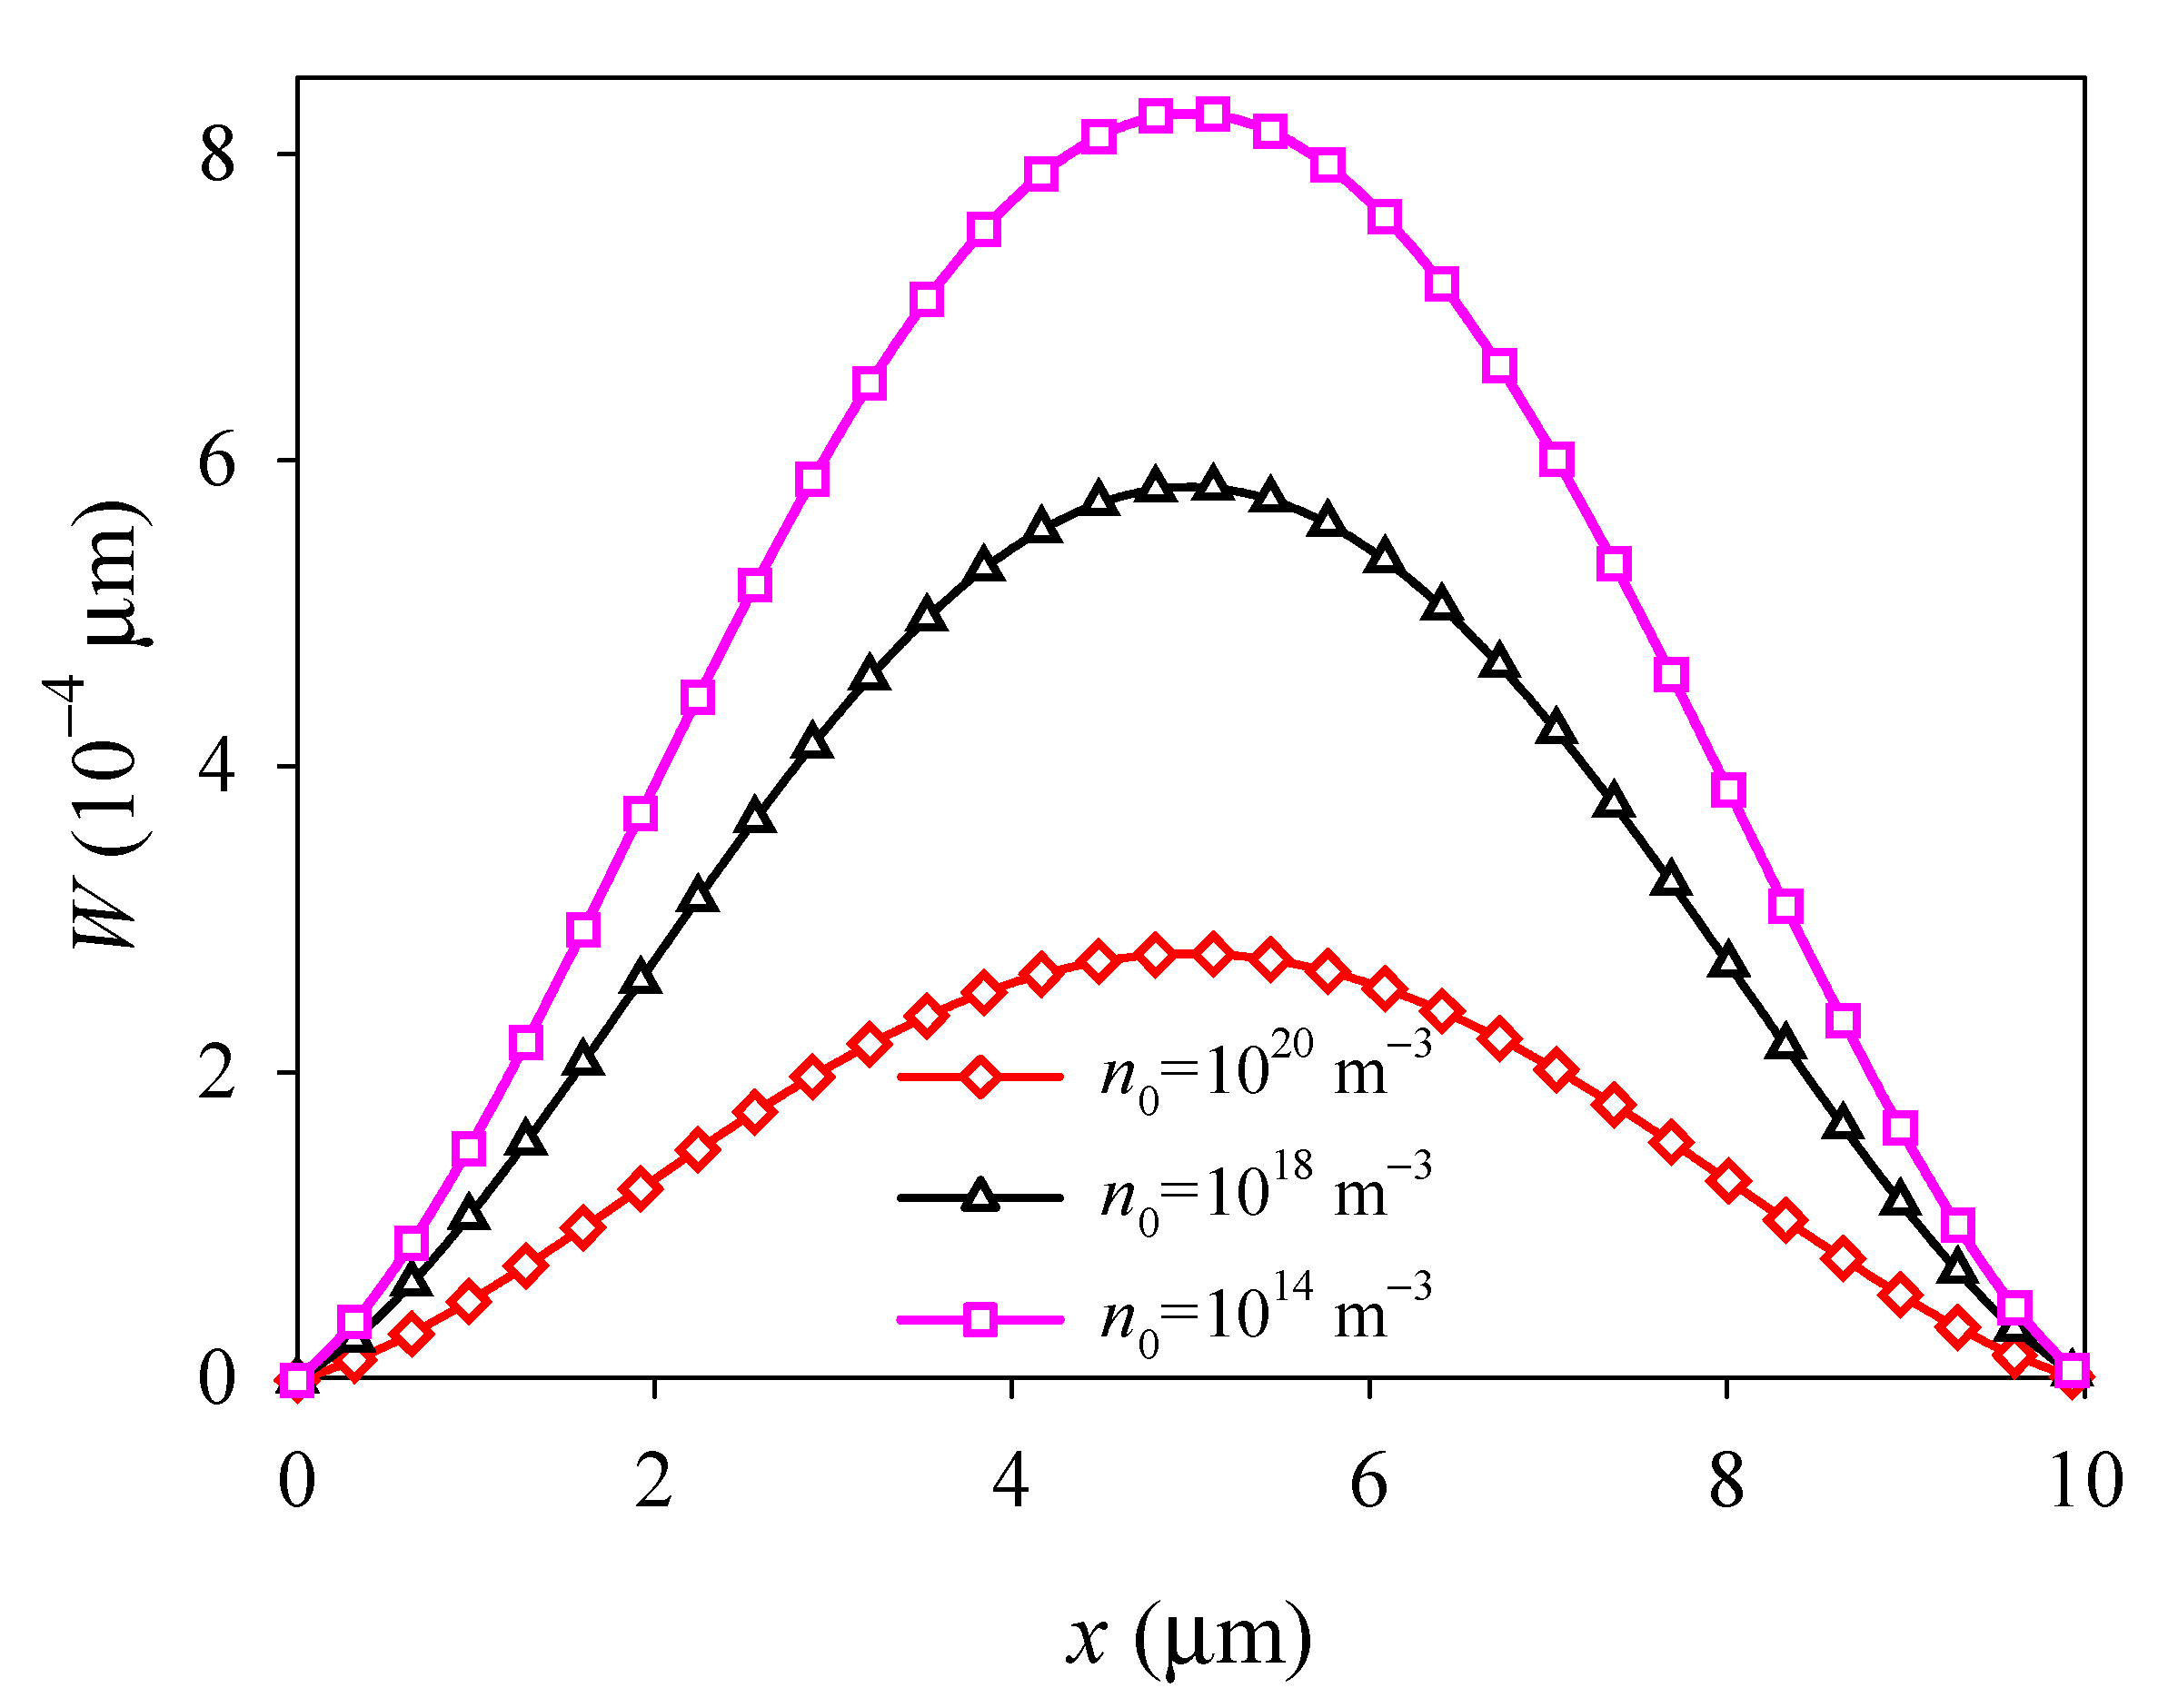
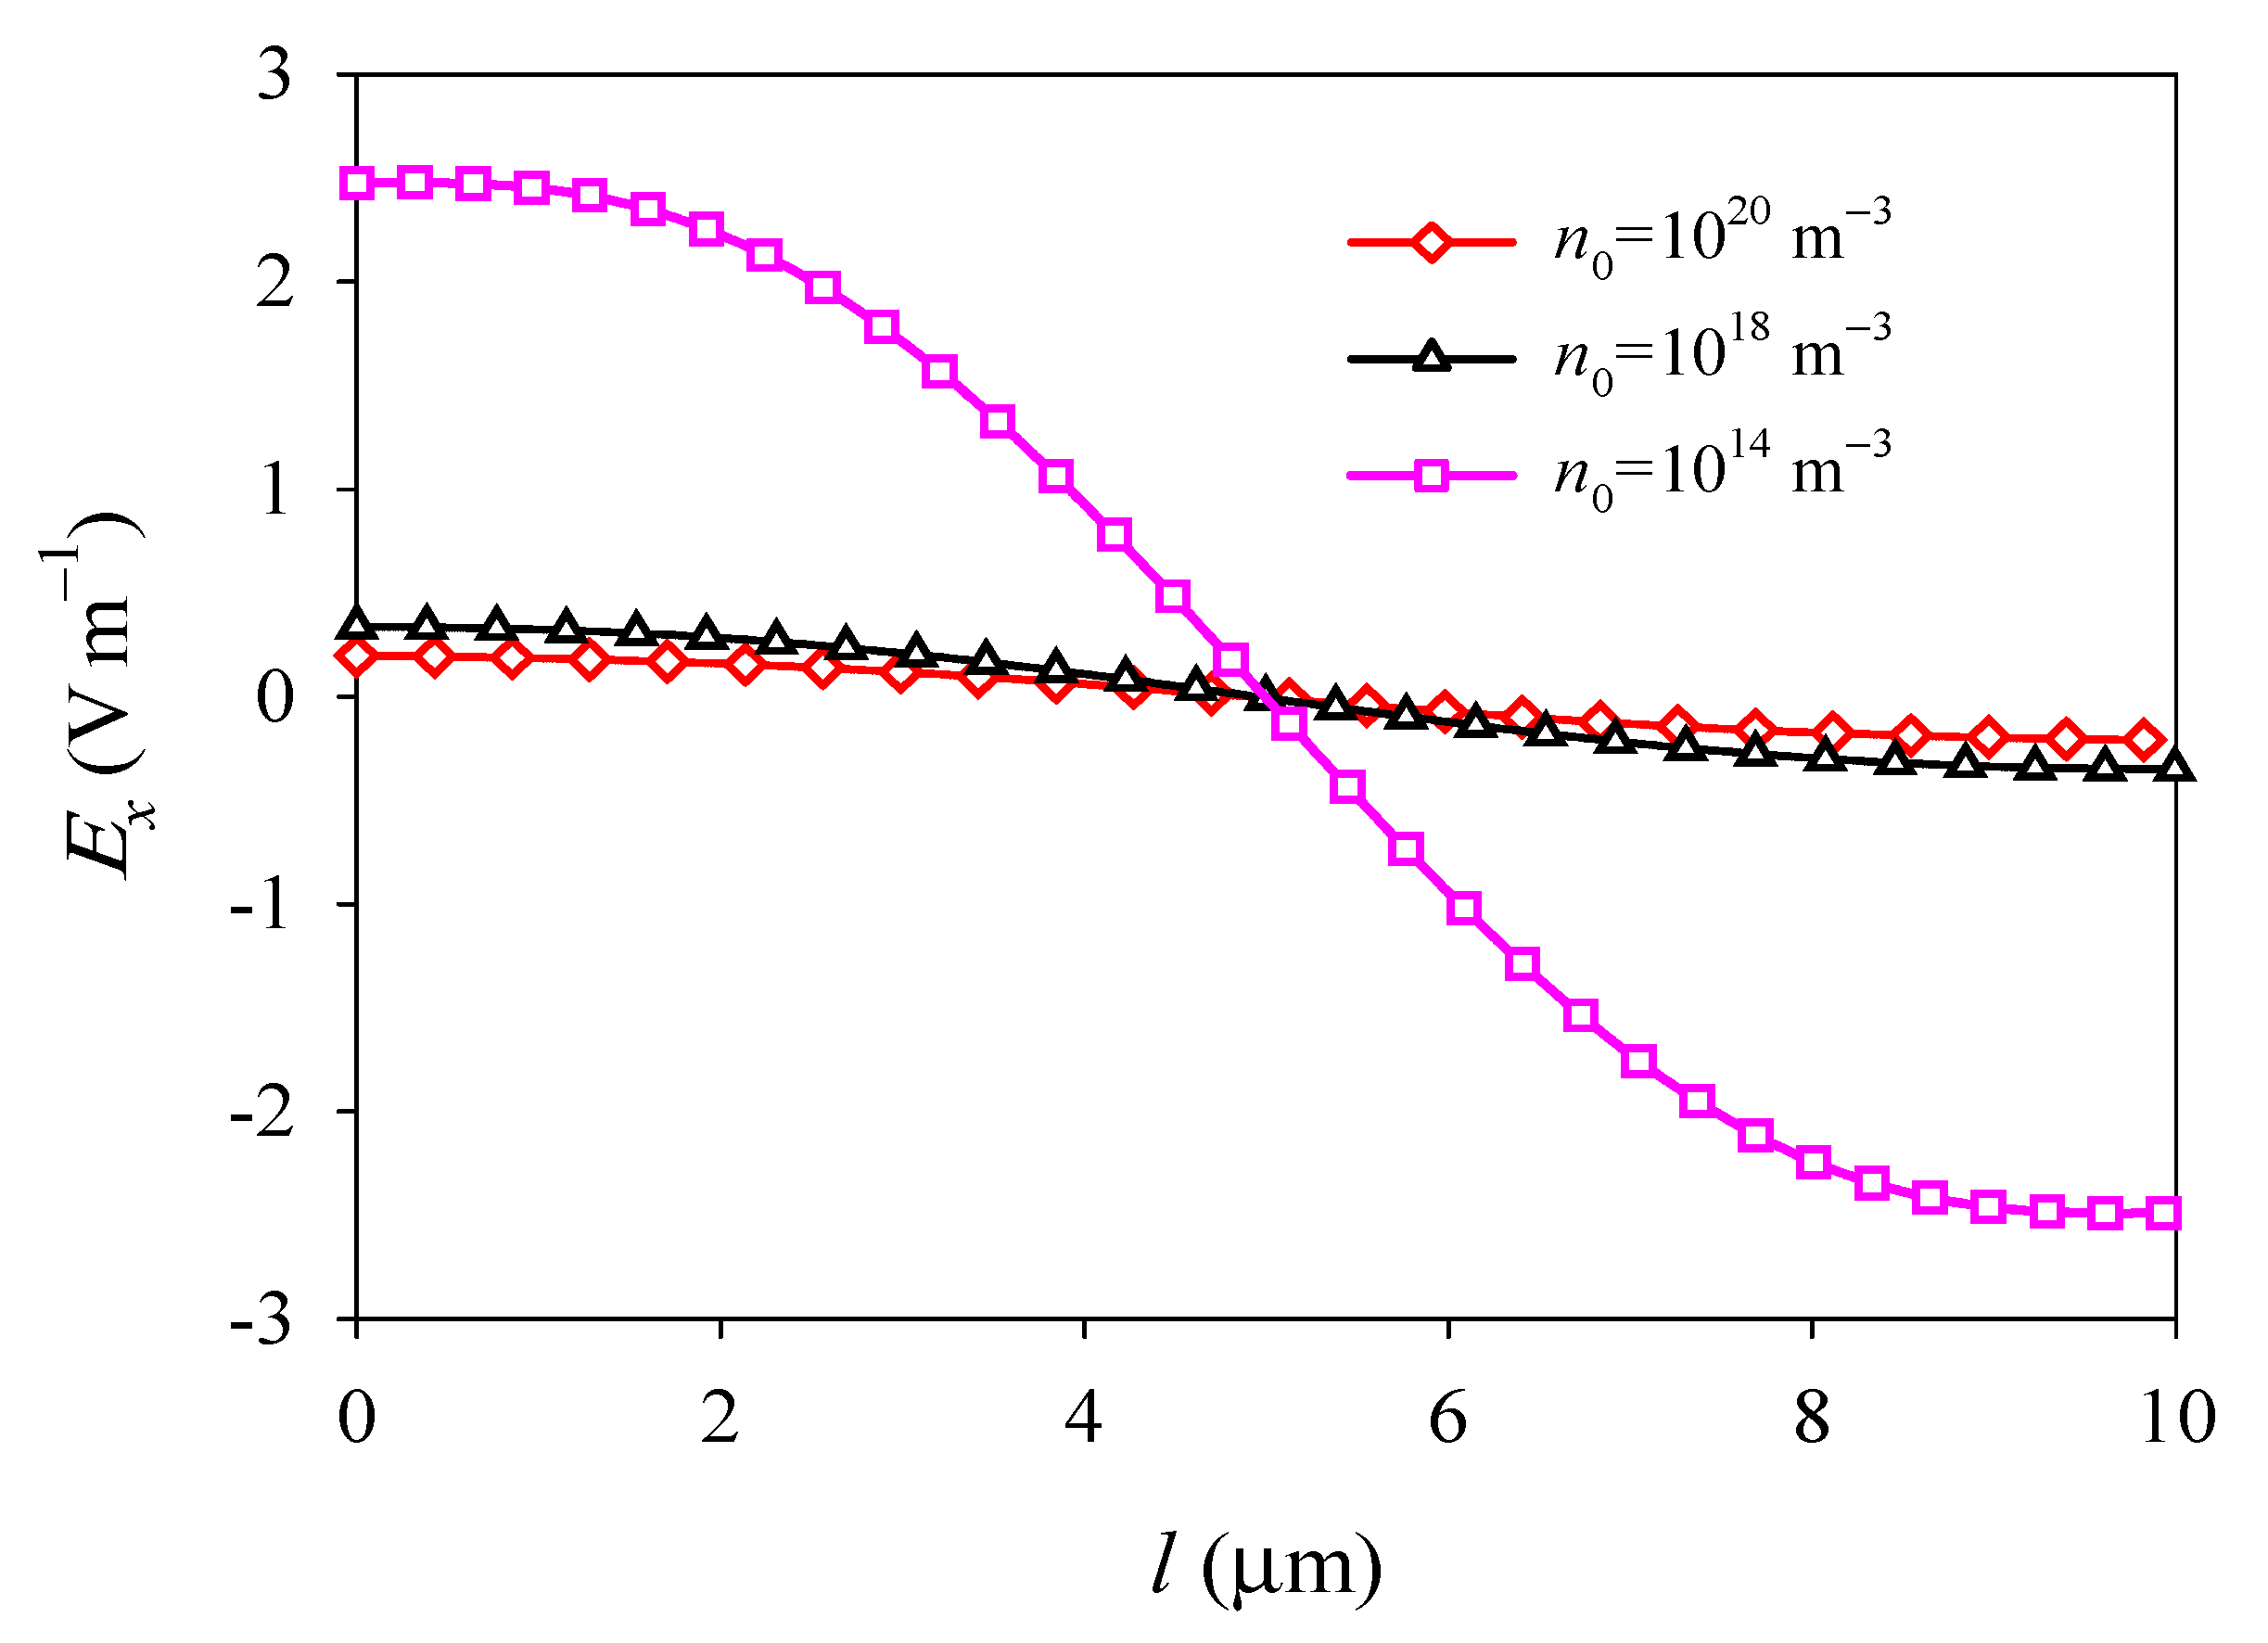
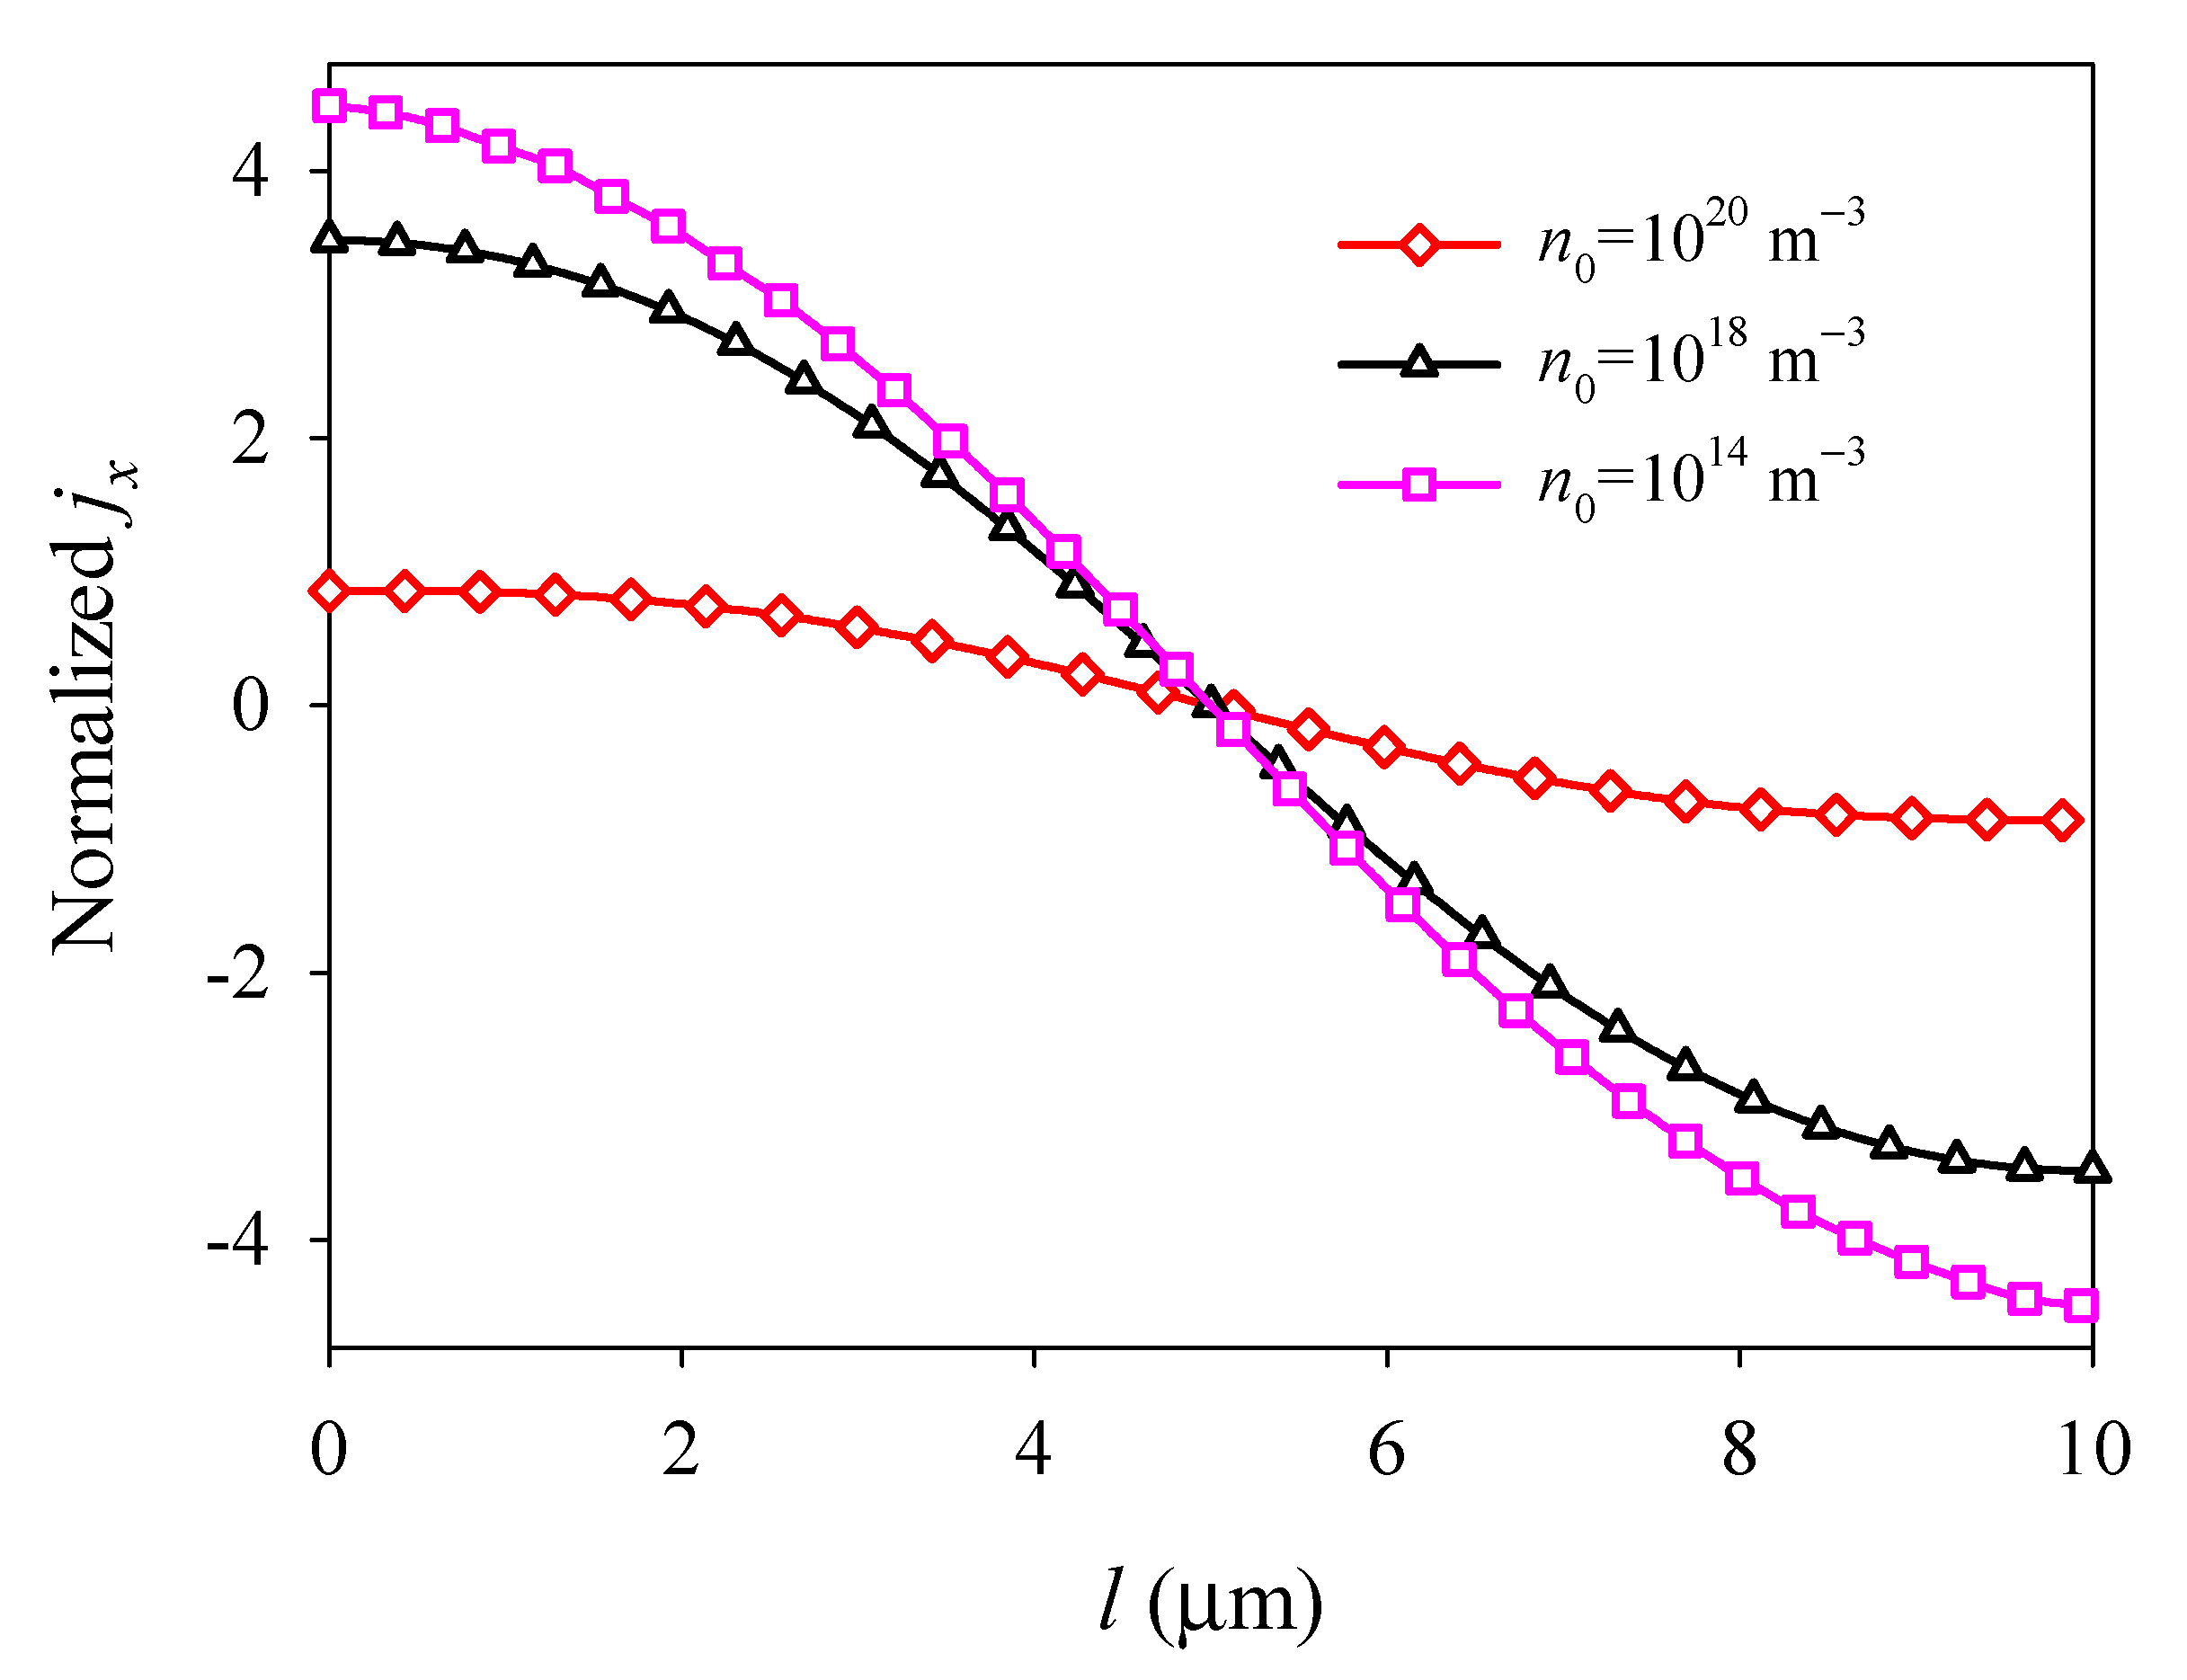
4.2. Effects of Initial Electron Concentration

The effects of the initial electron concentration n0 on vibrations were examined. With decreasing n0, numerical solutions of the electromechanical fields converged more easily. When n0 = 1014 m−3, the total element number NE = 150 × 150 is used, as shown in Table 2.
The variation in the first natural frequency ω1 of the PSC plate versus n0 is plotted in Figure 5. The effect of n0 on ω1 is small until it is in the range 1016–1020 m−3, where ω1 decreases sharply with n0. Figure 5 indicates an electron screening effect, in which increasing numbers of mobile electrons in the semiconductor will screen the effective polarization charges when n0 increases. Moreover, Figure 5 indicates that a higher initial electron concentration can reduce the stiffness of GaN PSC.
The distributions of the electromechanical fields along the line y = d/2 were analyzed. We defined the normalized electron concentration perturbation and the surface electric current density as
Δ N ¯ = Δ N / n 0 ,         j ¯ x = j x / ( q n 0 d 11 ) .
With fixed boundaries, the deflection W, electric potential Φ, and electron concentration perturbation ΔN all exhibit parabolic and symmetric distributions about the central line x = l/2, and extreme values occur at the central point (see Figure 6, Figure 7 and Figure 8). It is shown that when n0 increases, W and the absolute value of Φ and ΔN all decrease with n0 (see Figure 6, Figure 7 and Figure 8), and when n0 is relatively large, such as n0 = 1018 m−3, Φ and ΔN become decrease slowly with n0 (see Figure 7 and Figure 8). These changes of deflection W, electric potential Φ, and electron concentration perturbation ΔN with initial concentration n0 all due to the electron screening effect. As n0 increases, there are more electrons to screen the polarization charge, which leads to a weaker piezoelectric effect and a decrease of the absolute value of Φ and ΔN.
The electron field Ex and surface electric current density jx exhibit nonlinear and antisymmetric distributions about the central line at x = l/2 and decrease with increasing n0 because of electron screening (see Figure 9 and Figure 10). It is shown that the initial electron concentration has a significant effect on the electromechanical fields and electronic transport of PSC plates. This phenomenon provides a significant guide for the development and optimization of semiconductors devices, such as nanogenerators, sensors, and field-effect transistors.

5. Conclusions

Based on the 3D theory of PSC, the first-order shear deformation theory is extended to develop a simplified 2D plate model for the transient analysis. The flexural vibrations of the structure under a time-harmonic load were investigated with numerical software COMSOL. The vibration modes and natural frequencies of the PSC plate were obtained, and the influence of initial electron concentration on electromechanical behaviors was deeply discussed. The main results from numerical studies can be summarized as follows.
  • The amplitude of the deflection corresponding to the first resonant frequency is much larger than those at higher resonant frequencies, and a high energy conversion efficiency for conversing mechanical energy into electrical energy can be realized in a resonance state;
  • With the increase in the initial electron concentration, the first-order nature frequency decreases until it reaches a constant value. This phenomenon indicates that initial electron concentration plays a role in the stiffness reduction;
  • Due to the electron screen effect, the deflection, electric field, and electric current density in the PSC plate all decrease with the increase in the initial electron concentration.
The size effect has a significant effect on the mechanical and electrical properties of PSC structures at the nanoscale. It is expected that the size effect, such as the surface effect, can be considered in the vibration analysis of PSC plates.

Author Contributions

Conceptualization, methodology and writing—review and editing, Q.Z.; writing—original draft preparation and software, M.L.; validation, B.W.; supervision and project administration, M.Z. All authors have read and agreed to the published version of the manuscript.

Funding

This research was funded by National Natural Science Foundation of China, grant number 11702251.

Institutional Review Board Statement

Not applicable.

Informed Consent Statement

Not applicable.

Conflicts of Interest

The authors declare no conflict of interest.

References

  1. Hutson, A.R. Piezoelectricity and Conductivity in ZnO and CdS. Phys. Rev. Lett. 1960, 4, 505–507. [Google Scholar] [CrossRef]
  2. Zhang, X.B.; Taliercio, T.; Kolliakos, S.; Lefebvre, P. Influence of electron-phonon interaction on the optical properties of III nitride semiconductors. J. Phys.-Condens. Matter. 2001, 13, 7053–7074. [Google Scholar] [CrossRef]
  3. He, J.H.; Hsin, C.L.; Liu, J.; Chen, L.J.; Wang, Z.L. Piezoelectric gated diode of a single ZnO nanowire. Adv. Mater. 2009, 19, 781–784. [Google Scholar] [CrossRef]
  4. Wang, Z.L. Piezopotential gated nanowire devices: Piezotronics and piezo-phototronics. Nano Today 2010, 5, 540–552. [Google Scholar] [CrossRef]
  5. Wang, Z.L. The new field of nanopiezotronics. Mater. Today 2007, 10, 20–28. [Google Scholar] [CrossRef]
  6. Yang, Q.; Guo, X.; Wang, W.H.; Zhang, Y.; Xu, S.; Lien, D.H.; Wang, Z.L. Enhancing Sensitivity of a Single ZnO Micro-/Nanowire Photo detector by Piezo-Phototronic Effect. ACS Nano 2010, 4, 6285–6291. [Google Scholar] [CrossRef]
  7. Zhu, G.; Yang, R.S.; Wang, S.H.; Wang, Z.L. Flexible high-output nanogenerator based on lateral ZnO nanowire array. Nano Lett. 2010, 10, 3151–3155. [Google Scholar] [CrossRef] [Green Version]
  8. Torrisi, G.; Crupi, I.; Mirabella, S.; Terrasi, A. Robustness and electrical reliability of AZO/Ag/AZO thin film after bending stress. Sol. Energy. Mater. Sol. Cell 2017, 165, 88–93. [Google Scholar] [CrossRef]
  9. Zhang, C.L.; Wang, X.Y.; Chen, W.Q.; Yang, J.S. An analysis of the extension of a ZnO piezoelectric semiconductor nanofiber under an axial force. Smart Mater. Struct. 2017, 26, 025030. [Google Scholar] [CrossRef]
  10. Yang, W.L.; Hu, Y.T.; Yang, J.S. Transient extensional vibration in a ZnO piezoelectric semiconductor nanofiber under a suddenly applied end force. Mater. Res. Express 2019, 6, 025902. [Google Scholar] [CrossRef]
  11. Zhang, Q.Y.; Fan, C.Y.; Xu, G.T.; Zhao, M.H. Iterative boundary element method for crack analysis of two-dimensional piezoelectric semiconductor. Eng. Anal. Bound. Elem. 2017, 83, 87–95. [Google Scholar] [CrossRef]
  12. Zhao, M.H.; Yang, C.H.; Fan, C.Y.; Xu, G.T. Extended displacement discontinuity method for analysis of penny-shaped cracks in three-dimensional thermal piezoelectric semiconductors. Eur. J. Mech. A-Solids. 2018, 70, 23–36. [Google Scholar] [CrossRef]
  13. Luo, Y.X.; Zhang, C.L.; Chen, W.Q.; Yang, J.S. An analysis of PN junctions in piezoelectric semiconductors. J. Appl. Phys. 2017, 122, 204502. [Google Scholar] [CrossRef]
  14. Yang, W.L.; Liu, J.X.; Hu, Y.T. Mechanical tuning methodology on the barrier configuration near a piezoelectric PN interface and the regulation mechanism on I-V characteristics of the junction. Nano Energy 2021, 81, 105581. [Google Scholar] [CrossRef]
  15. Dai, X.Y.; Zhu, F.; Qian, Z.H.; Yang, J.S. Electric potential and carrier distribution in a piezoelectric semiconductor nanowire in time-harmonic bending vibration. Nano Energy 2018, 43, 22–28. [Google Scholar] [CrossRef]
  16. Cheng, R.R.; Zhang, C.L.; Chen, W.Q.; Yang, J.S. Electrical behaviors of a piezoelectric semiconductor fiber under a local temperature change. Nano Energy 2019, 66, 104081. [Google Scholar] [CrossRef]
  17. Jin, Z.H.; Yang, J.S. Analysis of a sandwiched piezoelectric semiconducting thermoelectric structure. Mech. Res. Commun. 2019, 98, 31–36. [Google Scholar] [CrossRef]
  18. Jiao, F.H.; Wei, J.P.; Zhou, Y.H.; Zhou, X.L. Wave propagation through a piezoelectric semiconductor slab sandwiched by two piezoelectric half-spaces. Eur. J. Mech. A-Solids 2019, 75, 70–81. [Google Scholar] [CrossRef]
  19. Liang, Y.X.; Hu, Y.T. Effect of interaction among the three time scales on the propagation characteristics of coupled waves in a piezoelectric semiconductor rod. Nano Energy 2020, 68, 104345. [Google Scholar] [CrossRef]
  20. Yang, J.S.; Zhou, H.G. Amplification of acoustic waves in piezoelectric semiconductor plates. Int. J. Solids Struct. 2005, 42, 3171–3183. [Google Scholar] [CrossRef] [Green Version]
  21. Yang, J.S.; Yang, X.M.; Turner, J.A. Amplification of acoustic waves in laminated piezoelectric semiconductor plates. Arch. Appl. Mech. 2004, 3, 288–298. [Google Scholar] [CrossRef]
  22. Li, P.; Jin, F.; Yang, J.S. Effects of semiconduction on electromechanical energy conversion in piezoelectrics. Smart Mater. Struct. 2015, 24, 025021. [Google Scholar] [CrossRef]
  23. Tian, R.; Liu, J.X.; Pan, E.; Wang, Y.S.; Soh, A.K. Some characteristics of elastic waves in a piezoelectric semiconductor plate. J. Appl. Phys. 2019, 126, 125701. [Google Scholar] [CrossRef]
  24. Tian, R.; Liu, J.X.; Pan, E.; Wang, Y.S. SH waves in multilayered piezoelectric semiconductor plates with imperfect interfaces. Eur. J. Mech. A-Solid. 2020, 81, 103961. [Google Scholar] [CrossRef]
  25. Luo, Y.X.; Zhang, C.L.; Chen, W.Q.; Yang, J.S. Piezotronic effect of a thin film with elastic and piezoelectric semiconductor layers under a static flexural loading. J. Appl. Mech-Trans. ASME 2019, 86, 051003. [Google Scholar] [CrossRef]
  26. Luo, Y.X.; Cheng, R.R.; Zhang, C.L. Analysis of Flexural Vibrations of Laminated Piezoelectric Semiconductor Plates. CJSM 2020, 41, 15–29. [Google Scholar]
  27. Zhao, M.H.; Yang, C.H.; Fan, C.Y.; Zhang, Q.Y. A shooting method for nonlinear boundary value problems in a thermal piezoelectric semiconductor plate. ZAMM-Z. Angew. Math. Mech. 2020, 100, e201900302. [Google Scholar] [CrossRef]
  28. Zhao, M.H.; Zhang, Q.Y.; Fan, C.Y. An efficient iteration approach for nonlinear boundary value problems in 2D piezoelectric semiconductors. Appl. Math. Model. 2019, 74, 170–183. [Google Scholar] [CrossRef]
Figure 1. A PSC plate subjected to a transverse time-harmonic force fz.
Materials 14 03926 g001
Figure 2. Deflection W versus the driving frequency ω.
Materials 14 03926 g002
Figure 3. Distributions of (a) shear displacement Ψx, (b) deflection W, (c) electric potential Φ, and (d) electron concentration perturbation ΔN in the plate.
Materials 14 03926 g003aMaterials 14 03926 g003b
Figure 4. Distributions of (a) shear stress Qzx, (b) bending moment Mx (c) torque Mxy, (d) surface electric charge dx, and (e) surface electric current density jx in the plate.
Materials 14 03926 g004
Figure 5. The first natural frequency ω1 versus initial electron concentration n0.
Materials 14 03926 g005
Figure 6. Deflection W along the midline y = d/2 versus initial electron concentration n0.
Materials 14 03926 g006
Figure 7. Electric potential Φ along the midline y = d/2 versus initial electron concentration n0.
Materials 14 03926 g007
Figure 8. Normalized electron concentration perturbation ΔN along the midline y = d/2 versus initial electron concentration n0.
Materials 14 03926 g008
Figure 9. Electric field Ex along the midline y = d/2 versus the initial electron concentration n0.
Materials 14 03926 g009
Figure 10. Normalized surface electric current density jx along the midline y = d/2 versus initial electron concentration n0.
Materials 14 03926 g010
Table 1. The elastic, piezoelectric, and dielectric constants of GaN.
PropertyParameterValueUnit
Elastic constantc11293.7GPa
c12124.1GPa
c13158.5GPa
c33282.0GPa
c4422.3GPa
Piezoelectric constante13−0.52C m−2
Dielectric constantε339.385 × 10⁻¹¹C V−1 m−1
Electron mobilityμ119.62 × 10⁻²m2 V−1 s−1
Diffusion constantd112.49 × 10−3m2 s−1
Table 2. The values of W, Φ, and ΔN at central point versus the element number NE.
NEn0 = 1020 (m−3)n0 = 1014 (m−3)
W (10−4 m)Φ (10−2 V)ΔN (1018 m−3)W (10−4 m)Φ (10−1 V)ΔN (1014 m−3)
36 × 362.5496.6434.0208.2528.6321.796
78 × 782.7846.5554.3078.2738.6531.802
100 × 1002.7916.5524.3168.2738.6541.802
150 × 1502.7956.5504.3218.2748.6541.802
200 × 2002.7966.5514.3218.2748.6541.802
300 × 3002.7956.5504.3218.2748.6541.802
400 × 4002.7956.5504.3218.2748.6541.802
Publisher’s Note: MDPI stays neutral with regard to jurisdictional claims in published maps and institutional affiliations.

