Article

Microstructure, Mechanical Properties, and Corrosion Behavior of Boron Carbide Reinforced Aluminum Alloy (Al-Fe-Si-Zn-Cu) Matrix Composites Produced via Powder Metallurgy Route

1
Department of Mechanical Engineering, K. Ramakrishnan College of Engineering, Trichy 621112, India
2
Centre for Materials Engineering and Regenerative Medicine, Bharath Institute of Higher Education and Research, Chennai 600126, India
3
P. A. College of Engineering, Visvesvaraya Technological University, Belagavi, Mangaluru 574153, India
4
Department of Mechanical Engineering, Saveetha School of Engineering, SIMATS, Chennai 602105, India
5
Department of Mechanical Engineering, College of Engineering, King Khalid University, P.O. Box 394, Abha 61421, Saudi Arabia
6
Department of Mechanical Engineering, The University of Akron, Akron, OH 44325, USA
7
Department of Mechanical Engineering, Faculty of Engineering, International Islamic University, Kuala Lumpur 53100, Malaysia
*
Authors to whom correspondence should be addressed.
Materials 2021, 14(15), 4315; https://doi.org/10.3390/ma14154315
Submission received: 11 June 2021 / Revised: 22 July 2021 / Accepted: 28 July 2021 / Published: 2 August 2021

Abstract

:
In this paper, Al-Fe-Si-Zn-Cu (AA8079) matrix composites with several weight percentages of B4C (0, 5, 10, and 15) were synthesized by powder metallurgy (PM). The essential amount of powders was milled to yield different compositions such as AA8079, AA8079-5 wt.%B4C, AA8079-10 wt.%B4C, and AA8079-15 wt.%B4C. The influence of powder metallurgy parameters on properties’ density, hardness, and compressive strength was examined. The green compacts were produced at three various pressures: 300 MPa, 400 MPa, and 500 MPa. The fabricated green compacts were sintered at 375 °C, 475 °C, and 575 °C for the time period of 1, 2 and 3 h, respectively. Furthermore, the sintered samples were subjected to X-ray diffraction (XRD) analysis, Energy Dispersive Analysis (EDAX), and Scanning Electron Microscope (SEM) examinations. The SEM examination confirmed the uniform dispersal of B4C reinforcement with AA8079 matrix. Corrosion behavior of the composites samples was explored. From the studies, it is witnessed that the rise in PM process parameters enhances the density, hardness, compressive strength, and corrosion resistance.

1. Introduction

Metal based composites have extensive uses in numerous engineering areas owing to its extreme properties, namely superior precise stiffness, strength/weight ratio, and wear opposition [1]. Traditionally PM has been recognized as suitable method to synthesize metal parts with uniform and fine microstructures. By following this method (PM) various kinds of materials can be easily mixed to attain unique properties [2]. PM is a frequent and fast developing technology, taking up all metallic and alloy materials and a widespread variability of dimensions [3]. Compared to other conventional fabrication methods, the PM route is recognized to be capable in the fabrication of aluminum alloy based MMC [4]. Due to the collective effect of metallic and ceramic materials, aluminum metal matrix composites have tremendous uses such as automotive and aircraft, owing to its low density and specific strength [5]. Aluminum alloy has numerous merits compared to Fe alloys, namely lower density, higher conductivity, etc. [6]. Among various reinforcements, boron carbide (B4C) has been accepted one of the hardest. B4C possesses better wear and impact opposition, a higher maximum melting point, and better resistance to chemical agents [7,8]. B4C has been extensively utilized as cements and armor plates, despite its less specific gravity, better hardness value, and maximum elastic modulus value [9]. Hamid Alihosseini et al. inspected the behavior and microstructure analysis of B4C/Al nanocomposites produced through the PM method, and stated that maximum hardness and compression strength was achieved for Al-5% B4C composites [10]. Jeyasimman et al. [11] examined the microstructure and mechanical behavior of AA6061-γ-Al2O3 nanocomposites produced through mechanical alloying and PM route and described the mechanical properties. Anil Kumar Bodukuri et al. synthesized B4C/SiC/Al powder metallurgic composites and studied the mechanical behavior [12]. Sivasankaran et al. produced and investigated the x-ray diffraction of Al2O3 reinforced nanocomposite manufactured via mechanical alloying [13]. Ravichandran et al. explored the microstructure and EDAX analysis of Al–TiO2–Gr composites, and observed the presence and dispersal of reinforcement particles with matrix [14]. Mohammed Ali Almomani et al. studied the corrosion properties of Cu-30Zn Brass with and without SiC reinforcement, fabricated through powder metallurgy, and stated that corrosion opposition of the composites enhanced the raise of percentage as an effect of weedy micro galvanic combination amid reinforcement particles and alloy [15]. H.M. Zakaria explored the microstructure and conduct of SiC strengthened Al composites manufactured through PM method and observed that addition of reinforcement leads to reduction in corrosion rate [16].
Norul AmierahBinti Nor Zamani et al. [17] studied the mechanical characterization of Al+Gr+Al2O3 hybrid composites and stated that inclusions of Al2O3 and Gr particles improve the mechanical behavior of the AMCs considerably. Nazli Akcamli [18] developed Al-8.5 wt% Si-3.5 wt% Cu matrix composites and reported that inclusion of B4C particles results in significant enhancement in mechanical behavior of the produced composites. Vipin Kumar Sharma [19] synthesized Al6061-Al2O3-SiC-CeO2 composites by PM route and concluded that a rise in reinforcement wt.% enhances the composites mechanical behavior drastically. Mohd Bilal Naim Shaikh [20] explored the mechanical behavior of Al-SiC-RHA composites produced via the PM method and observed that inclusions of reinforcement particles result in superior improvement in mechanical properties of the composites. Meysam Toozandehjani et al. [21] produced Al-CNT-Al2O3 nanocomposites through the PM process and observed that superior hardness and strength properties were attained at integration of 10 wt.% Al2O3. Erdemir et al. [22] produced Al2024/SiC composites via the PM process and indicated that inclusions of SiC reinforcement enhances the mechanical properties of the composites expressively. Halil Karakoc et al. [23] explored the mechanical properties of Al6061/SiC/B4C hybrid composites prepared by the PM route, and concluded that increase in reinforcement particles results in enhancement in mechanical properties. Fathy et al. [24] explored the mechanical properties of Al-Fe composites and stated that the addition of Fe reinforcement particles increases the hardness and compressive strength of the composites Gheorghe Iacob et al. [25] investigated the micro hardness behavior of Al/Al2O3/Gr hybrid composites produced via the PM process and witnessed that a rise in reinforcement weight percentage increases the micro hardness gradually. Stalin et al. [26] studied the corrosion behavior of Al-MoO3 composites synthesized by the PM route; from the experimentation it has been concluded that corrosion opposition of the composites enhanced with the addition of a MoO3 particle.
From the detailed literature review, it could be understood that very little research work has been completed in the development of aluminum alloys of 8xxx series using PM technique. Additionally, present work aims to develop composite with the AA8079 and B4C particle. From the literature review it has been found that the development of aluminum alloy is a challenging task. Hence, ball milling was used to develop aluminum alloy in the present work. However, the mixing of alloying element and reinforcement particle with the major constituent could be possible by selecting suitable ball milling and powder metallurgy process parameters. Furthermore, this work has made an effort to synthesize AA8079-B4C composites at different powder metallurgy process parameters to analyze the microstructure, mechanical, and corrosion behavior. The effect of parameters on the hardness, density, CS, corrosion properties, and microstructure have been analyzed in detail.

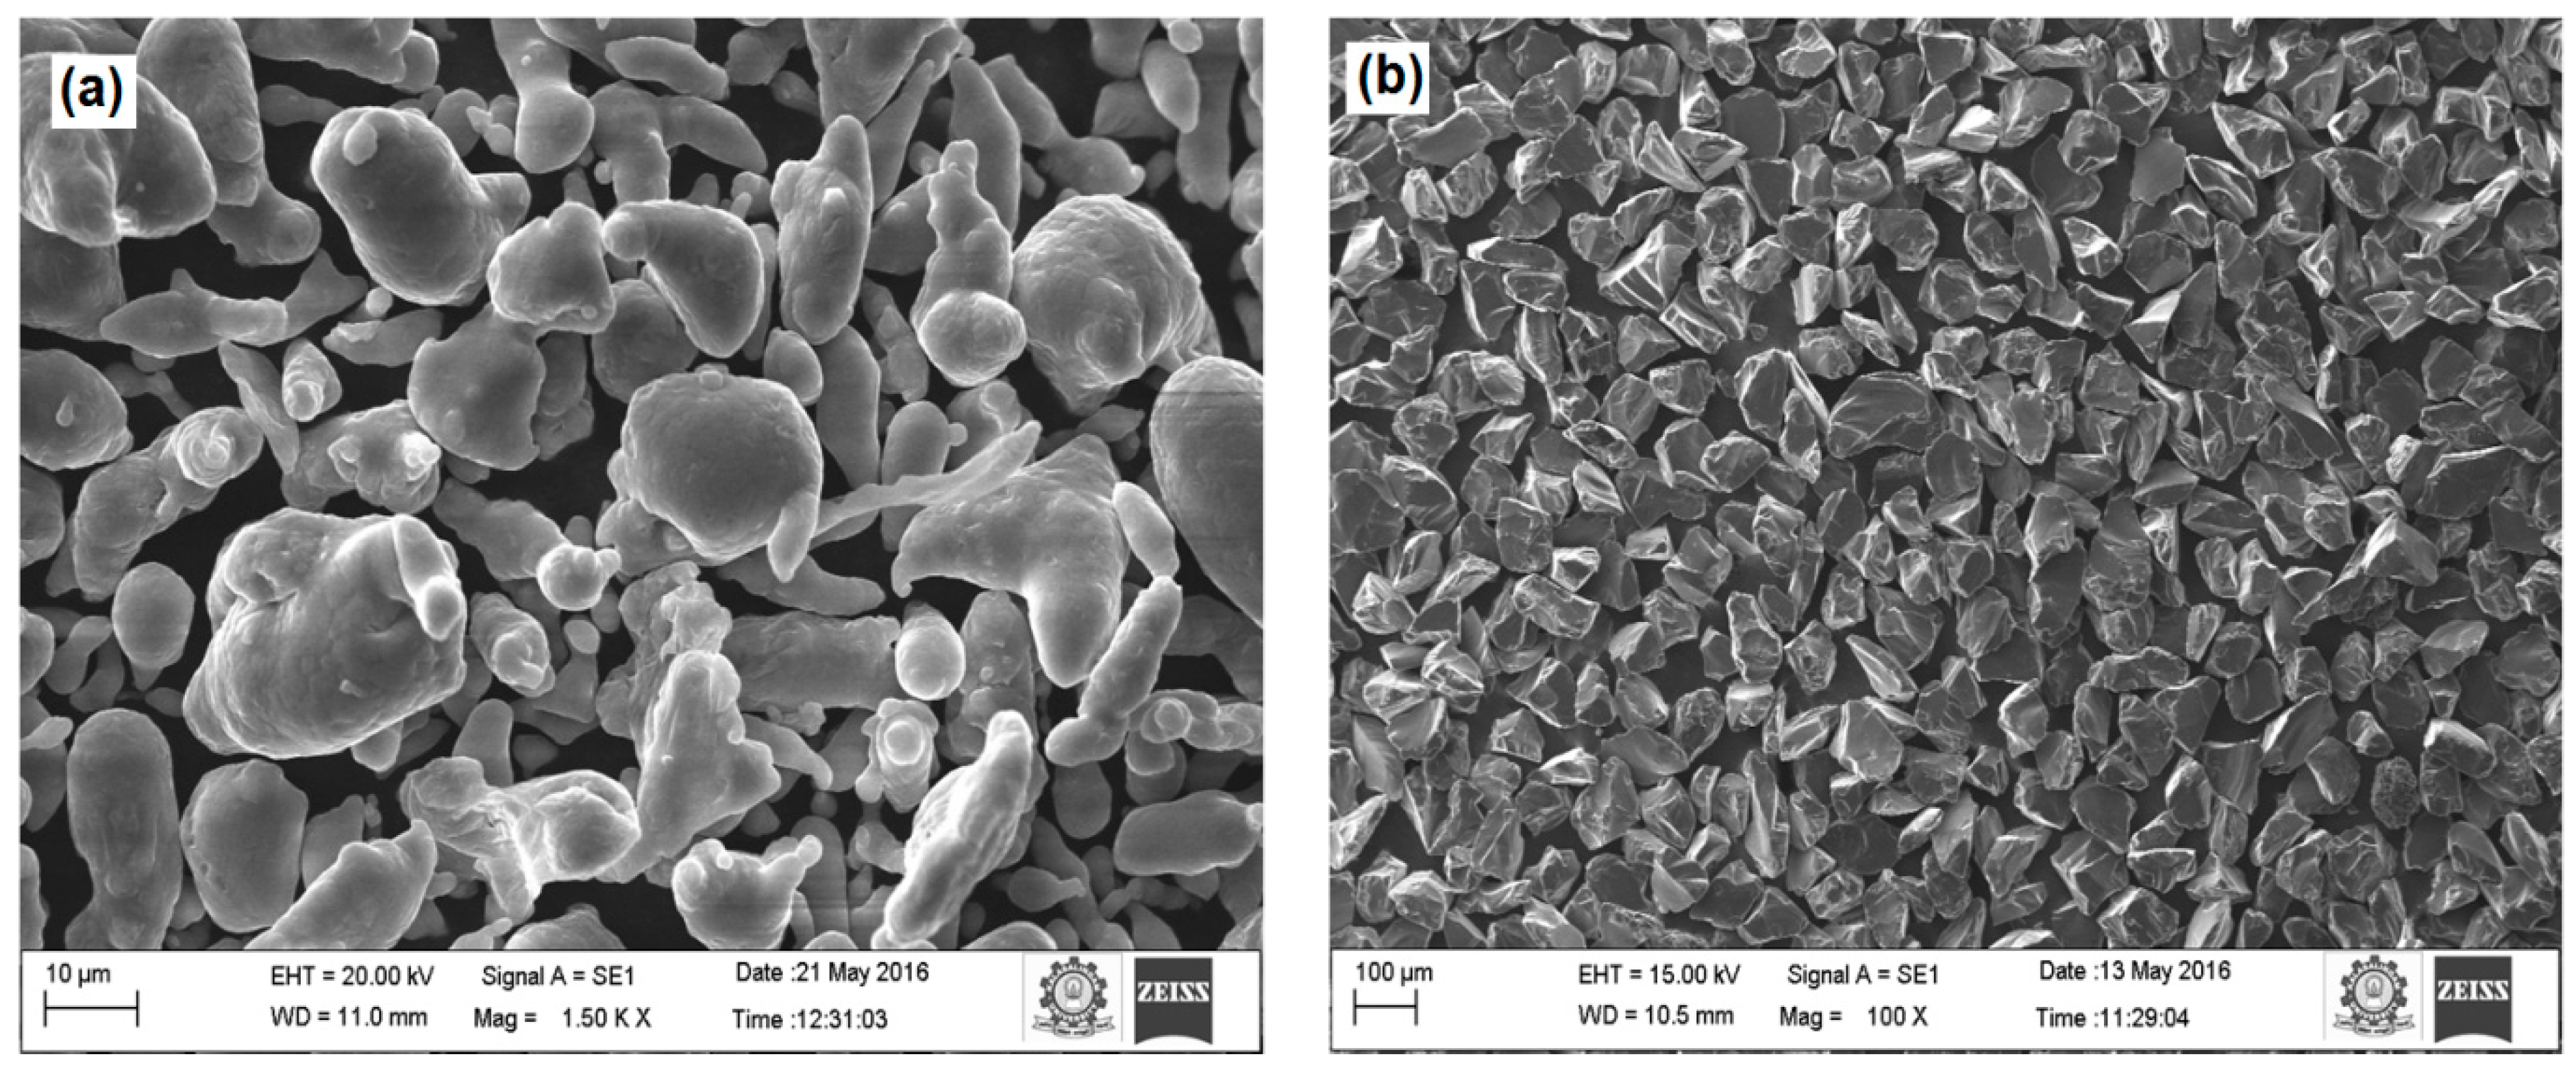
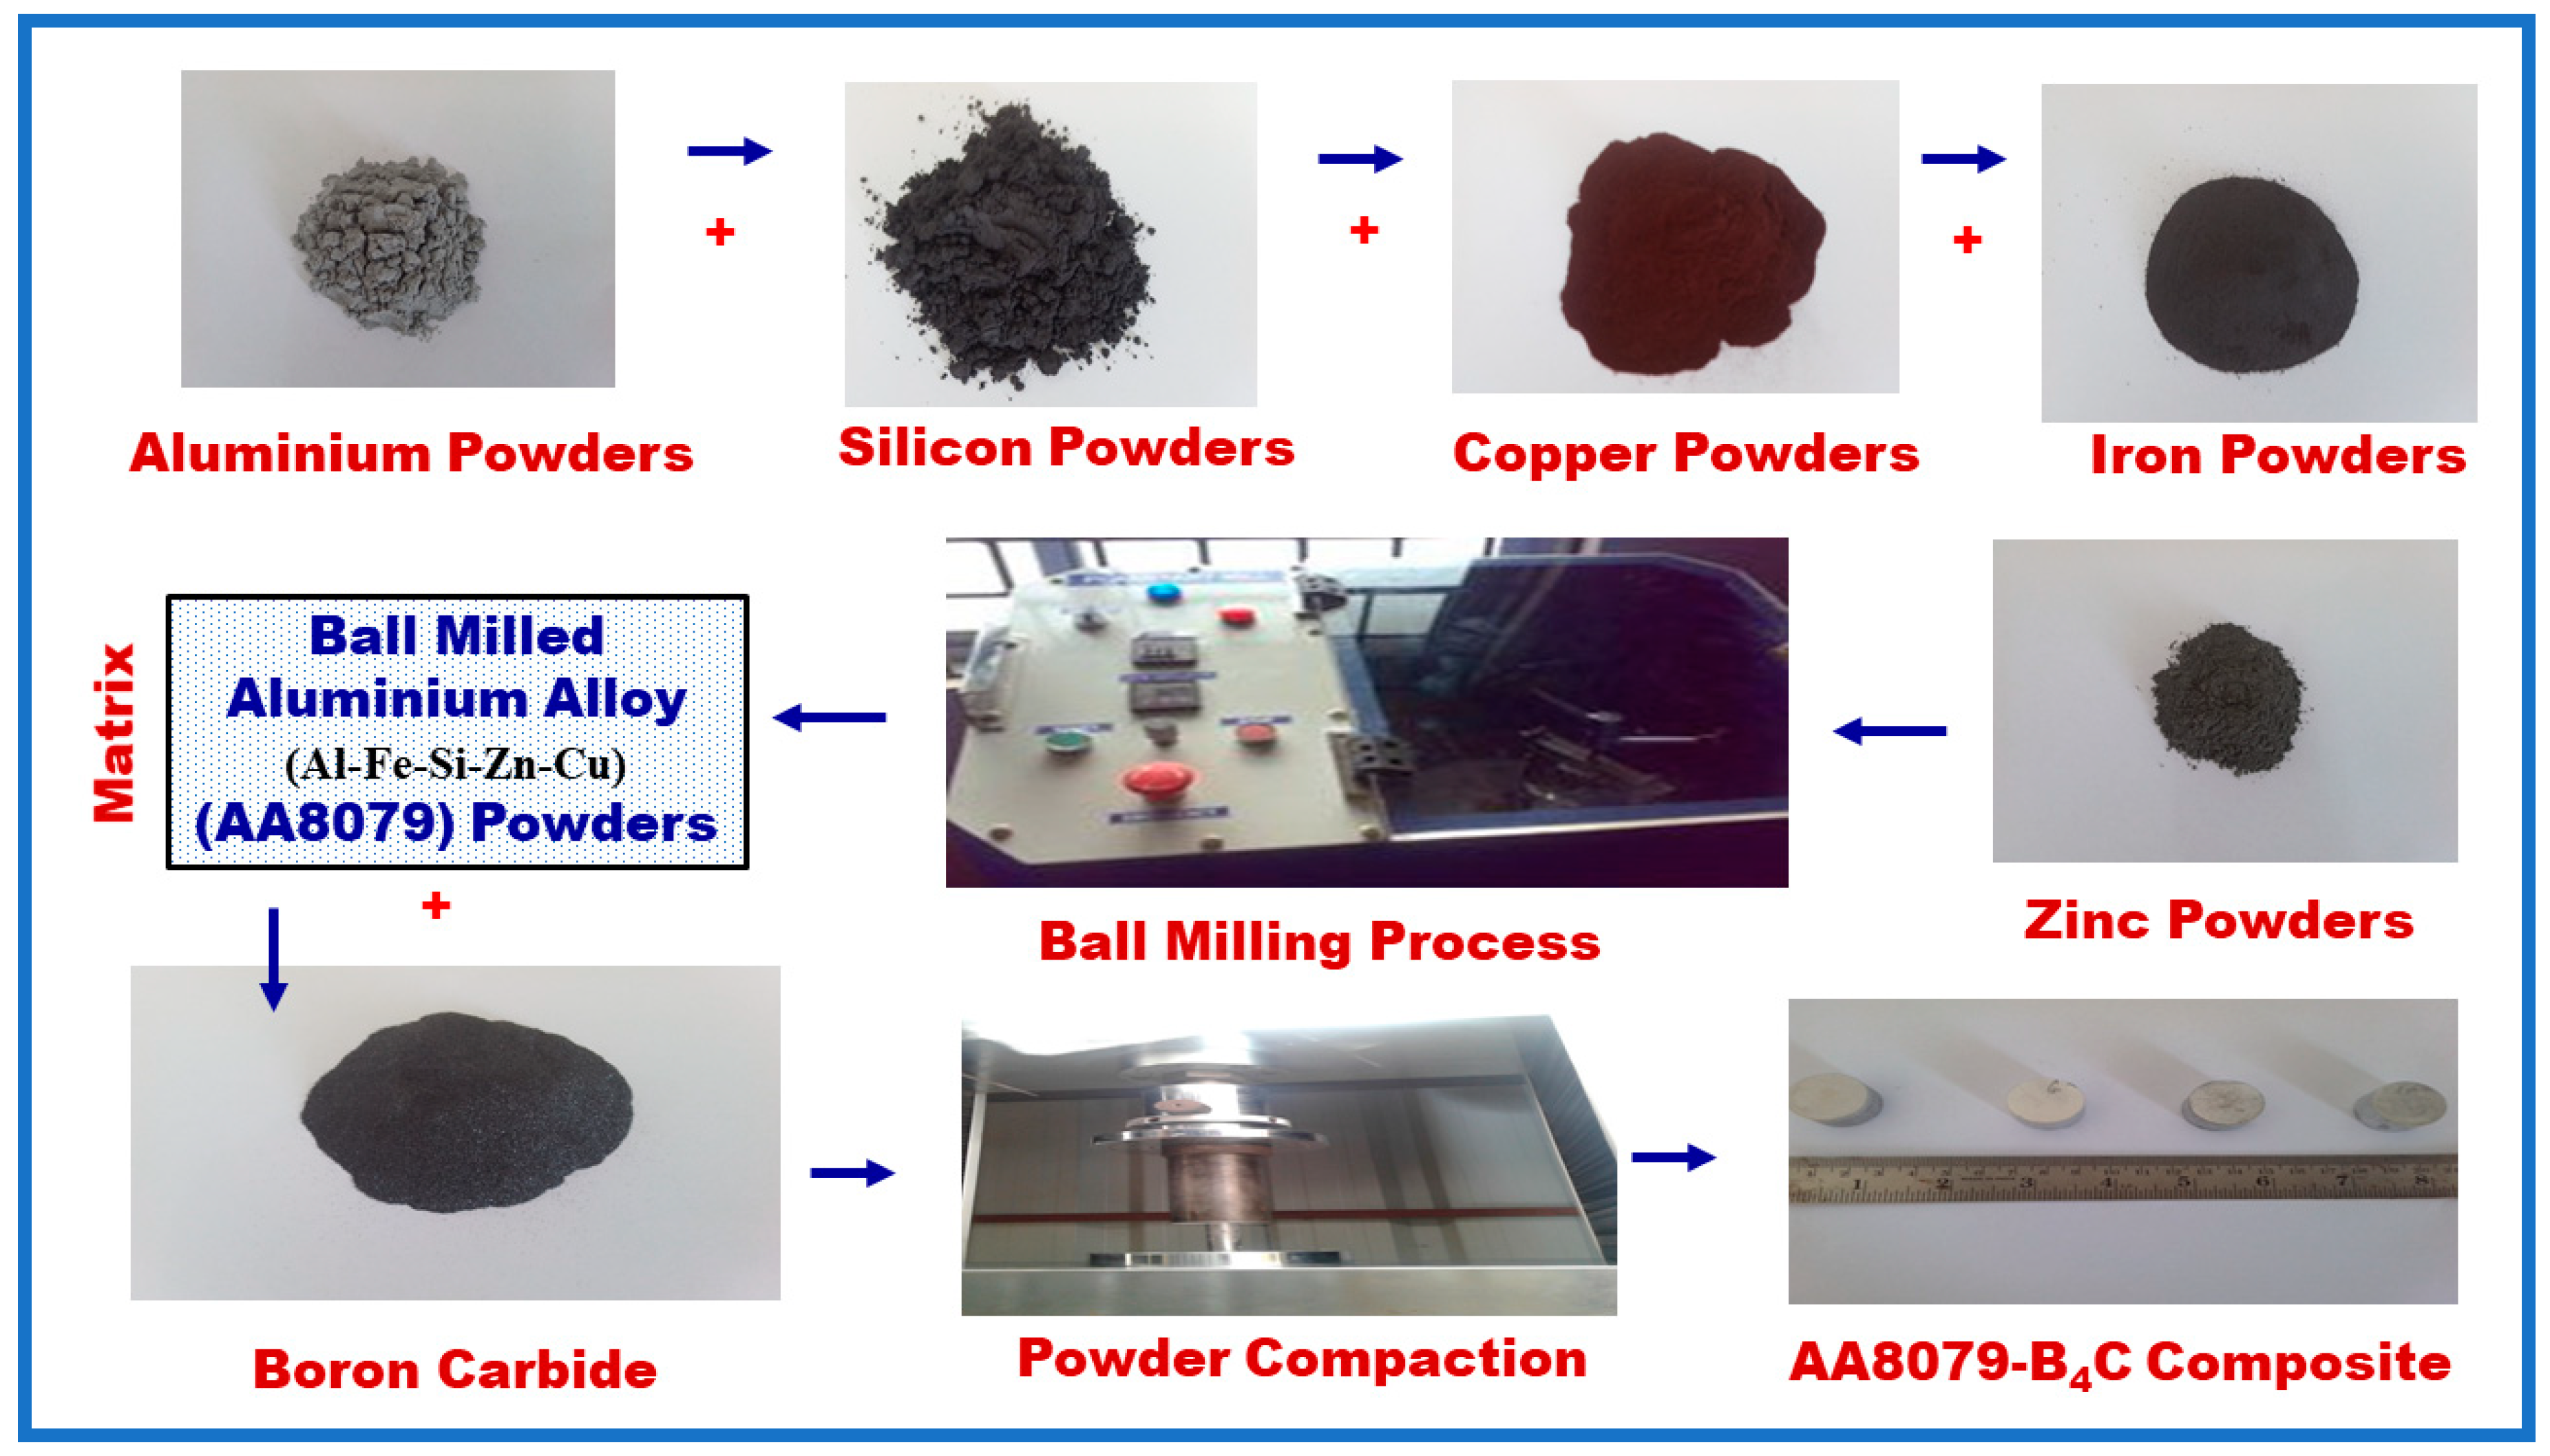
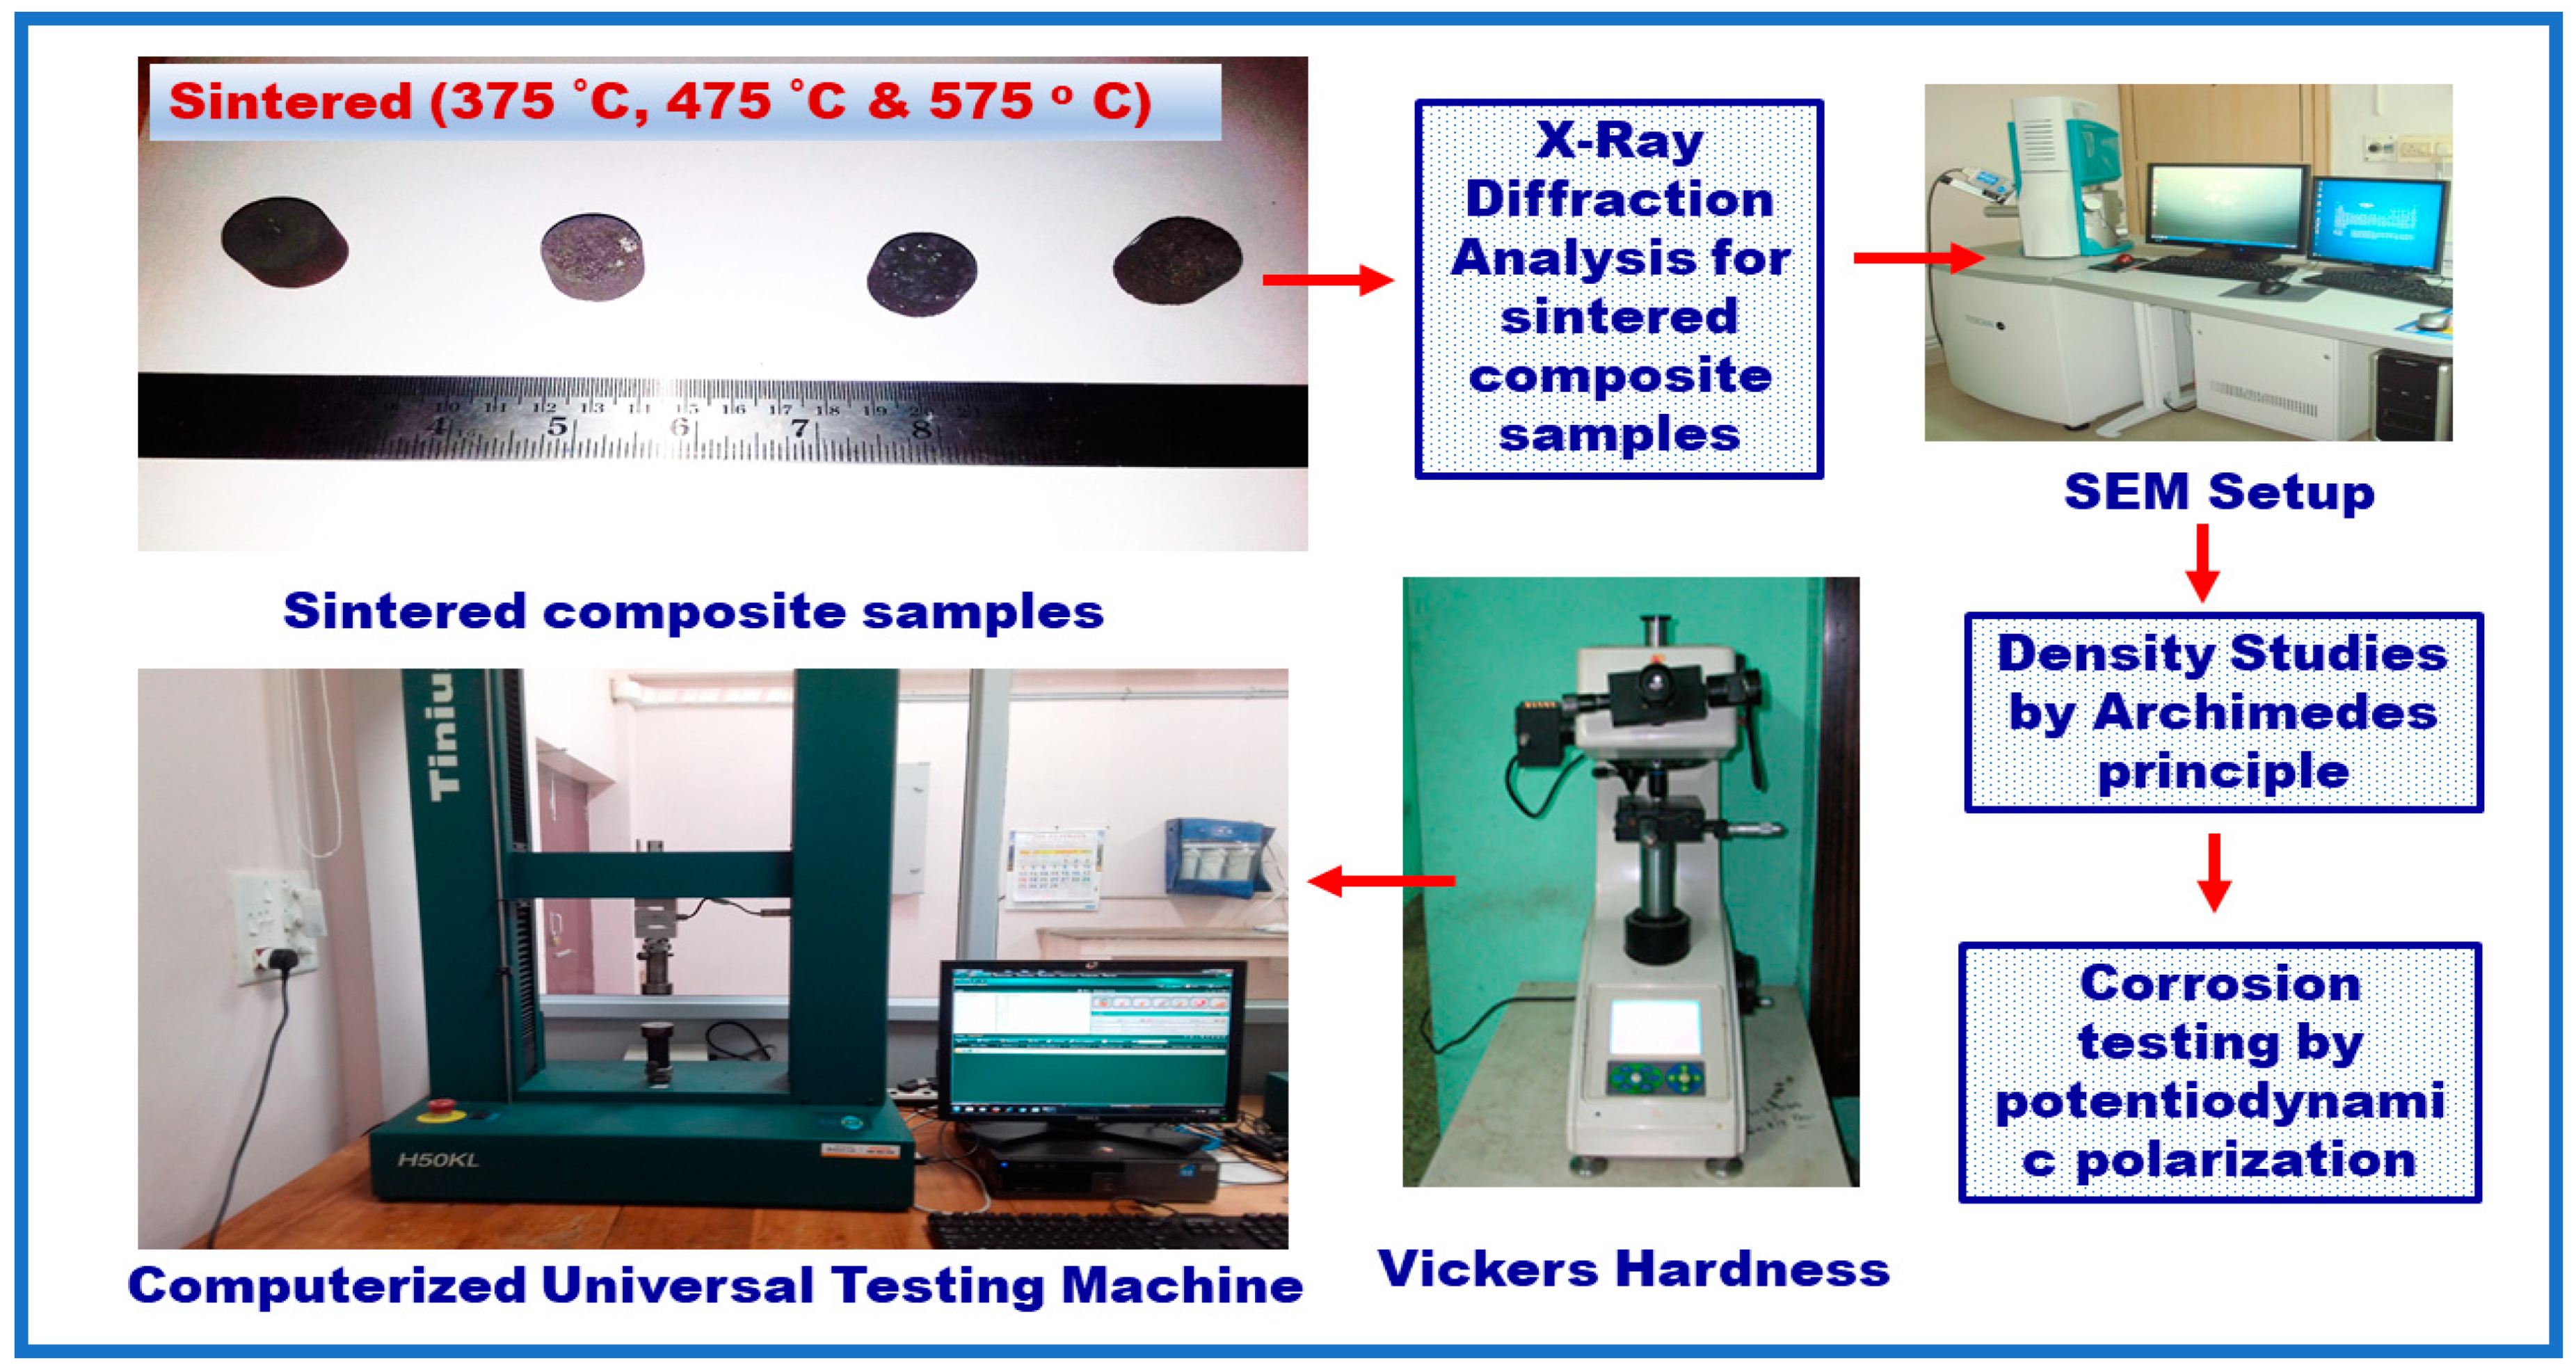
2. Experimental Details

AA8079 was manufactured via mixing the 99.5% elemental powders aluminum (100 μm), copper (10 μm), iron (10 μm), silicon (8 μm), and zinc (10 μm). Boron carbide of size 10 μm was utilized as reinforcement. The aluminum and B4C was purchased from kemphasol, Mumbai, India. The other powders, such as copper, iron, silicon, and zinc were purchased from Lobachemi, Mumbai, India. SEM image of the as procured Al and B4C powders are displayed in Figure 1a,b.
The composite powders were synthesized using high energy ball mill for 10 h (VBCRC Planetary ball mill). The drum speed was 100 rpm. A steel ball with 10 mm diameter was used. The ball to powder ratio was 5:1. To avoid the temperature rising, a cooling process was carried out every 10 min as per [27]. The green compacts were made into billets of dimensions 24 mm diameter and 12 mm height using a computer servo-controlled ball screw driven UTM (Model: M Series). To avoid the friction between the punch and die, zinc stearate was used as lubricant. Figure 2 shows the details of powders and ball milling setup.
Then, the green compacts were sintered at various temperatures of 375 °C, 475 °C, and 575 °C for a period of 1, 2, and 3 h, respectively, using electric muffle furnace (HITECH India) below controlled atmosphere to evade oxidation; the sintered samples were retained in the furnace until it reaches the room temperature [28]. By following the rule of mixture, the sintered density was measured for all the samples by Archimedes principle. Three readings were measured, and their average value was taken [29]. XRD analysis was accompanied on the Al and B4C sintered preforms to study the phase identification using X-ray diffractometer (Broker Eco D 8). The chemical compositional examination was examined via energy dispersive analysis (via EDAX-AMETEK-TSL). Figure 3 shows the details of testing conducted for the composite samples.
The microstructure analysis of sintered composite samples was performed by SEM (ZESIS model). The micro Vickers hardness test was carried out using micro Vickers hardness tester (Model: MV-1 PC), test was carried out at a load of 0.3 kg and a stay time of 10 s, as per ASTM standard E384-08. The compressive test was carried using computer controlled universal testing machine (Tinius Olsen) having a capacity of 50 kN in accordance with ASTM standard E9-89a. Electrochemical measurement was achieved by utilizing Versa STAT MC. Later, for polarization examinations, electrodes were utilized for the electrochemical impedance spectroscopy (EIS) examination deprived of any surface treatment. The AA8079/B4C composite samples with 1.0 cm2 surface area are wide-open to corrosion medium of 3.5% NaCl solutions. The potentio-dynamic current–potential curves were obtained by polarizing the specimen from −0.1 V to +0.1 V on open circuit potential at a scan rate of 0.05 mV/s. EIS measurements was conducted utilizing a small amplitude AC signal of 10 Mv over a frequency of 100 kHz–0.01 Hz [30,31]. The microstructures of samples after compression test were examined utilizing the SEM.

3. Results and Discussions

This section explains the microstructure and characterization studies of sintered composite preforms, and the effect of PM parameters on the density, hardness, CS, corrosion behavior, and the microstructure of the composites after compression test.

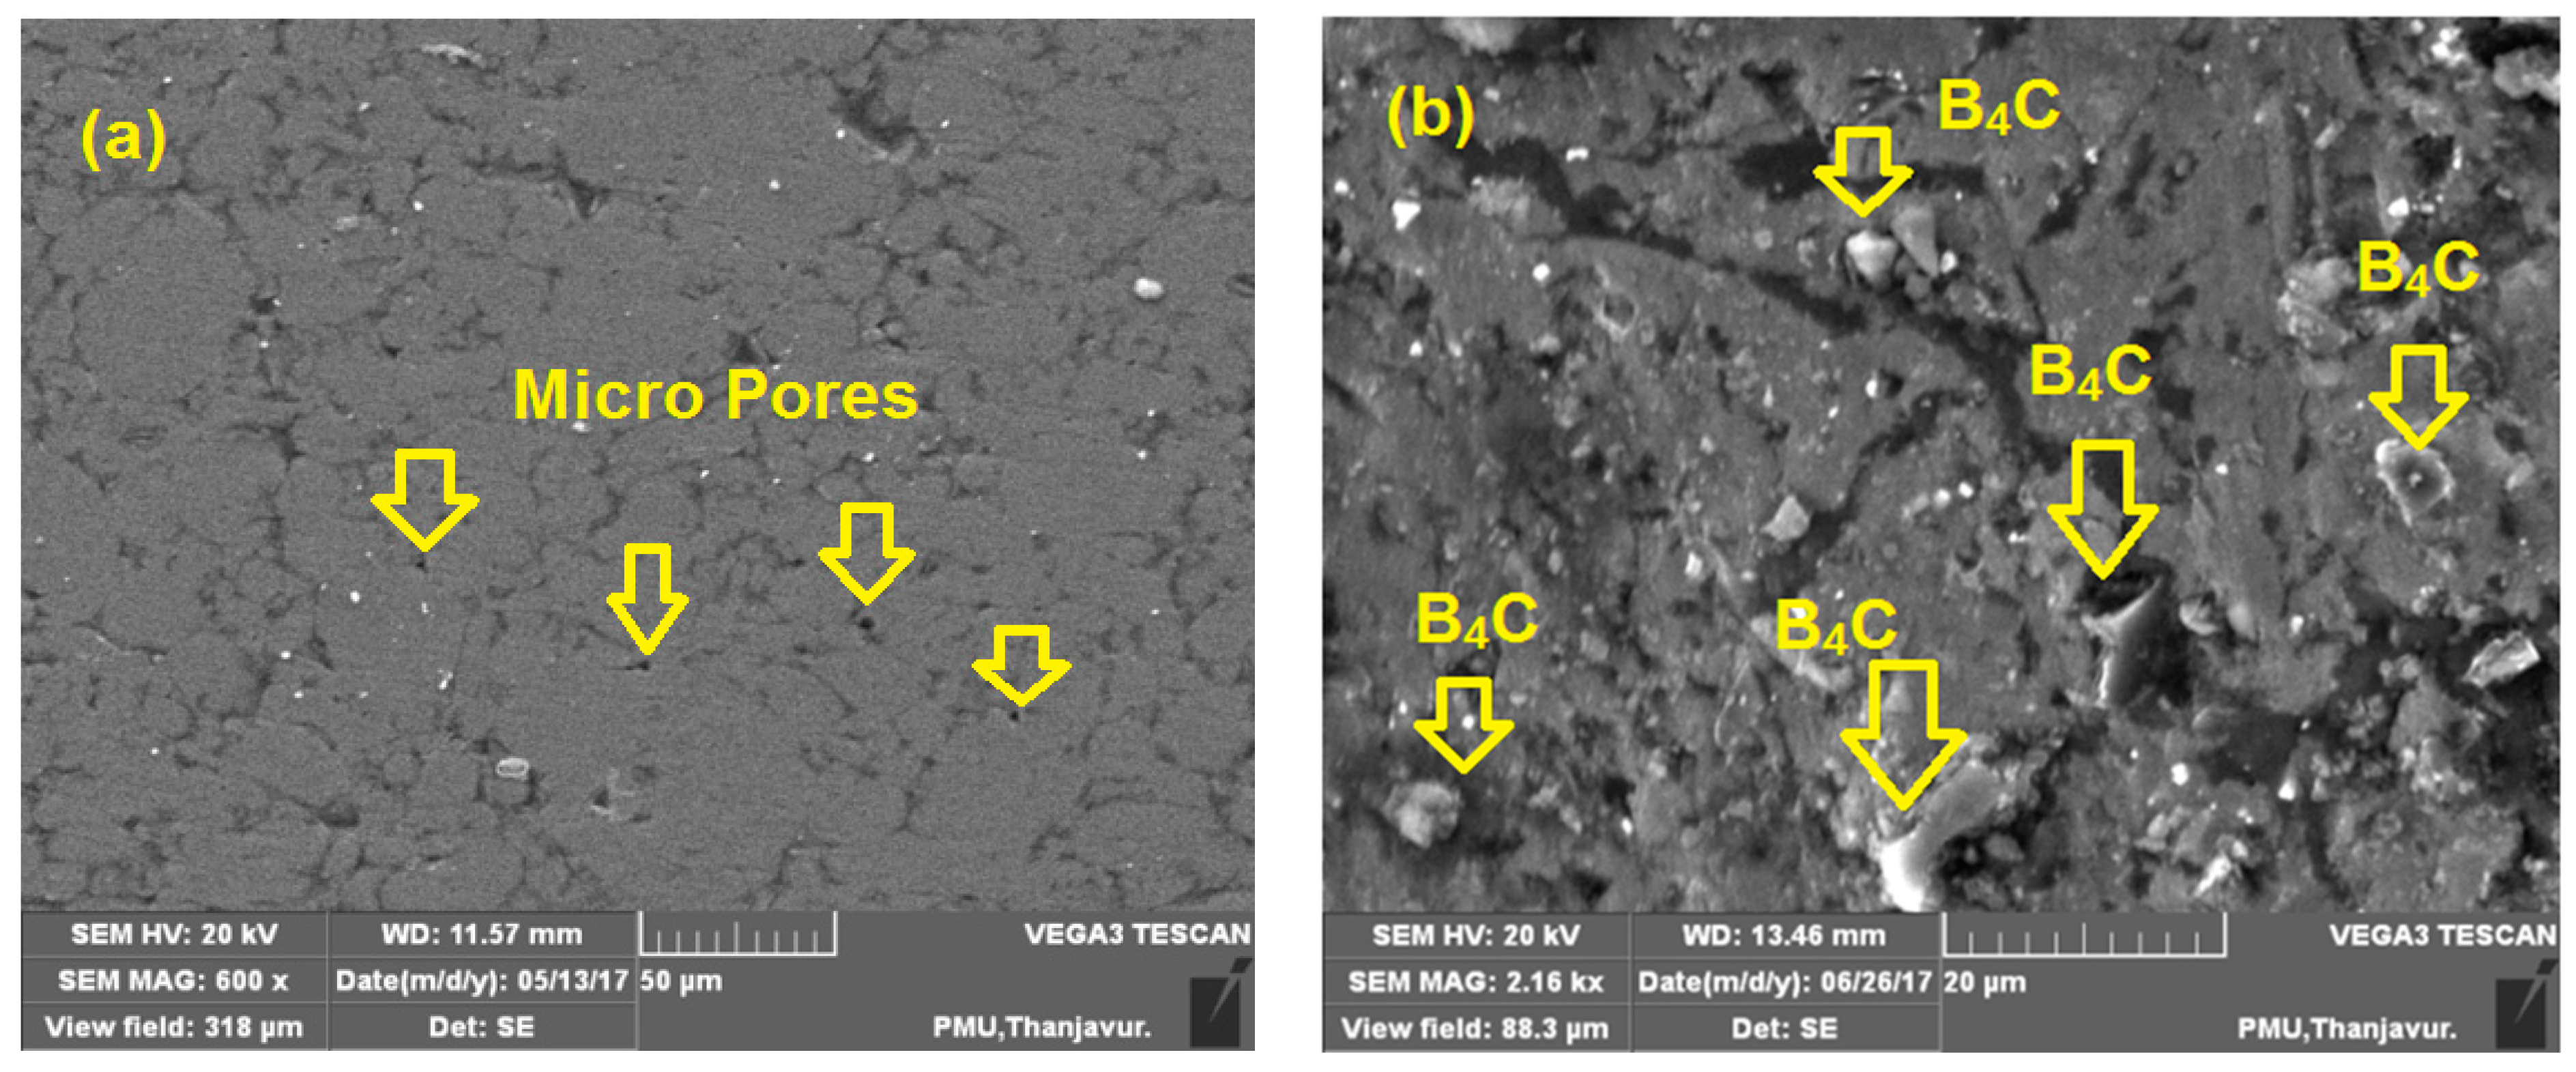
3.1. Characterization Studies on Sintered Preforms

The microstructure analysis of the as-sintered AA8079, AA8079-5 wt.%B4C, AA8079-10 wt.%B4C, and AA8079-15 wt.%B4C composites preforms has been studied using SEM. Figure 4a displays the microstructure of AA8079; it ensures the absence of B4C content, and it can be seen that pores are witnessed for unreinforced AA8079. Furthermore, no pore has been found in the composite preforms, due to occupation of B4C particle in the matrix. Figure 4b displays the SEM micrograph of composite contains 5 wt.% of B4C and the presence of B4C particles are evident.
From Figure 4c, the uniform distribution of B4C particle can be seen, and no pores or crack has been found. Enhanced interfacial connection was attained amid the matrix and B4C particles. Figure 4d displays the SEM image of composite containing 15 wt.% of B4C, and from the image no agglomeration of particles was observed.
Some researchers reported agglomeration issues for the inclusion of 10 wt.% of B4C in Al matrix. However, in this work, we overcome that problem by selecting the suitable ball milling parameters [32,33,34]. Due to higher pressure amid the compaction, a dense microstructure was acquired which was supportive in material strength enhancement, with fine distribution of reinforcement with matrix. Particles were combined and filled closely with matrix which enhanced the mechanical properties. The separation of B4C with matrix is also of note. The SEM revealed the occurrence of the distributed phase, which is the B4C is dispersed evenly in the matrix.
The EDAX analysis of the sintered composites preforms are displayed in Figure 5. Figure 5a displays the occurrence of Al peaks with high intensity, and Cu, Fe, Si, and Zn peaks with very low intensities. Figure 5b–d displays the existence of Al peaks with great intensity, and B, C, Cu, Fe, Si, and Zn peaks were also observed for composite samples. The results show that elemental and reinforcement particles were homogenously dispersed with the aluminum matrix due to the proper milling, compaction, and sintering process. From this analysis it is obvious that the occurrence of respective elements of alloy and composite samples is evident. It is clear that 5 to 15 wt.% of B4C was predicted with fine dispersal with matrix.
Figure 6 noticeably shows the XRD patterns of preforms sintered at 575 °C. Amid the various compounds identified, aluminum influenced the strongest peak, and it ensures the Al is the major content in this material. The occurrence of B4C peaks reveals the occurrence of B4C in (110), (104), (021), (211), and (205) planes. The intensity of B4C peaks enhances with the raise in weight percentage of B4C in the composites. XRD results confirm the occurrence of aluminum in the major peak, and the occurrence of B4C, exposed by small peak, and it ensures the respective weight percentage of the composites. Furthermore, it has been confirmed that no intermetallic compounds were formed during the sintering process as reported by the previous researchers [35,36]. Peaks for Fe, Si, Zn, and Cu interrelated to the AA8079 were not witnessed due to the development of a solid solution.

3.2. Effect of PM Parameters on Density

The influence of compaction pressure (CP), sintering temperature (S.Temp) and sintering time (ST) on the density are provided in Figure 7a–c. Table 1 provides the effect of PM parameters on density. Figure 7a shows the density of AA8079-5 wt.%B4C composites with respect to CP, S.Temp, and ST. The increase in CP, S.Temp, and ST increases the density of the AA8079-5 wt.%B4C composites. For AA8079-5 wt.%B4C composites, maximum density of 2.96 g/cm3 was attained at CP of 500 MPa, S.Temp of 575 °C, and ST of 3 h. Densification is proportional to CP, S.Temp, and ST. The rate of dispersal enhances, while increase in S.Temp offers good densification at high temperature.
Figure 7b shows the density for the AA8079-10 wt.%B4C composites. The increase in CP, S.Temp, and ST increases the density of the AA8079-10 wt.%B4C composites. For AA8079-10 wt.%B4C composites, maximum density of 3.25 g/cm3 was obtained at CP of 500 MPa, S.Temp of 575 °C, ST of (1, 2, and 3 h). Enhancement in ST offers much time for pore closure in the matrix; henceforth, densification is perceived to rise with the rise in ST. At 575 °C, the density enhances due to a decrease in pores. Amid the sintering process, reduction in the samples occurs, despite the volume of diffusion of atoms from the grain boundary sources to the voids, which results in density enhancement.
Figure 7c shows the density for the AA8079-15 wt.%B4C composites. The increase in CP, S.Temp, and ST increases the density of the AA8079-15 wt.%B4C composites. For AA8079-15 wt.%B4C composites, maximum density of 3.45 g/cm3 was obtained at CP of 500 MPa, S.Temp of 575 °C, and ST of 3 h. It could be understood that an increase in CP, S.Temp, and ST enhances the density of the AA8079-B4C composites. This is due to the fact that diffusion of particles and decrease in porosity occurred; it results in improved density as reported by Patel et al. [27]. Generally, the current investigation stated that to fabricate AA8079-B4C composites at a maximum density, the specimen would be compacted to 500 MPa and sintered at 575 °C temperature for 3 h.

3.3. Effect of PM Parameters on Micro Vickers Hardness

Figure 8a–c displays the influence of PM parameters on the hardness of AA8079-B4C composites with respect to CP, S.Temp, and ST. Table 2 provides the effect of PM parameters on micro hardness. The maximum hardness is witnessed for the specimens compacted at 500 MPa, and sintered at 575 °C for 3 h. From Figure 8a–c, the hardness of specimens improves whereas enhancing the CP from 300 MPa to 500 MPa, S.Temp from 375 °C to 575 °C, and ST from 1 h to 3 h. At CP greater than 500 MPa, the applied loads force the particles to transfer, blending with one another and blocking the voids, henceforth attaining maximum hardness for AA8079-B4C composites. Increasing the CP, S.Temp, and ST results in hardness enhancement due to maximum densification. When the PM process parameters increased, pores and voids present in the samples were completely occupied by the B4C particles. This could be one of the reasons for hardness increment.
The applied load results in particle deformation; however, alterations in particle size and shape improve the hardness. The hardness upsurges while enhancing the CP, S.Temp, and ST. It is obvious that when the CP, S.Temp, and ST increase, the hardness of the composites enhances due to particle-to-particle appropriate bonding. Furthermore, B4C is the third hardest material, due to the fact that the hardness of the composites increased gradually. These outcomes are all around concurred with the earlier findings of different researchers [7,8,37,38]. When the samples prepared at maximum PM process parameters at that time grain refinement and proper dispersal of B4C with AA8079 occurred, it resulted in maximum hardness enhancement. At maximum sintering temperature, particle-to-particle binding takes place, forming a better bond by the diffusion of atoms in a solid-state bonding method. Improved ductility, dispersion strengthening mechanism, and refinement of grain size result in enhanced hardness [39,40,41].

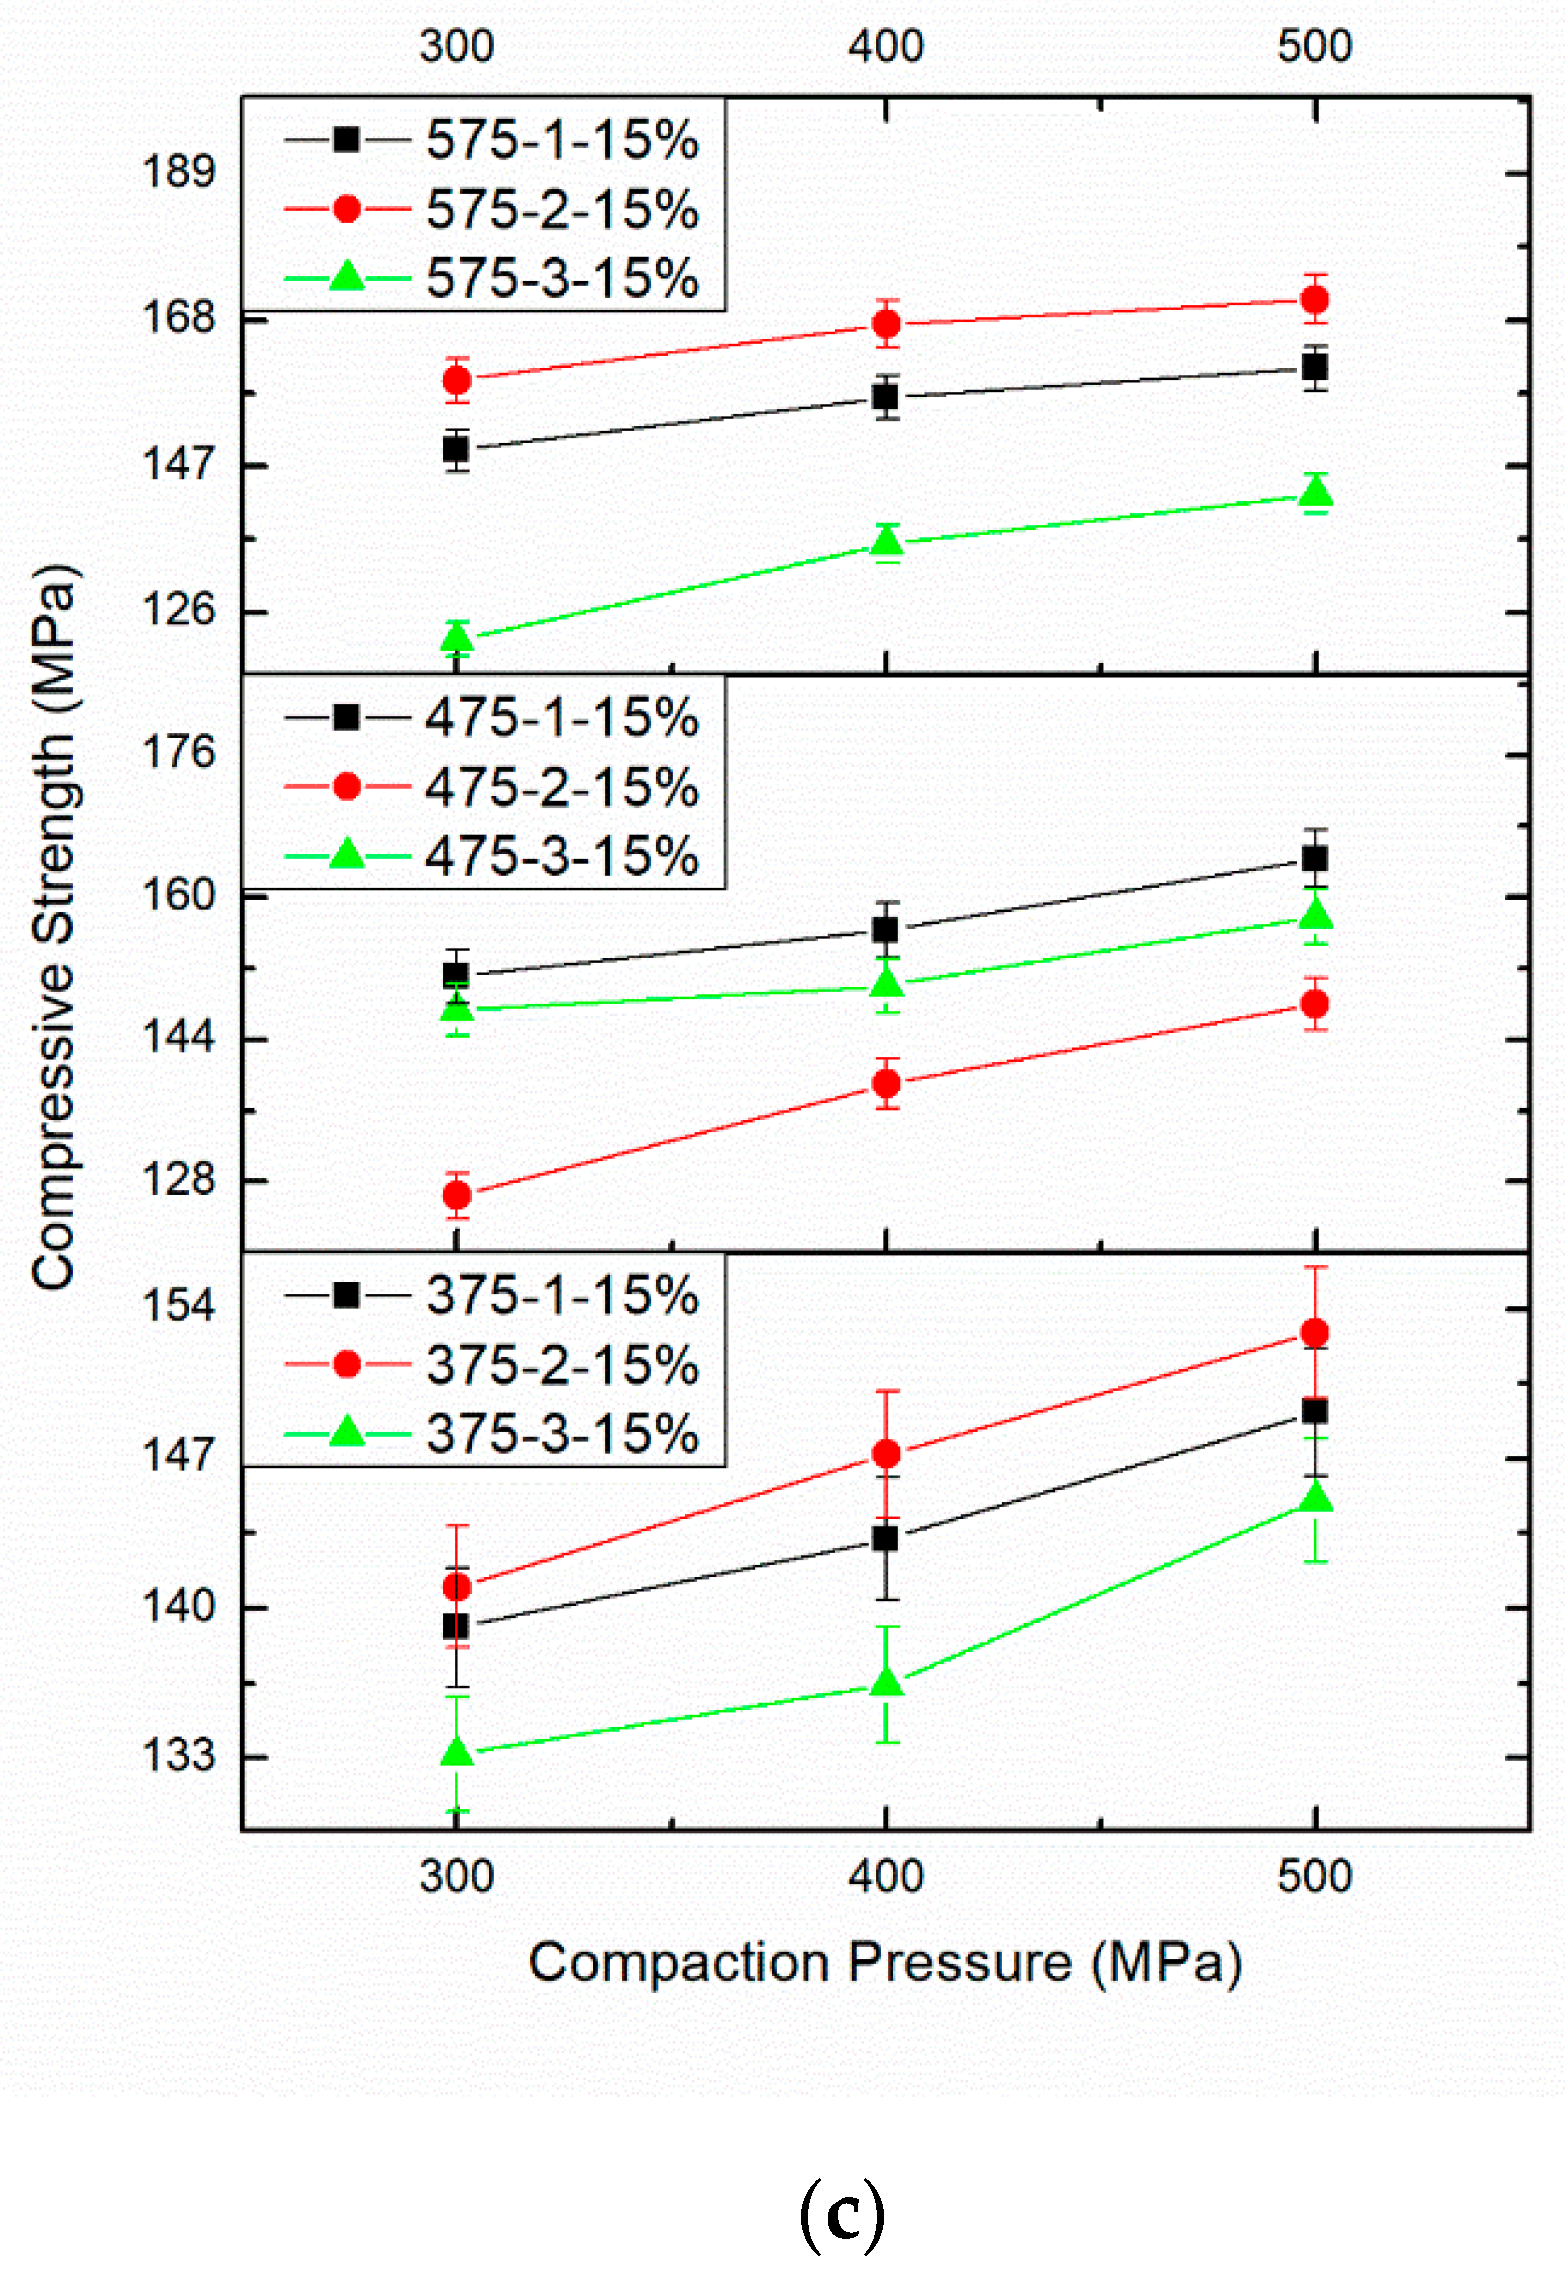
3.4. Effect of PM Parameters on Compressive Strength

Figure 9a–c displays the influence of PM parameters on the compressive strength of AA8079-B4C composites with respect to CP, S.Temp, and ST. Table 3 provides the effect of PM parameters on compressive strength. The maximum compressive strength is perceived for the specimens compacted at 500 MPa, sintered at 575 °C for 3 h. From Figure 9a–c, the compressive strength of specimens improves, enhancing the CP from 300 MPa to 500 MPa, the S.Temp from 375 °C to 575 °C, and the ST from 1 h to 3 h. From this, it is observed that the rise in S.Temp and ST increases the compressive strength. It is understood that the upsurge in CP, S.Temp, and ST enhances the compressive strength. This could be elucidated through the way that a rise in CP, S.Temp, and ST improves the heat treatment method by which appropriate holding and dissemination of particles is accomplished [42,43,44,45,46].
Additionally, the compressive strength of the composites totally relies upon the PM parameters, which create the enhancement in properties conceivable. As indicated by this examination, the most elevated compressive strength was noticed for the specimen compacted at 500 MPa, and sintered at 575 °C for 3 h. The enhancement in the compressive strength may be accredited to the shifting of load from matrix to the hard reinforcement [47,48]. The increasing strength of these composites as the B4C wt.% rises could be ascribed to the dispersal strengthening effect [49]. The maximum plastic deformation and strain hardening acquaint with powder amid compaction at maximum pressure to produce good results, leading to maximum compressive strength. The enhancement in loading resistance enhances the compressive strength [50]. Higher plastic deformation and strain hardening introduced in the powder during compaction at higher pressures yield better results and contributed to higher compression strength [51].

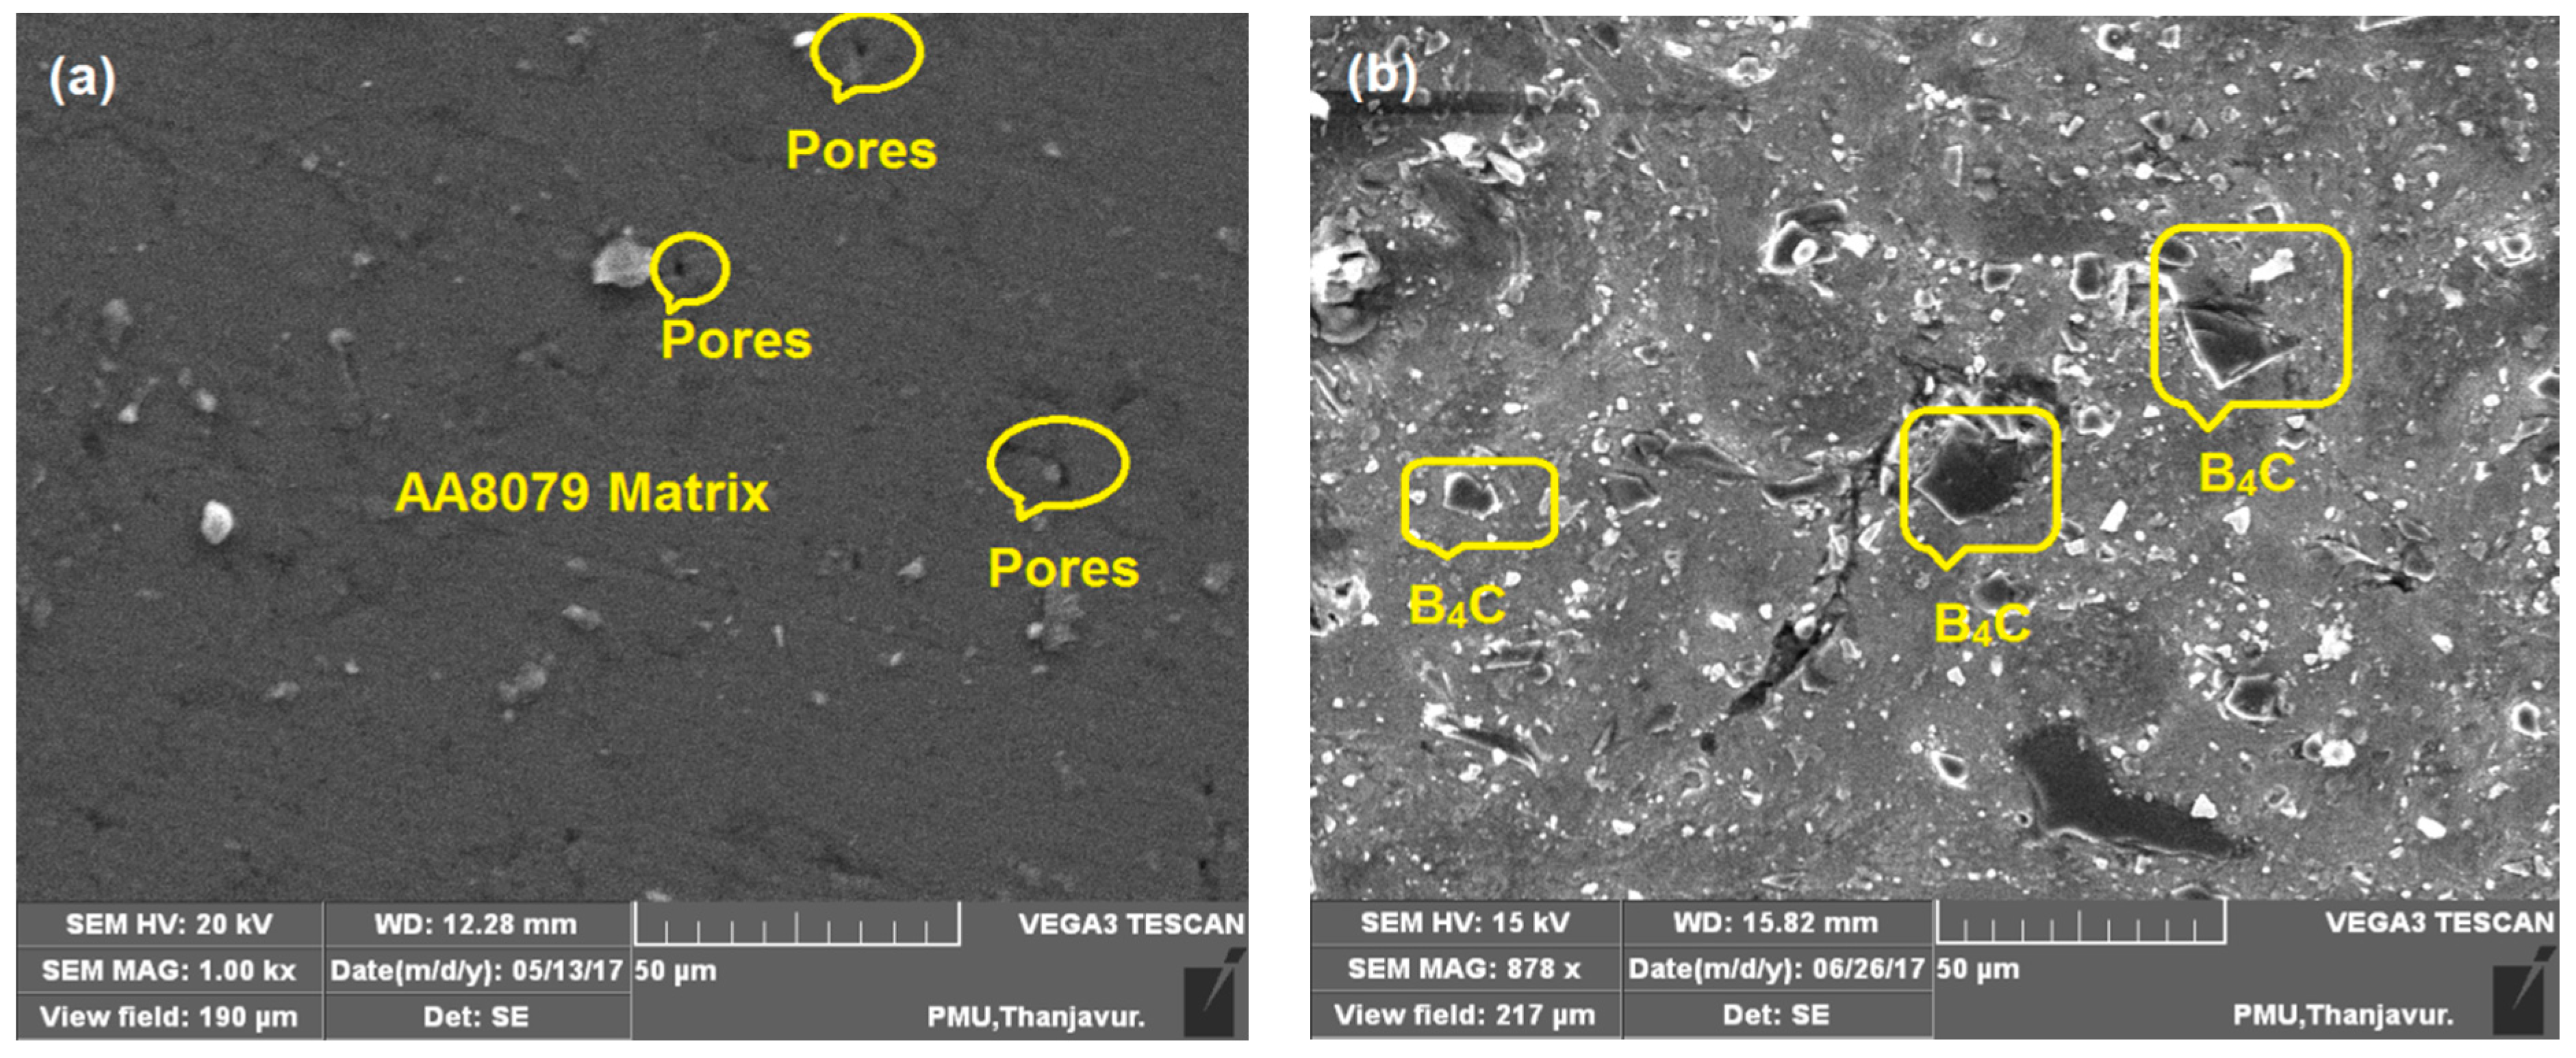
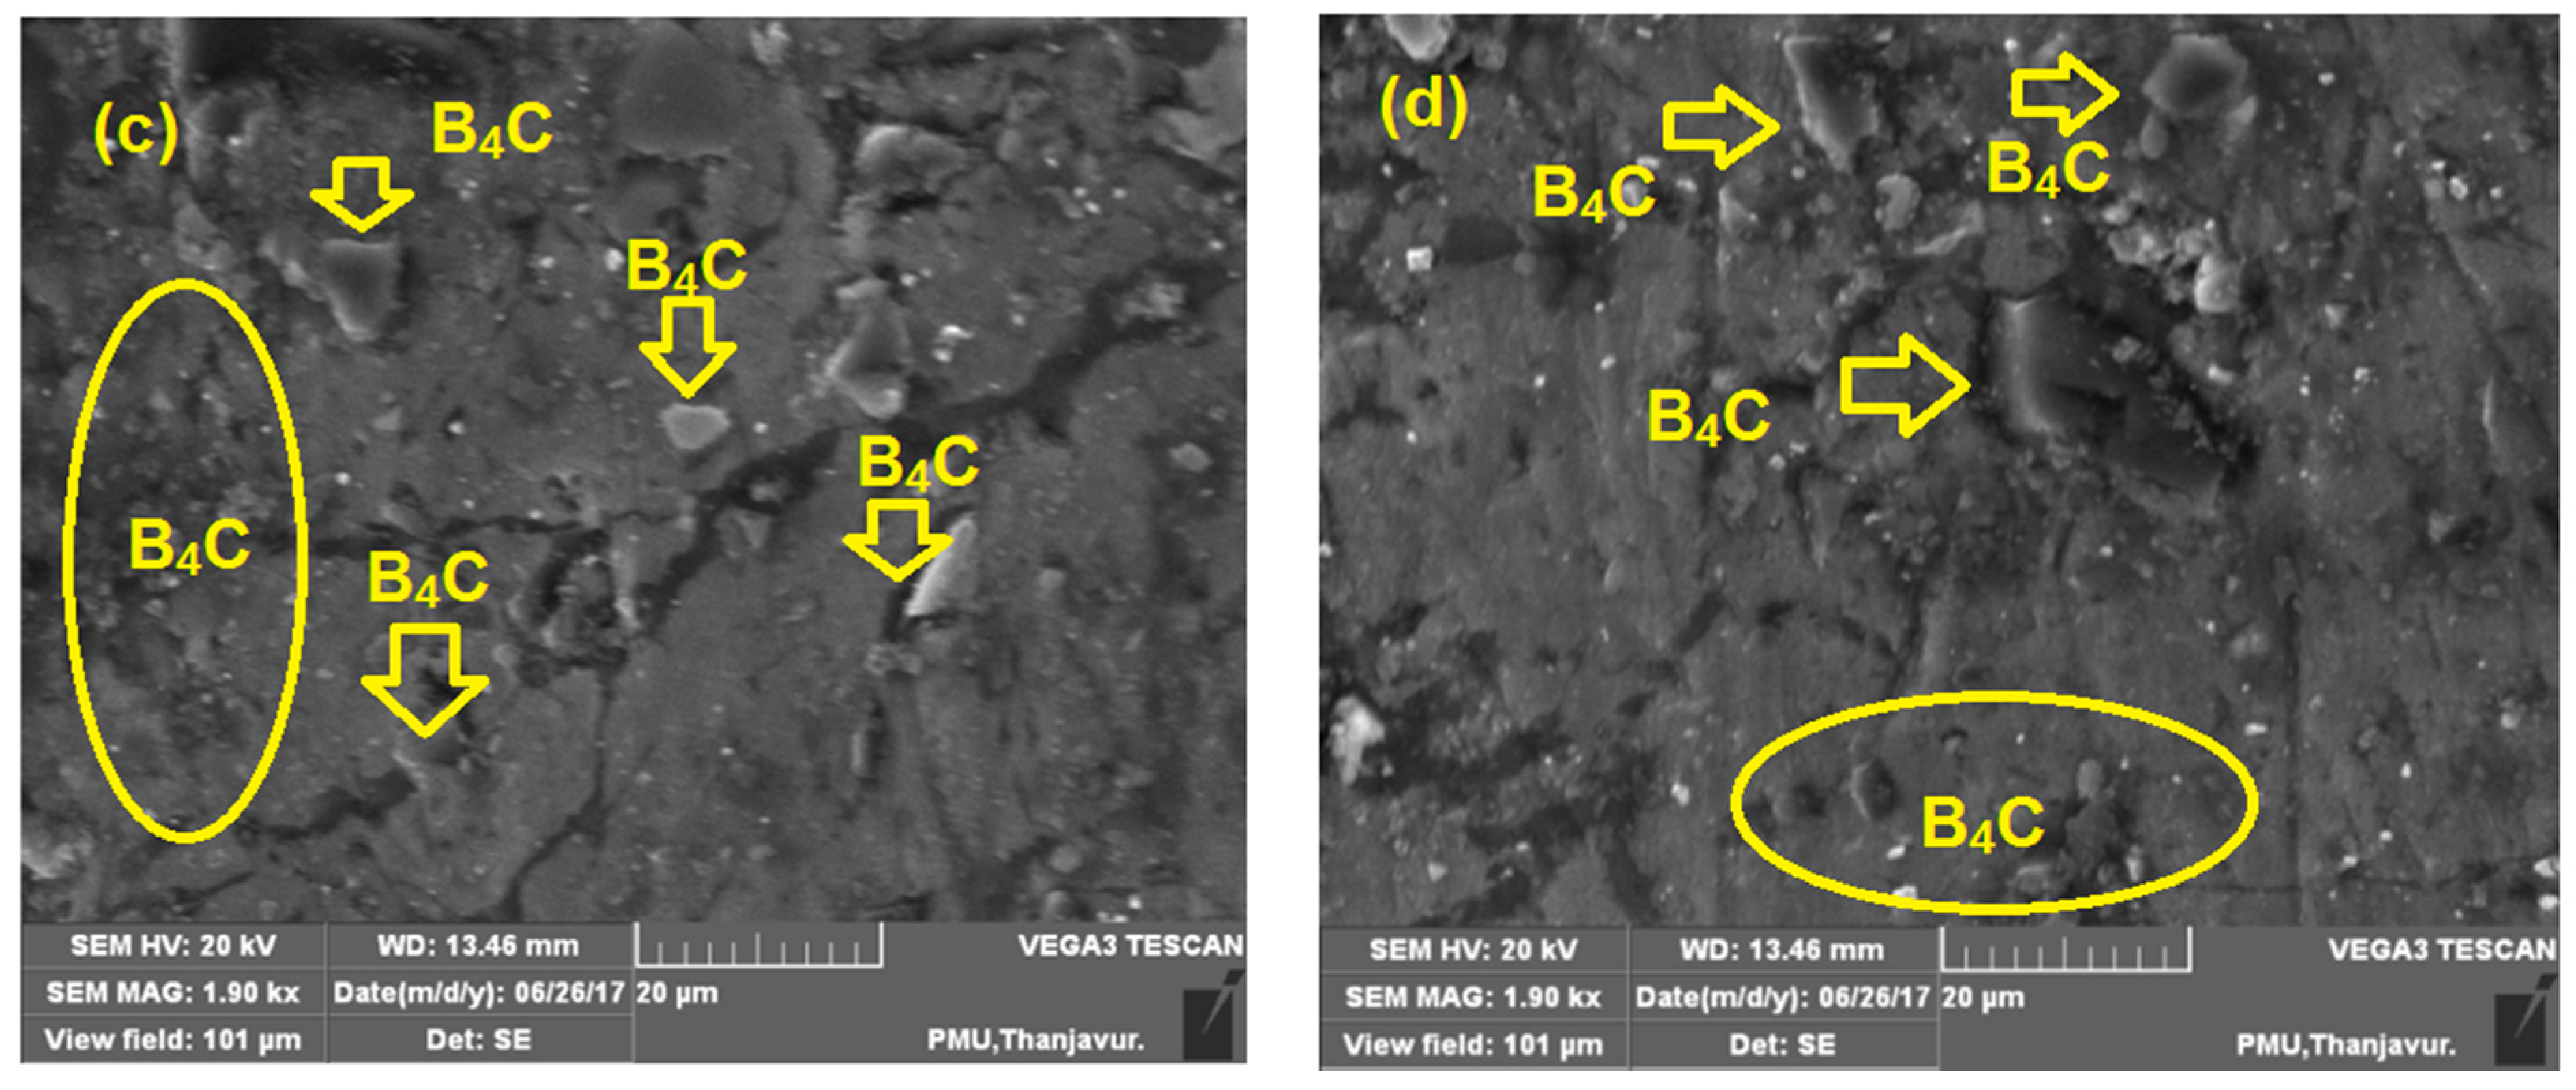
3.5. Microstructure Analysis of Specimens after Compression Test

The microstructure of the preforms after the compression test are shown in Figure 10a–d. The observable large pore sizes in sintered samples are reduced in the AA8079 matrix after compression testing. During the compression test the compressive load improved the microstructure of the produced powder metallurgy materials. Furthermore, no pores were found in the composite samples. After the compression test, grain boundaries are elongated due to deformation of the samples, and the hard ceramic particles are finely covered by the matrix materials due to deformation. Figure 10b,c displays the homogenous distribution of B4C particle into the matrix alloy. It is clear from the SEM images in Figure 10b–d that virtuous interfacial bond occurs amid the AA8079 and boron carbide. Due to the appropriate compressive force applied over the samples, the particles are distributed evenly within the matrix. Furthermore, it is witnessed that B4C particles are reoriented in the way of metal flow during compression process.

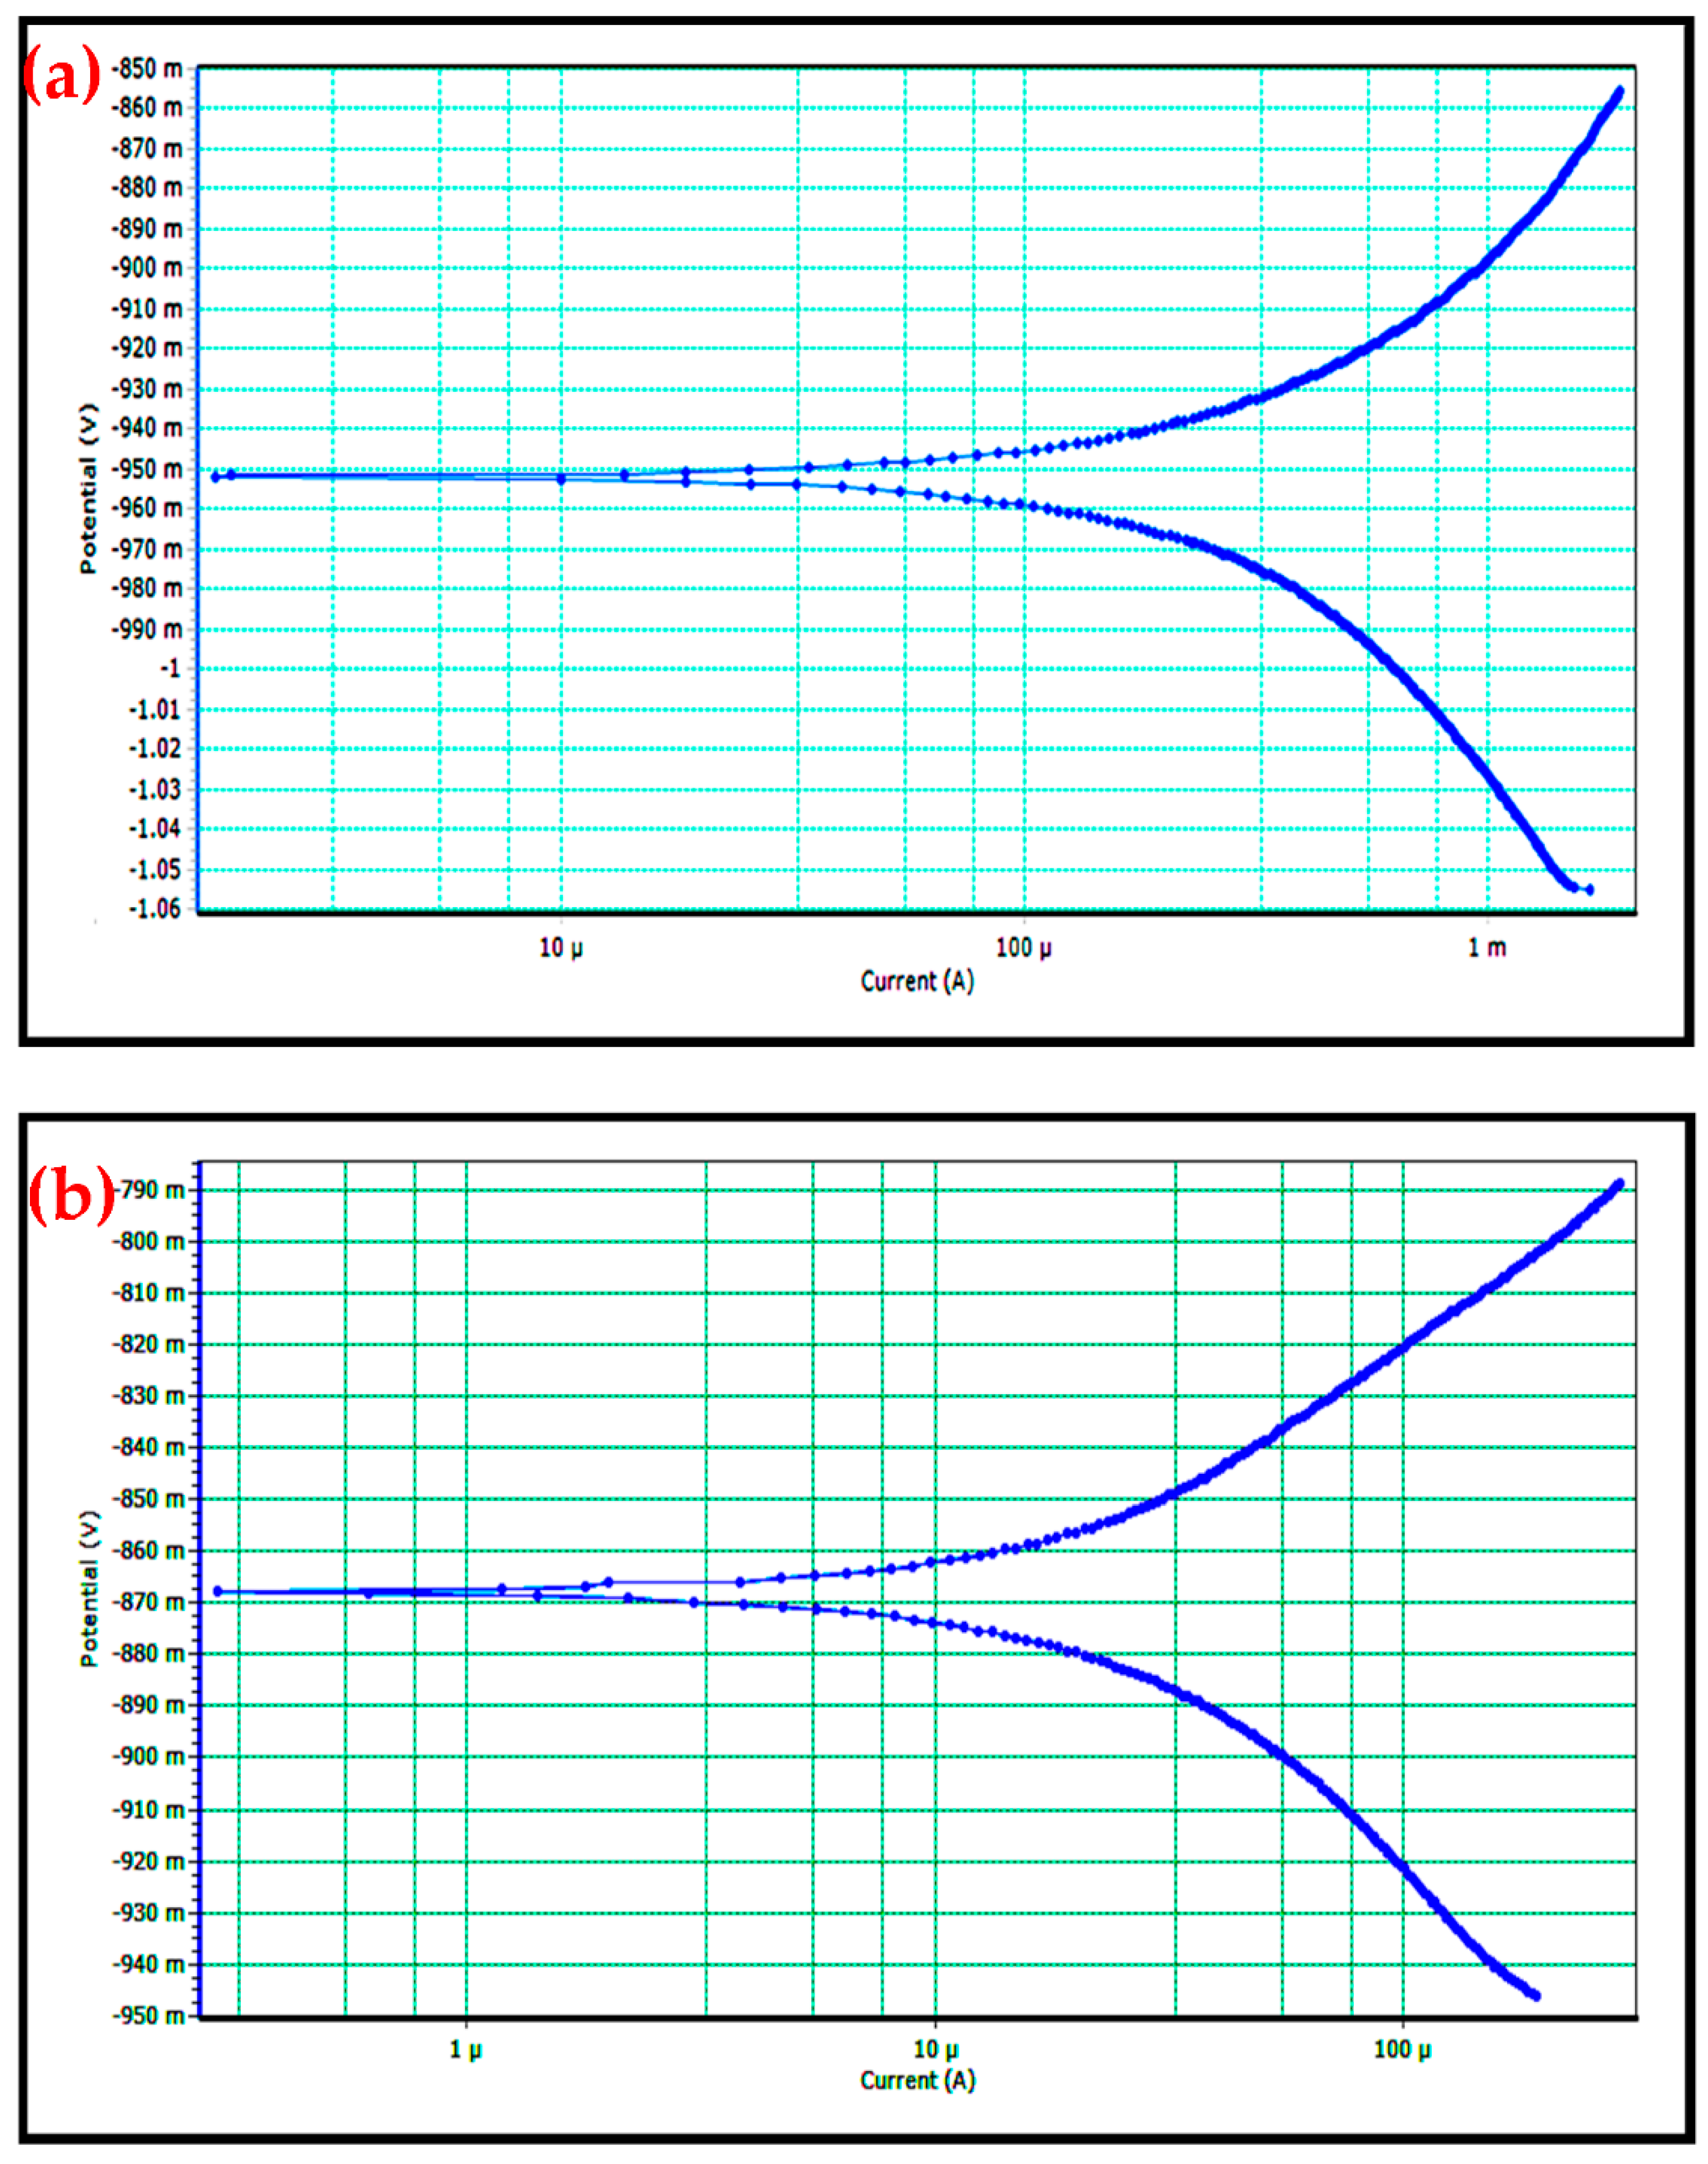
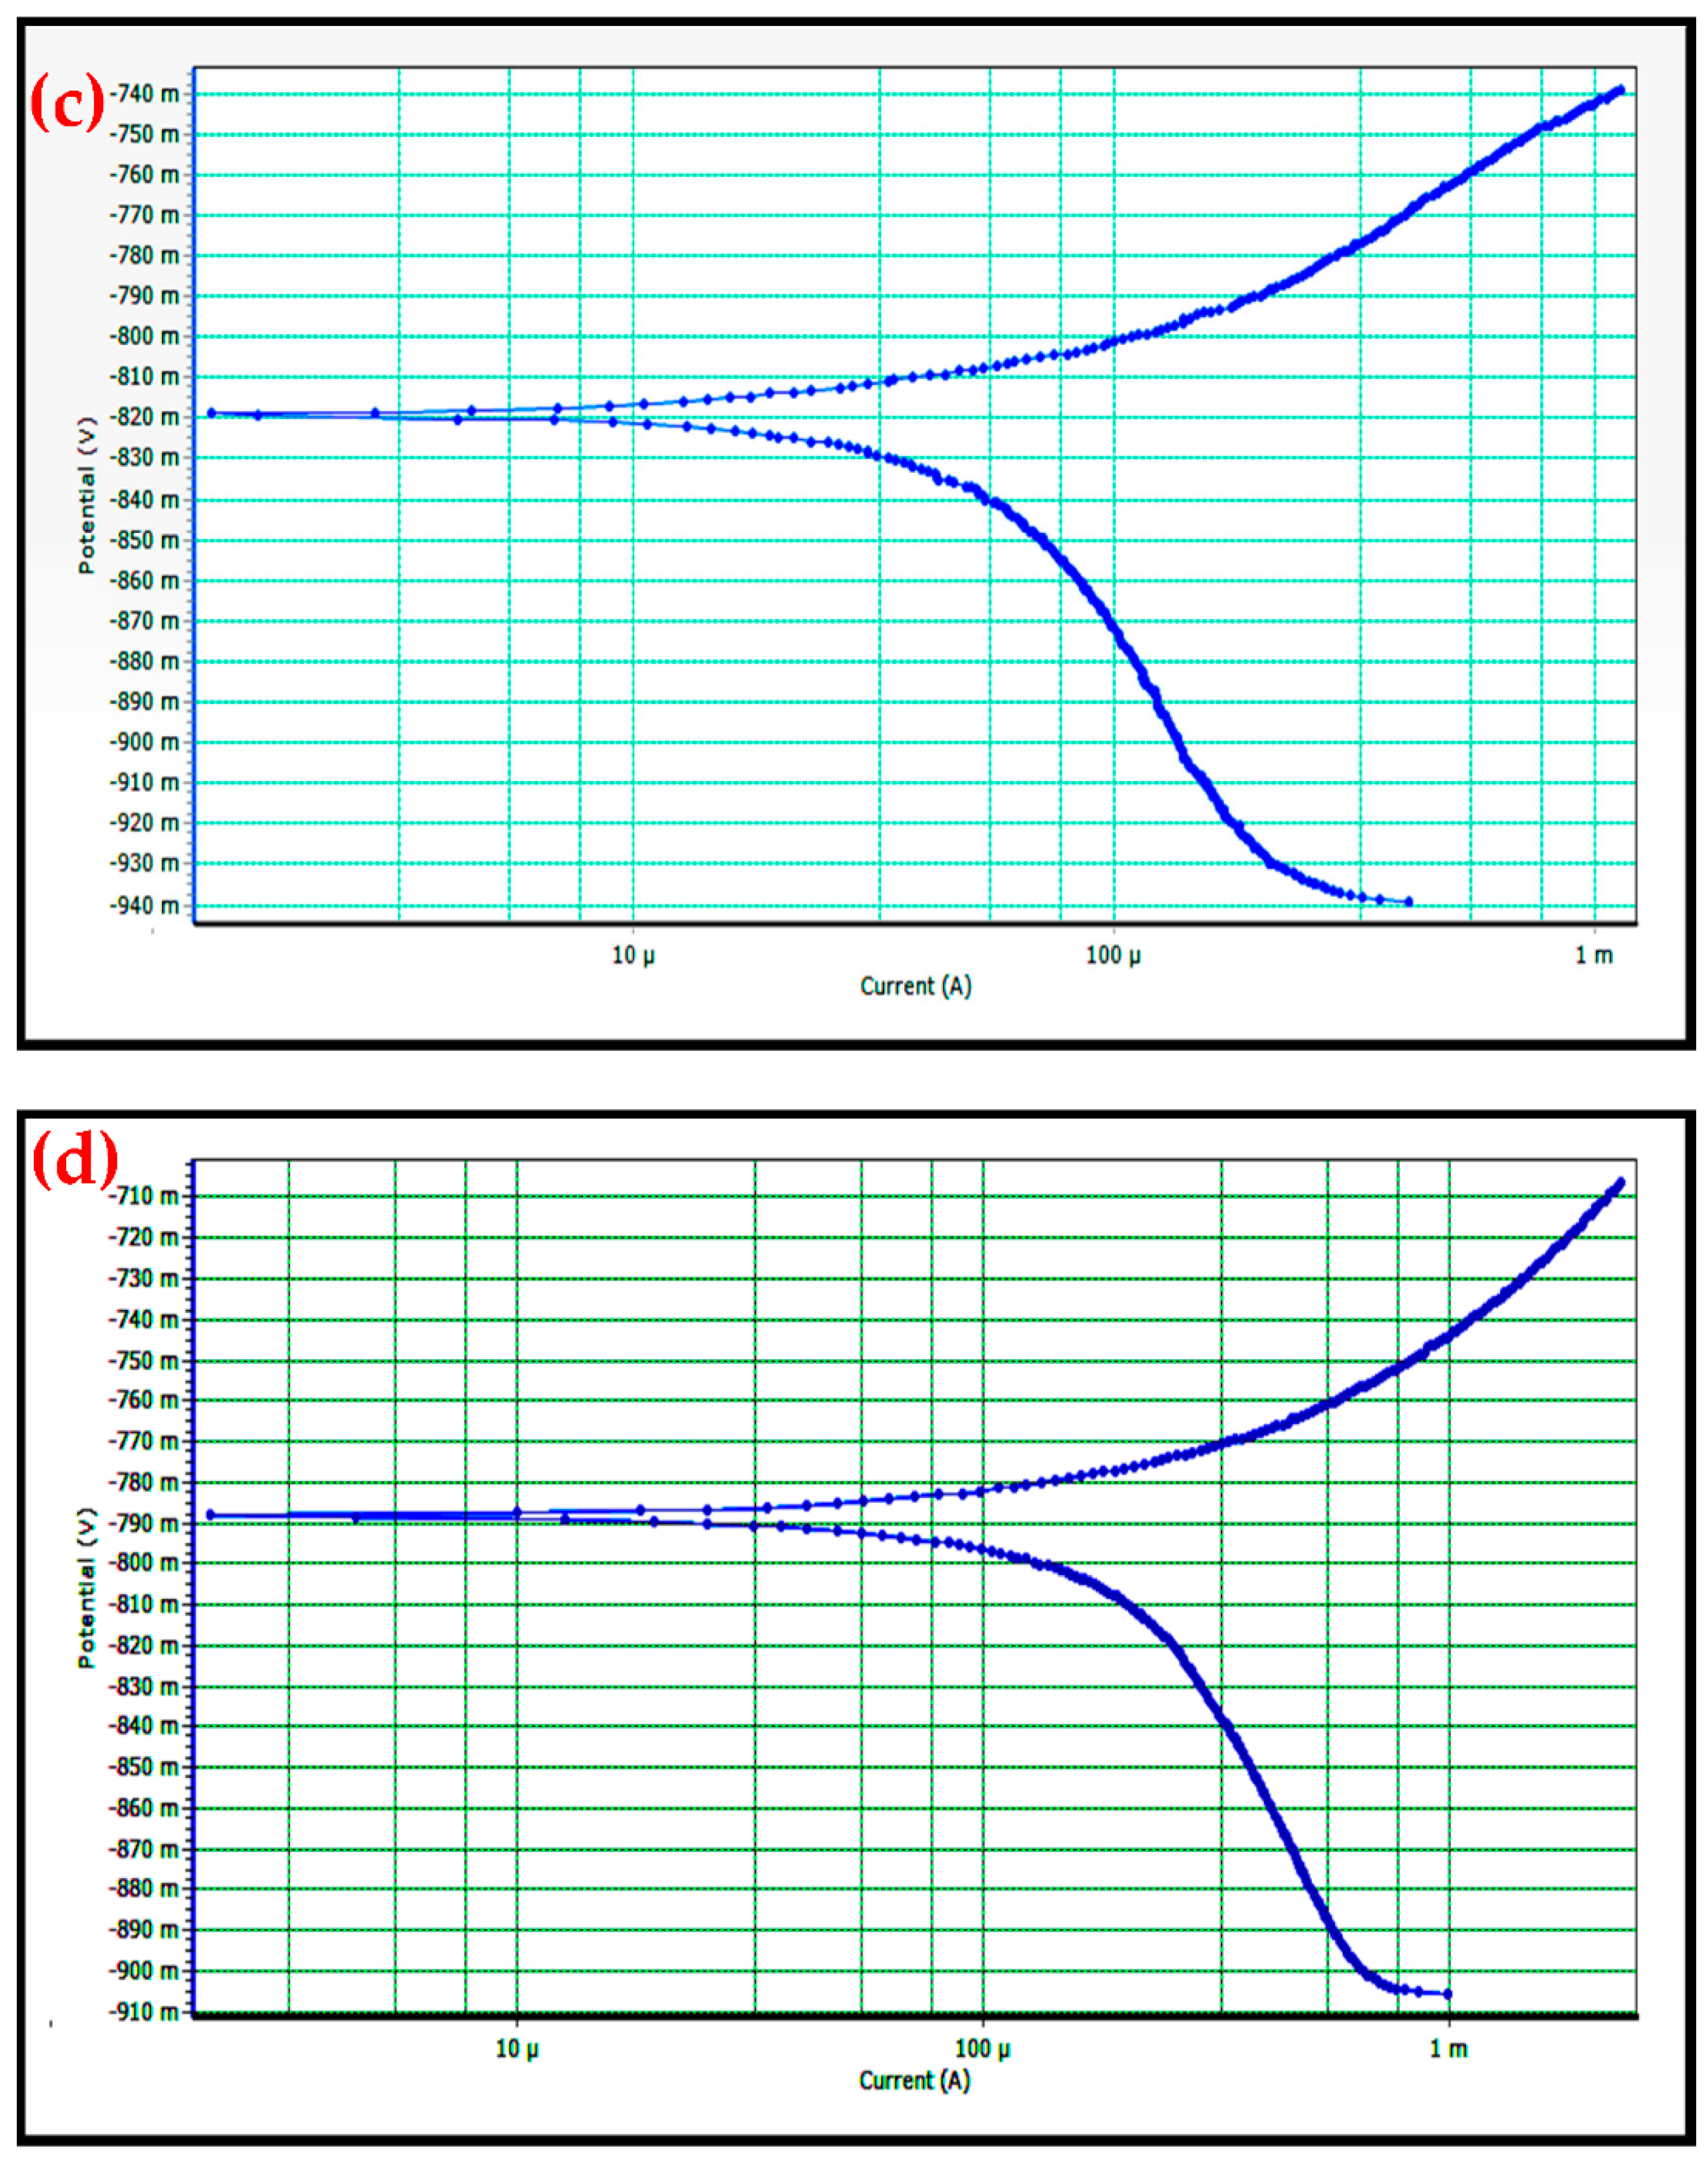
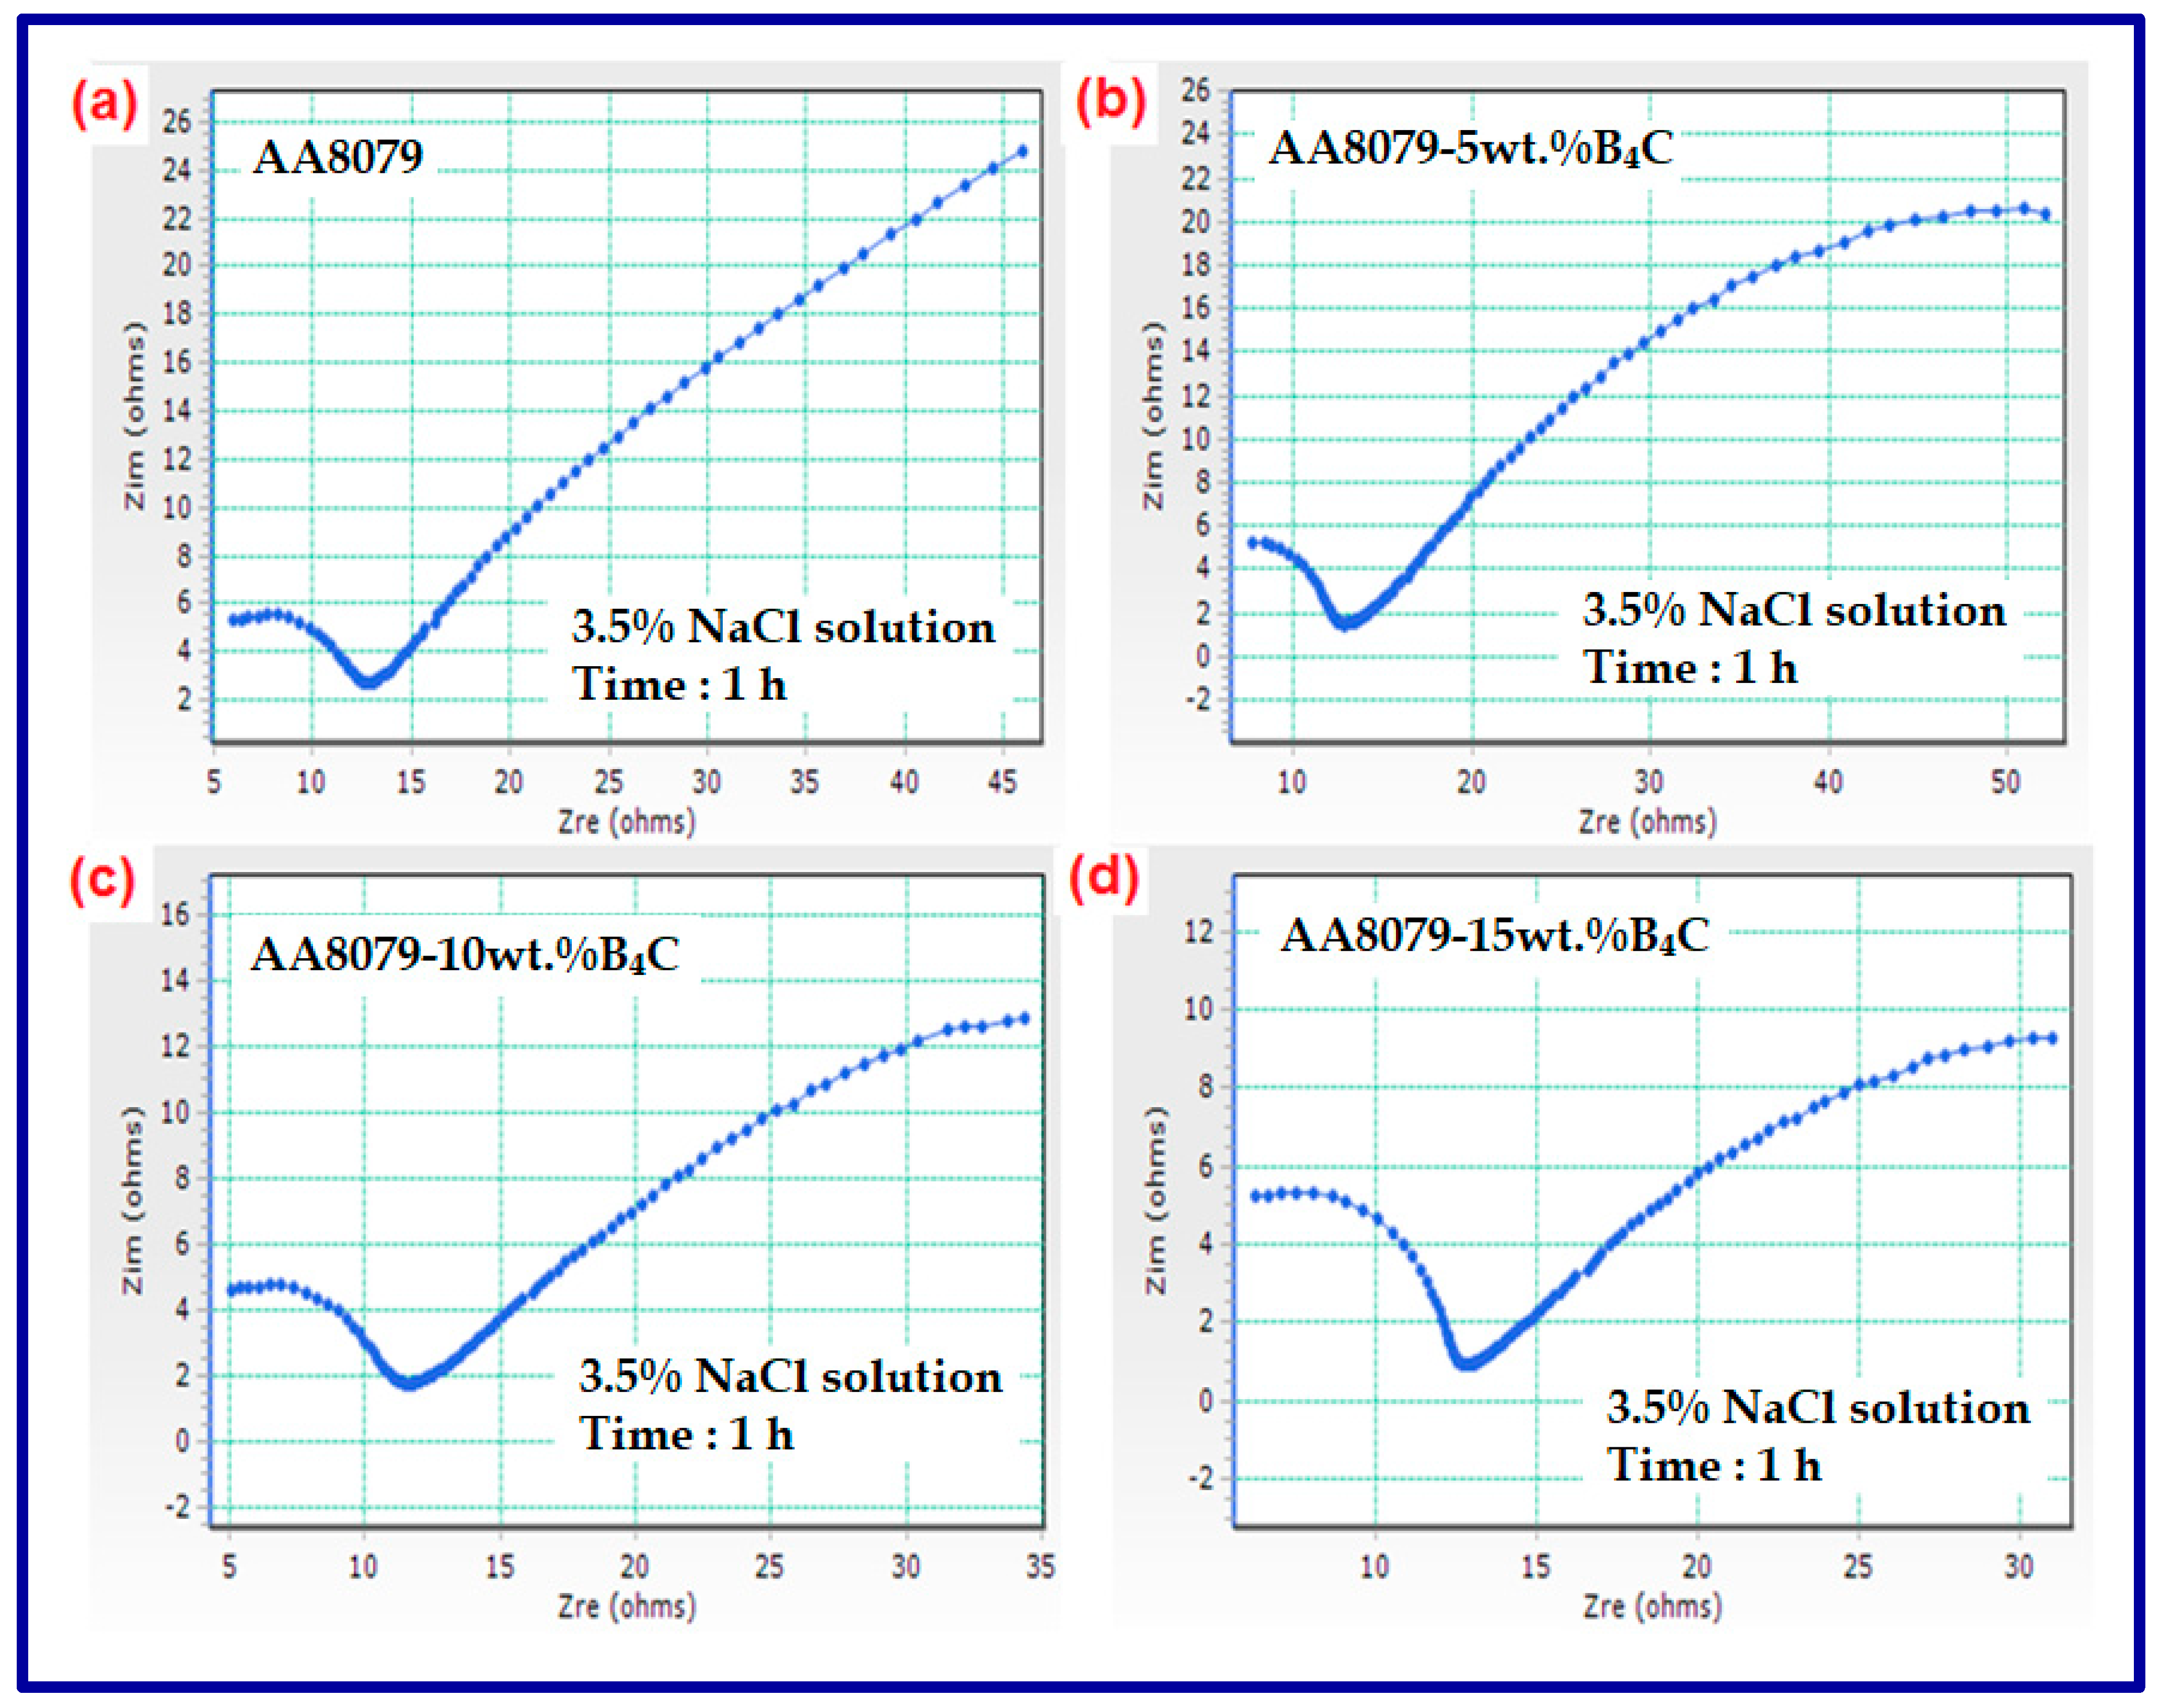
3.6. Corrosion Behavior

The corrosion behavior of composite samples has been studied by using electroanalytical techniques such as polarization and impedance measurements (EIS). The polarization curve of samples are displayed in Figure 11a–d. Tafel plots indicate that the corrosion rate of the composites reduced with raising the B4C weight percentage. Hence, galvanic influence amid them is detached. The witnessed increase in corrosion resistance for composites is dispensed to probable electrochemical decoupling between B4C particles and AA8079 matrix [15]. Soorya Prakash et al. reported that corrosion resistance rises considerably with a rise in hard particulate reinforcement such as B4C [52]. In inorganic acid forms, corrosion rate enhances as polarization curves are moved to a higher current density area associated to neutral chloride forms. B4C particles perform as physical protectors to stop the actuation and rate of development for pitting corrosion. The anodic polarization curves for AA8079 and AA8079-B4C display the endurance in corrosion current density, representing the exposure of pitting corrosion. The B4C particles which are utilized as reinforcing elements impede the creation of oxide layer and thus reduce the composites corrosion rate expressively.
The Nyquist plots observed in 3.5% Nacl solution for the AA8079, AA8079-5 wt.%B4C, AA8079-10 wt.%B4C, and AA8079-15 wt.%B4C composites are shown in Figure 12a–d. EIS for all the samples were detected after OCP recorded for 1 h. The occurrence of a defensive oxide film on the layers of composites is despite the attribution of a high frequency capacitive loop. The preforms are occupied through the oxide film capacitance; furthermore, the capacitance arcs diameters increased with an increase in the B4C particle; perhaps the opposition of the surface oxide film on the samples upsurges with the enhancement in B4C reinforcement. The uneven semicircle displays a non-ideal electrochemical performance on the electrode surface, which is despite the frequency distribution, roughness of the metal surface, and inhomogeneity. The Nyquist plot displays capacitive loop which is linked to the behavior of double layer capacitance, along with the charge transfer process amid electrolyte and metal surface. The diameter of the semicircle decreases with an increase in acid concentration, indicating an increase in the corrosion rate. A rise in the diameters of the Nyquist plots indicates the improved protective nature of the inhibitor against damage of material in the corrosive solution [53]. It could be understood that corrosion resistance increases when increasing the B4C weight percentage.

4. Conclusions

AA8079 matrix composites containing different weight percentage of B4C as reinforcements were successfully fabricated at different PM process parameters, and the subsequent conclusions were obtained:
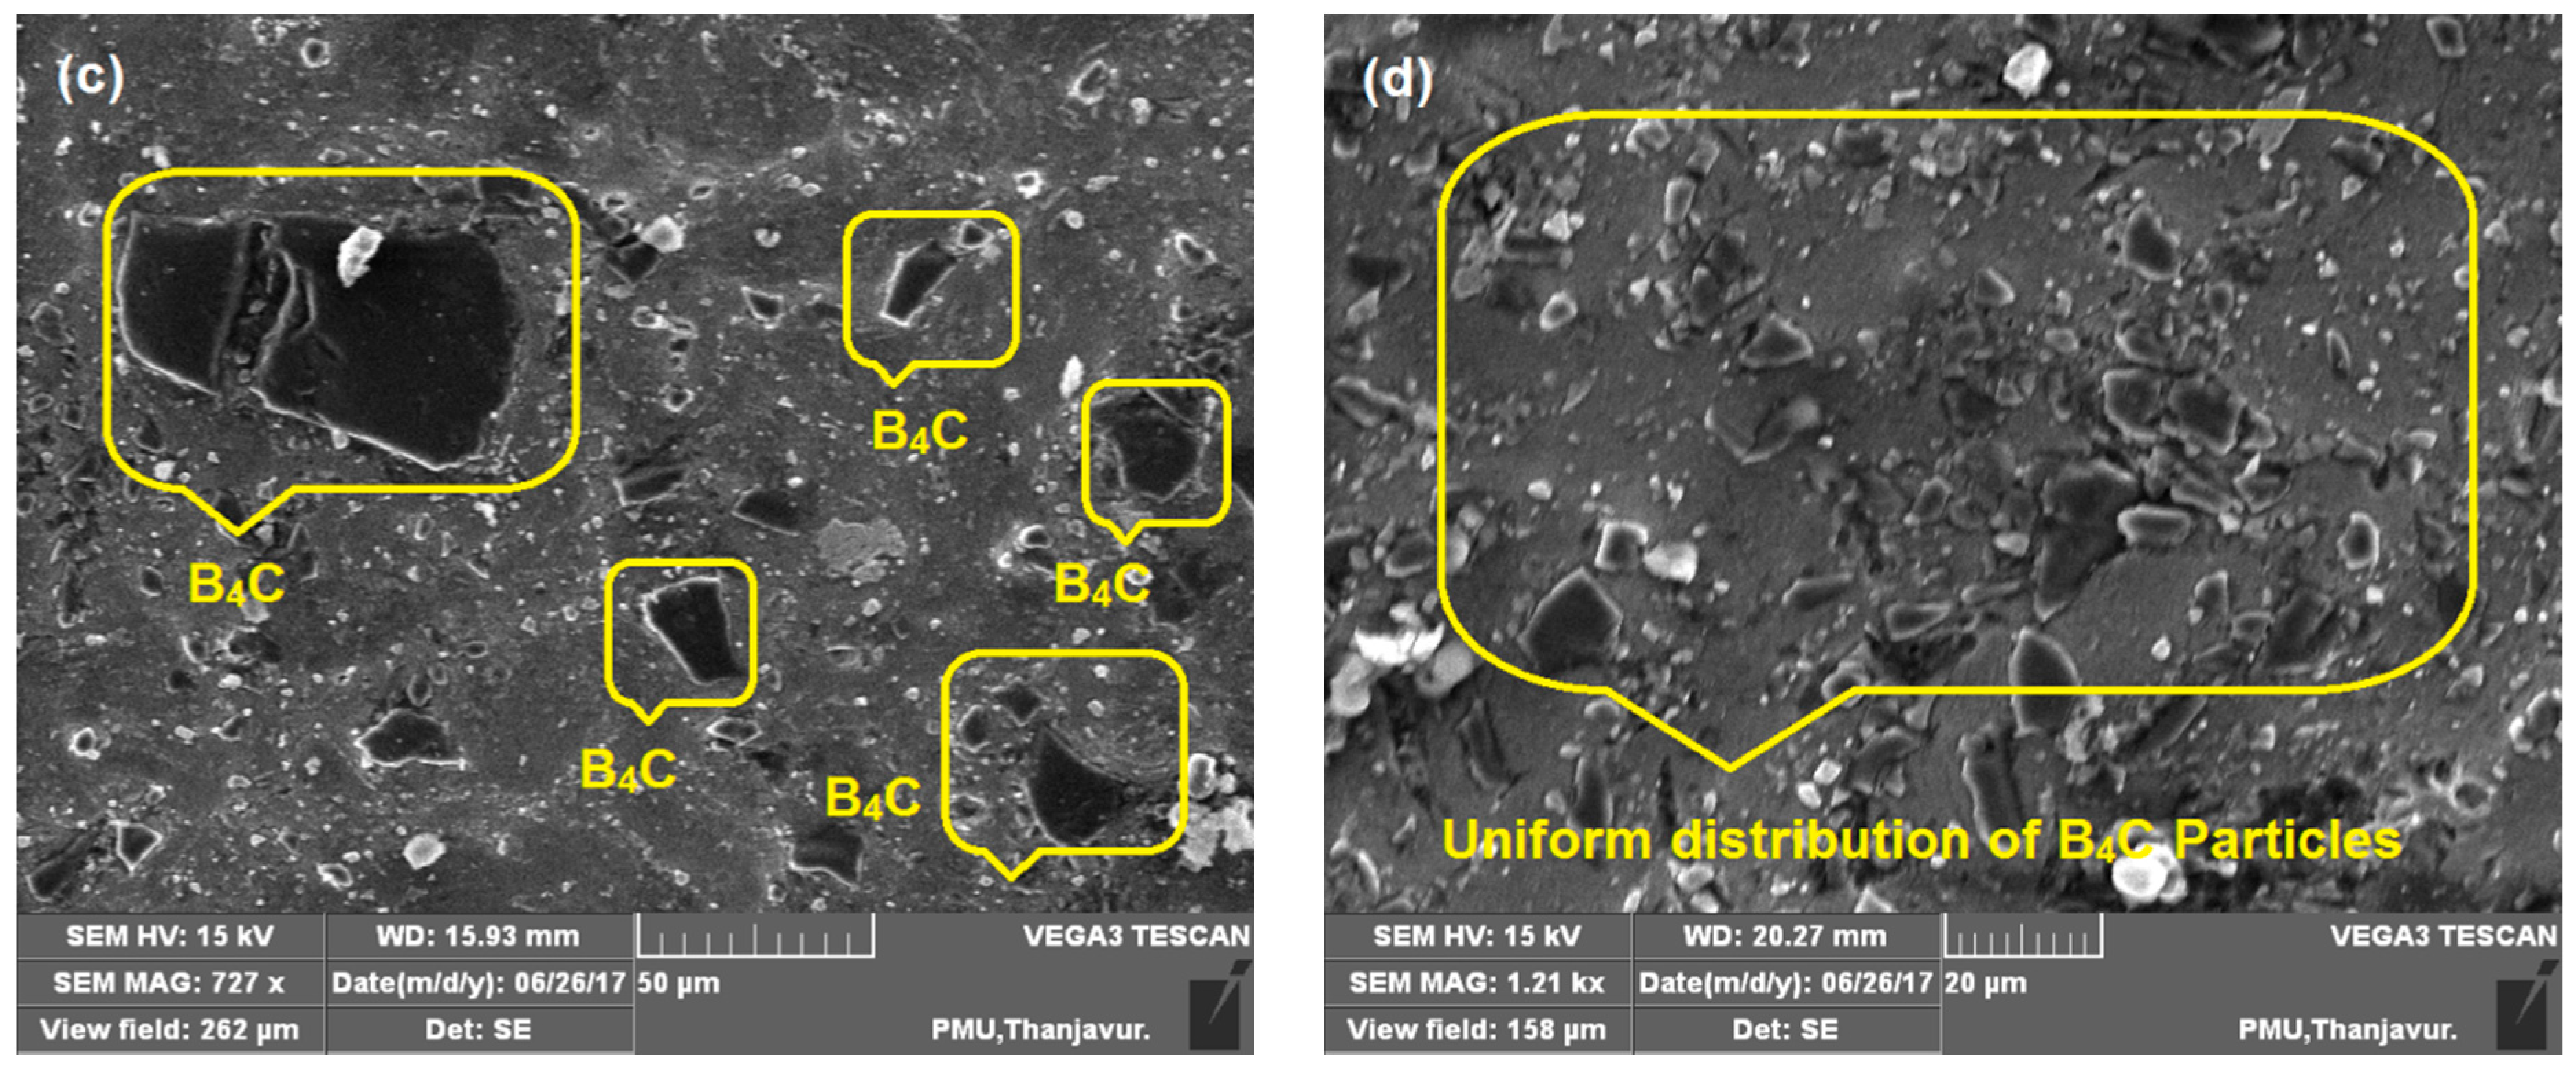
  • From the SEM examination, fine dispersal and occurrence of B4C particles with the AA8079 matrix has been observed;
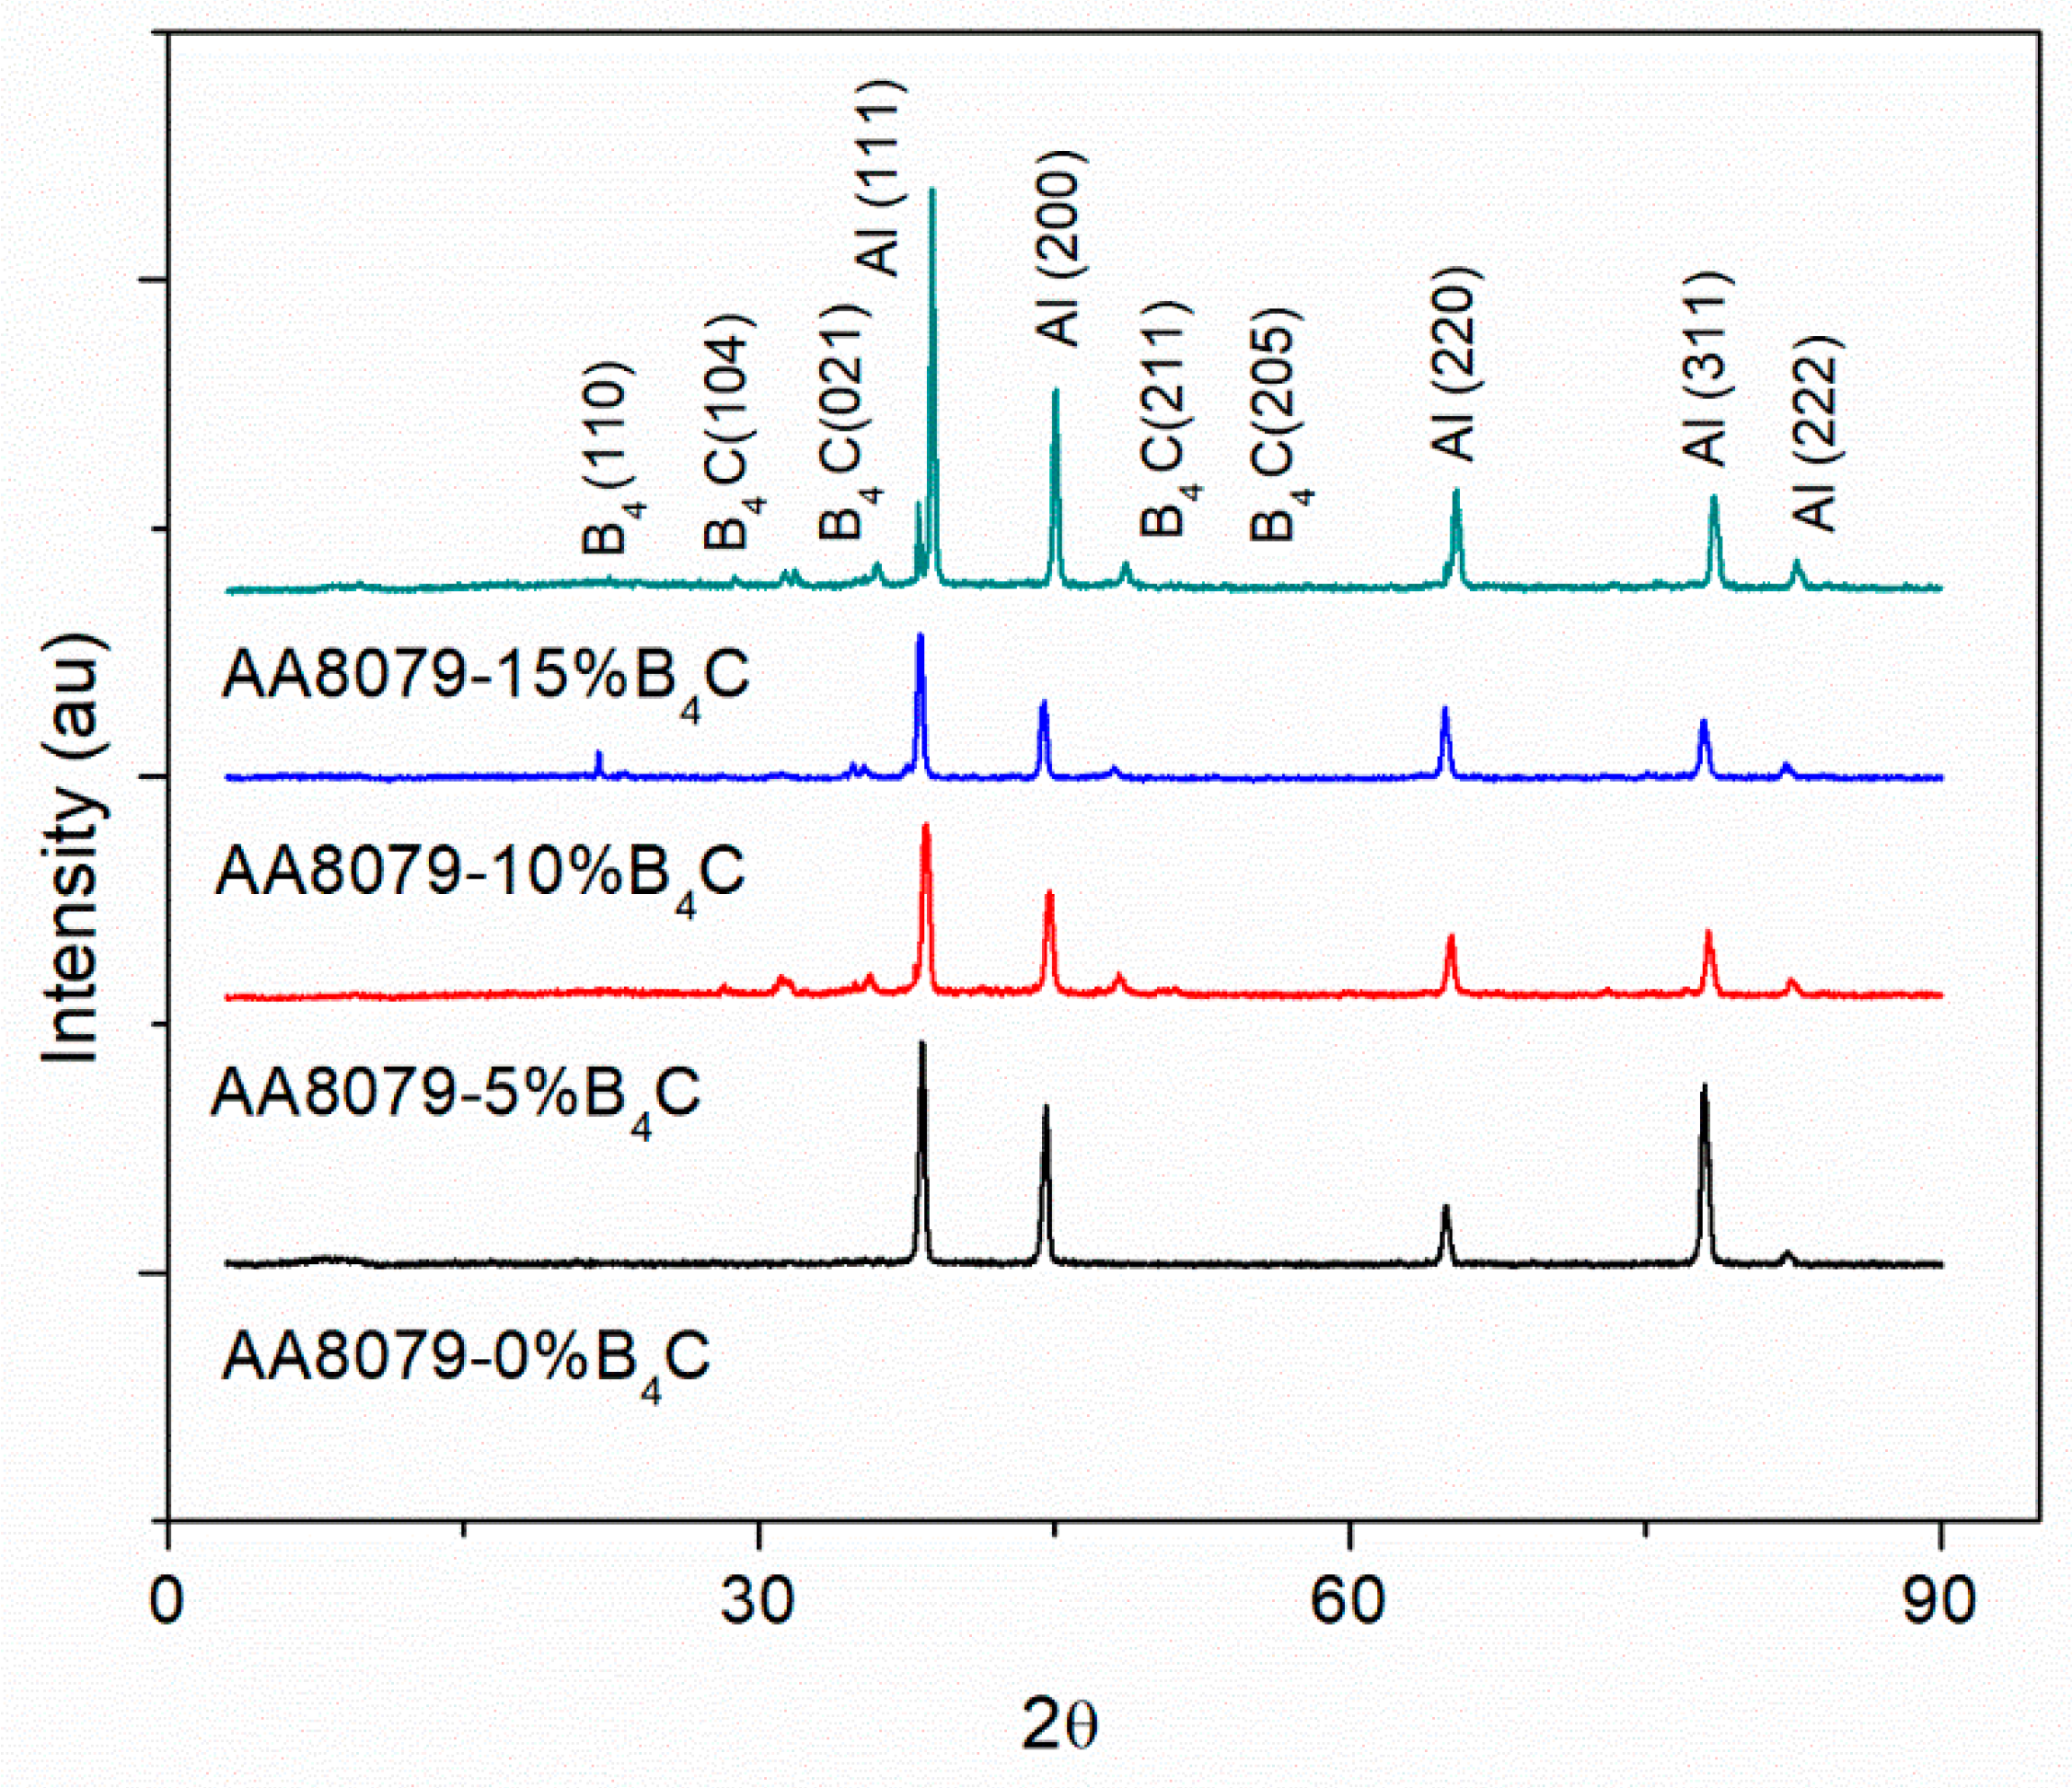
  • XRD analysis shows the presence of B4C particles with minor peaks;
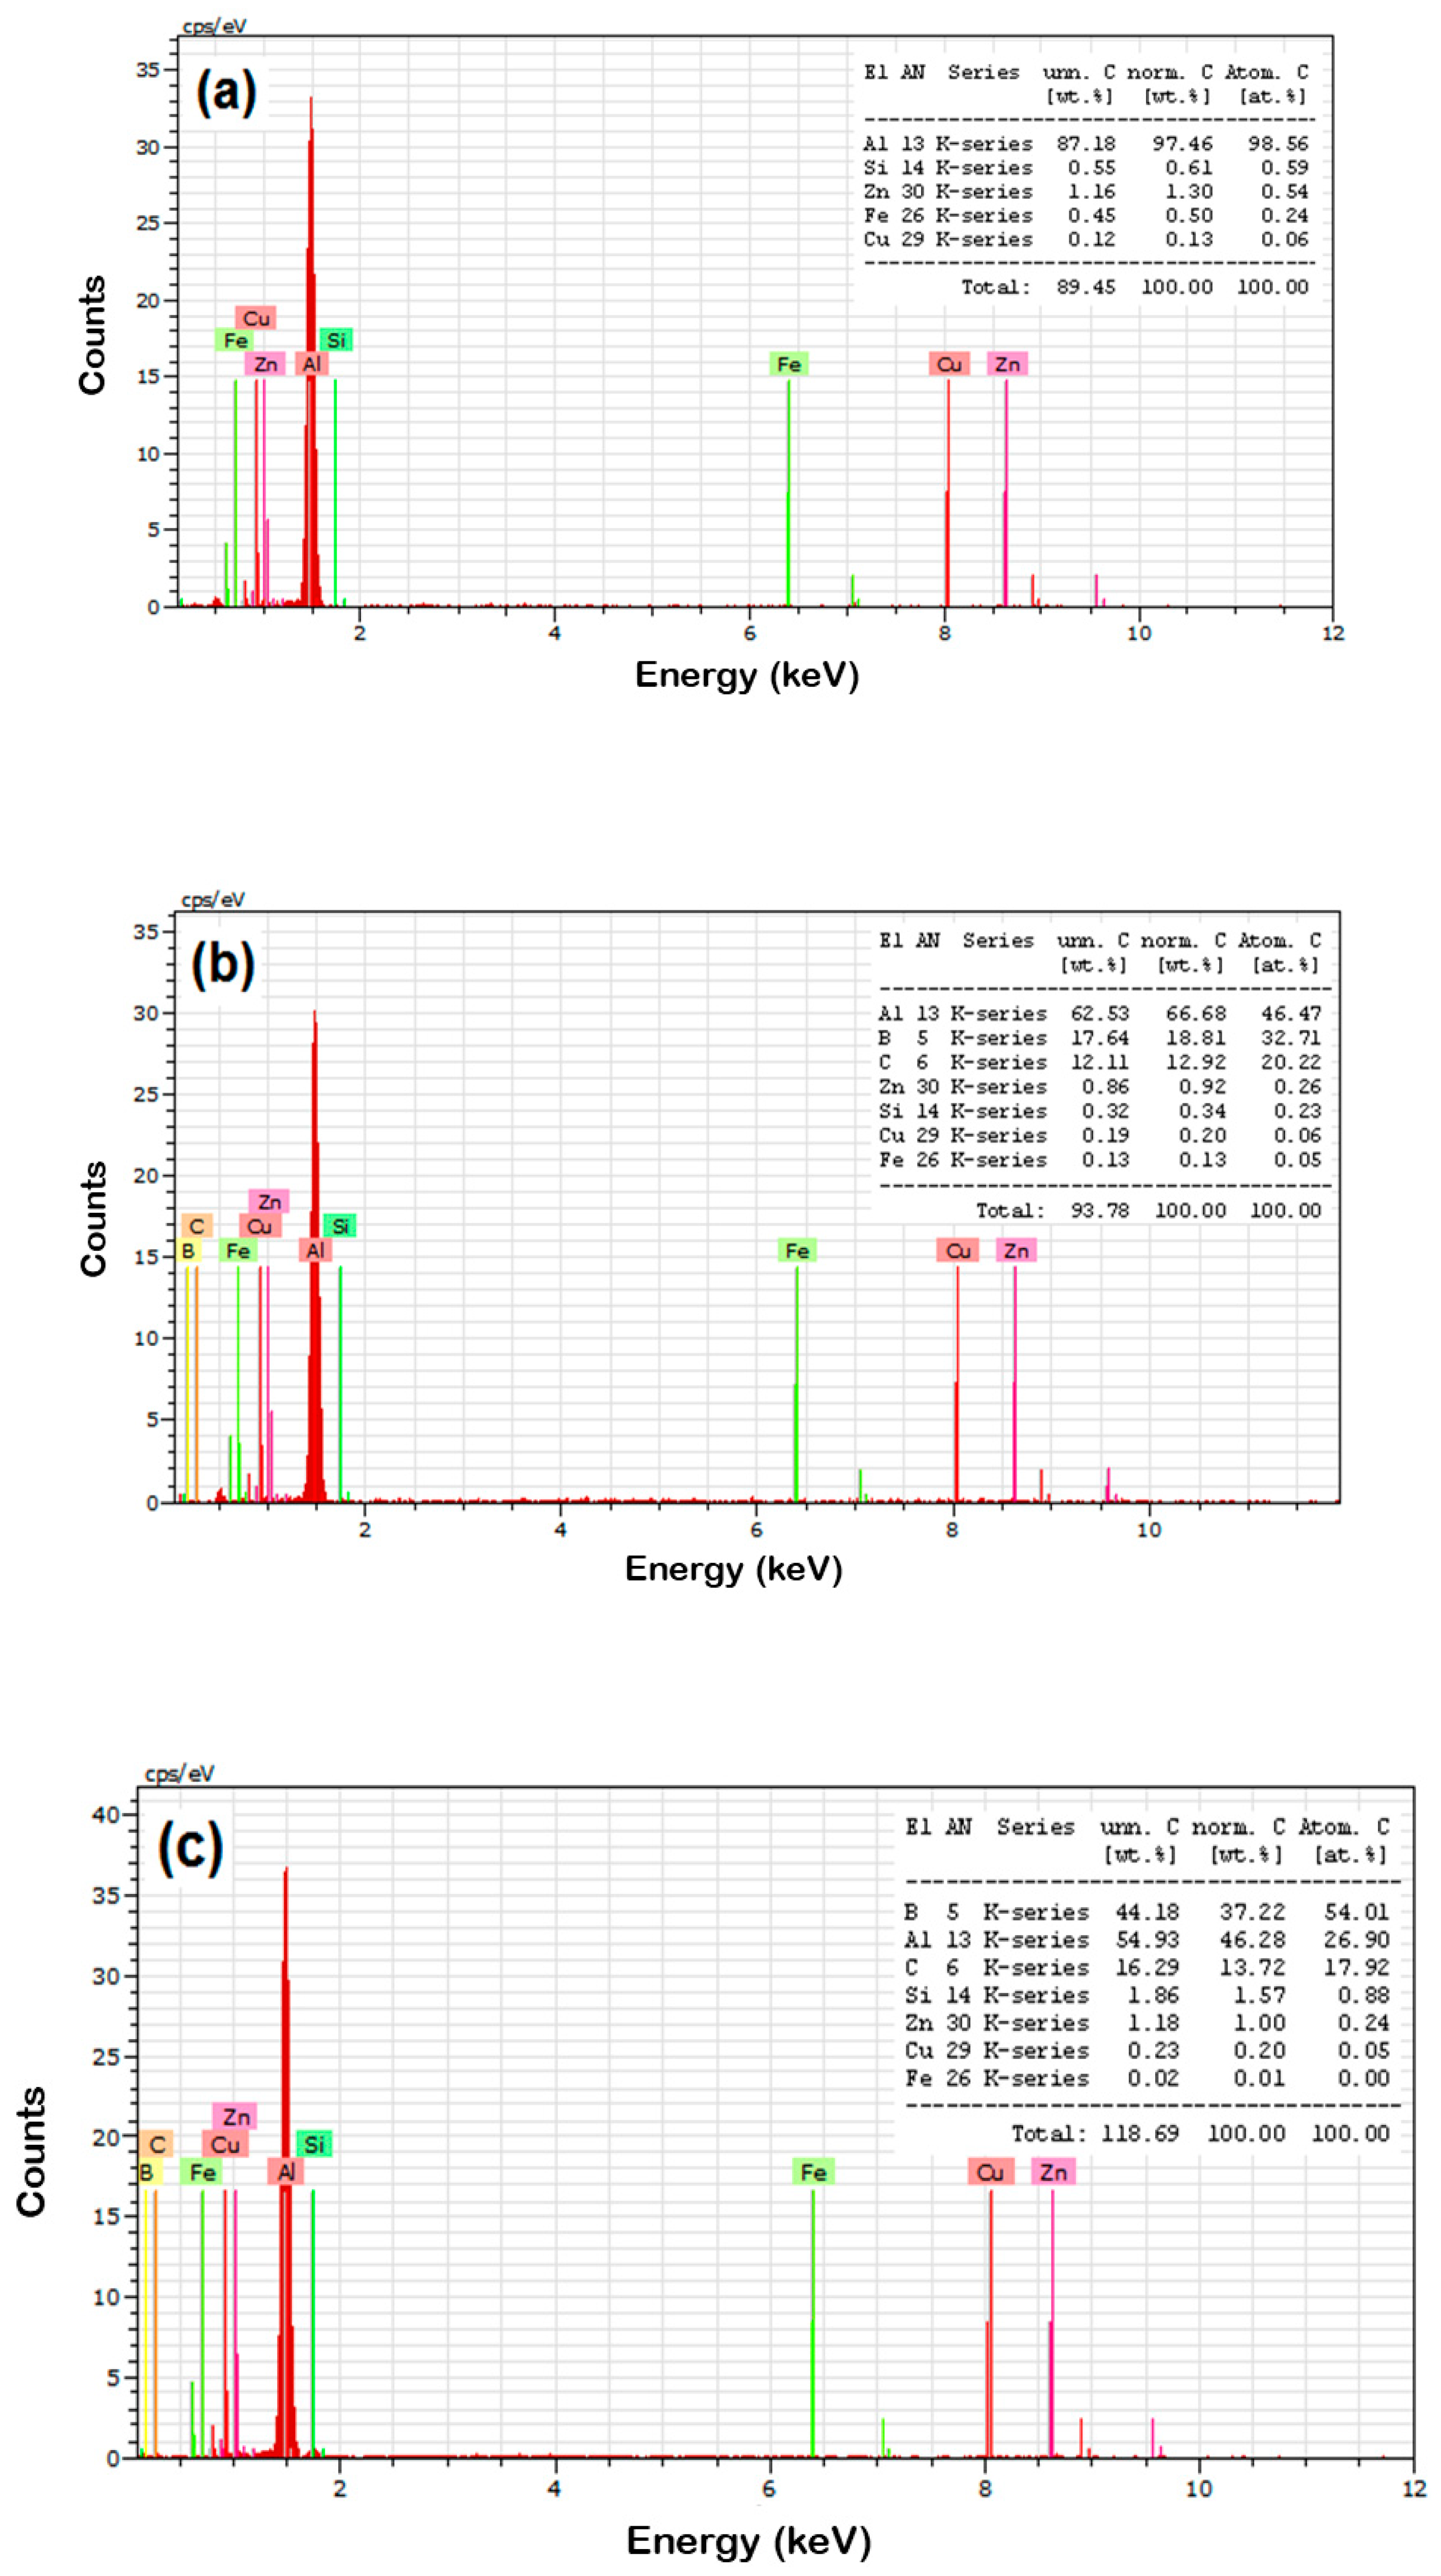
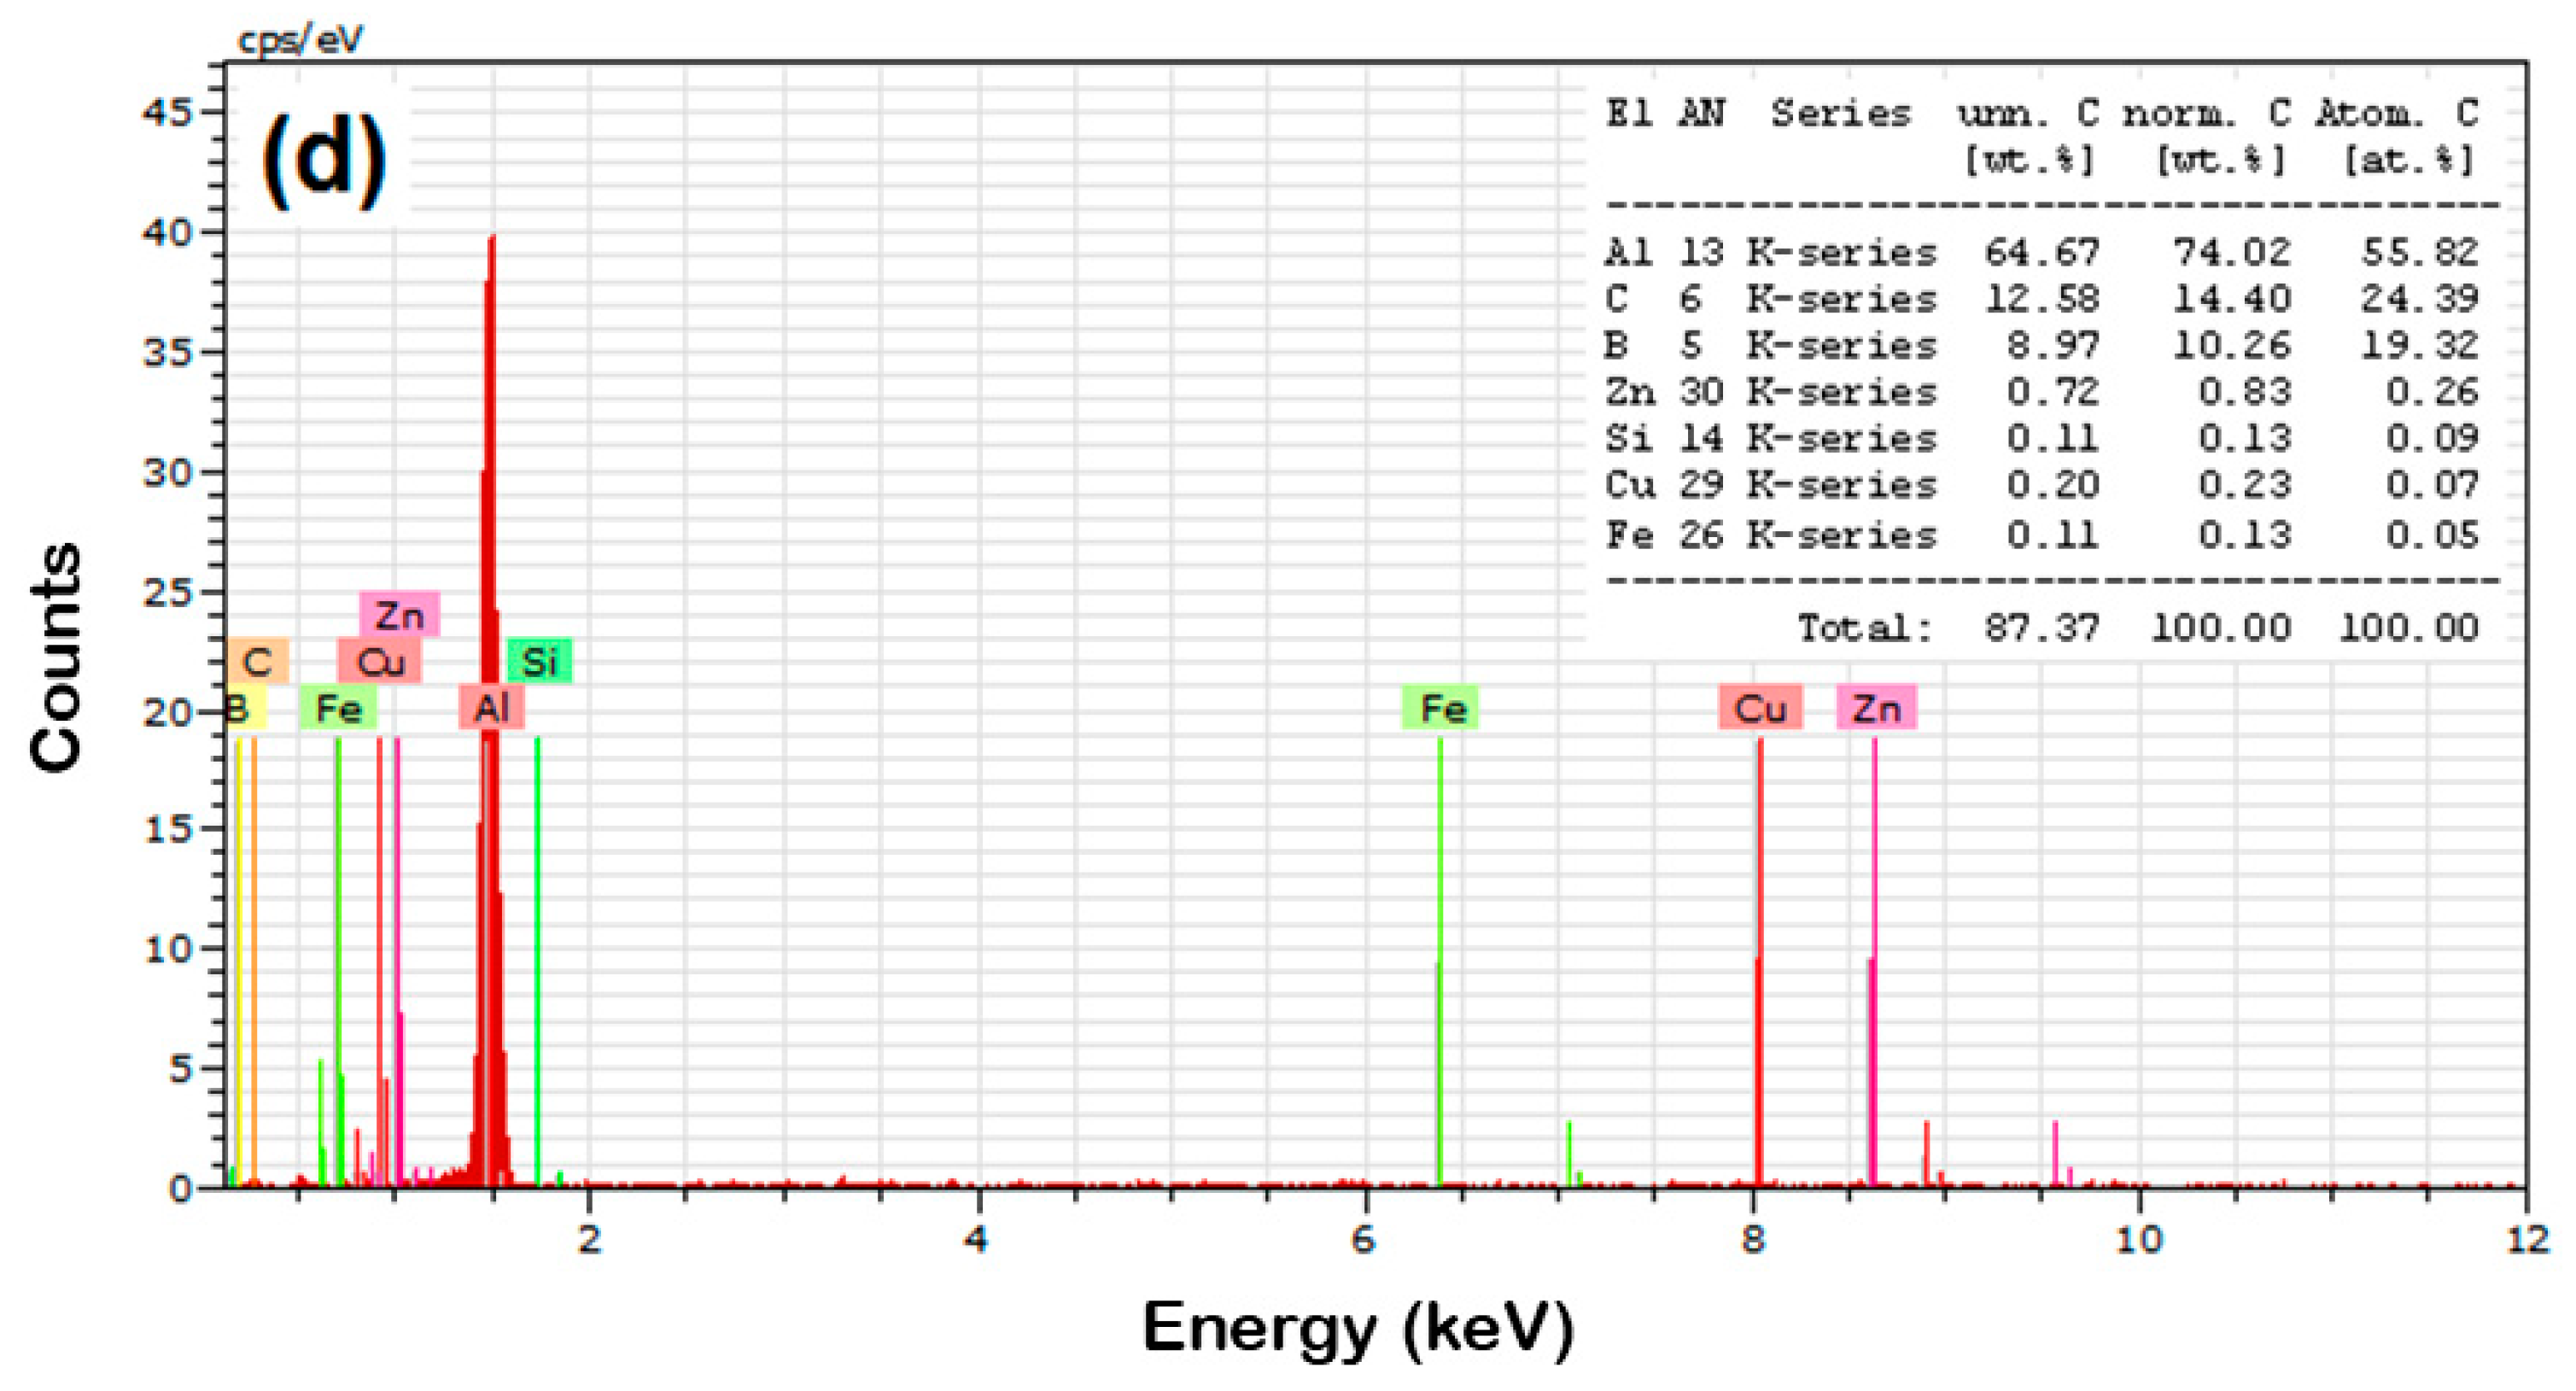
  • The EDAX analysis of the sintered samples witnessed the existence of B4C particles with AA8079 matrix and the respective elemental powders of the AA8079 matrix;
  • The density, hardness, and compressive strength of the composite was increased while increasing the reinforcement weight percentage from 5 to 15 wt.% with respect to an increase in PM process parameters, compaction pressure, sintering temperature, and time;
  • The SEM micrographs, after compression testing, exposed the homogenous dispersal of B4C reinforcement with AA8079 matrix without pores and grain boundaries;
  • The AA8079-B4C composites corrosion resistance rose with a rise in weight percentage of B4C reinforcement with AA8079 matrix.

Author Contributions

Conceptualization, M.M., M.R., V.M.; methodology, V.M., A.A.; software, A.A., S.A.K.; validation, T.S., S.A. and S.A.K.; formal analysis, M.M., S.A., A.A., C.A.S.; writing—original draft preparation, M.M., M.R., V.M.; writing—review and editing, M.M., S.A., A.A., C.A.S.; visualization, T.S.; supervision, A.A., S.A.; project administration, C.A.S., S.A.K.; funding acquisition, C.A.S., S.A. All authors have read and agreed to the published version of the manuscript.

Funding

Deanship of Scientific Research at King Khalid University, grant No. R.G.P. 2/127/42.

Institutional Review Board Statement

Not applicable.

Informed Consent Statement

Not applicable.

Data Availability Statement

Not applicable.

Acknowledgments

The authors extend their appreciation to the Deanship of Scientific Research at King Khalid University, Saudi Arabia, for funding this work through the Research Group Program under grant no. R.G.P. 2/127/42.

Conflicts of Interest

The authors declare no conflict of interest.

References

  1. Guleryuz, L.F.; Ozan, S.; Uzunsoy, D.; Ipek, R. An investigation of the microstructure and mechanical properties of B4C reinforced PM magnesium matrix composites. Powder Metall. Met. Ceram. 2012, 51, 456–462. [Google Scholar] [CrossRef]
  2. Pokorska, I. Deformation of powder metallurgy materials in cold and hot forming. J. Mater. Process. Technol. 2008, 196, 15–32. [Google Scholar] [CrossRef]
  3. Anand, S.; Mohan, B. Effect of particle size, compaction pressure on density and mechanical properties of elemental 6061Al alloy through powder metallurgical process. Int. J. Mater. Eng. Innov. 2012, 3, 259–268. [Google Scholar] [CrossRef]
  4. Ashwath, P.; Anthony, X.M. Processing methods and property evaluation of Al2O3 and SiC reinforced metal matrix composites based on aluminium 2xxx alloys. J. Mater. Res. 2012, 32, 1201–1219. [Google Scholar] [CrossRef]
  5. Prabhu, B.; Suryanarayana, C.; An, L.; Vaidyanathan, R. Synthesis and characterization of high volume fraction Al–Al2O3 nanocomposite powders by high-energy milling. Mater. Sci. Eng. A 2009, 425, 192–200. [Google Scholar] [CrossRef]
  6. Min, K.H.; Kang, S.P.; Kim, D.G.; Do Kim, Y. Sintering characteristic of Al2O3-reinforced 2xxx series Al composite powders. J. Alloys Compd. 2005, 400, 150–153. [Google Scholar] [CrossRef]
  7. Alizadeh, A.; Taheri-Nassaj, E.; Hajizamani, M. Hot extrusion process effect on mechanical behavior of stir cast Al based composites reinforced with mechanically milled B4C nanoparticles. J. Mater. Sci. Technol. 2011, 27, 1113–1119. [Google Scholar] [CrossRef]
  8. Abdullah, Y.; Kamarudin, N. Al/B4C composites with 5 and 10 wt% reinforcement content prepared by powder metallurgy. J. Nucl. Relat. Technol. 2012, 9, 42–47. [Google Scholar]
  9. Nie, C.Z.; Gu, J.J.; Liu, J.L.; Zhang, D. Production of boron carbide reinforced 2024 aluminum matrix composites by mechanical alloying. Mater. Trans. 2007, 48, 990–995. [Google Scholar] [CrossRef] [Green Version]
  10. Alihosseini, H.; Dehghani, K. Microstructure characterization, mechanical properties, compressibility and sintering behavior of Al-B4Cnanocomposite powders. Adv. Powder Technol. 2017, 28, 2126–2134. [Google Scholar] [CrossRef]
  11. Jeyasimman, D.; Sivaprasad, K.; Sivasankaran, S.; Ponalagusamy, R.; Narayanasamy, R. Microstructural observation, consolidation and mechanical behavior of AA 6061 nanocomposites reinforced by γ-Al2O3 nanoparticles. Adv. Powder Technol. 2014, 57, 394–404. [Google Scholar]
  12. Bodukuri, A.K.; Eswaraiah, K.; Rajendar, K.; Sampath, V. Fabrication of Al-SiC-B4C metal matrix composite by powder metallurgy technique and evaluating mechanical properties. Perspect. Sci. 2016, 8, 8428–8431. [Google Scholar] [CrossRef] [Green Version]
  13. Sivasankaran, S.; Sivaprasad, K.; Narayanasamy, R.; Satyanarayana, P.V. X-ray peak broadening analysis of AA 6061100−x−x wt.% Al2O3 nano composite prepared by mechanical alloying. Mater. Charact. 2011, 62, 661–672. [Google Scholar] [CrossRef]
  14. Ravichandran, M.; Anandakrishnan, V. Hot upset studies on sintered (Al–TiO2–Gr) powder metallurgy hybrid composite. Strength Mater. 2016, 48, 450–459. [Google Scholar] [CrossRef]
  15. Almomani, M.A.; Tayfour, W.R. Effect of silicon carbide addition on the corrosion behavior of powder metallurgy cu-30zn brass in a 3.5 wt.% NaCl solution. J. Alloys Compd. 2016, 679, 101–114. [Google Scholar] [CrossRef]
  16. Zakaria, H.M. Microstructural and corrosion behavior of Al/SiC metal matrix composites. Ain Shams Eng. J. 2014, 5, 831–838. [Google Scholar] [CrossRef]
  17. Zamani, N.A.B.N.; Iqbal, A.A.; Nuruzzaman, D.M. Tribo-mechanical characterisation of self-lubricating aluminium based hybrid metal matrix composite fabricated via powder metallurgy. Materialia 2020, 14, 100936. [Google Scholar] [CrossRef]
  18. Akcamli, N.; Senyurt, B. B4C particulate-reinforced Al-8.5wt% Si-3.5 wt%C matrix composites: Powder metallurgical fabrication, age hardening, and characterization. Ceram. Int. 2021, 47, 6813–6826. [Google Scholar] [CrossRef]
  19. Sharma, V.K.; Kumar, V. Development of rare-earth oxides based hybrid AMCs reinforced with SiC/Al2O3: Mechanical & metallurgical characterization. J. Mater. Res. Technol. 2019, 8, 1971–1981. [Google Scholar]
  20. Shaikh, M.B.N.; Arif, S.; Aziz, T.; Waseem, A.; Shaikh, M.A.N.; Ali, M. Microstructural, mechanical and tribological behaviour of powder metallurgy processed SiC and RHA reinforced Al-based composites. Surf. Interface 2019, 15, 166–179. [Google Scholar] [CrossRef]
  21. Toozandehjani, M.; Ostovan, F.; Jamaludin, K.R.; Amrin, A.; Matori, K.; Shafiei, E. Process microstructure properties relationship in Al−CNTs−Al2O3 nanocomposites manufactured by hybrid powder metallurgy and microwave sintering process. Trans. Nonferrous Met. Soc. China 2020, 30, 2339–2354. [Google Scholar] [CrossRef]
  22. Erdemir, F.C. Microstructural characterization and mechanical properties of functionally graded Al2024/SiC composites prepared by powder metallurgy techniques. Trans. Nonferrous Met. Soc. China 2015, 25, 3569–3577. [Google Scholar] [CrossRef]
  23. Karakoc, H.; Ovali, I.; Dundar, S.; Citak, R. Wear and mechanical properties of Al6061/SiC/B4C hybrid composites produced with powder metallurgy. J. Mater. Res. Technol. 2019, 8, 5348–5361. [Google Scholar]
  24. Fathy, A.; Omyma, E.K.; Mohammed, M.M. Effect of iron addition on microstructure, mechanical and magnetic properties of Al-matrix composite produced by powder metallurgy route. Trans. Nonferrous Met. Soc. China 2015, 25, 46–53. [Google Scholar] [CrossRef]
  25. Iacob, G.; Ghica, V.G.; Buzatu, M.; Buzatu, T.; Petrescu, M. Studies on wear rate and micro-hardness of the Al/Al2O3/Gr hybrid composites produced via powder metallurgy. Compos. Part B 2015, 69, 603–611. [Google Scholar] [CrossRef]
  26. Stalin, B.; Sudha, G.T.; Kailasanathan, C.; Ravichandran, M. Effect of MoO3 ceramic oxide reinforcement particulates on the microstructure and corrosion behaviour of Al alloy composites processed by P/M route. Mater. Today Commun. 2020, 25, 101655. [Google Scholar] [CrossRef]
  27. Patel, J.; Morsi, K. Effect of mechanical alloying on the microstructure and properties of Al–Sn–Mg alloy. J. Alloys Compd. 2012, 540, 100–106. [Google Scholar] [CrossRef]
  28. Jailani, S.; Rajadurai, A.; Mohan, B.; Kumar, S.A.; Sornakumar, T. Development and properties of aluminium silicon alloy fly ash composites. Powder Metall. 2011, 54, 474–479. [Google Scholar] [CrossRef]
  29. Jeyasimman, D.; Sivasankaran, S.; Sivaprasad, K.; Narayanasamy, R.; Kambali, R.S. An investigation of the synthesis, consolidation and mechanical behaviour of Al 6061 nanocomposites reinforced by TiC via mechanical alloying. Mater. Des. 2014, 57, 394–404. [Google Scholar] [CrossRef]
  30. Saravanan, S.; Senthilkumar, P.; Ravichandran, M.; Anandakrishnan, V. Mechanical, electrical, and corrosion behavior of AA6063/TiC composites synthesized via stir casting route. J. Mater. Res. 2017, 32, 606–614. [Google Scholar] [CrossRef]
  31. Murthy, H.A.; Singh, S.K. Influence of TiC particulate reinforcement on the corrosion behaviour of Al 6061 metal matrix composites. Adv. Mater. Lett. 2015, 6, 633–640. [Google Scholar] [CrossRef]
  32. Mohanty, R.M.; Balasubramaniam, K.; Seshadri, S.K. Boron-Carbide reinforced aluminium 1100 matrix composites: Fabrications and properties. Mater. Sci. Eng. A 2008, 498, 42–52. [Google Scholar] [CrossRef]
  33. Ravichandran, M.; Manikandan, A. Investigations on properties of Al-B4C composites synthesized through powder metallurgy rout. Appl. Mech. Mater. 2016, 852, 93. [Google Scholar] [CrossRef]
  34. Celik, Y.H.; Secilmis, K. Investigation of wear behaviors of Al matrix composites reinforced with different B4C rate produced by powder metallurgy method. Adv. Powder Technol. 2017, 28, 2218–2224. [Google Scholar] [CrossRef]
  35. Ghasali, E.; Alizadeh, M.; Ebadzadeh, T.; Pakseresht, A.H.; Rahbari, A. Investigation on microstructural and mechanical properties of B4C–aluminum matrix composites prepared by microwave sintering. J. Mater. Res. Technol. 2015, 4, 411–415. [Google Scholar] [CrossRef] [Green Version]
  36. Ravichandran, M.; Naveen Sait, A.; Anandakrishnan, V. Workability studies on Al + 2.5%TiO2 + Gr powder metallurgy composites during cold upsetting. Mater. Res. 2014, 29, 1490–1496. [Google Scholar] [CrossRef]
  37. Kumar, C.A.V.; Rajadurai, J.S. Influence of rutile (TiO2) content on wear and microhardness characteristics of aluminium-based hybrid composites synthesized by powder metallurgy. Trans. Nonferrous Met. Soc. China 2016, 26, 63–73. [Google Scholar] [CrossRef]
  38. Baradeswaran, A.E.P.A.; Perumal, A.E. Influence of B4C on the tribological and mechanical properties of Al 7075–B4C composites. Compos. Part B 2013, 54, 146–152. [Google Scholar] [CrossRef]
  39. Prakash, S.K.; Gopal, P.M.; Anburose, D.; Kavimani, V. Mechanical, corrosion and wear characteristics of powder metallurgy. Ain Shams Eng. J. 2016, 7, 2–8. [Google Scholar]
  40. Harichandran, R.; Selvakumar, N. Effect of nano/micro B4C particles on the mechanical properties of aluminium metal matrix composites fabricated by ultrasonic cavitation-assisted solidification process. Arch. Civ. Mech. Eng. 2015, 16, 147–158. [Google Scholar] [CrossRef]
  41. Karabulut, S.; Karakoc, H.; Citak, R. Influence of B4C particle reinforcement on mechanical and machining properties of Al6061/B4C composites. Compos. Part B 2016, 101, 87–98. [Google Scholar] [CrossRef]
  42. Shen, Q.; Wu, C.D.; Luo, G.; Fang, P.; Li, C.; Wang, Y.; Zhang, L. Microstructure and mechanical properties of Al-7075/B4C composites fabricated by plasma activated sintering. J. Alloys Compd. 2014, 588, 265–270. [Google Scholar] [CrossRef]
  43. Balamurugan, P.; Uthayakumar, M. Influence of process parameters on Cu-Fly ash composite by powder metallurgy technique. Mater. Manuf. Process. 2015, 30, 313–319. [Google Scholar] [CrossRef]
  44. Dayanand, S.; Boppana, S.B.; Hemanth, J.; Telagu, A. Microstructure and corrosion characteristics of in situ aluminum diboride metal matrix composites. J. Bio Tribo-Corros. 2019, 60, 1–10. [Google Scholar] [CrossRef]
  45. Ravikumar, M.; Reddappa, H.N.; Suresh, R.; Sreenivasa, R.M.; Babu, E.R.; Reddy, N.C.; Ravikumar, C.R.; Ananda Murth, H.C. Evaluation of corrosion properties of Al2O3 and SiC reinforced aluminium metal matrix composites using taguchi’s techniques. J. Sci. Res. 2021, 65, 253–259. [Google Scholar]
  46. Li, C.; Qiu, R.; Luan, B.; Li, Z. Effect of carbon nanotubes and high temperature extrusion on the microstructure evolution of Al– Cu alloy. Mater. Sci. Eng. 2017, 704, 38–44. [Google Scholar] [CrossRef]
  47. El-Kady, O.; Fathy, A. Effect of SiC particle size on the physical and mechanical properties of extruded Al matrix nanocomposites. Mater. Des. 2014, 54, 348–353. [Google Scholar] [CrossRef]
  48. Sharath, B.N.; Venkatesh, C.V.; Afzal, A. Multi Ceramic Particles Inclusion in the Aluminium Matrix and Wear Characteri-zation through Experimental and Response Surface-Artificial Neural Networks. Materials 2021, 14, 2895. [Google Scholar] [CrossRef]
  49. Sathish, T.; Kaladgi, A.R.R.; Mohanavel, V.; Arul, K.; Afzal, A.; Aabid, A. Experimental Investigation of the Friction Stir Weldability of AA8006 with Zirconia Particle Reinforcement and Optimized Process Parameters. Materials 2021, 14, 2782. [Google Scholar] [CrossRef]
  50. Akhtar, M.N.; Khan, M.; Khan, S.A.; Afzal, A.; Subbiah, R.; Bakar, E.A. Determination of Non-Recrystallization Temperature for Niobium Micro alloyed Steel. Materials 2021, 14, 2639. [Google Scholar] [CrossRef]
  51. Nagaraja, S.; Nagegowda, K.U.; Kumar, V.A.; Alamri, S.; Afzal, A.; Thakur, D.; Kaladgi, A.R.; Panchal, S.; Saleel, C.A. In-fluence of the Fly Ash Material Inoculants on the Tensile and Impact Characteristics of the Aluminum AA 5083/7.5SiC Composites. Materials 2021, 14, 2452. [Google Scholar] [CrossRef] [PubMed]
  52. Sathish, T.; Mohanavel, V.; Ansari, K.; Saravanan, R.; Karthick, A.; Afzal, A.; Alamri, S.; Saleel, C.A. Synthesis and Characterization of Mechanical Properties and Wire Cut EDM Process Parameters Analysis in AZ61 Magnesium Alloy + B4C + SiC. Materials 2021, 14, 3689. [Google Scholar] [CrossRef] [PubMed]
  53. Mysore, T.H.M.; Patil, A.Y.; Raju, G.U.; Banapurmath, N.R.; Bhovi, P.M.; Afzal, A.; Alamri, S.; Saleel, C.A. Investigation of Mechanical and Physical Properties of Big Sheep Horn as an Alternative Biomaterial for Structural Applications. Materials 2021, 14, 4039. [Google Scholar] [CrossRef] [PubMed]
Figure 1. SEM images of the as-received (a) Al and (b) B4C.
Materials 14 04315 g001
Figure 2. Synthesis of AA8079 and composite samples using ball milling and compaction method.
Materials 14 04315 g002
Figure 3. Characterization and mechanical properties studies for the sintered composite samples.
Materials 14 04315 g003
Figure 4. SEM images of sintered (a) AA8079, (b) AA8079-5 wt.%B4C, (c) AA8079-10 wt.%B4C, and (d) AA8079-15 wt.%B4C composite preforms.
Materials 14 04315 g004aMaterials 14 04315 g004b
Figure 5. EDAX of sintered (a) AA8079, (b) AA8079-5% B4C, (c) AA8079-10% B4C, and (d) AA8079-15% B4C composite preforms.
Materials 14 04315 g005aMaterials 14 04315 g005b
Figure 6. XRD patterns of AA8079-B4C composites.
Materials 14 04315 g006
Figure 7. (a). Effect of different compaction pressure (300, 400, and 500 MPa), different sintering time (1, 2, and 3 h), sintering temperature (375 °C, 475 °C, and 575 °C), and 5 wt%.B4C on density. (b) Effect of different compaction pressure (300, 400, and 500 MPa), different sintering time (1, 2, and 3 h), sintering temperature (375 °C, 475 °C, and 575 °C), and 10wt%.B4C on density. (c) Effect of different compaction pressure (300, 400, and 500 MPa), different sintering time (1, 2, and 3 h), sintering temperature (375 °C, 475 °C, and 575 °C) and 15 wt%.B4C on density.
Materials 14 04315 g007aMaterials 14 04315 g007b
Figure 8. (a). Effect of different compaction pressure (300, 400, and 500 MPa), different sintering time (1, 2, and 3 h), sintering temperature (375 °C, 475 °C, and 575 °C), and 5 wt%.B4C on micro hardness. (b). Effect of different compaction pressure (300, 400, and 500 MPa), different sintering time (1, 2, and 3 h), sintering temperature (375 °C, 475 °C, and 575 °C), and 10wt%.B4C on micro hardness. (c). Effect of different compaction pressure (300, 400, and 500 MPa), different sintering time (1, 2, and 3 h), sintering temperature (375 °C, 475 °C, and 575 °C), and 15 wt%.B4C on micro hardness.
Materials 14 04315 g008aMaterials 14 04315 g008b
Figure 9. (a). Effect of different compaction pressure (300, 400, and 500 MPa), different sintering time (1, 2, and 3 h), sintering temperature (375 °C, 475 °C, and 575 °C), and 5 wt%.B4C on compressive strength. (b). Effect of different compaction pressure (300, 400, and 500 MPa), different sintering time (1, 2, and 3 h), sintering temperature (375 °C, 475 °C, and 575 °C), and 10wt%.B4C on compressive strength. (c). Effect of different compaction pressure (300, 400, and 500 MPa), different sintering time (1, 2, and 3 h), sintering temperature (375 °C, 475 °C, and 575 °C), and 15 wt%.B4C on compressive strength.
Materials 14 04315 g009aMaterials 14 04315 g009b
Figure 10. SEM images after compression test (a) 0%, (b) 5% B4C, (c) 10% B4C, and (d) 15% B4C samples.
Materials 14 04315 g010aMaterials 14 04315 g010b
Figure 11. (ad) Polarization curves for (a) AA8079, (b) AA8079-5 wt.%B4C, (c) AA8079-10 wt.%B4C, and (d) AA8079-15 wt.%B4C composites in 3.5% NaCl solution.
Materials 14 04315 g011aMaterials 14 04315 g011b
Figure 12. (ad) Nyquist plots for (a) AA8079, (b) AA8079-5 wt.%B4C, (c) AA8079-10 wt.%B4C, and (d) AA8079-15 wt.%B4C composites in 3.5%NaCl solutions.
Materials 14 04315 g012
Table 1. Effect of PM parameters on density at different compaction pressure (300, 400, and 500 MPa), different sintering time (1, 2, and 3 h), different sintering temperature (375, 475, and 575 °C), and different reinforcement weight percentages (5 wt%., 10 wt%., and 15 wt%.B4C).
1Compaction Pressure
300 MPa
Compaction Pressure
400 MPa
Compaction Pressure
500 MPa
Sintering Time 1 hSintering Time 2 hSintering Time
3 h
Sintering Temperature 375 °C and 5 wt%.B4C2.662.692.73
Sintering Temperature 375 °C and 5 wt%.B4C2.712.752.77
Sintering Temperature 375 °C and 5 wt%.B4C2.782.842.89
2Compaction Pressure
300 MPa
Compaction Pressure
400 MPa
Compaction Pressure
500 MPa
Sintering Temperature 475 °C and 5 wt%.B4C2.682.722.78
Sintering Temperature 475 °C and 5 wt%.B4C2.742.832.85
Sintering Temperature 475 °C and 5 wt%.B4C2.812.902.94
3Compaction Pressure
300 MPa
Compaction Pressure
400 MPa
Compaction Pressure
500 MPa
Sintering Temperature 575 °C and 5 wt%.B4C2.732.752.84
Sintering Temperature 575 °C and 5 wt%.B4C2.772.822.89
Sintering Temperature 575 °C and 5 wt%.B4C2.842.932.96
4Compaction Pressure
300 MPa
Compaction Pressure
400 MPa
Compaction Pressure
500 MPa
Sintering Temperature 375 °C and 10 wt%.B4C2.762.792.86
Sintering Temperature 375 °C and 10 wt%.B4C2.812.852.94
Sintering Temperature 375 °C and 10 wt%.B4C2.872.953.01
5Compaction Pressure
300 MPa
Compaction Pressure
400 MPa
Compaction Pressure
500 MPa
Sintering Temperature 475 °C and 10 wt%.B4C2.822.832.90
Sintering Temperature 475 °C and 10 wt%.B4C2.882.923.10
Sintering Temperature 475 °C and 10 wt%.B4C2.973.043.17
6Compaction Pressure
300 MPa
Compaction Pressure
400 MPa
Compaction Pressure
500 MPa
Sintering Temperature 575 °C and 10 wt%.B4C2.852.872.99
Sintering Temperature 575 °C and 10 wt%.B4C2.912.993.16
Sintering Temperature 575 °C and 10 wt%.B4C3.033.093.25
7Compaction Pressure
300 MPa
Compaction Pressure
400 MPa
Compaction Pressure
500 MPa
Sintering Temperature 375 °C and 15 wt%.B4C2.892.893.07
Sintering Temperature 375 °C and 15 wt%.B4C2.963.083.20
Sintering Temperature 375 °C and 15 wt%.B4C3.113.193.32
8Compaction Pressure
300 MPa
Compaction Pressure
400 MPa
Compaction Pressure
500 MPa
Sintering Temperature 475 °C and 15 wt%.B4C2.922.943.15
Sintering Temperature 475 °C and 15 wt%.B4C3.053.153.27
Sintering Temperature 475 °C and 15 wt%.B4C3.193.283.39
9Compaction Pressure
300 MPa
Compaction Pressure
400 MPa
Compaction Pressure
500 MPa
Sintering Temperature 575 °C and 15 wt%.B4C2.972.963.20
Sintering Temperature 575 °C and 15 wt%.B4C3.093.243.33
Sintering Temperature 575 °C and 15 wt%.B4C3.233.313.45
Table 2. Effect of PM parameters on micro hardness at different compaction pressure (300, 400, and 500 MPa), different sintering time (1, 2, and 3 h), different sintering temperature (375, 475, and 575 °C), and different reinforcement weight percentages (5 wt%., 10 wt%., and 15 wt%.B4C).
1Compaction Pressure
300 MPa
Compaction Pressure
400 MPa
Compaction Pressure
500 MPa
Sintering Time 1 hSintering Time 2 hSintering Time 3 h
Sintering Temperature 375 °C and 5 wt%.B4C141.59144.72147.09
Sintering Temperature 375 °C and 5 wt%.B4C145.70147.92149.88
Sintering Temperature 375 °C and 5 wt%.B4C147.66148.66151.25
2Compaction Pressure
300 MPa
Compaction Pressure
400 MPa
Compaction Pressure
500 MPa
Sintering Temperature 375 °C and 5 wt%.B4C137.9145.27147.82
Sintering Temperature 375 °C and 5 wt%.B4C140.85146.75149.73
Sintering Temperature 375 °C and 5 wt%.B4C147154.35159.18
3Compaction Pressure
300 MPa
Compaction Pressure
400 MPa
Compaction Pressure
500 MPa
Sintering Temperature 375 °C and 5 wt%.B4C133.27115.92120.09
Sintering Temperature 375 °C and 5 wt%.B4C167.30135.24145.75
Sintering Temperature 375 °C and 5 wt%.B4C148.21112.62133.41
4Compaction Pressure
300 MPa
Compaction Pressure
400 MPa
Compaction Pressure
500 MPa
Sintering Temperature 375 °C and 10 wt%.B4C138.97122.75116.32
Sintering Temperature 375 °C and 10 wt%.B4C143.89120.45119.66
Sintering Temperature 375 °C and 10 wt%.B4C146.71118.85122.02
5Compaction Pressure
300 MPa
Compaction Pressure
400 MPa
Compaction Pressure
500 MPa
Sintering Temperature 375 °C and 10 wt%.B4C141.71164.85157
Sintering Temperature 375 °C and 10 wt%.B4C148.32165.11162.53
Sintering Temperature 375 °C and 10 wt%.B4C152.38167164
6Compaction Pressure
300 MPa
Compaction Pressure
400 MPa
Compaction Pressure
500 MPa
Sintering Temperature 375 °C and 10 wt%.B4C148.52129.25136.06
Sintering Temperature 375 °C and 10 wt%.B4C154.70130.11142.70
Sintering Temperature 375 °C and 10 wt%.B4C158.71132.41149.82
7Compaction Pressure
300 MPa
Compaction Pressure
400 MPa
Compaction Pressure
500 MPa
Sintering Temperature 375 °C and 10 wt%.B4C161.56133.77139.65
Sintering Temperature 375 °C and 10 wt%.B4C163.87145.69150
Sintering Temperature 375 °C and 10 wt%.B4C166.01149.02151.77
8Compaction Pressure
300 MPa
Compaction Pressure
400 MPa
Compaction Pressure
500 MPa
Sintering Temperature 375 °C and 10 wt%.B4C154.84161.32167.02
Sintering Temperature 375 °C and 10 wt%.B4C163.55170.92184.41
Sintering Temperature 375 °C and 10 wt%.B4C174.20178.61182.66
9Compaction Pressure
300 MPa
Compaction Pressure
400 MPa
Compaction Pressure
500 MPa
Sintering Temperature 375 °C and 10 wt%.B4C150.44146165.98
Sintering Temperature 375 °C and 10 wt%.B4C159.14153.76169.08
Sintering Temperature 375 °C and 10 wt%.B4C163158.03173
Table 3. Effect of PM parameters on compressive strength at different compaction pressure (300, 400, and 500 MPa), different sintering time (1, 2, and 3 h), different sintering temperature (375, 475, and 575 °C), and different reinforcement weight percentages (5 wt%., 10 wt%., and 15 wt%.B4C).
1Compaction Pressure
300 MPa
Compaction Pressure
400 MPa
Compaction Pressure
500 MPa
Sintering Time 1 hSintering Time 2 hSintering Time
3 h
Sintering Temperature 375 °C and 5 wt%.B4C125.49127.04117.32
Sintering Temperature 375 °C and 5 wt%.B4C132.53131.48109.77
Sintering Temperature 375 °C and 5 wt%.B4C137.66140105.33
2Compaction Pressure
300 MPa
Compaction Pressure
400 MPa
Compaction Pressure
500 MPa
Sintering Temperature 475 °C and 5 wt%.B4C130.66137.74142.55
Sintering Temperature 475 °C and 5 wt%.B4C141144.66149
Sintering Temperature 475 °C and 5 wt%.B4C156.03160.93165.53
3Compaction Pressure
300 MPa
Compaction Pressure
400 MPa
Compaction Pressure
500 MPa
Sintering Temperature 575 °C and 5 wt%.B4C132.67135.53140.05
Sintering Temperature 575 °C and 5 wt%.B4C142147.75152.90
Sintering Temperature 575 °C and 5 wt%.B4C151.55157.11163
4Compaction Pressure
300 MPa
Compaction Pressure
400 MPa
Compaction Pressure
500 MPa
Sintering Temperature 375 °C and 10 wt%.B4C108.09107106.03
Sintering Temperature 375 °C and 10 wt%.B4C117.07112.79110.64
Sintering Temperature 375 °C and 10 wt%.B4C121.88120.41116.22
5Compaction Pressure
300 MPa
Compaction Pressure
400 MPa
Compaction Pressure
500 MPa
Sintering Temperature 475 °C and 10 wt%.B4C130.66110.81138.07
Sintering Temperature 475 °C and 10 wt%.B4C135.04122.66145.98
Sintering Temperature 475 °C and 10 wt%.B4C141.06129.32155.11
6Compaction Pressure
300 MPa
Compaction Pressure
400 MPa
Compaction Pressure
500 MPa
Sintering Temperature 575 °C and 10 wt%.B4C144.23139.44136.06
Sintering Temperature 575 °C and 10 wt%.B4C154.77146.62142.12
Sintering Temperature 575 °C and 10 wt%.B4C159.03148145.88
7Compaction Pressure
300 MPa
Compaction Pressure
400 MPa
Compaction Pressure
500 MPa
Sintering Temperature 375 °C and 15 wt%.B4C139.09141133.16
Sintering Temperature 375 °C and 15 wt%.B4C143.22147.19136.42
Sintering Temperature 375 °C and 15 wt%.B4C149.18152.88145.02
8Compaction Pressure
300 MPa
Compaction Pressure
400 MPa
Compaction Pressure
500 MPa
Sintering Temperature 475 °C and 15 wt%.B4C151.12126.42147.33
Sintering Temperature 475 °C and 15 wt%.B4C156.29139.02150.06
Sintering Temperature 475 °C and 15 wt%.B4C164.33148.04157.83
9Compaction Pressure
300 MPa
Compaction Pressure
400 MPa
Compaction Pressure
500 MPa
Sintering Temperature 575 °C and 15 wt%.B4C149.33159.36122.12
Sintering Temperature 575 °C and 15 wt%.B4C156.88167.41135.81
Sintering Temperature 575 °C and 15 wt%.B4C161.10171143.04
Publisher’s Note: MDPI stays neutral with regard to jurisdictional claims in published maps and institutional affiliations.

