Experimental-Analytical Method for Temperature Determination in the Cutting Zone during Orthogonal Turning of GRADE 2 Titanium Alloy
Abstract
:1. Introduction
2. Methodology
3. Materials and Methods
3.1. Material
3.2. Methods
3.3. Experiment Details
4. Results
5. Conclusions
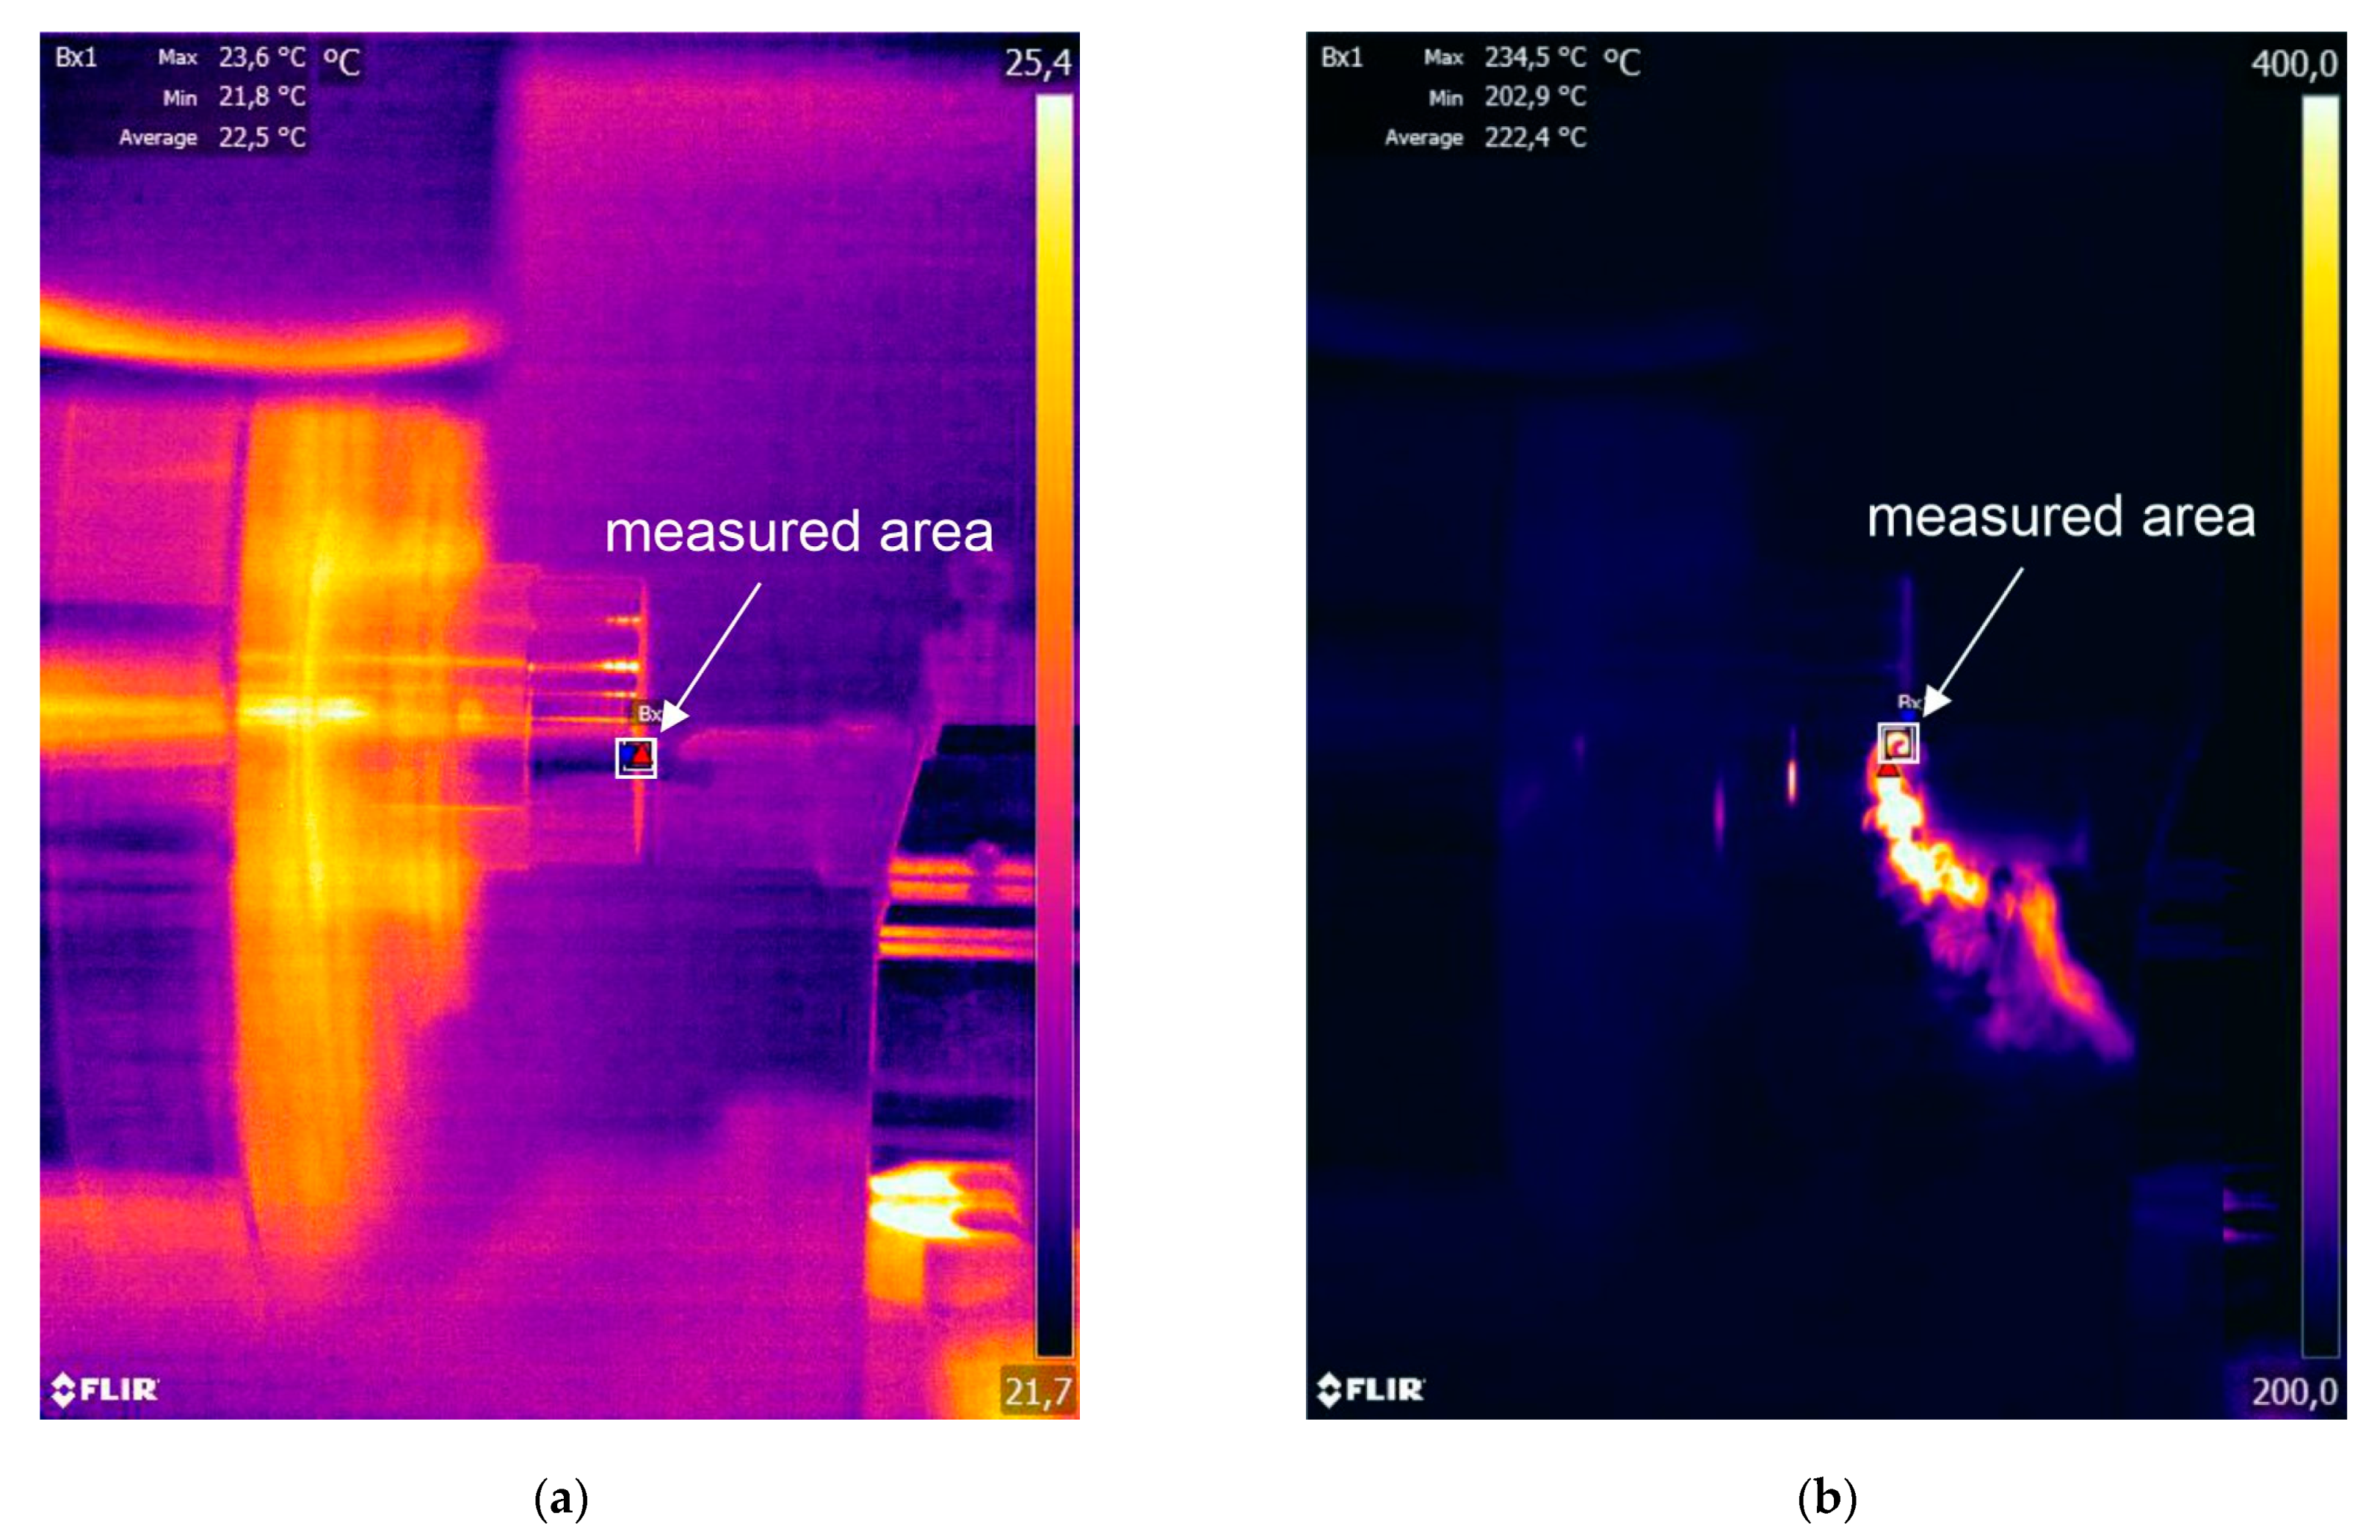
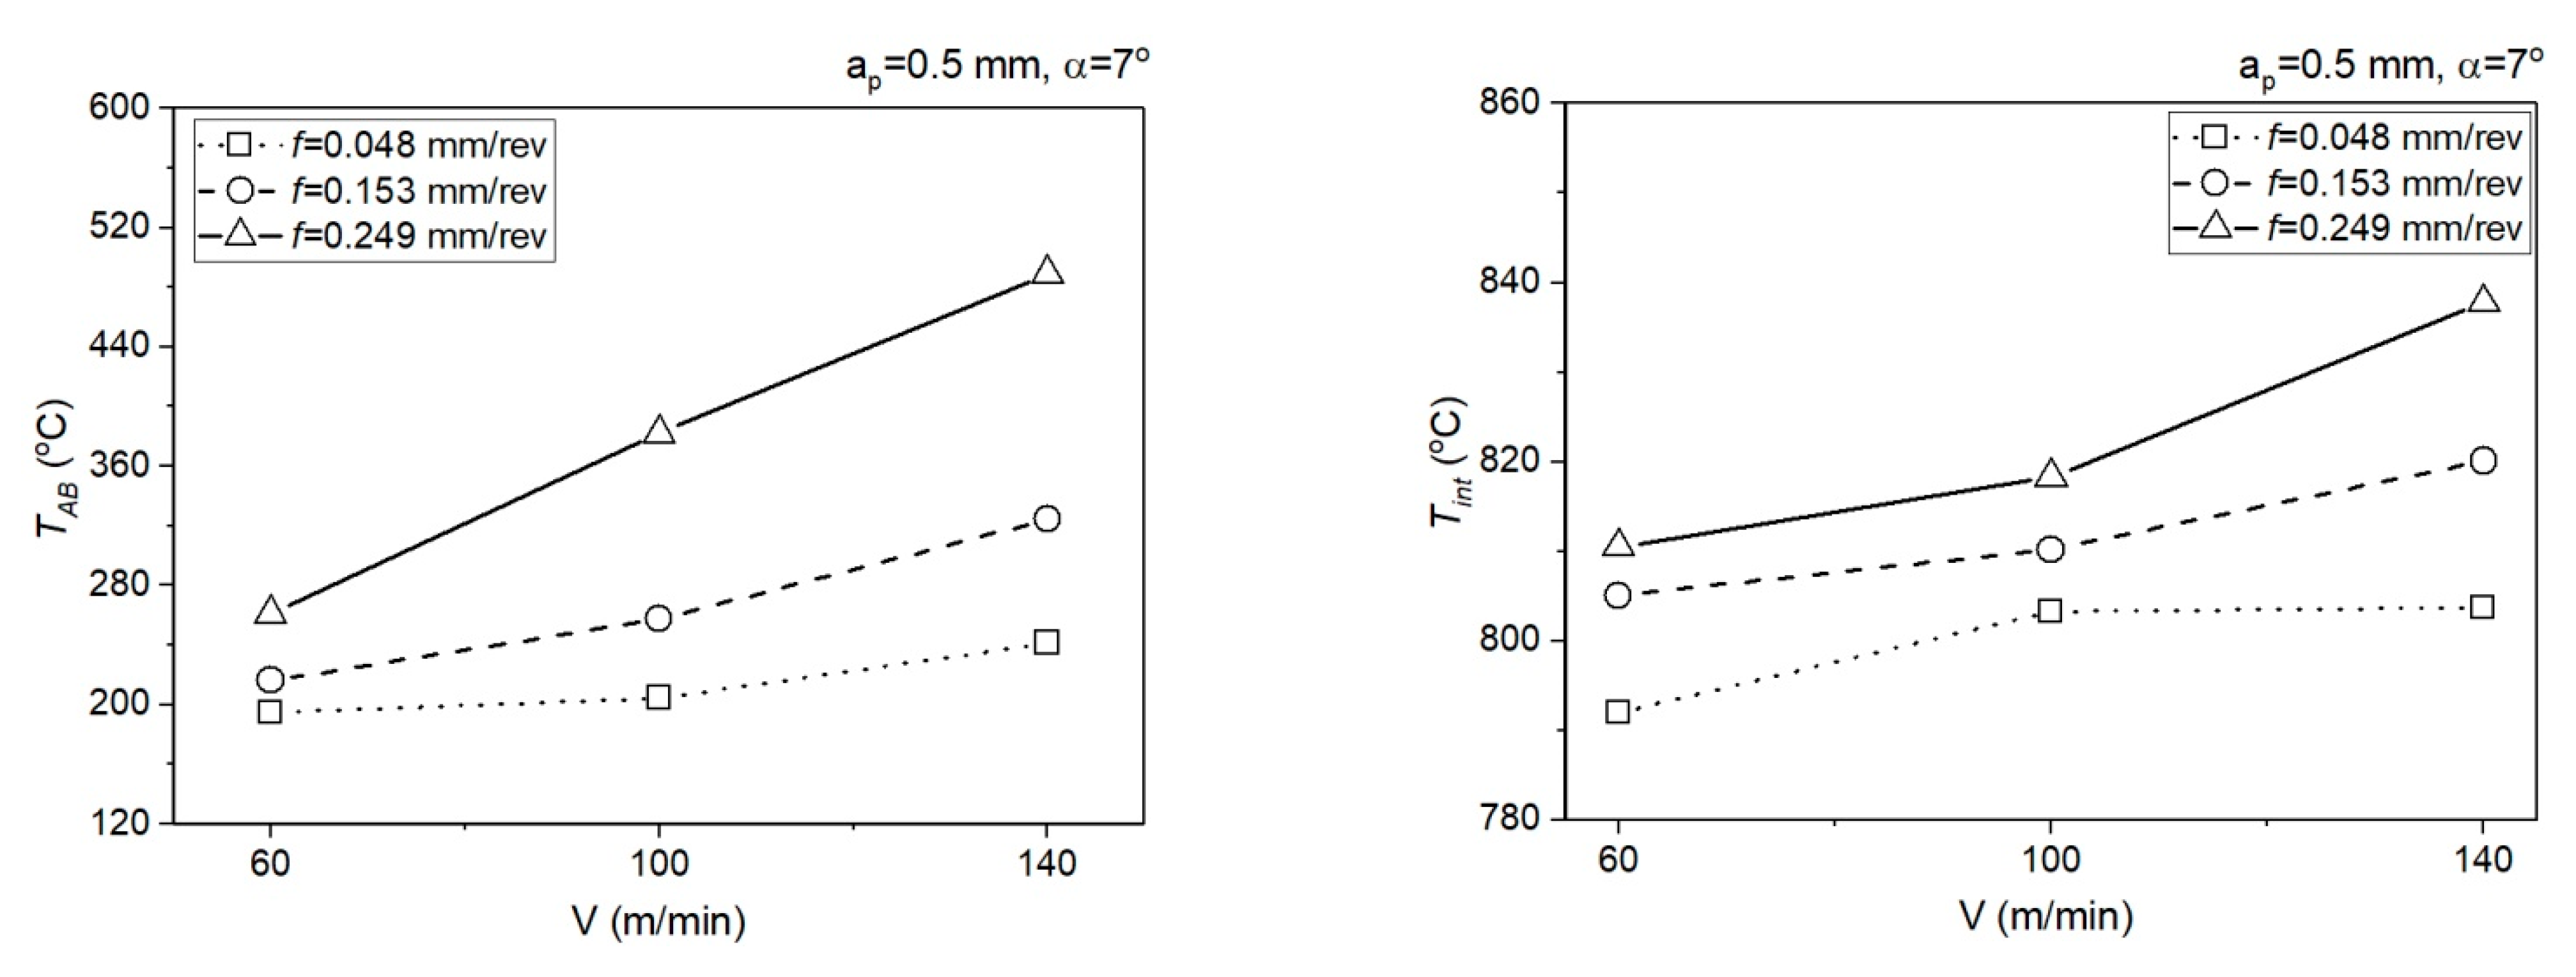
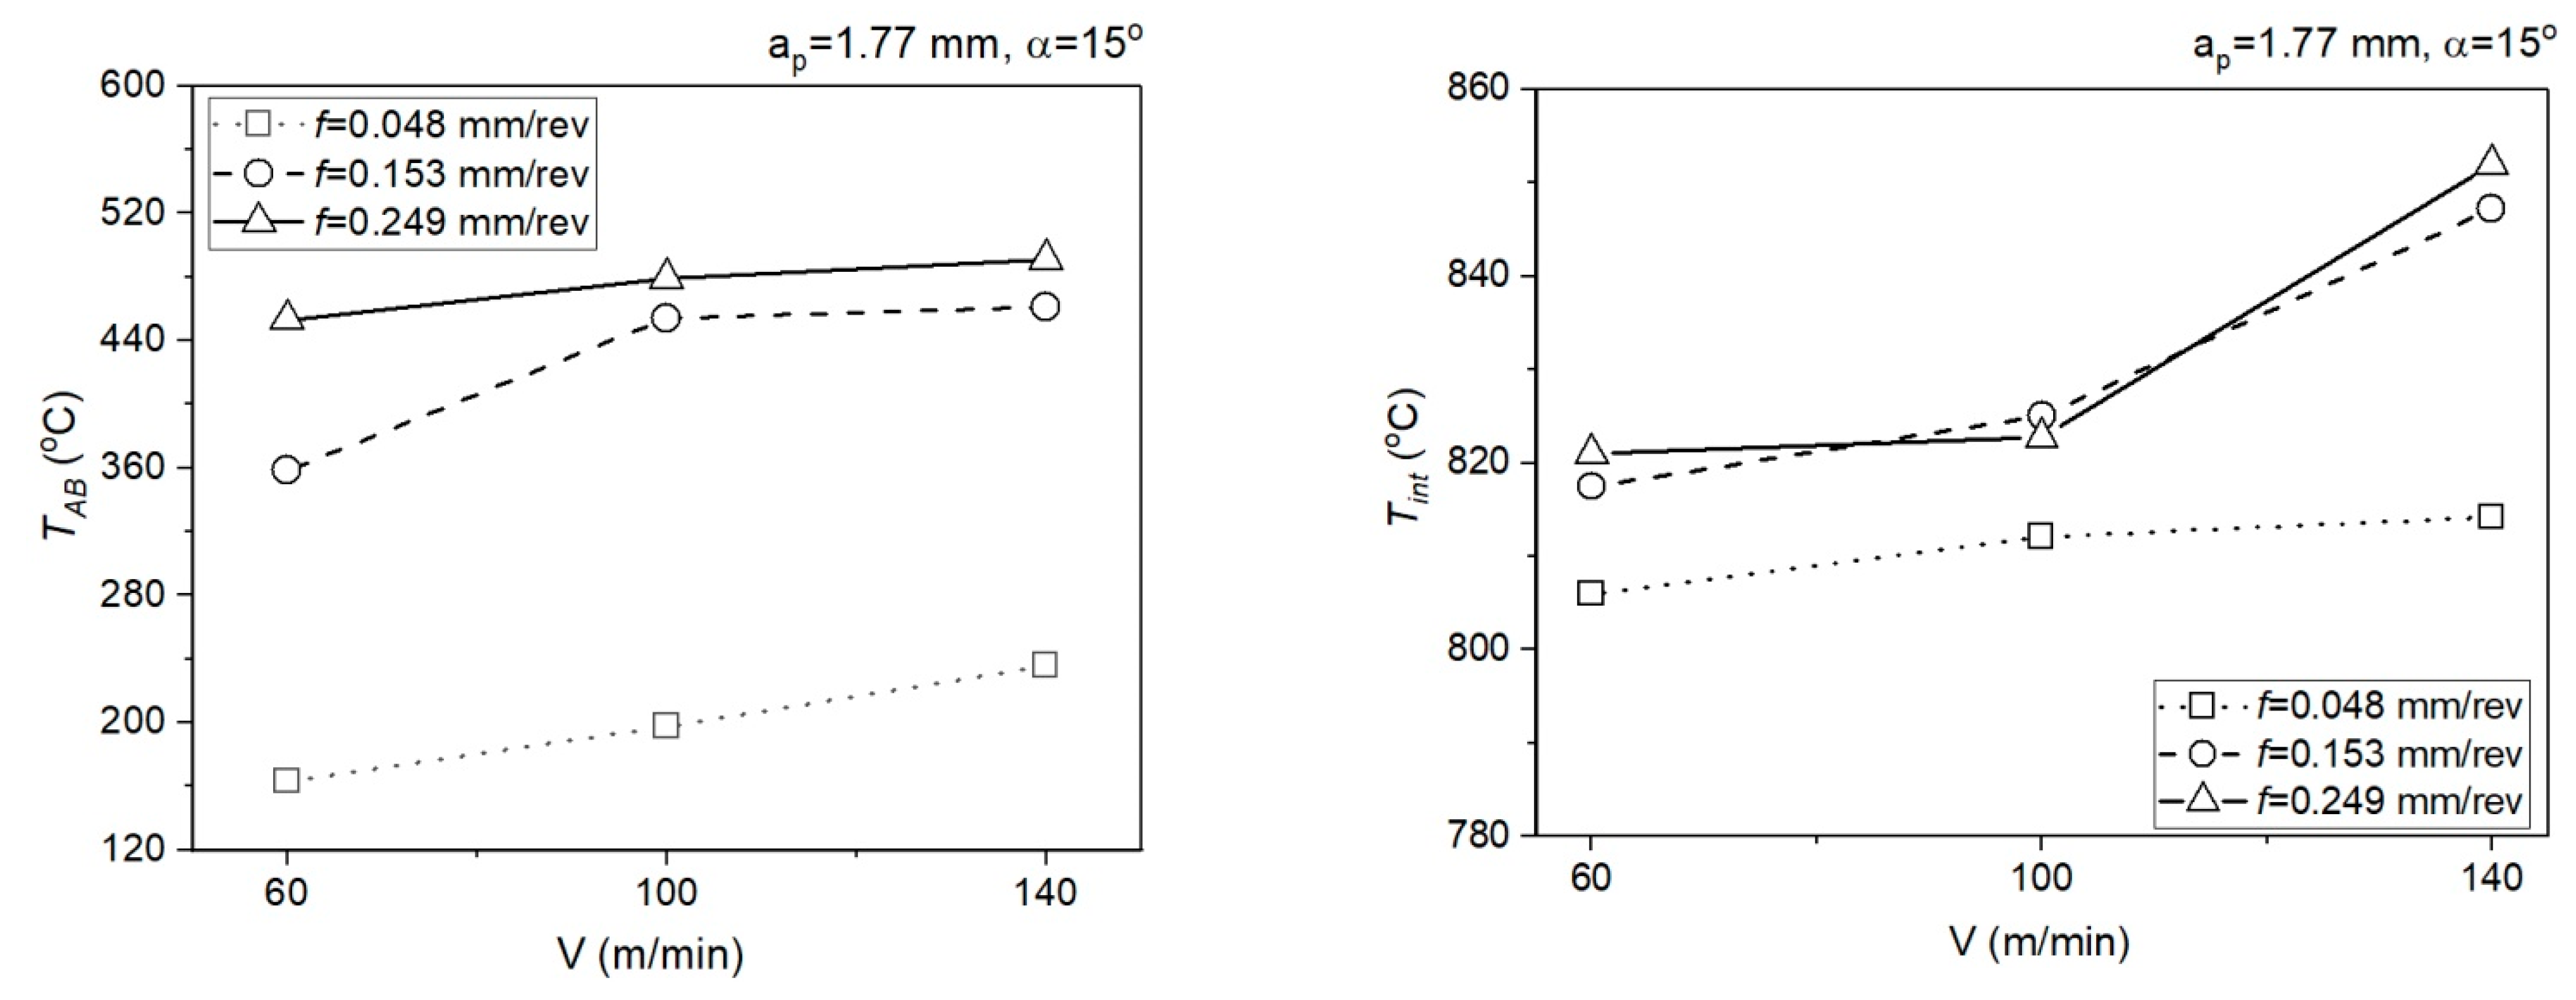
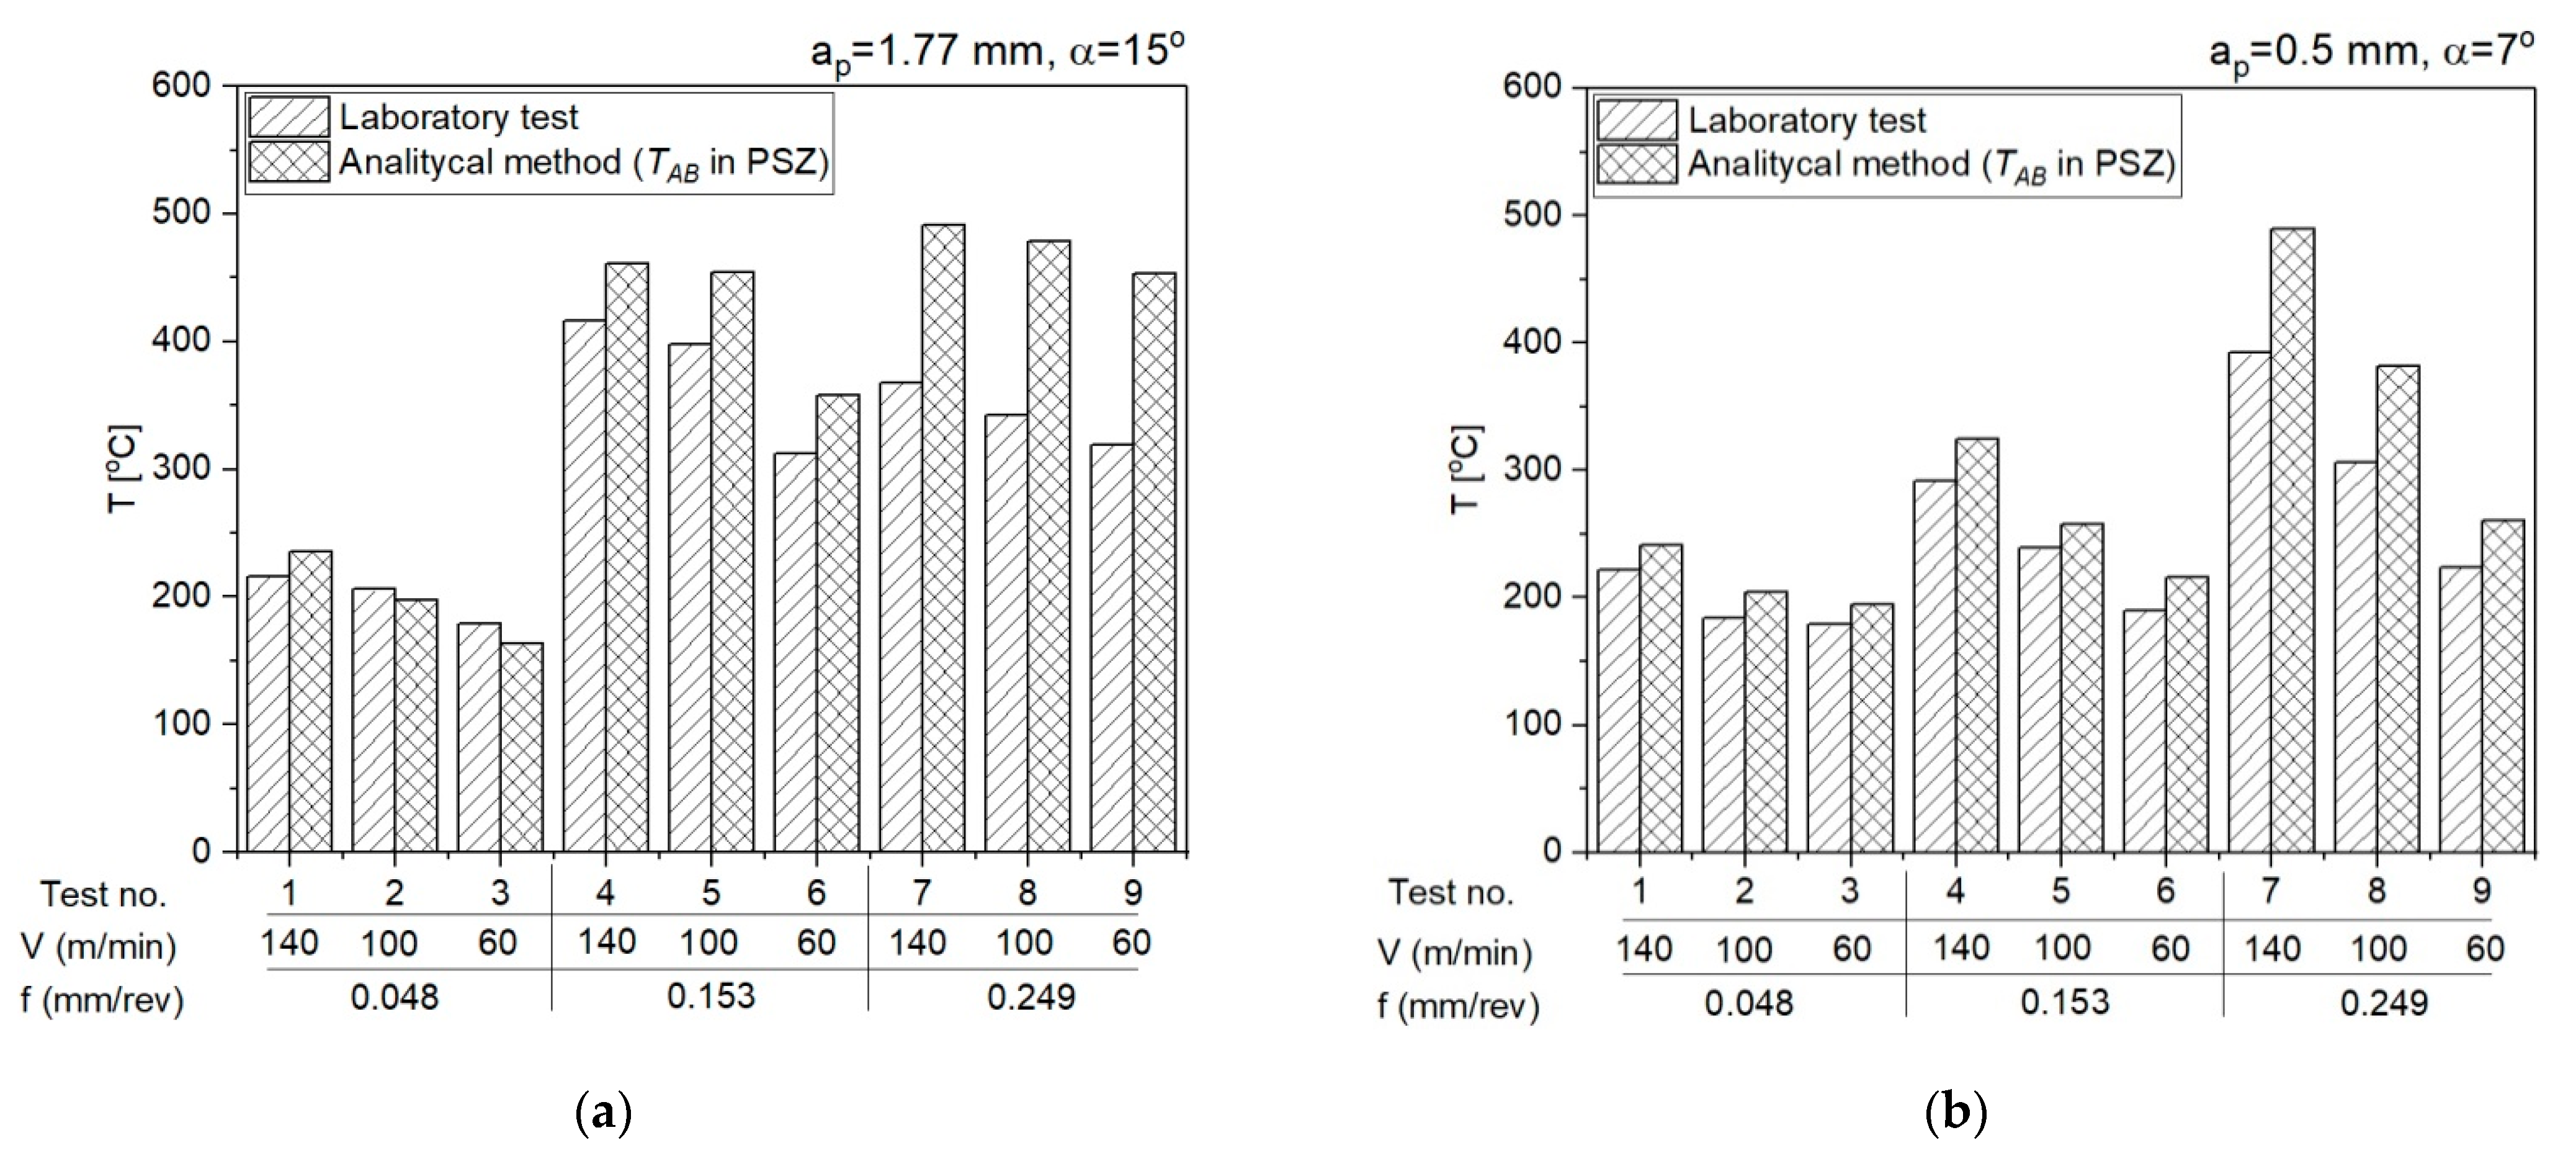
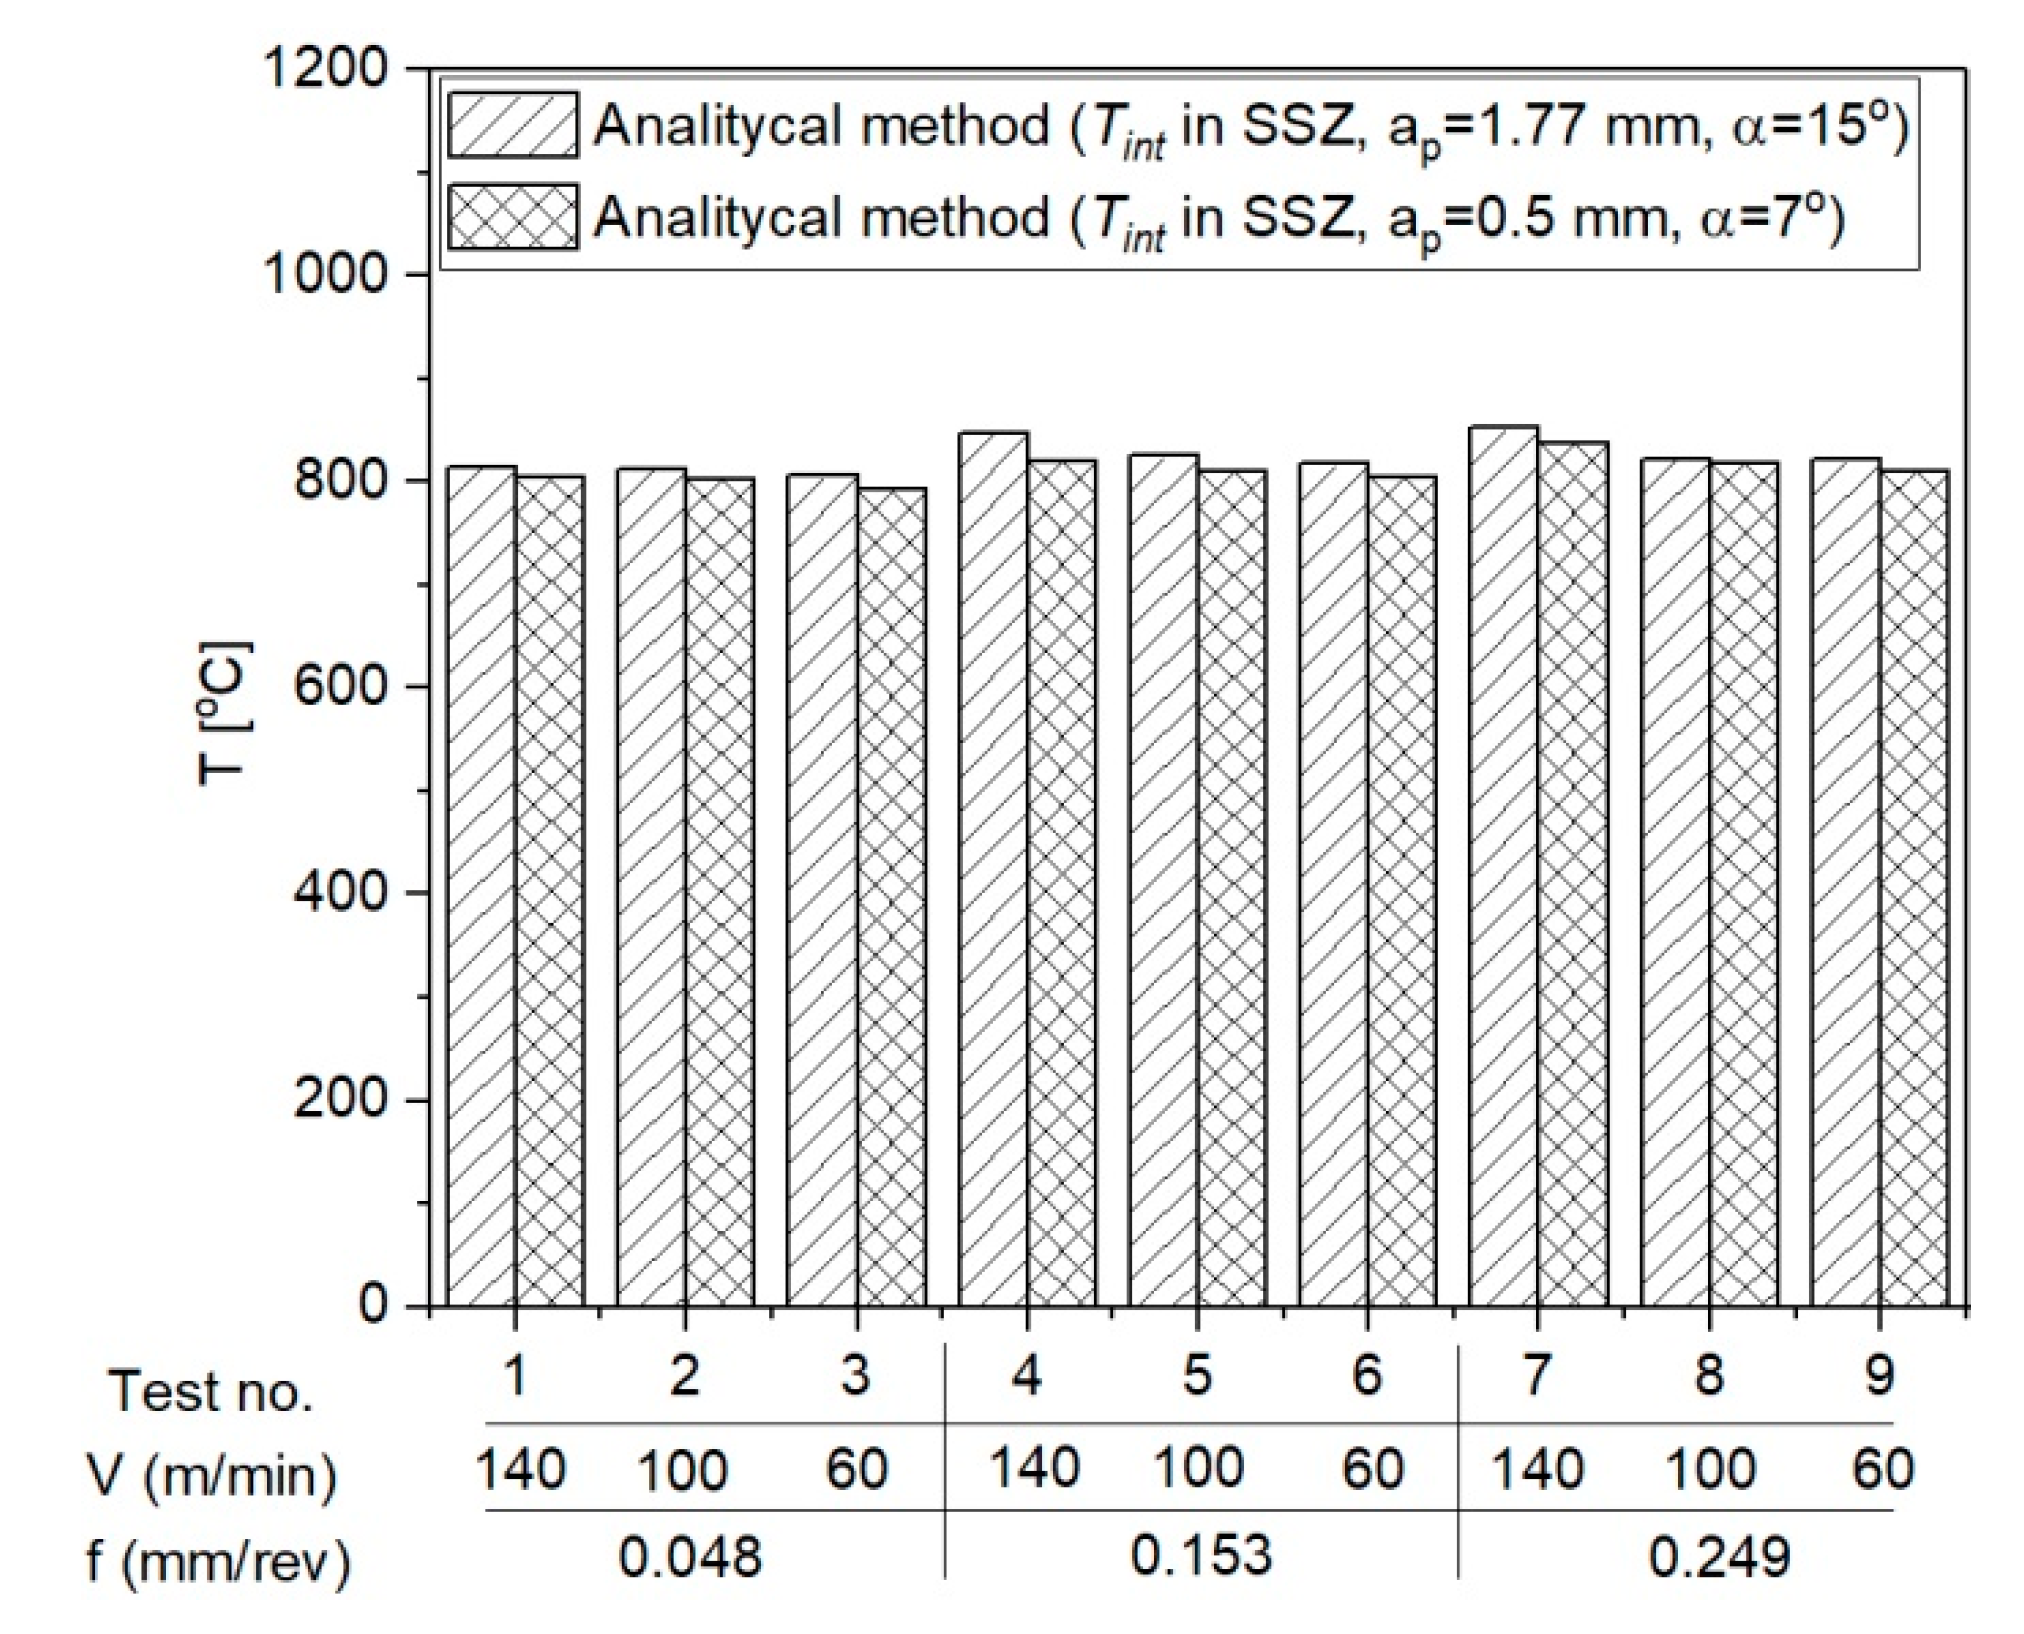
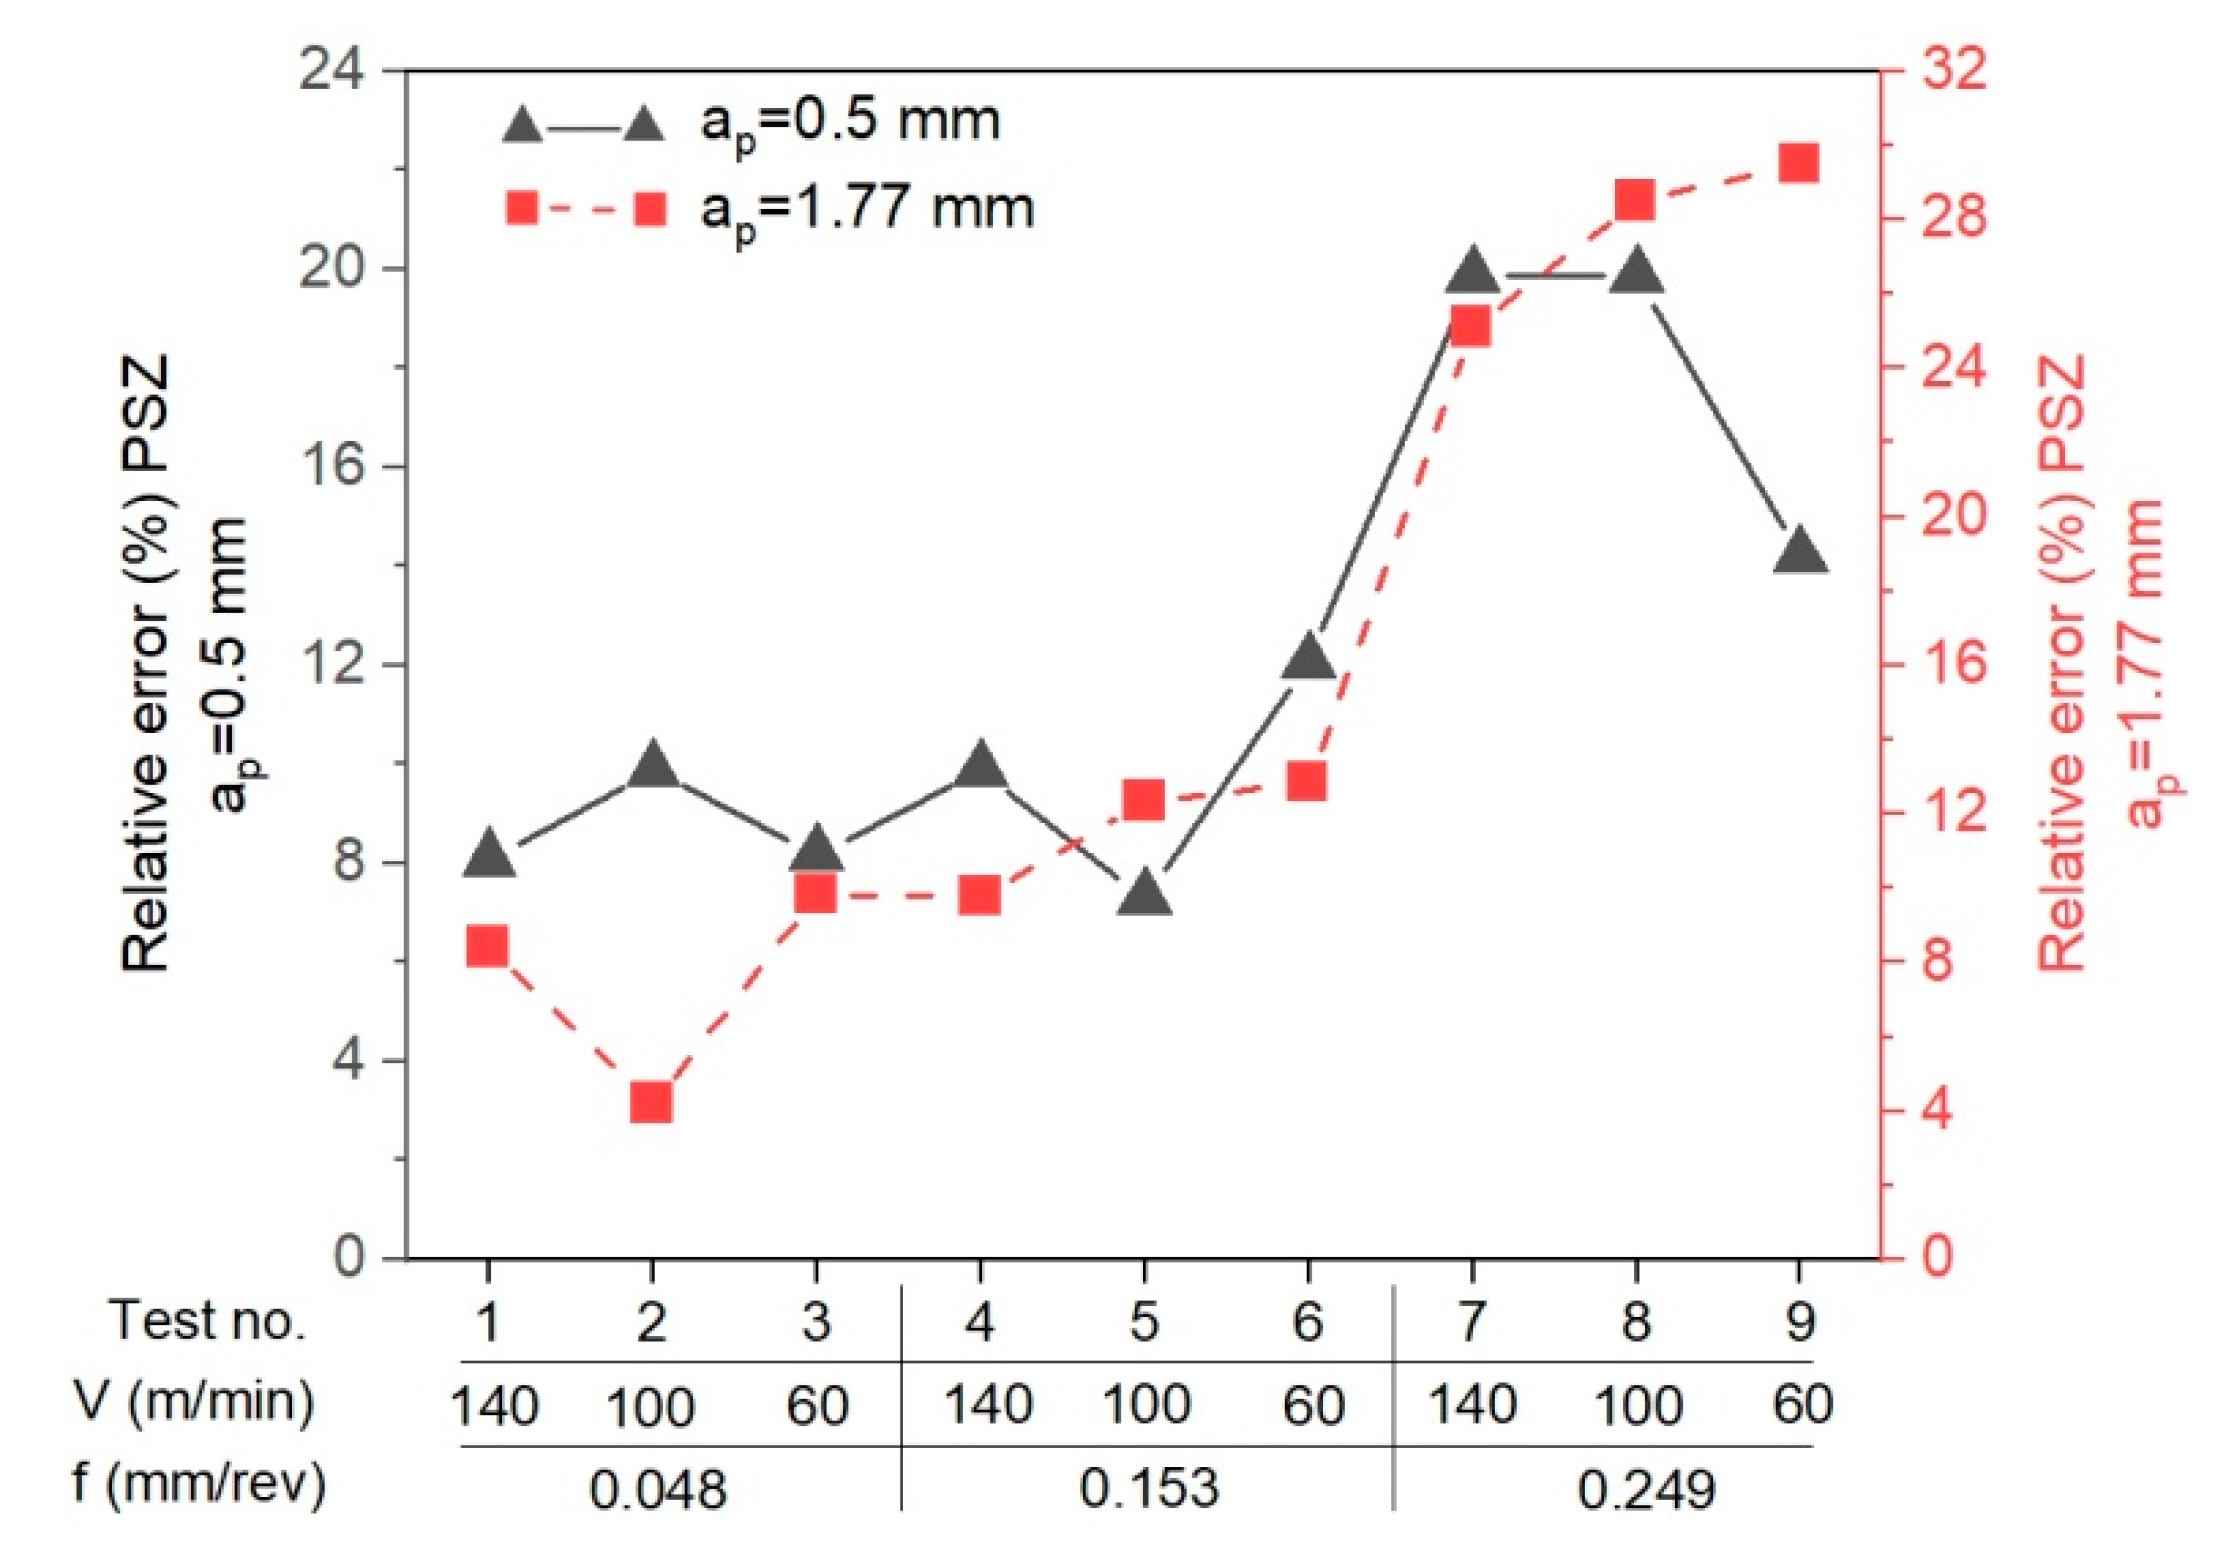
- The calculation algorithm for determination of the mean temperature in the PSZ and SSZ was implemented in the VBasic MS EXCEL environment. The mean temperature values in the PSZ determined using the developed method correspond to the experimental results. The verification of results obtained analytically with the measurements conducted with the thermovision camera indicates the conformity of results for smaller feedrates (f = 0.048 mm/rev and f = 0.153 mm/rev). The maximum relative error between the results from calculations and the results from measurements with the thermovision camera in PSZ is 13%. For feedrate f = 0.249 mm/rev, the maximum error is greater and equal to 29%. Probably, the greater difference between the calculated temperature and the measured temperature results from the larger cross-section of the cutting zone and the larger chip heat capacity.
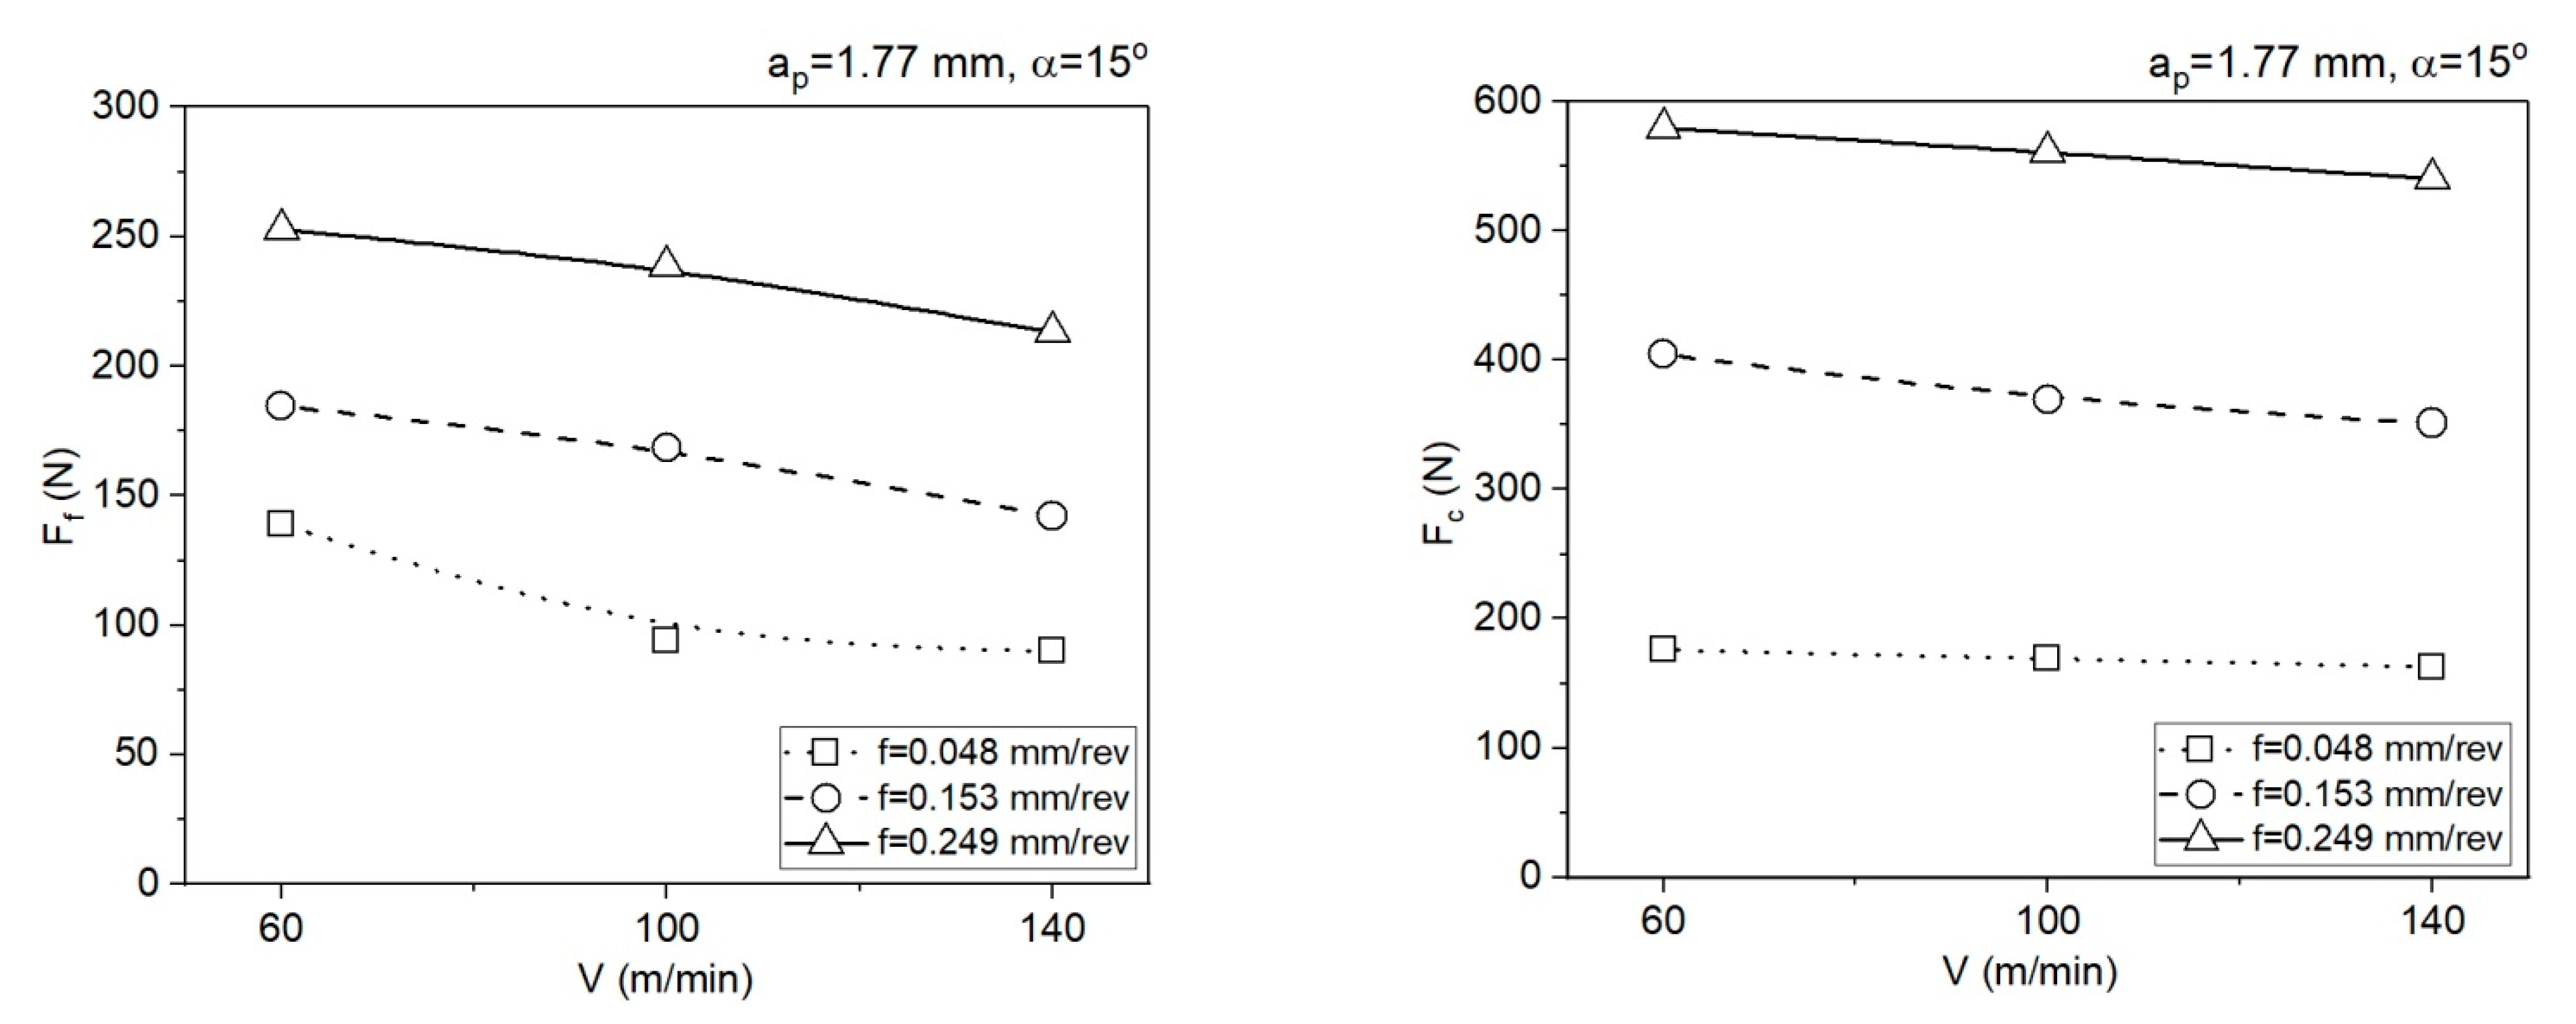
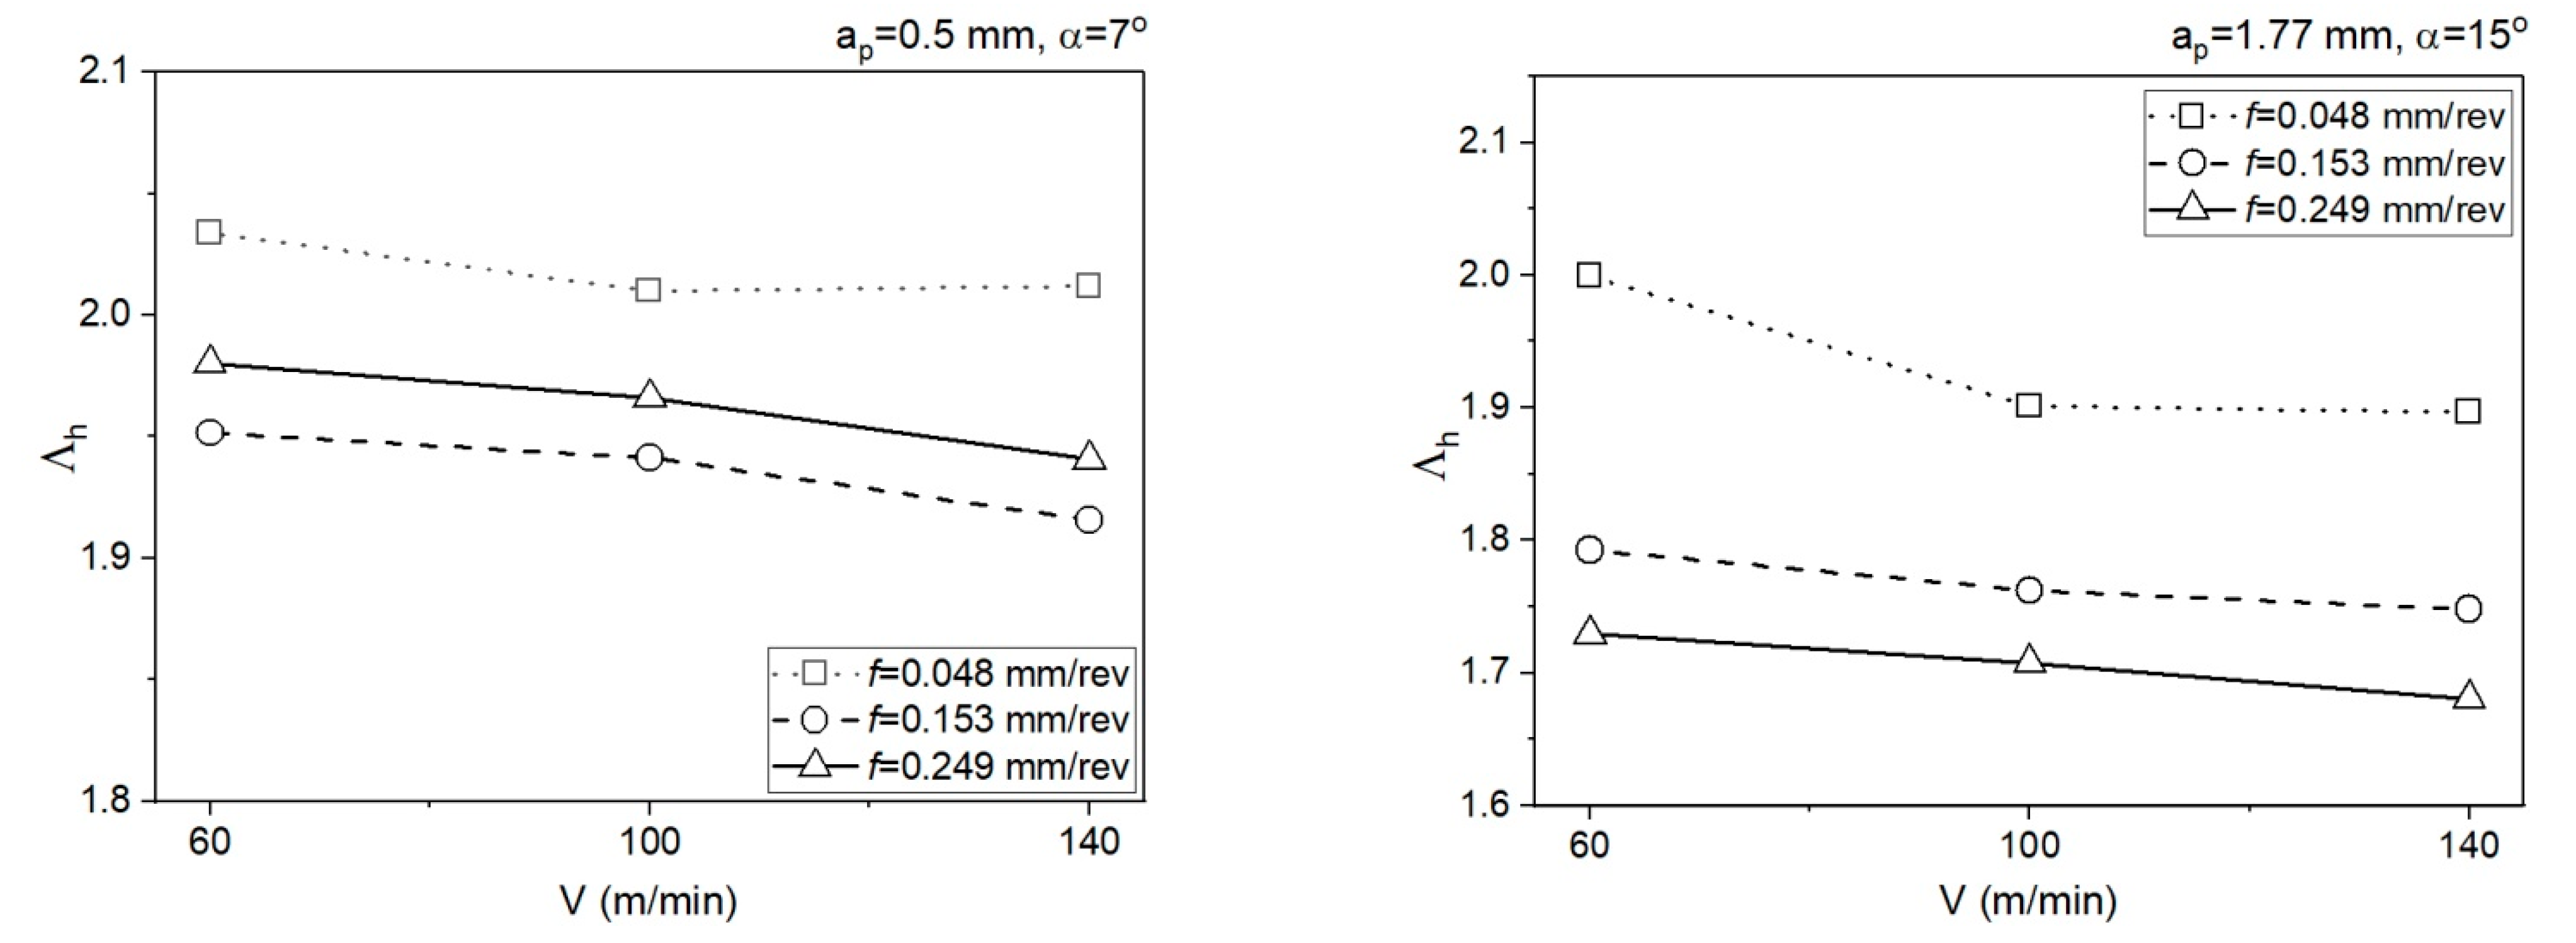
- The different shapes of cutting insert face in the two analysed areas translate to different chip flow speeds Vc and chip compression ratios. In area 1 (ap = 0.5 mm, α = 7°), the chip compression ratio is greater in area 2 (ap = 1.77 mm, α = 15°). The increase of the chip compression ratio in area 1 relative to area 2 is 1.2–15.5%, depending on the feedrate. Undoubtedly, the greater chip compression ratio in area 1 increases the stresses in this area in the PSZ and SSZ. The shear stresses in the PSZ in area 1 increase relative to area 2 by 1.9–26.2%, depending on the feedrate. In the SSZ, the shear stresses in area 1 increase relative to area 2 by 20.3–115.5%, but the increase of normal stresses is greater by 29.4–127.4%, depending on the feedrate.
- The correct selection of the J-C equation constants is important for obtaining the high degree of temperature prediction accuracy in the cutting zone. Several sets of constants available in the literature have been analysed in the course of the study, but only the set included in the paper was used in the presented method.
- The application of the method in two different areas of the cutting insert rake face allows a better understanding of the relationship between the cutting forces, insert face geometry, and the temperature values in the PSZ and SSZ.
Funding
Institutional Review Board Statement
Informed Consent Statement
Data Availability Statement
Conflicts of Interest
Nomenclature
| PSZ | primary shear zone (with subscript AB) |
| SSZ | secondary shear zone or tool–chip interface (with subscript int) |
| A; B; C; m; n | yield strength; strength coefficient; strain rate coefficient; thermal softening coefficient; and strain hardening coefficient in the J–C model |
| Tm; Tr; T | melting temperature; room temperature; temperature |
| TAB; Tint | calculated average temperature at the PSZ and SSZ |
| V; Vc; Vs | cutting velocity; chip velocity; shear velocity |
| α; φ; λ; θ | rake angle; shear angle; friction angle at the SSZ; angle between resultant force R and the PSZ |
| w (ap); t1; t2 | width of cut; depth of cut; and chip thickness |
| lAB; h | length of the PSZ; the length of the SSZ (tool–chip contact length) |
| ; ; ; | strains and strain rates at the PSZ and SSZ |
| = 1 | reference strain rate |
| C0 | Oxley’s constants (ratio of the shear plane length to the thickness of the PSZ) |
| δ | strain rate constant (ratio of the thickness of the SSZ to chip thickness) |
| neq | strain hardening constant |
| k’AB | calculated shear stress at the PSZ using the J–C model |
| kAB | calculated shear stress at the PSZ using a mechanics model |
| kint | calculated shear stress at the SSZ using the J–C model |
| τint | calculated shear stress at the SSZ using a mechanics model |
| σN | calculated normal stress at the SSZ using a mechanics model |
| σ’N | calculated normal stress at the SSZ using the J–C model |
| Fc | cutting force |
| Ft | thrust force |
| Fs | shear force at the PSZ |
| Ns | normal force at the PSZ |
| F | shear force at the SSZ |
| N | normal force at the SSZ |
| R | resultant force |
| Pf | friction power |
| chip compression ratio for SSZ | |
| D | relative error for the results from the analytical method and the results from the IR measurements |
References
- Karpat, Y.; Özel, T. Predictive analytical and thermal modeling of orthogonal cutting process—part I: Predictions of tool forces, stresses, and temperature distributions. J. Manuf. Sci. Eng. 2006, 128, 435–444. [Google Scholar] [CrossRef]
- Karpat, Y.; Özel, T. Predictive analytical and thermal modeling of orthogonal cutting process—part II: Effect of tool flank wear on tool forces, stresses, and temperature distributions. J. Manuf. Sci. Eng. 2006, 128, 445–453. [Google Scholar] [CrossRef]
- Stephenson, D.A.; Ali, A. Tool temperatures in interrupted metal cutting. J. Eng. Ind. 1992, 114, 127–136. [Google Scholar] [CrossRef]
- Chen, W.C.; Tsao, C.C.; Liang, P.W. Determination of temperature distributions on the rake face of cutting tools using a remote method. Int. Commun. Heat Mass Transf. 1997, 24, 161–170. [Google Scholar] [CrossRef]
- Levy, E.K.; Tsai, C.L.; Groover, M.P. Analytical investigation of the effect of tool wear on the temperature variations in a metal cutting tool. J. Eng. Ind. 1976, 98, 251–257. [Google Scholar] [CrossRef]
- Wiener, J.H. Shear-plane temperature distribution in orthogonal cutting. Trans. ASME 1955, 77, 1331–1341. [Google Scholar]
- Boothroyd, G. Fundamentals of Metal Machining and Machine Tools; Scripta Book Company: Washington, DC, USA, 1975; ISBN 9780070064980. [Google Scholar]
- Davies, M.A.; Ueda, T.; M’Saoubi, R.; Mullany, B.; Cooke, A.L. The Measurement of Temperature in Material Removal Processes. CIRP Ann. 2007, 5, 581–604. [Google Scholar] [CrossRef]
- Nedić, B.P.; Erić, M.D. Cutting Temperature Measurement and Material Machinability. Therm. Sci. 2014, 18, 259–268. [Google Scholar] [CrossRef] [Green Version]
- Sugita, N.; Ishii, K.; Furusho, T.; Harada, K.; Mitsubishi, M. Cutting temperature measurement by a micro-sensor array integrated on the rake face of a cutting tool. CIRP Ann. 2015, 64, 77–80. [Google Scholar] [CrossRef]
- Basti, A.; Obikawa, T.; Shinozuka, J. Tools with built-in thin film thermocouple sensors for monitoring cutting temperature. Int. J. Mach. Tools Manuf. 2007, 47, 793–798. [Google Scholar] [CrossRef]
- Da Silva, M.B.; Wallbank, J. Cutting temperature: Prediction and measurement methods—A review. J. Mater. Process. Technol. 1999, 88, 195–202. [Google Scholar] [CrossRef]
- Longbottom, J.M.; Lanham, J.D. Cutting temperature measurement while machining—A review. Aircr. Eng. Aerosp. Technol. 2005, 77, 122–130. [Google Scholar] [CrossRef]
- Danish, M.; Ginta, T.L.; Habib, K.; Carou, D.; Rani, A.M.A.; Saha, B.B. Thermal analysis during turning of AZ31 magnesium alloy under dry and cryogenic conditions. Int. J. Adv. Manuf. Technol. 2017, 91, 2855–2868. [Google Scholar] [CrossRef]
- O’sullivan, D.; Cotterell, M. Temperature measurement in single point turning. J. Mater. Process. Technol. 2001, 118, 301–308. [Google Scholar] [CrossRef]
- Leshock, C.E.; Shin, Y.C. Investigation on cutting temperature in turning by a tool-work thermocouple technique. J. Manuf. Sci. Eng. 1997, 119, 502–508. [Google Scholar] [CrossRef]
- Sutter, G.; Faure, L.; Molinari, A.; Ranc, N.; Pina, V. An experimental technique for the measurement of temperature fields for the orthogonal cutting in high speed machining. Int. J. Mach. Tool Manuf. 2003, 43, 671–678. [Google Scholar] [CrossRef] [Green Version]
- Kato, S.; Yamaguchi, K.; Watanabe, Y.; Hiraiwa, Y. Measurement of temperature distribution within tool using powders of constant melting point. J. Eng. Ind. 1976, 98, 607–613. [Google Scholar] [CrossRef]
- Arrazola, P.-J.; Aristimuno, P.; Soler, D.; Childs, T. Metal cutting experiments and modelling for improved determination of chip/tool contact temperature by infrared thermography. CIRP Ann. 2015, 64, 57–60. [Google Scholar] [CrossRef]
- Davies, M.; Cao, Q.; Cooke, A.; Ivester, R. On the Measurement and Prediction of Temperature Fields in Machining AISI 1045 Steel. CIRP Ann. 2003, 52, 77–80. [Google Scholar] [CrossRef]
- Abouridouane, M.; Klocke, F.; Döbbeler, B. Analytical temperature prediction for cutting steel. CIRP Ann. 2016, 65, 77–80. [Google Scholar] [CrossRef]
- Ning, J.; Liang, S. Prediction of Temperature Distribution in Orthogonal Machining Based on the Mechanics of the Cutting Process Using a Constitutive Model. J. Manuf. Mater. Process. 2018, 2, 37. [Google Scholar] [CrossRef] [Green Version]
- Lalwani, D.I.; Mehta, N.K.; Jain, P.K. Extension of Oxley’s predictive machining theory for Johnson and Cook flow stress model. J. Mater. Process Technol. 2009, 209, 5305–5312. [Google Scholar] [CrossRef]
- Adibi-Sedeh, A.H.; Madhavan, V.; Bahr, B. Extension of Oxley’s analysis of machining to use different material models. J. Manuf. Sci. Eng. 2003, 125, 656–666. [Google Scholar] [CrossRef] [Green Version]
- Komanduri, R.; Hou, Z.B. Thermal modeling of the metal cutting process—Part III: Temperature rise distribution due to the combined effects of shear plane heat source and the tool–chip interface frictional heat source. Int. J. Mech. Sci. 2001, 43, 89–107. [Google Scholar] [CrossRef]
- Shalaby, M.A.; El Hakim, M.A.; Veldhuis, S.C. A thermal model for hard precision turning. Int. J. Adv. Manuf. Technol. 2018, 98, 2401–2413. [Google Scholar] [CrossRef]
- Ning, J.; Liang, S. Evaluation of an Analytical Model in the Prediction of Machining Temperature of AISI 1045 Steel and AISI 4340 Steel. J. Manuf. Mater. Process. 2018, 2, 74. [Google Scholar] [CrossRef] [Green Version]
- Chen, Y.; Li, H.; Wang, J. Further Development of Oxley’s Predictive Force Model for Orthogonal Cutting. Mach. Sci. Technol. 2015, 86–111. [Google Scholar] [CrossRef]
- Aidin, M. Cutting temperature analysis considering the improved Oxley’s predictive machining theory. J. Braz. Soc. Mech. Sci. Eng. 2016, 38, 2435–2448. [Google Scholar] [CrossRef]
- Gonzalo, O.; Jauregi, H.; Uriarte, L.G.; de Lacalle, L.L. Prediction of specific force coefficients from a FEM cutting model. Int. J. Adv. Manuf. Technol. 2009, 43, 348–356. [Google Scholar] [CrossRef]
- Özel, T.; Zeren, E. Finite element modeling the influence of edge roundness on the stress and temperature fields induced by high-speed machining. Int. J. Adv. Manuf. Technol. 2007, 35, 255–267. [Google Scholar] [CrossRef]
- Umbrello, D. Finite element simulation of conventional and high speed machining of Ti6Al4V alloy. J. Mater. Process Technol. 2008, 196, 79–87. [Google Scholar] [CrossRef]
- Liu, C.R.; Guo, Y.B. Finite element analysis of the effect of sequential cuts and tool–chip friction on residual stresses in a machined layer. Int. J. Mech. Sci. 2000, 42, 1069–1086. [Google Scholar] [CrossRef]
- List, G.; Sutter, G.; Bouthiche, A. Cutting temperature prediction in high speed machining by numerical modelling of chip formation and its dependence with crater wear. Int. J. Mach. Tools Manuf. 2012, 54–55, 1–9. [Google Scholar] [CrossRef]
- Ning, J.; Liang, S.Y. Predictive Modeling of Machining Temperatures with Force–Temperature Correlation Using Cutting Mechanics and Constitutive Relation. Materials 2019, 12, 284. [Google Scholar] [CrossRef] [PubMed] [Green Version]
- Ślusarczyk, Ł.; Franczyk, E. The experimental determination of cutting forces in a cutting zone during the orthogonal turning of a GRADE 2 titanium alloy tube. Tech. Trans. 2019, 183–194. [Google Scholar] [CrossRef] [Green Version]
- Gangireddy, S. A Modified Johnson-Cook Model. for Cp-Ti to Incorporate the Effects of Dynamic Strain Aging and Phase. Int. J. Metall. Met. Phys. 2018, 3, 1–11. [Google Scholar] [CrossRef] [Green Version]




| Symbol | Fe | C | N | O | H | Ti |
|---|---|---|---|---|---|---|
| GRADE 2 max | 0.30 | 0.08 | 0.03 | 0.25 | 0.015 | Bal |
| Melting Point (°C) | Density (kg × m−3) | Modulus of Elasticity (GPa) | Specific Heat Capacity (J × kg−1 × K−1) | Thermal Conductivity (W × m−1 × K−1) |
|---|---|---|---|---|
| ca. 1660 | 4510 | 105 | 526 | 16.4 |
| Symbol | Cutting Parameters | Parameter Values | ||
|---|---|---|---|---|
| A | f (mm/rev) | 0.048 | 0.153 | 0.249 |
| B | V (m/min) | 60 | 100 | 140 |
| Test No. | A | B | f (mm/rev) | V (m/min) | ap (mm) | α (degs) |
| 1 | 1 | 1 | 0.048 | 140 | 0.5 | 7 |
| 2 | 1 | 2 | 0.048 | 100 | 0.5 | 7 |
| 3 | 1 | 3 | 0.048 | 60 | 0.5 | 7 |
| 4 | 2 | 1 | 0.153 | 140 | 0.5 | 7 |
| 5 | 2 | 2 | 0.153 | 100 | 0.5 | 7 |
| 6 | 2 | 3 | 0.153 | 60 | 0.5 | 7 |
| 7 | 3 | 1 | 0.249 | 140 | 0.5 | 7 |
| 8 | 3 | 2 | 0.249 | 100 | 0.5 | 7 |
| 9 | 3 | 3 | 0.249 | 60 | 0.5 | 7 |
| Test No. | A | B | f (mm/rev) | V (m/min) | ap (mm) | α (degs) |
| 1 | 1 | 1 | 0.048 | 140 | 1.77 | 15 |
| 2 | 1 | 2 | 0.048 | 100 | 1.77 | 15 |
| 3 | 1 | 3 | 0.048 | 60 | 1.77 | 15 |
| 4 | 2 | 1 | 0.153 | 140 | 1.77 | 15 |
| 5 | 2 | 2 | 0.153 | 100 | 1.77 | 15 |
| 6 | 2 | 3 | 0.153 | 60 | 1.77 | 15 |
| 7 | 3 | 1 | 0.249 | 140 | 1.77 | 15 |
| 8 | 3 | 2 | 0.249 | 100 | 1.77 | 15 |
| 9 | 3 | 3 | 0.249 | 60 | 1.77 | 15 |
| Test | ap = 0.5 mm | ap = 1.77 mm | ||||
|---|---|---|---|---|---|---|
| f (mm/rev) | V (m/min) | Tmax_avg (°C) | f (mm/rev) | V (m/min) | Tmax_avg (°C) | |
| 1 | 0.048 | 140 | 221.7 | 0.048 | 140 | 215.8 |
| 2 | 0.048 | 100 | 184.2 | 0.048 | 100 | 205.9 |
| 3 | 0.048 | 60 | 178.7 | 0.048 | 60 | 179.0 |
| 4 | 0.153 | 140 | 292.1 | 0.153 | 140 | 416.0 |
| 5 | 0.153 | 100 | 238.7 | 0.153 | 100 | 398.0 |
| 6 | 0.153 | 60 | 190.0 | 0.153 | 60 | 312.2 |
| 7 | 0.249 | 140 | 392.0 | 0.249 | 140 | 367.8 |
| 8 | 0.249 | 100 | 306.2 | 0.249 | 100 | 342.4 |
| 9 | 0.249 | 60 | 223.7 | 0.249 | 60 | 319.4 |
| Material | A (MPa) | B (MPa) | C | m | n |
|---|---|---|---|---|---|
| GRADE 2 | 390 | 815 | 0.0187 | 0.685 | 0.3 |
| Test | ap = 0.5 mm | ap = 1.77 mm | ||||||
|---|---|---|---|---|---|---|---|---|
| f (mm/rev) | V (m/min) | Ff_mean (N) | Fc_mean (N) | f (mm/rev) | V (m/min) | Ff_mean (N) | Fc_mean (N) | |
| 1 | 0.048 | 140 | 36.1 | 52.6 | 0.048 | 140 | 90.0 | 162.8 |
| 2 | 0.048 | 100 | 35.5 | 54.5 | 0.048 | 100 | 94.0 | 169.1 |
| 3 | 0.048 | 60 | 35.5 | 55.5 | 0.048 | 60 | 138.8 | 175.9 |
| 4 | 0.153 | 140 | 58.0 | 124.9 | 0.153 | 140 | 142.2 | 351.2 |
| 5 | 0.153 | 100 | 86.1 | 147.5 | 0.153 | 100 | 168.4 | 369.2 |
| 6 | 0.153 | 60 | 90.8 | 153.7 | 0.153 | 60 | 184.6 | 404.3 |
| 7 | 0.249 | 140 | 103.2 | 184.0 | 0.249 | 140 | 213.0 | 540.0 |
| 8 | 0.249 | 100 | 105.7 | 211.1 | 0.249 | 100 | 238.5 | 561.0 |
| 9 | 0.249 | 60 | 135.7 | 234.3 | 0.249 | 60 | 252.8 | 579.5 |
| Test | ap = 0.5 mm | ap = 1.77 mm | ||||||
|---|---|---|---|---|---|---|---|---|
| f (mm/rev) | V (m/min) | φ (degs) | lAB (mm) | f (mm/rev) | V (m/min) | φ (degs) | lAB (mm) | |
| 1 | 0.048 | 140 | 27.76 | 0.103 | 0.048 | 140 | 30.53 | 0.094 |
| 2 | 0.048 | 100 | 27.60 | 0.104 | 0.048 | 100 | 30.46 | 0.095 |
| 3 | 0.048 | 60 | 28.69 | 0.105 | 0.048 | 60 | 29.03 | 0.099 |
| 4 | 0.153 | 140 | 30.24 | 0.304 | 0.153 | 140 | 32.97 | 0.281 |
| 5 | 0.153 | 100 | 29.86 | 0.307 | 0.153 | 100 | 32.72 | 0.283 |
| 6 | 0.153 | 60 | 29.71 | 0.309 | 0.153 | 60 | 32.20 | 0.287 |
| 7 | 0.249 | 140 | 29.87 | 0.500 | 0.249 | 140 | 34.20 | 0.443 |
| 8 | 0.249 | 100 | 29.50 | 0.506 | 0.249 | 100 | 33.70 | 0.449 |
| 9 | 0.249 | 60 | 29.30 | 0.509 | 0.249 | 60 | 33.30 | 0.454 |
| Test | f (mm/rev) | V (m/min) | TAB (°C) | Tint (°C) | kAB (MPa) | k’AB (MPa) | kint (MPa) | τint (MPa) |
|---|---|---|---|---|---|---|---|---|
| 1 | 0.048 | 140 | 241.2 | 803.7 | 577.01 | 576.95 | 276.56 | 276.55 |
| 2 | 0.048 | 100 | 204.4 | 803.3 | 596.97 | 565.38 | 291.29 | 291.25 |
| 3 | 0.048 | 60 | 194.6 | 792.0 | 598.88 | 598.89 | 308.31 | 308.29 |
| 4 | 0.153 | 140 | 324.1 | 820.1 | 518.07 | 518.09 | 130.89 | 130.82 |
| 5 | 0.153 | 100 | 257.5 | 810.2 | 553.53 | 553.55 | 165.30 | 165.33 |
| 6 | 0.153 | 60 | 216.1 | 805.1 | 573.31 | 573.33 | 185.34 | 185.33 |
| 7 | 0.249 | 140 | 489.1 | 837.8 | 432.67 | 432.67 | 129.73 | 129.71 |
| 8 | 0.249 | 100 | 382.1 | 818.3 | 481.88 | 481.86 | 166.44 | 166.51 |
| 9 | 0.249 | 60 | 260.7 | 810.5 | 542.12 | 542.10 | 193.74 | 193.72 |
| Test | f (mm/rev) | V (m/min) | C0 | σ’N (N/mm2) | (1/s) | (1/s) | ||
|---|---|---|---|---|---|---|---|---|
| 1 | 0.048 | 140 | 5.8 | 313.0 | 0.657 | 48,703 | 6.008 | 4070 |
| 2 | 0.048 | 100 | 5.8 | 328.8 | 0.660 | 33,266 | 5.919 | 2890 |
| 3 | 0.048 | 60 | 5.2 | 339.5 | 0.667 | 18,176 | 5.786 | 1708 |
| 4 | 0.153 | 140 | 9.4 | 210.1 | 0.619 | 27,101 | 7.139 | 1396 |
| 5 | 0.153 | 100 | 9.7 | 217.2 | 0.624 | 19,751 | 7.790 | 984 |
| 6 | 0.153 | 60 | 9.0 | 240.8 | 0.626 | 10,914 | 7.360 | 587 |
| 7 | 0.249 | 140 | 9.3 | 176.6 | 0.624 | 16,283 | 7.435 | 846 |
| 8 | 0.249 | 100 | 8.3 | 214.8 | 0.629 | 10,266 | 6.987 | 597 |
| 9 | 0.249 | 60 | 7.6 | 256.3 | 0.632 | 5602 | 6.565 | 355 |
| Test | f (mm/rev) | V (m/min) | TAB (°C) | Tint (°C) | kAB (MPa) | k’AB (MPa) | kint (MPa) | τint (MPa) |
|---|---|---|---|---|---|---|---|---|
| 1 | 0.048 | 140 | 235.6 | 814.2 | 565.10 | 565.08 | 207.05 | 207.05 |
| 2 | 0.048 | 100 | 197.6 | 812.1 | 585.40 | 585.42 | 216.45 | 216.45 |
| 3 | 0.048 | 60 | 163.0 | 806.0 | 504.62 | 504.59 | 256.21 | 256.17 |
| 4 | 0.153 | 140 | 461.0 | 847.2 | 436.58 | 436.61 | 89.65 | 89.63 |
| 5 | 0.153 | 100 | 454.0 | 825.0 | 438.30 | 438.30 | 92.82 | 92.91 |
| 6 | 0.153 | 60 | 358.2 | 817.5 | 479.62 | 479.64 | 134.50 | 134.49 |
| 7 | 0.249 | 140 | 491.0 | 852.0 | 416.91 | 416.89 | 83.82 | 84.23 |
| 8 | 0.249 | 100 | 478.8 | 822.7 | 421.33 | 421.30 | 87.15 | 87.17 |
| 9 | 0.249 | 60 | 453.0 | 821.0 | 430.47 | 430.47 | 89.67 | 89.87 |
| Test | f (mm/rev) | V (m/min) | C0 | σ’N (N/mm2) | (1/s) | (1/s) | ||
|---|---|---|---|---|---|---|---|---|
| 1 | 0.048 | 140 | 6.0 | 214.8 | 0.569 | 51,455 | 6.866 | 4070 |
| 2 | 0.048 | 100 | 5.9 | 223.6 | 0.570 | 36,359 | 6.839 | 2901 |
| 3 | 0.048 | 60 | 4.5 | 262.3 | 0.592 | 15,969 | 5.980 | 1668 |
| 4 | 0.153 | 140 | 8.8 | 119.2 | 0.538 | 25,836 | 9.041 | 1367 |
| 5 | 0.153 | 100 | 9.2 | 113.1 | 0.541 | 19,124 | 9.709 | 970 |
| 6 | 0.153 | 60 | 7.0 | 162.8 | 0.547 | 8649 | 7.511 | 573 |
| 7 | 0.249 | 140 | 7.7 | 132.4 | 0.525 | 14,370 | 9.251 | 867 |
| 8 | 0.249 | 100 | 8.2 | 124.9 | 0.530 | 10,823 | 9.527 | 611 |
| 9 | 0.249 | 60 | 8.6 | 120.7 | 0.534 | 6729 | 9.589 | 363 |
Publisher’s Note: MDPI stays neutral with regard to jurisdictional claims in published maps and institutional affiliations. |
© 2021 by the author. Licensee MDPI, Basel, Switzerland. This article is an open access article distributed under the terms and conditions of the Creative Commons Attribution (CC BY) license (https://creativecommons.org/licenses/by/4.0/).
Share and Cite
Ślusarczyk, Ł. Experimental-Analytical Method for Temperature Determination in the Cutting Zone during Orthogonal Turning of GRADE 2 Titanium Alloy. Materials 2021, 14, 4328. https://doi.org/10.3390/ma14154328
Ślusarczyk Ł. Experimental-Analytical Method for Temperature Determination in the Cutting Zone during Orthogonal Turning of GRADE 2 Titanium Alloy. Materials. 2021; 14(15):4328. https://doi.org/10.3390/ma14154328
Chicago/Turabian StyleŚlusarczyk, Łukasz. 2021. "Experimental-Analytical Method for Temperature Determination in the Cutting Zone during Orthogonal Turning of GRADE 2 Titanium Alloy" Materials 14, no. 15: 4328. https://doi.org/10.3390/ma14154328
APA StyleŚlusarczyk, Ł. (2021). Experimental-Analytical Method for Temperature Determination in the Cutting Zone during Orthogonal Turning of GRADE 2 Titanium Alloy. Materials, 14(15), 4328. https://doi.org/10.3390/ma14154328


