Article

Insights in the Ionic Conduction inside Nanoporous Metal-Organic Frameworks by Using an Appropriate Equivalent Circuit

Institute of Functional Interfaces (IFG), Karlsruhe Institute of Technology (KIT), Hermann-von-Helmholtz-Platz 1, 76344 Eggenstein-Leopoldshafen, Germany
*
Author to whom correspondence should be addressed.
Materials 2021, 14(16), 4352; https://doi.org/10.3390/ma14164352
Submission received: 18 June 2021 / Revised: 28 July 2021 / Accepted: 30 July 2021 / Published: 4 August 2021
(This article belongs to the Special Issue Advances in Electrochemistry of Nanomaterials)

Abstract

:
The conduction of protons and other ions in nanoporous materials, such as metal-organic frameworks (MOFs), is intensively explored with the aim of enhancing the performance of energy-related electrochemical systems. The ionic conductivity, as a key property of the material, is typically determined by using electrochemical impedance spectroscopy (EIS) in connection with a suitable equivalent circuit. Often, equivalent circuits are used where the physical meaning of each component is debatable. Here, we present an equivalent circuit for the ionic conduction of electrolytes in nanoporous, nonconducting materials between inert and impermeable electrodes without faradaic electrode reactions. We show the equivalent circuit perfectly describes the impedance spectra measured for the ion conduction in MOFs in the form of powders pressed into pellets as well as for MOF thin films. This is demonstrated for the ionic conduction of an aprotic ionic liquid, and of various protic solvents in different MOF structures. Due to the clear physical meaning of each element of the equivalent circuit, further insights into the electrical double layer forming at the MOF-electrode interface can be obtained. As a result, EIS combined with the appropriate reference circuit allows us to make statements of the quality of the MOF-substrate interface of different MOF-film samples.

1. Introduction

Electrochemical processes are key to many energy-related applications, such as fuel cells and batteries [1,2,3,4]. In many of these applications, the performance can be significantly improved by using advanced nanoporous materials [5]. In particular, metal-organic frameworks (MOFs) and covalent-organic frameworks (COFs), but also conventional nanoporous crystalline materials like zeolites have the potential to boost most electrochemical applications [5,6,7,8,9]. MOFs are solid materials, self-assembled from inorganic metal nodes connected by organic linker molecules. The application of MOFs in modern electrochemical applications, for instance in fuel cells, batteries, supercapacitors, and sensors has attracted significant attention [7,10,11,12,13]. For utilizing nanoporous materials, the conductivity of the material is among the key properties and the mobility of charges (e.g., protons, lithium, and other ions) is crucial. The material conductivity is typically experimentally explored by electrochemical impedance spectroscopy (EIS) [14,15]. In EIS, the current in an electrochemical cell is measured as a response to a small AC voltage (typically in the order of 10–300 mV) over a wide frequency range (typically in the order of 1 Hz to 1 MHz). For the data analysis, the correct equivalent circuit reflecting the electrochemical properties of the setup and sample need to be utilized. In various studies exploring the ionic conduction in MOFs, the authors use different equivalent circuits where the focus is on an RC-circuit (i.e., an ohmic resistance R in parallel combination with a capacitor C) [7,16,17,18,19,20,21,22,23]. In the complex plane plot of the impedance, also referred to as Nyquist plots, the RC-element gives a semi-circle with R as diameter. This diameter is typically used to calculate the conductivity of the material. Often, in addition to the high-frequency semi-circle, a low-frequency ray or spike is also observed. In many studies [20,24,25,26,27,28,29], the experimental impedance data are then described by an equivalent circuit similar to the Randles circuit, where the Nyquist plot shows a semi-circle at high frequencies with a diameter of an ohmic resistance connected to a low-frequency ray with an angle of 45°. The Randles equivalent circuit is composed of an ohmic resistance in serial with a Warburg (diffusion) element in parallel combination with a capacitance, i.e., it is an RC-element with a Warburg resistance in serial to R [14]. The Randles equivalent circuit was introduced for faradaic electrode reactions with diffusing components [14,30]. However, when using EIS to explore the ionic conduction in nanoporous materials like MOFs, the applied AC voltage is usually in the range of 10 mV to 300 mV, which is commonly smaller than the reduction or oxidation potentials of the explored materials and guest molecules. Thus, no faradaic electrode reaction takes place under typical experimental conditions. Therefore, the physical meaning of each element in the Randles equivalent circuit is questionable when applied to ionic conduction in MOFs. (In other words, the main problem is that there is typically no charge transfer across the MOF-electrode interface, i.e., faradaic reactions do not take place, being fundamental for the Randles circuit). Although the ohmic resistance seems to be correctly determined via the high-frequency semi-circle, the application of the Randles circuit to describe the ionic conduction in nanoporous materials is debatable.
For various ionic conductor systems, appropriate equivalent circuits have been discussed and justified [31,32,33,34]. Appropriate equivalent circuits where each component has a clear physical meaning have also been introduced for various nanoporous systems. Examples are MOF films with (low) electronic conductivity on substrates with interdigitated gold electrodes (IDEs) [35], zeolite-Cr2O3 films on IDEs used as gas sensors [36,37], zeolites embedded in polymer membranes [38], zeolite films as coatings on alloys [39], or for the film growth of a zeolite membrane [40]. To the best of our knowledge, a critical discussion of an equivalent circuit for the ionic conduction in nanoporous non-conducting materials, like (most) MOFs between two inert electrodes like gold is missing.
The aim of the present work is to introduce an appropriate equivalent circuit for the ionic conduction of electrolytes in the pores of nanoporous non-conducting host materials, where each element of the equivalent circuit has a physical meaning. We suggest and justify an equivalent circuit composed of the ohmic resistance of the material in serial with a constant phase element (CPE), reflecting the real capacitor of the double-layer at the electrode surfaces, in parallel combination with a CPE, reflecting the geometric capacity of the electrodes. We show that the equivalent circuit describes the ion conduction in nanoporous MOFs, for the material in the form of thin films grown on substrates with deposited electrodes (like IDEs), as well as in the form of MOF powders pressed into pellets sandwiched between two gold electrodes. The analysis is applied to the conduction of ionic liquids (ILs) in MOFs of type HKUST-1 (Hong Kong University of Science and Technology-1 [41]) in the form of thin films and in the form of MOF pellets as well as to the proton conduction of various molecules in pillared-layered MOF thin films. In these conduction processes, no faradaic reactions take place under the experimental conditions. We show that by using the appropriate equivalent circuit, further parameters in addition to the resistance (and correlated conductivity) of the material can be evaluated. We compare three MOF films which are made of the same structure in the same way, however, the substrate was functionalized in different ways, i.e., with two different self-assembled monolayers, and by UV-ozone treatment. We show that although the crystallinity and conductivity of the material are very similar, the EIS with the introduced equivalent circuit allows us to make qualitative statements on the MOF-substrate interface, which is commonly difficult to explore.

2. Materials and Methods

Surface-mounted MOF (SURMOF) thin films were prepared in a layer-by-layer (lbl) fashion on the substrates [42]. In detail, the lbl growth process consists of alternately exposing the substrate to the ethanolic solutions of the building units; that is, the metal nodes (here: 1 mM copper acetate) and the organic linkers (here: 0.2 mM benzene-1,3,5-tricarboxylic acid, BTC). Between each step, the sample surfaces were cleaned with pure ethanol. The SURMOF samples were prepared in 50 lbl synthesis cycles by using a spray method [43]. The substrates are glass sheets with deposited interdigitated gold electrodes (IDEs), obtained from DropSens (Metrohm DropSens, Oviedo, Spain). The total length of the gap between the gold electrodes is 1.69 m (=2 times 125 gaps of 6.76 mm length) and the gap width is 10 µm. Before the SURMOF synthesis, the substrates were treated in three different ways: (1) by UV-ozone treatment for 15 min to remove impurities and to increase the number of OH functional groups; (2) an OH-terminated self-assembled monolayer (SAM) was formed on the substrate by immersion in a thiol solution, this means a 11-mercapto-1-undecanol (MUD) SAM was formed on the Au electrodes upon immersion in 20 µm MUD ethanol solution for 24 h; and (3) a COOH-terminated SAM was formed upon immersion of the substrate in 20 µM MHDA (16-mercaptohexadecanoic acid) ethanol solution for 48 h. The samples were loaded with ionic liquid of type 1-butyl-3-methylimidazoliumbis (trifluormethylsulfonyl)imid, referred to as [BMIM][TFSI], by immersion for 20 min, as described in [27]. Upon IL loading, excess IL on the SURMOF surface was rinsed off with pure acetonitrile. The samples were placed in a homemade Teflon cell and the IDEs were contacted in a two-probe way. All EIS measurements were performed in an atmosphere of pure nitrogen.
HKUST-1 MOF in the form of crystalline powder was prepared by following standard synthesis methods [44]. For the loading of the MOF powder with IL, different amounts of [BMIM][TFSI] were added to the activated HKUST-1 powder separately, homogeneously mixed, and heated under a vacuum at 120 °C overnight. For the preparation of the IL@MOF-pellets, we followed standard directions [45] (See Appendix A for experimental details). The resulting pellets had cylindrical shapes of 13 mm diameter with a thickness of approximately 1.7–2.0 mm. The conduction of the pellets was measured by positioning the IL@MOF-pellets between 2 planar electrodes, which are gold thin film (150 nm thickness) on conducting Si-wafer.
In the manuscript, we also applied the suggested equivalent circuit to data previously published by our group. In detail, the data are IL of type [BMIM][TFSI] in SURMOFs of type HKUST-1 from [27], as well as butanediol and triazol in SURMOFs with a pillared-layer MOF (pl-MOF) structure of type Cu2(F2AzoBDC)2(dabco) from [26]. F2AzoBDC refers to (E)-2-((2,6-difluorophenyl)diazenyl)terephthalic acid and dabco to 1,4-diazabicyclo [2.2.2]octan. There, the SURMOFs were grown on glass substrates with deposited IDEs.
The X-ray diffractograms (XRD) were measured in an out-of-plane geometry using a Bruker D8-Advance diffractometer, equipped with a position-sensitive detector in θ–2θ geometry. A Cu-anode with a wavelength of λ = 0.154 nm was used.
The electrochemical impedance spectra were measured with a Zurich Instruments MFIA Impedance Analyzer in a frequency range of 5 MHz to 0.5 Hz. The AC voltage was set to 300 mV. No DC voltage was applied.
All experiments were performed at room temperature (~295 K).

3. Results and Discussion

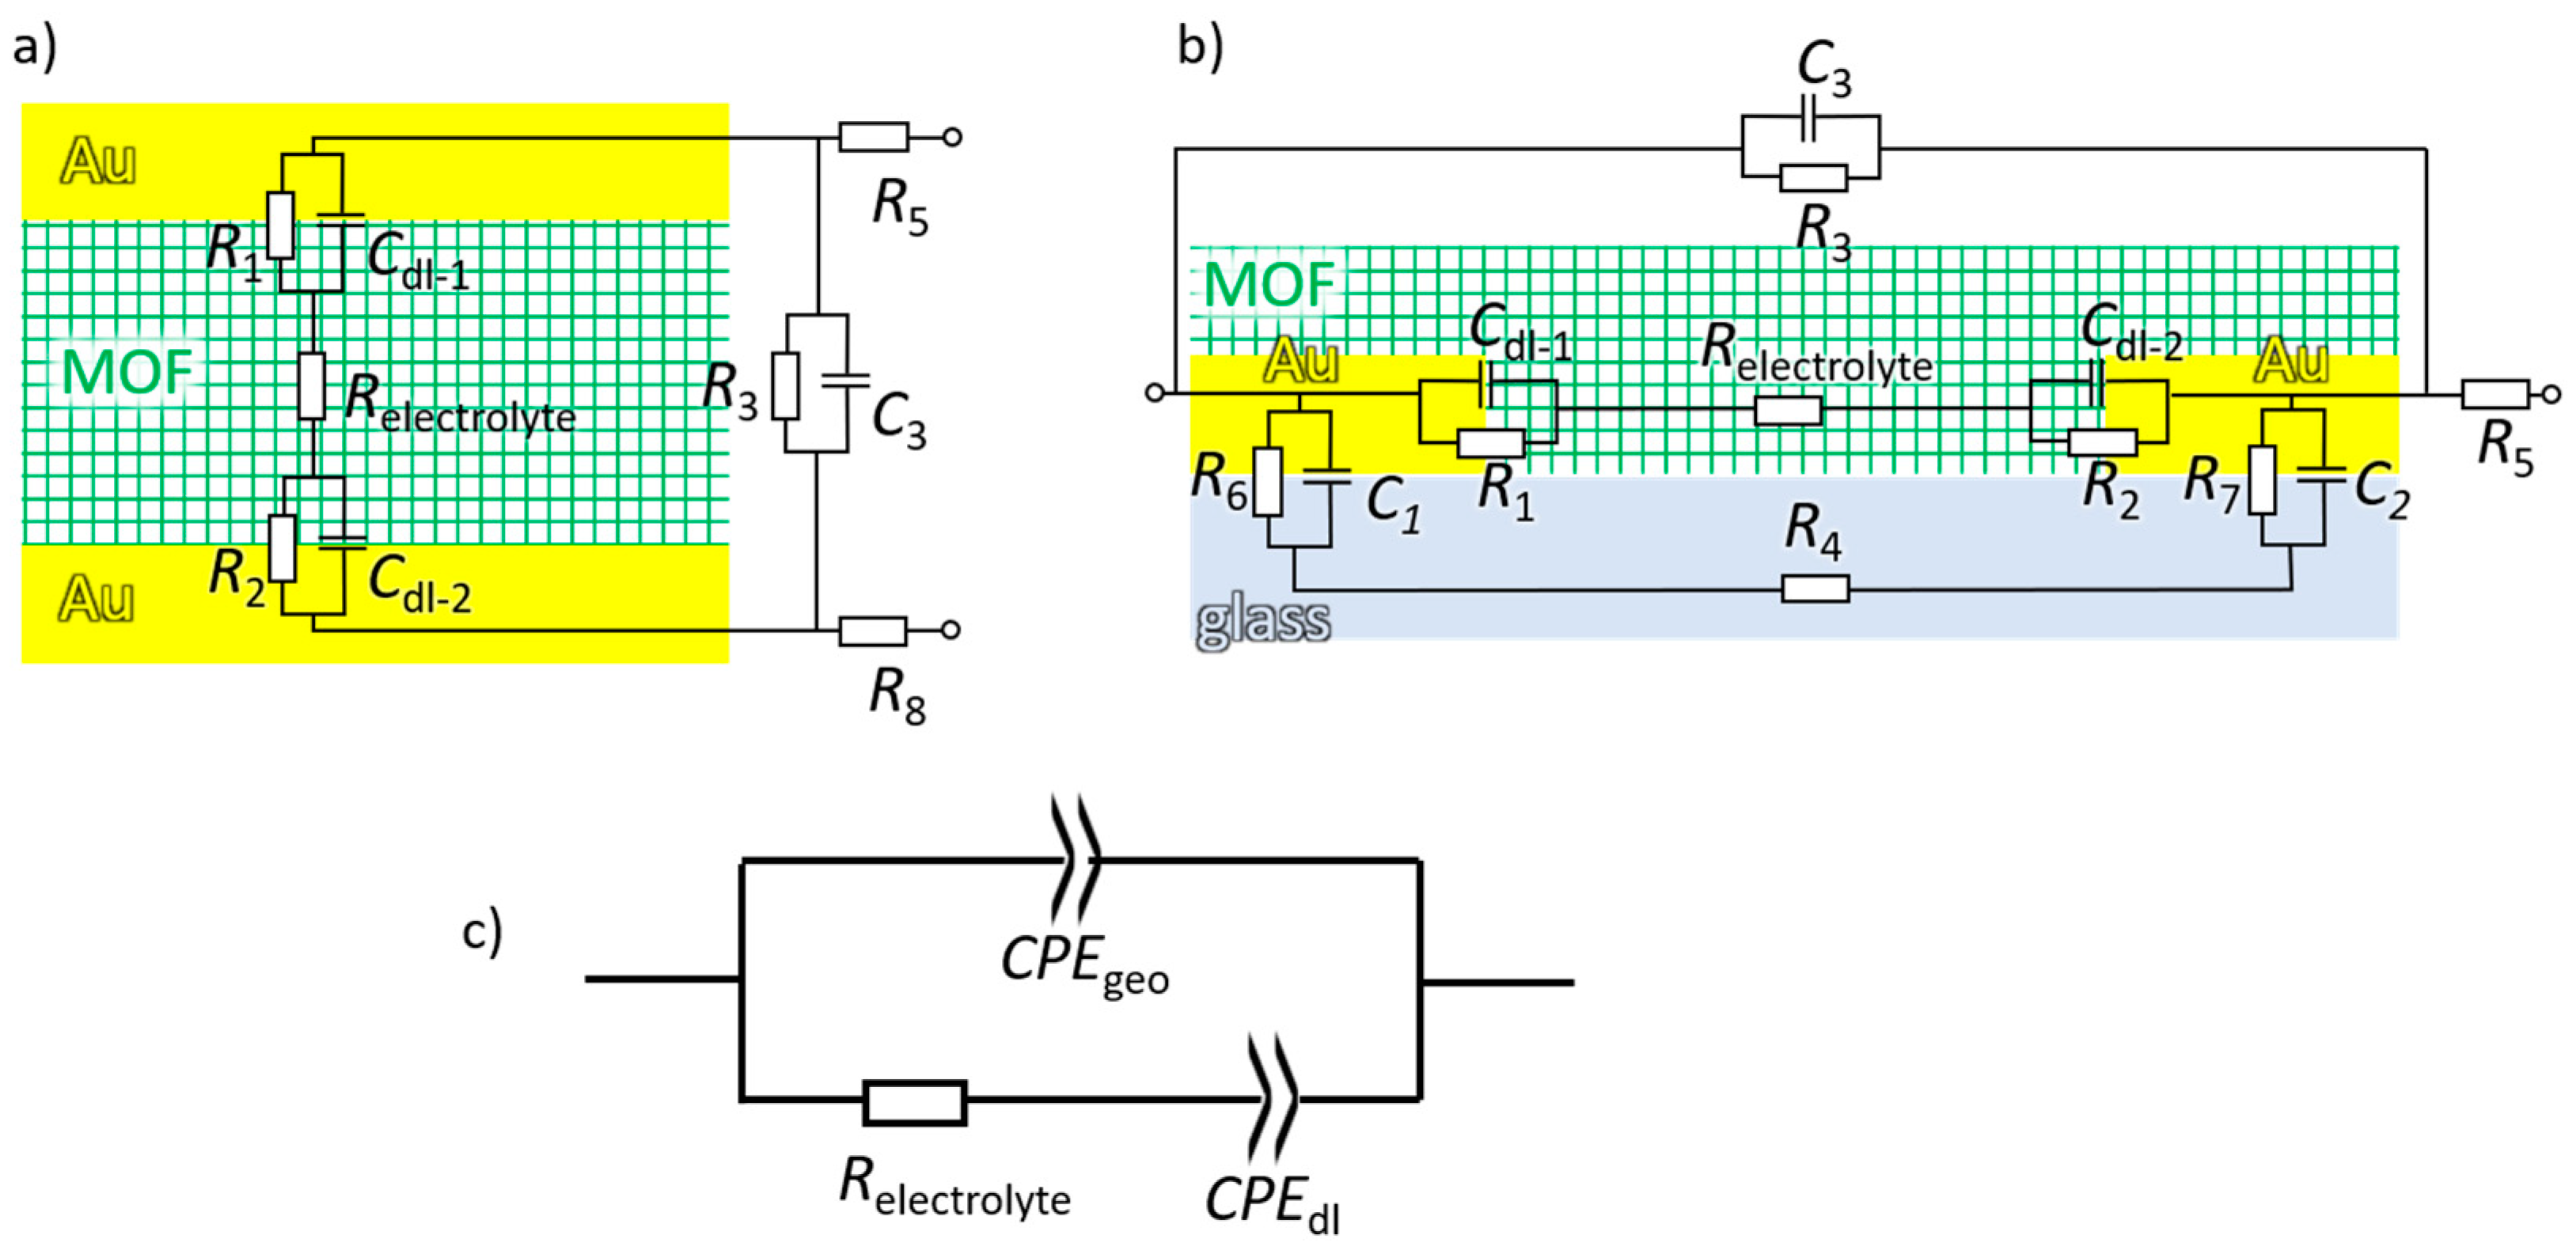
3.1. Introduction of Equivalent Circuit

A sketch of the MOF pellet sandwiched between two planar electrodes is shown in Figure 1a. The top and bottom gold electrodes are contacted by wires with the impedance spectrometer, applying the AC voltage and measuring the impedance and phase. The sample is typically pressed in the form of a coin-shaped pellet. A sketch of the MOF material in the form of a film grown on nonconducting substrates with deposited electrodes is pictured in Figure 1b. Typically, the electrodes are interdigitated so that many gaps are connected in parallel (often many hundreds of gaps) with a total gap length in the range of 1 cm to 1 m. Please note, the size ratios in Figure 1a and 1b are not correctly pictured. The MOF pellets have a thickness typically in the range of 1 mm or less, and the planar top and bottom electrodes typically have a diameter in the range of 1 cm. For the MOF film on an IDE, the distance between the electrodes is typically in the range of 10–100 µm, and the thickness of the MOF film is usually 0.1–0.5 µm. The thickness of the gold IDEs is typically in the range of 0.1 µm. Thus, the E-field is essentially homogenous in the sample between the electrodes [46].
For both setups, the idealized electrical equivalent circuits are also shown in Figure 1a,b. Here, we focus on the ionic conduction of electrolytes in the pores of essentially insulating MOFs. The charge carriers of the electrolytes are ions (protons, cations, or anions), not electrons, and no faradaic reactions take place at the electrodes. The applied voltages are too small to cause reduction or oxidation reactions at the electrodes. On the other hand, the charge carriers in the gold electrodes are electrons and the electrodes are impermeable to the ions. Thus, the charge transfer resistances at the gold-electrolyte interface (i.e., the electrode-electrolyte interface, R1, and R2, see Figure 1) are very large (essentially infinity) and these paths do not contribute to the charge transfer. The leakage currents are typically very small (i.e., the resistances R3 and R4 are very large) and these paths can also be neglected. In the experimental setups, the resistance of the wires and connections (R5 and R6, eventually with a small inductance part) are very small and can typically be ignored. As a result, the equivalent circuit can be simplified to the ohmic resistance of the electrolyte (Relectrolyte) in serial with a capacitor of the electrical double-layer at the electrode surfaces (combination of Cdl-1 and Cdl-2) in parallel combination with a capacitor reflecting the geometric capacity of the electrodes (C3). This simplified equivalent circuit is correct for perfectly homogenous interfaces at defect-free, single-crystalline, and flat electrodes (or liquid electrodes). In real electrochemical cells, the capacitance of the double layer (dl) shows a frequency dispersion, and the impedance Z = 1 / 2 π i f C dl becomes to Z = 1 / ( ( 2 π i f ) n dl C P E dl ) [14,15]. Here, ndl is the constant phase exponent with 0 < ndl ≤ 1, also referred to as frequency power, and C P E dl is the parameter related to the capacitance (in F   s n dl 1 ), also referred to as effective capacitance. The main reasons for the frequency dependence are heterogeneities at the electrodes, causing dispersion of the relaxation times of the double-layer polarizations [47,48,49]. (See also chapter 8 in [14]) Usually, the heterogeneities of the double layer are caused by the poly-crystallinity and roughness of the electrodes [47,48,49]. Potential impurities and adsorbates also contribute to the dispersion of relaxation times [14]. Here, the MOF material may possess additional inhomogeneities, resulting in a more heterogeneous electrical double-layer. Moreover, for films grown on IDEs deposited on non-conducting substrates, the electrode interface is obviously heterogeneous since the electric field at the electrode surface is inhomogeneous [46]. Heterogeneities and roughness in the film morphology and deviations from the ideal geometry, cause a frequency dependence of the geometric capacitor [14,15]. As a result, both capacitors in the simplified equivalent circuit need to be substituted by CPEs. This results in the equivalent circuit shown in Figure 1c, referred to as (R-CPEdl)‖CPEgeo-circuit.
The complex impedance Z of the equivalent circuit (Figure 1c) is given by
1 Z = 1 R + 2 / ( ( 2 π i f ) n dl C P E dl ) + 1 1 / ( ( 2 π i f ) n geo C P E geo ) .
R denotes the ohmic resistance of the material between the electrodes, i is the imaginary number (i.e., i2 = −1), f is the AC frequency, CPEdl is the CPE capacitance of the double layer at one electrode and CPEgeo is the geometric CPE capacitance. The constant phase exponent of the double layer and geometric capacitances are given by ndl and ngeo, which are in the range between 1 and 0. Please note the factor 2 of the impedance of CPEdl, indicating the double layers at both electrodes. For simplicity, it is assumed that both electrodes are identical.
For a better understanding of the parameters, the effects of the individual parameters are discussed. The complex plane plots of the impedance, also referred to as Nyquist plots, are shown for typical values in Figure 2. In the Nyquist plots, the shape is a characteristic semi-circle in the high-frequency range and a straight line in the low-frequency range. For ndl = 1 (red spectrum in Figure 2a), the low-frequency line is vertical in the Nyquist plot (usually at Re(Z) = R). With decreasing values of ndl, the low-frequency line becomes less steep and the branch becomes larger (i.e., the impedance of the CPEdl element becomes larger). The high-frequency semi-circle has a diameter of R. For decreasing ngeo, the semi-circle is flattened (green spectrum). It should be noted that for ngeo = 1 and ndl = 0.5, the semi-circle is perfectly round, and the low-frequency spike has an angle of 45° in the Nyquist plot, just like the Randles circuit, however, the physical meaning of the components are different, see above.
By varying CPEdl and CPEgeo, the shapes of the impedance spectra in the Nyquist plot vary, see Figure 2b. For small CPEgeo and large CPEdl, the form of the semi-circle and the straight line at low frequencies is clearly visible, and at the local minimum of -Im(Z) the value of Re(Z) corresponds to R. For increasing CPEgeo and decreasing CPEdl, the local minimum of -Im(Z) increases, eventually vanishes, and the semi-circle and the low-frequency rays merge.

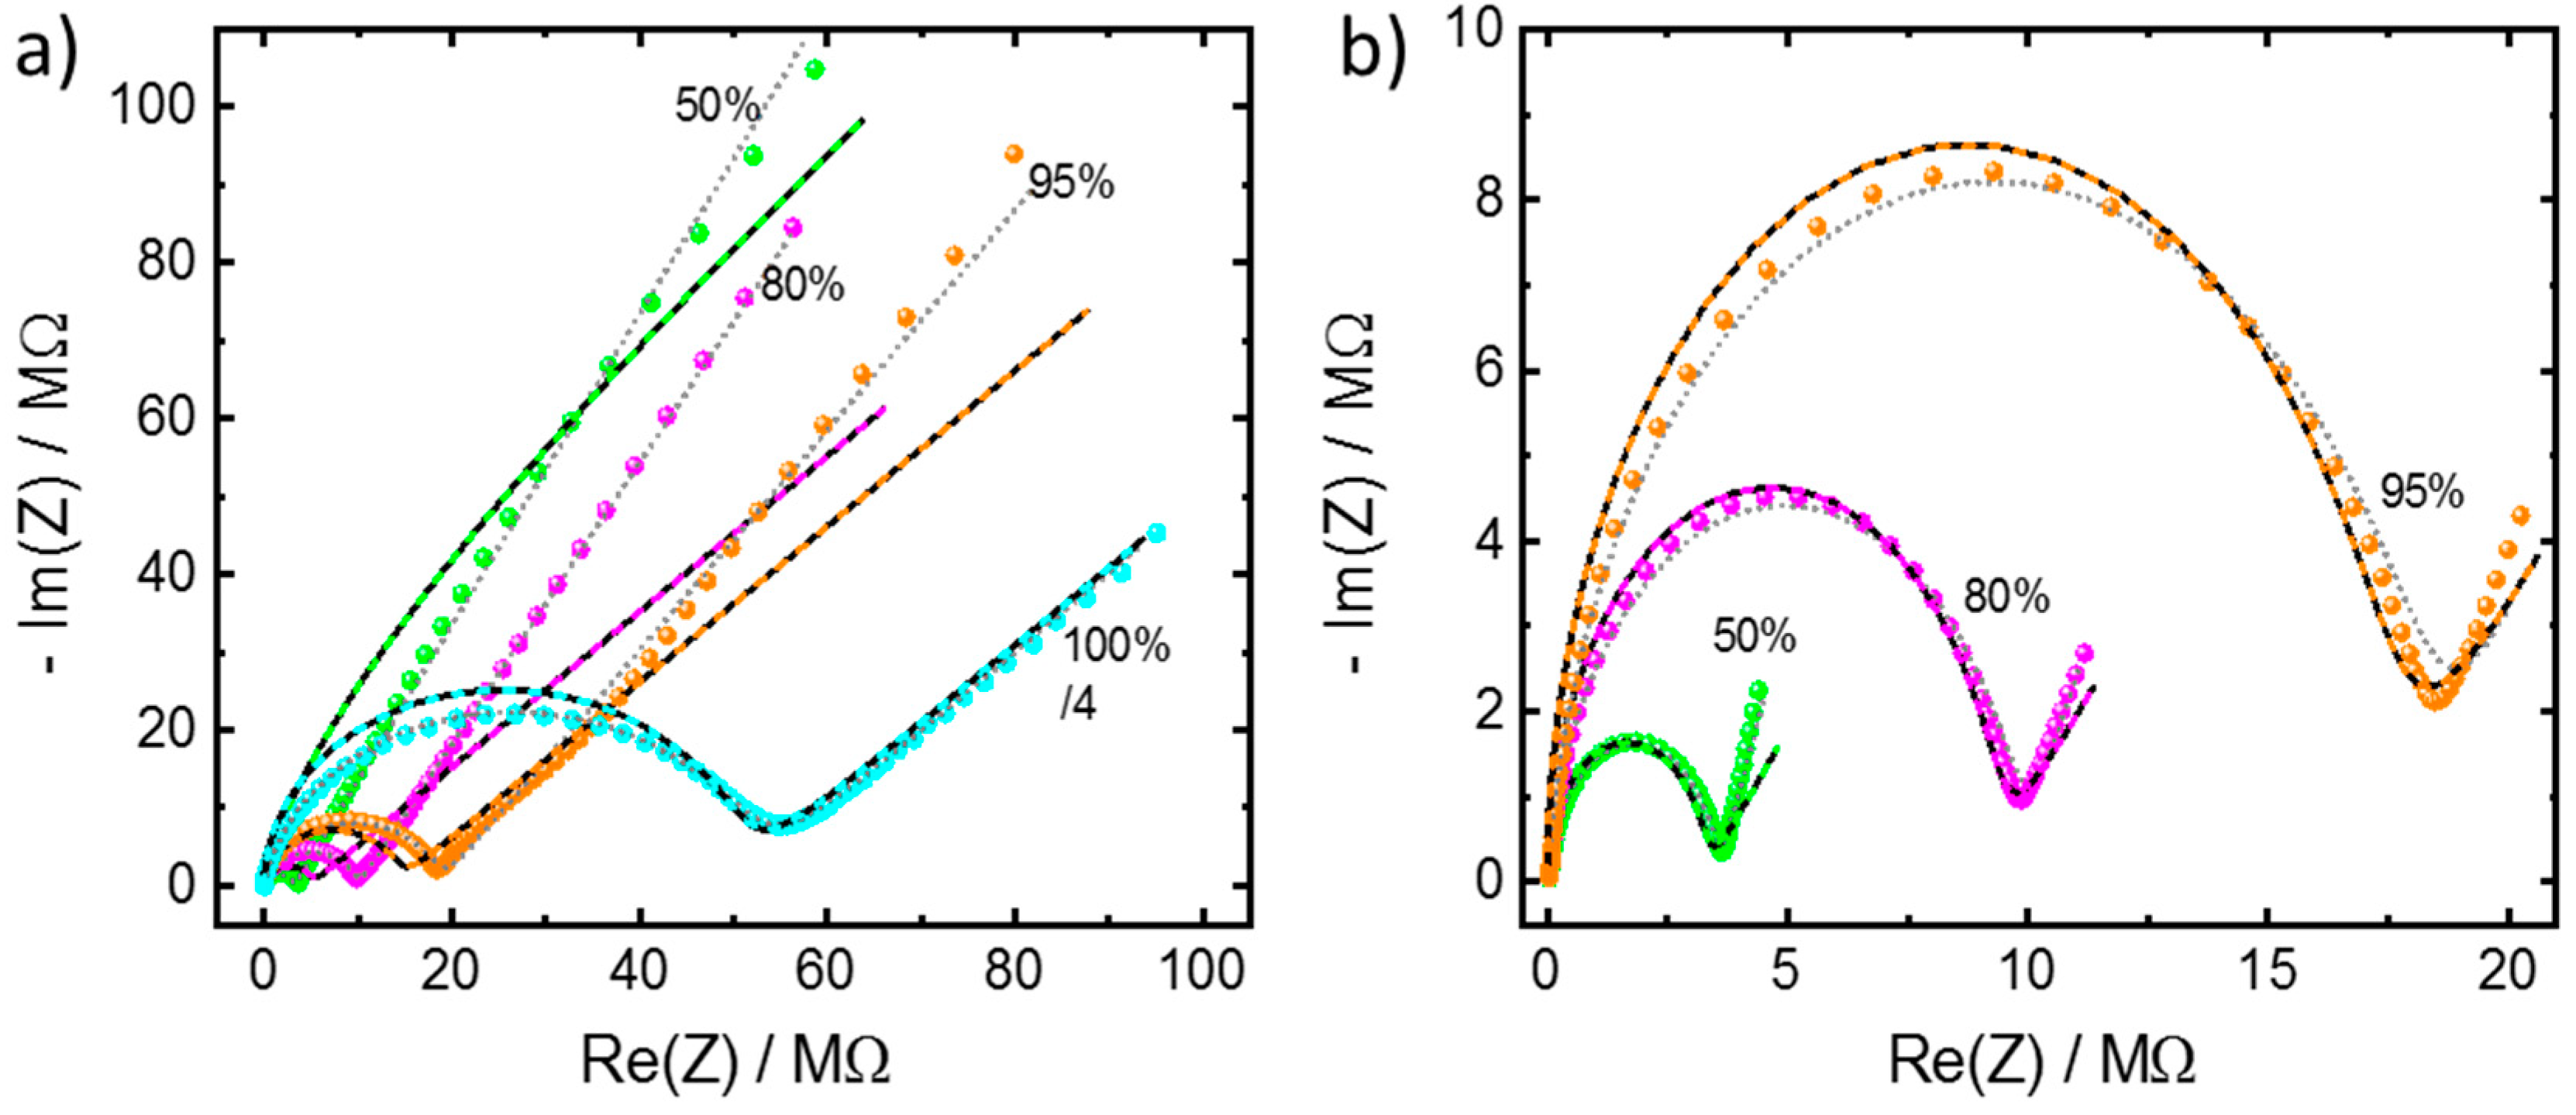
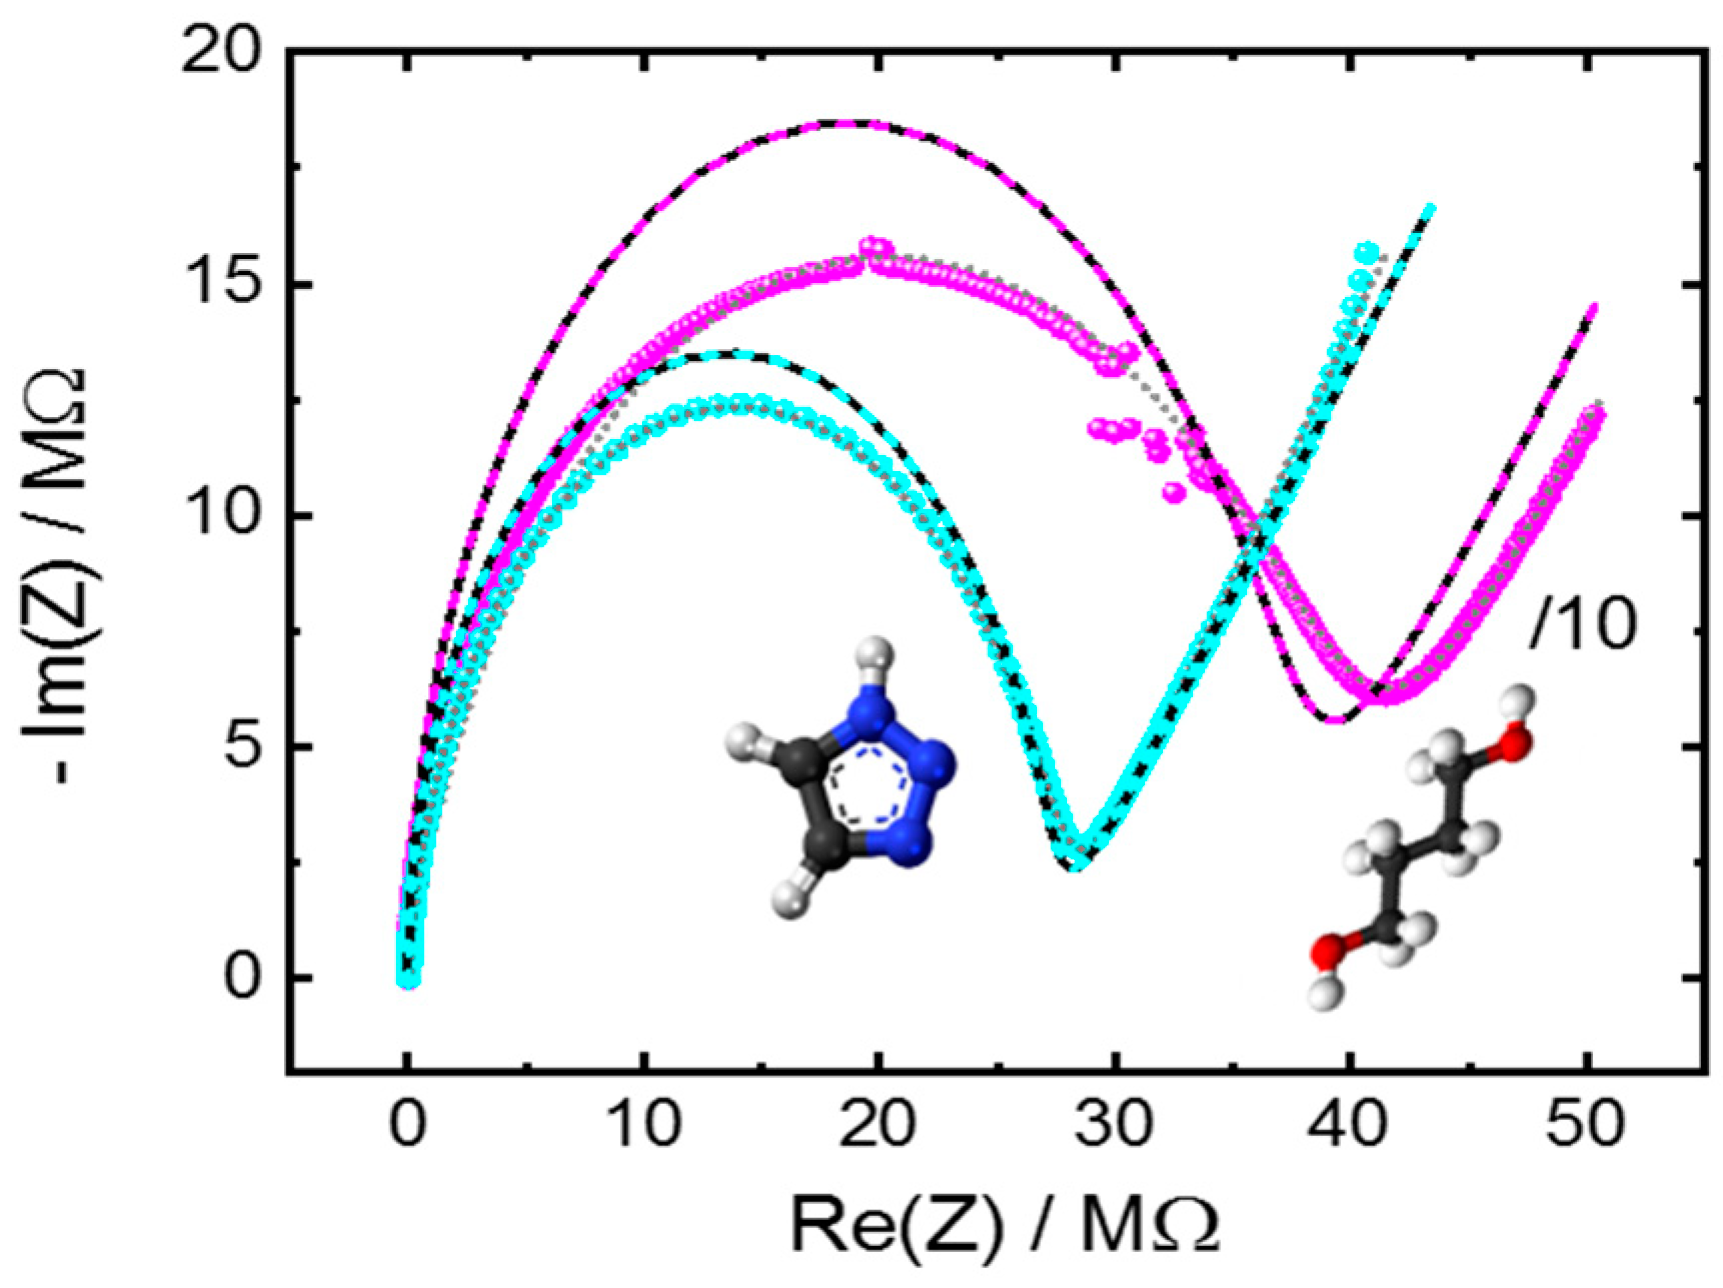
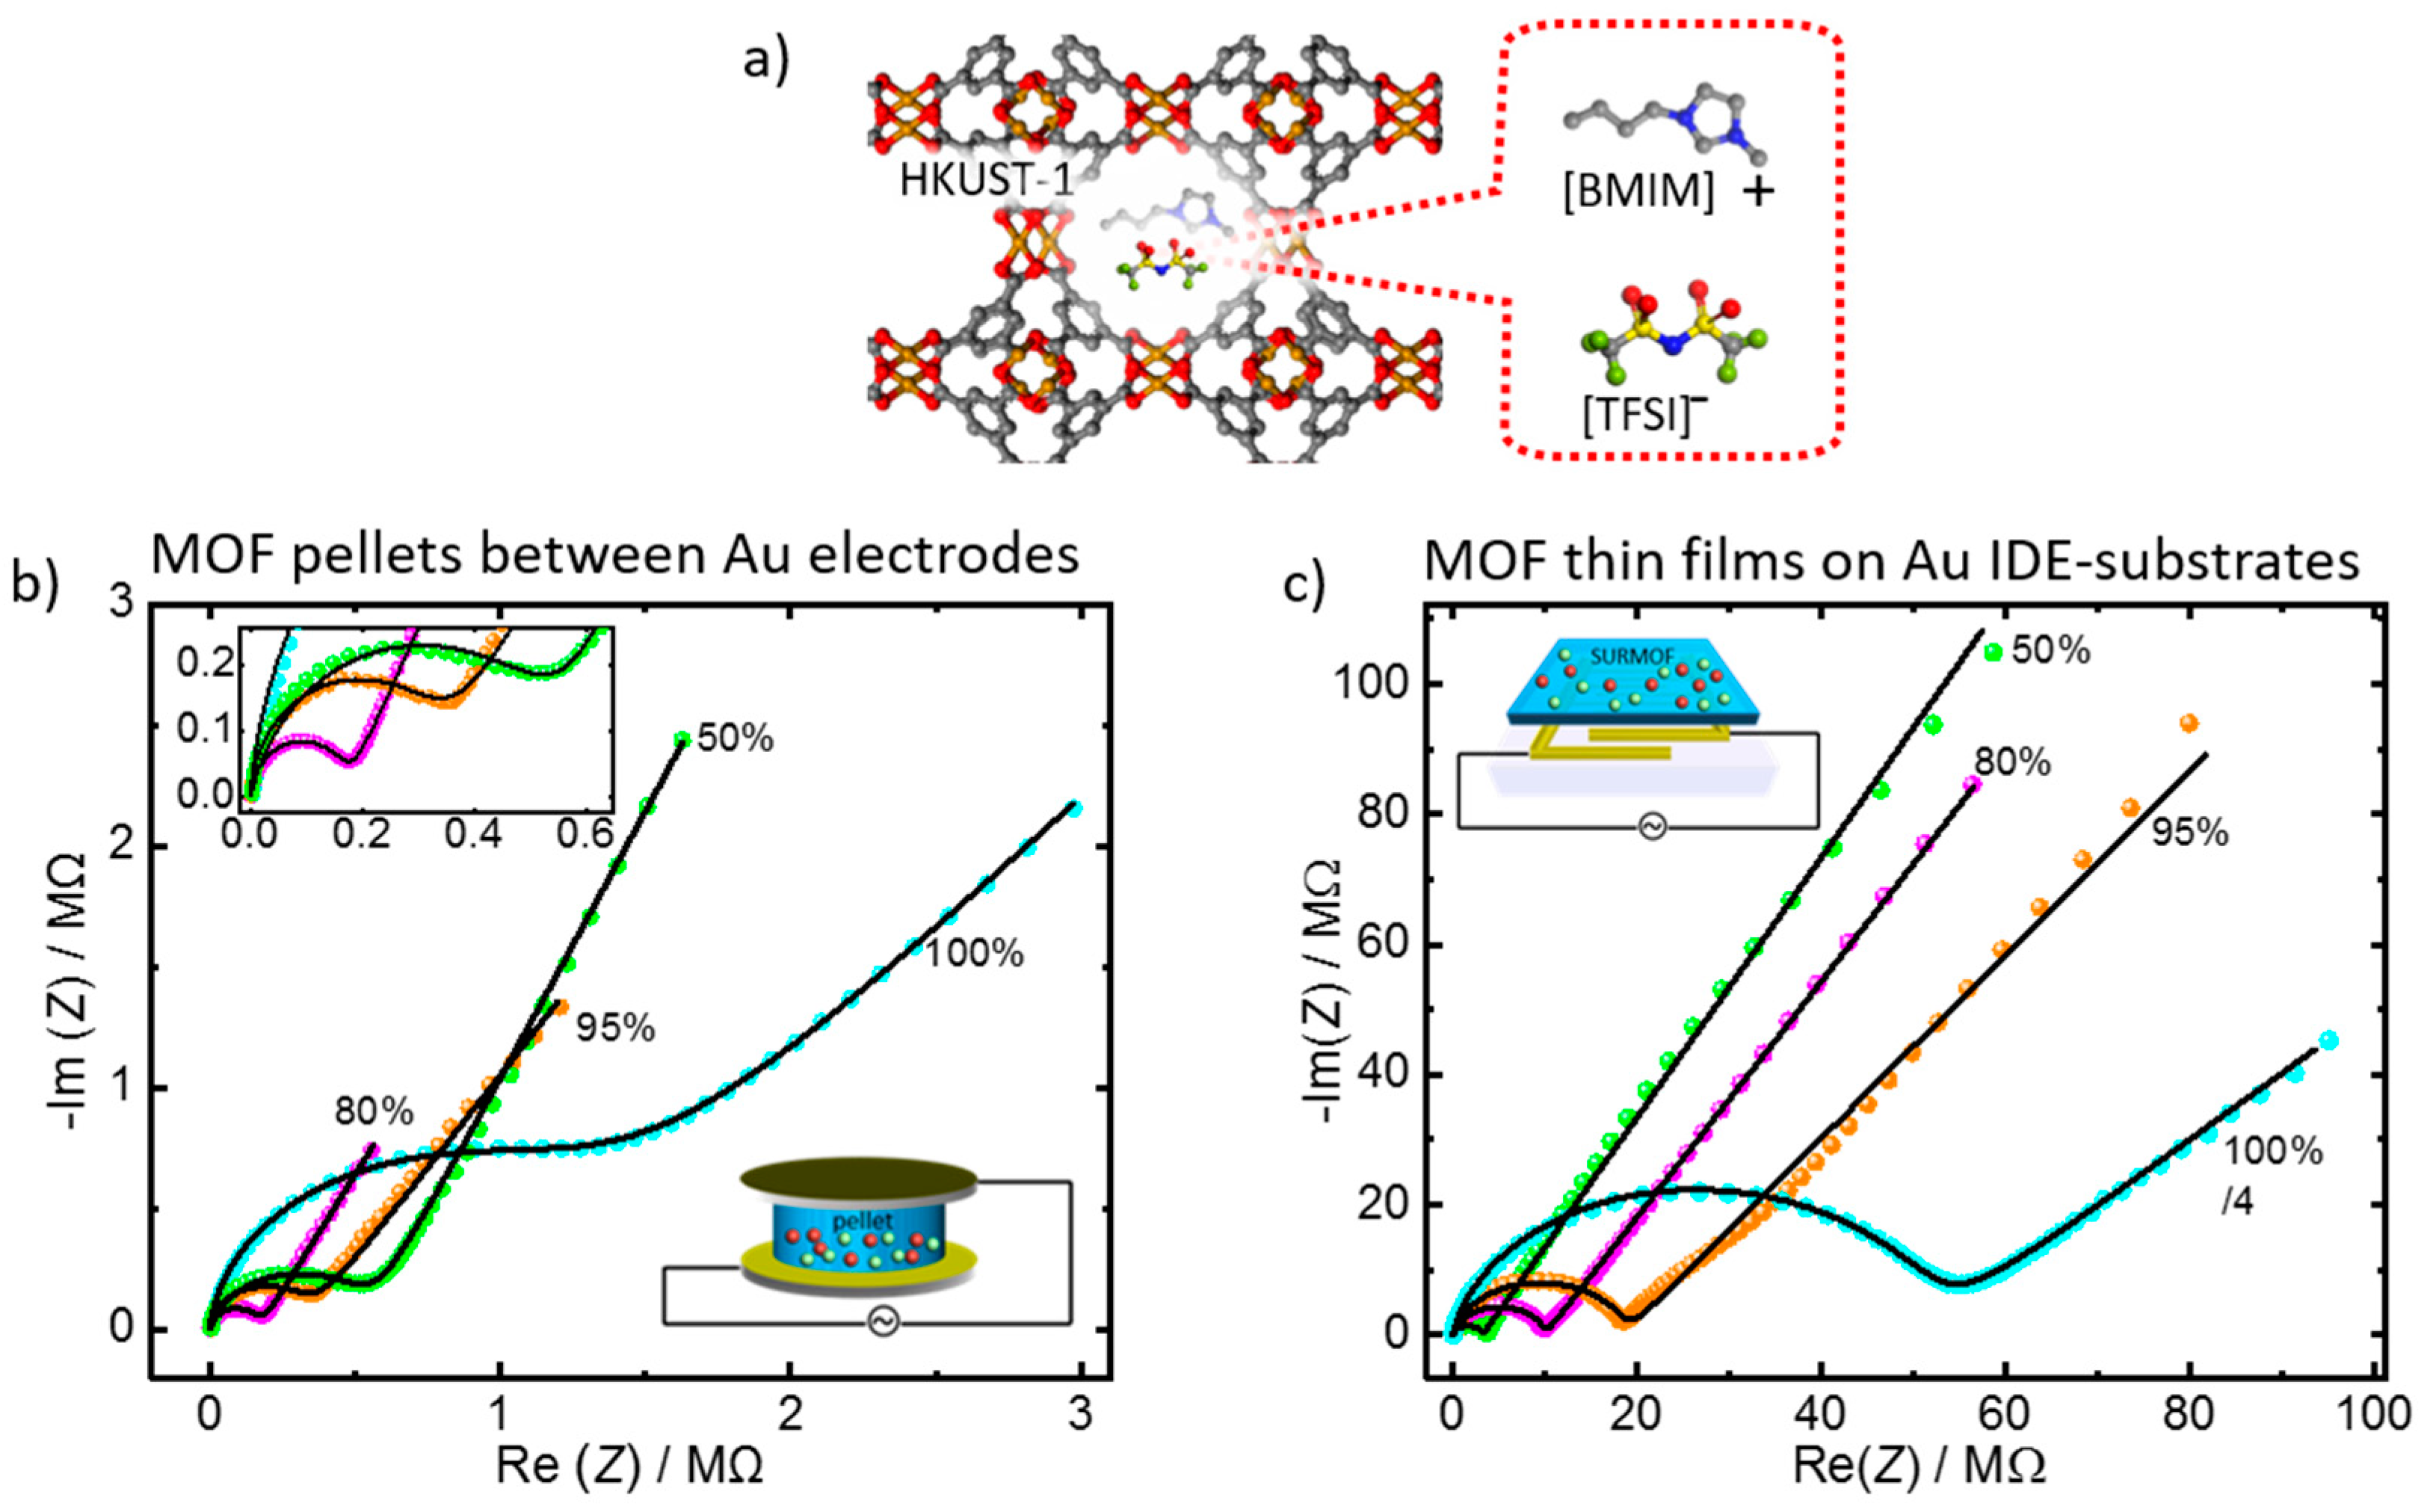
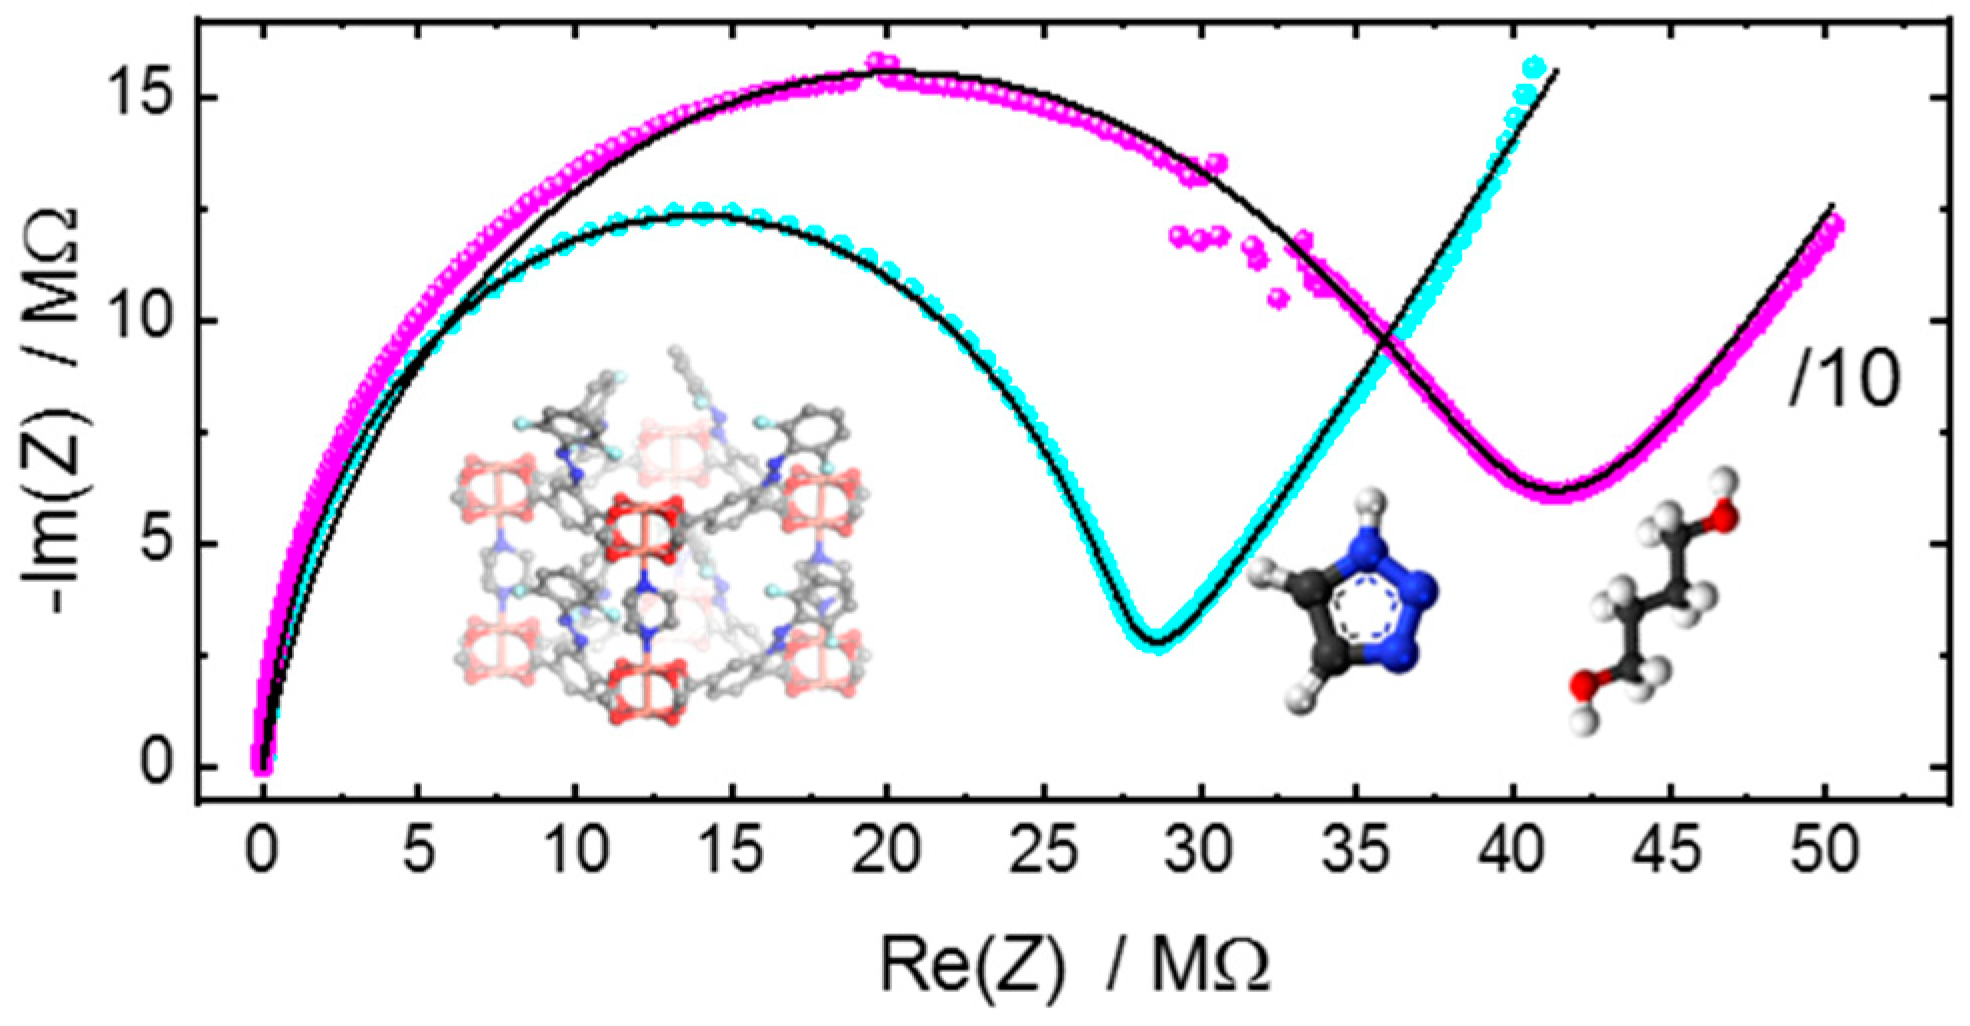
3.2. Application of the Equivalent Circuit to the Ionic Conduction in MOF Films and Pellets

The equivalent circuit is applied to the conduction of ionic liquids in MOF materials, in the form of pellets and thin films—Figure 3. In detail, MOFs of type HKUST-1 filled with various loadings of IL of type [BMIM][TFSI] are studied. Figure 3b shows the ionic conduction in MOFs in the form of pellets, and Figure 3c shows the ionic conduction in a MOF film grown on a substrate with deposited (IDE) electrodes. In both cases, the characteristic semi-circle at high frequencies and the straight line at low frequencies are clearly visible. The experimental data can be well described by the suggested equivalent circuit.
For proton-conducting materials, there is also no charge transfer between the electrode and the electrolyte, i.e., through the electrode-electrolyte interface. Thus, the suggested equivalent circuit can also be applied. In Figure 4, the Nyquist plots measured for two different proton-conducting molecules, that are 1,2,3-triazole and 1,4-butanediol, in the pores of a MOF thin film are shown. The data can be described well with the (R-CPEdl)‖CPEgeo equivalent circuit.
As a reference, the Nyquist plots of pure IL and of protic liquids, triazole, deionized water, and butanediol, on the substrates with the deposited electrodes are shown in the appendix, Figure A1. The qualitative shape of the Nyquist plot of the pure liquids and the liquids in the MOF confinement are similar.
The parameters used to describe the experimental data in Figure 3 and Figure 4 with the (R-CPEdl)‖CPEgeo model are shown in Table 1. The constant phase exponents of the electrical double layer, ndl, is in all cases larger than 0.5. This indicates that a (purely phenomenological) description of the data by a Randles-cell-like circuit results in a larger deviation than by the (R-CPEdl)‖CPEgeo circuit. Indeed, in comparison to the fits with the Randles-cell-like circuit [26,27], the (R-CPEdl)‖CPEgeo circuit allows a significantly better reflection of the experimental data (see Appendix A, Figure A2, Figure A3, Figure A4 and Figure A5).
The ndl values of the pure liquids are in the range of 0.66 and 0.84 (Table A1), while the ndl values of the MOF samples are significantly smaller. The ndl values of the MOF pellets are in the range of 0.55 to 0.73 and 0.51 and 0.71 for the SURMOFs on the IDE-substrates. The smaller constant phase exponents indicate that the interfaces with the MOF are more heterogeneous than the interfaces of the pure liquids.
EIS is typically applied to nanoporous materials with the objective of determining the material’s conductivity σ, which is calculated from the determined ohmic resistance R of the sample. Usually, the equation σ = d A−1 R−1 is used, where d is the distance between the electrodes and A is the cross-sectional area of the sample. For MOF films on IDE-substrates, A is the total gap length times the average MOF film thickness. For MOF-pellets, A is the area of the pellet top or bottom surface. The calculated conductivities for the examples in Figure 3 and Figure 4 are given in Table 1. The conductivity values determined by the suggested equivalent circuit match the conductivity values previously determined [26,27]. The deviations are only a few percent.

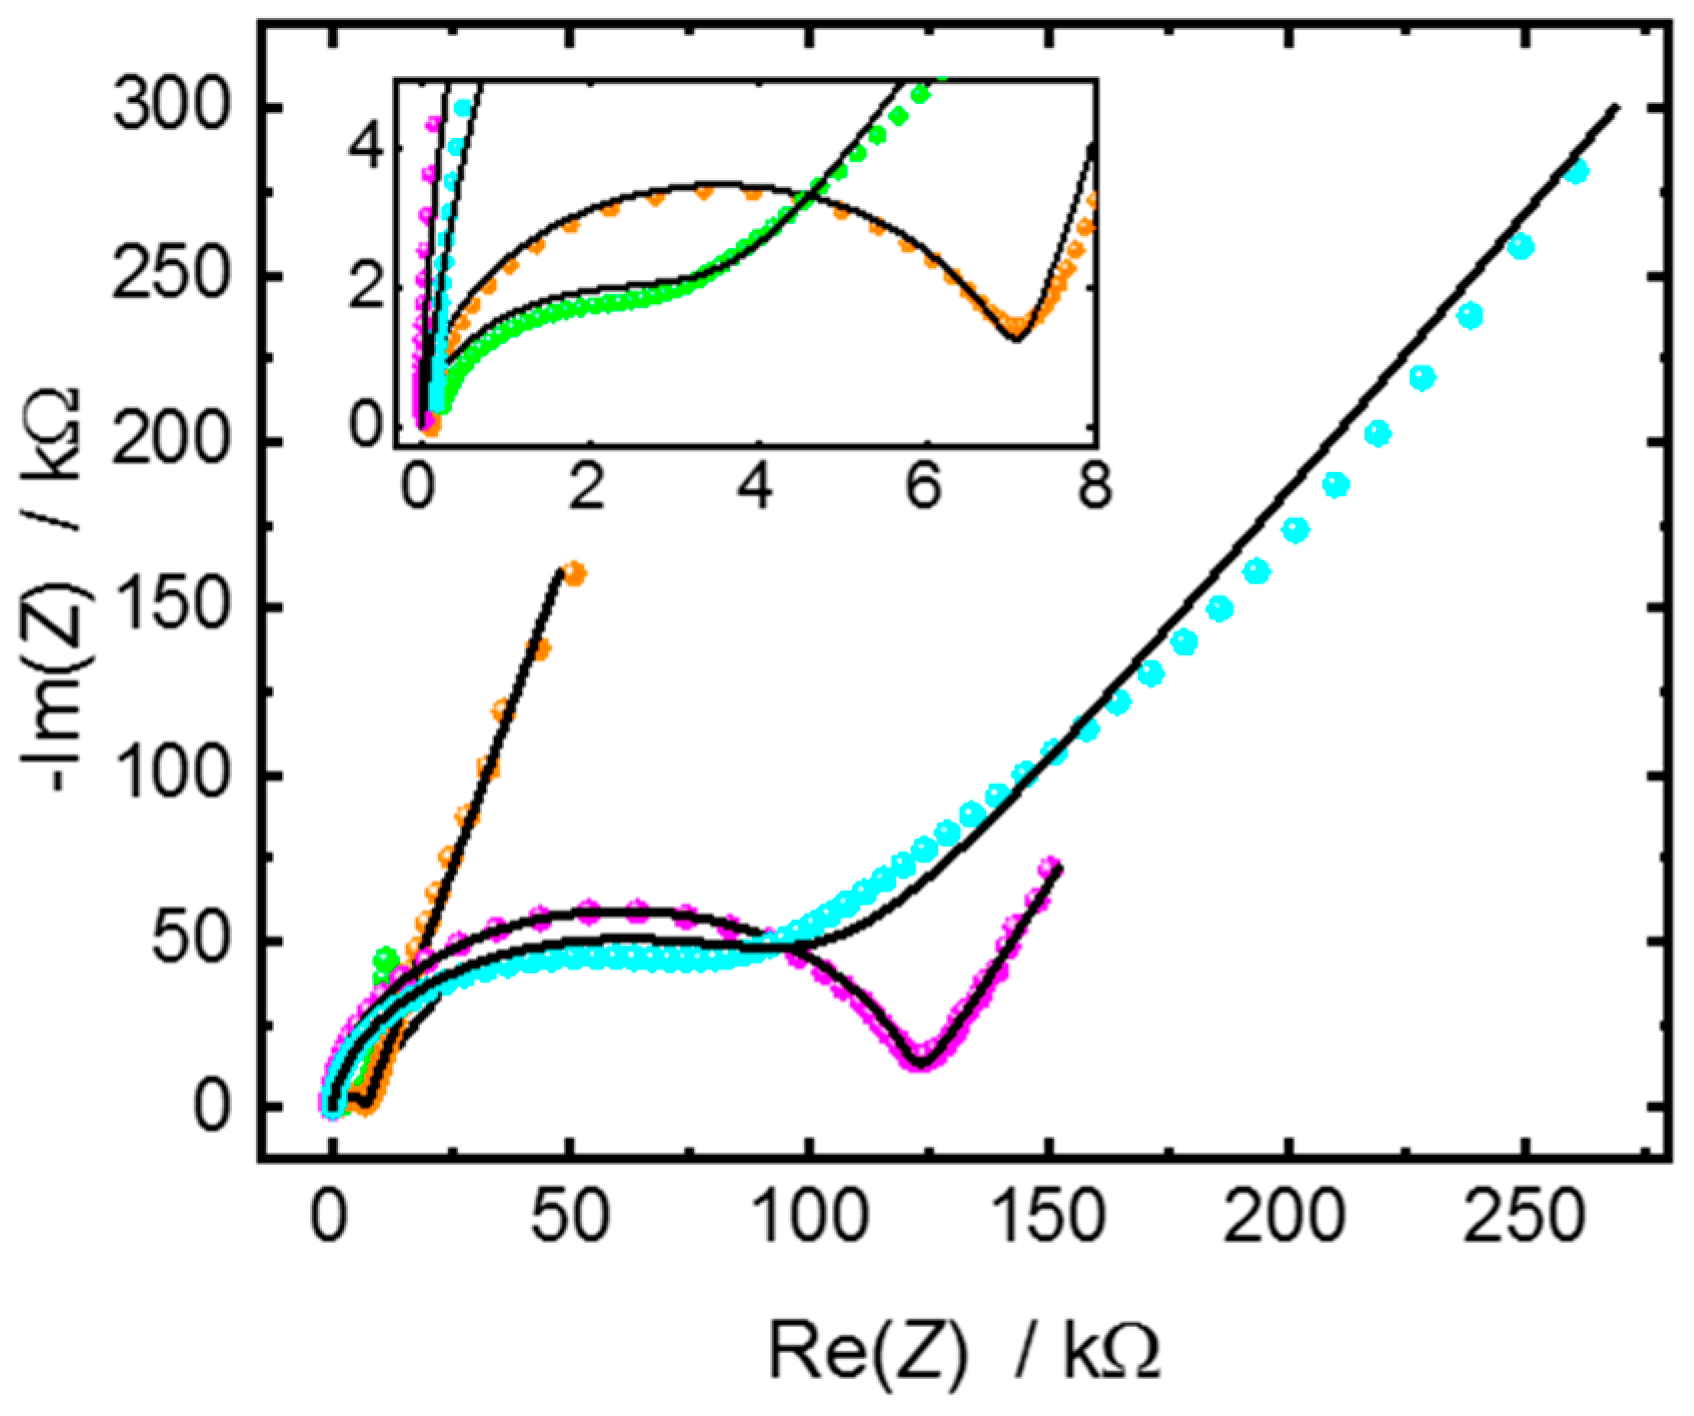
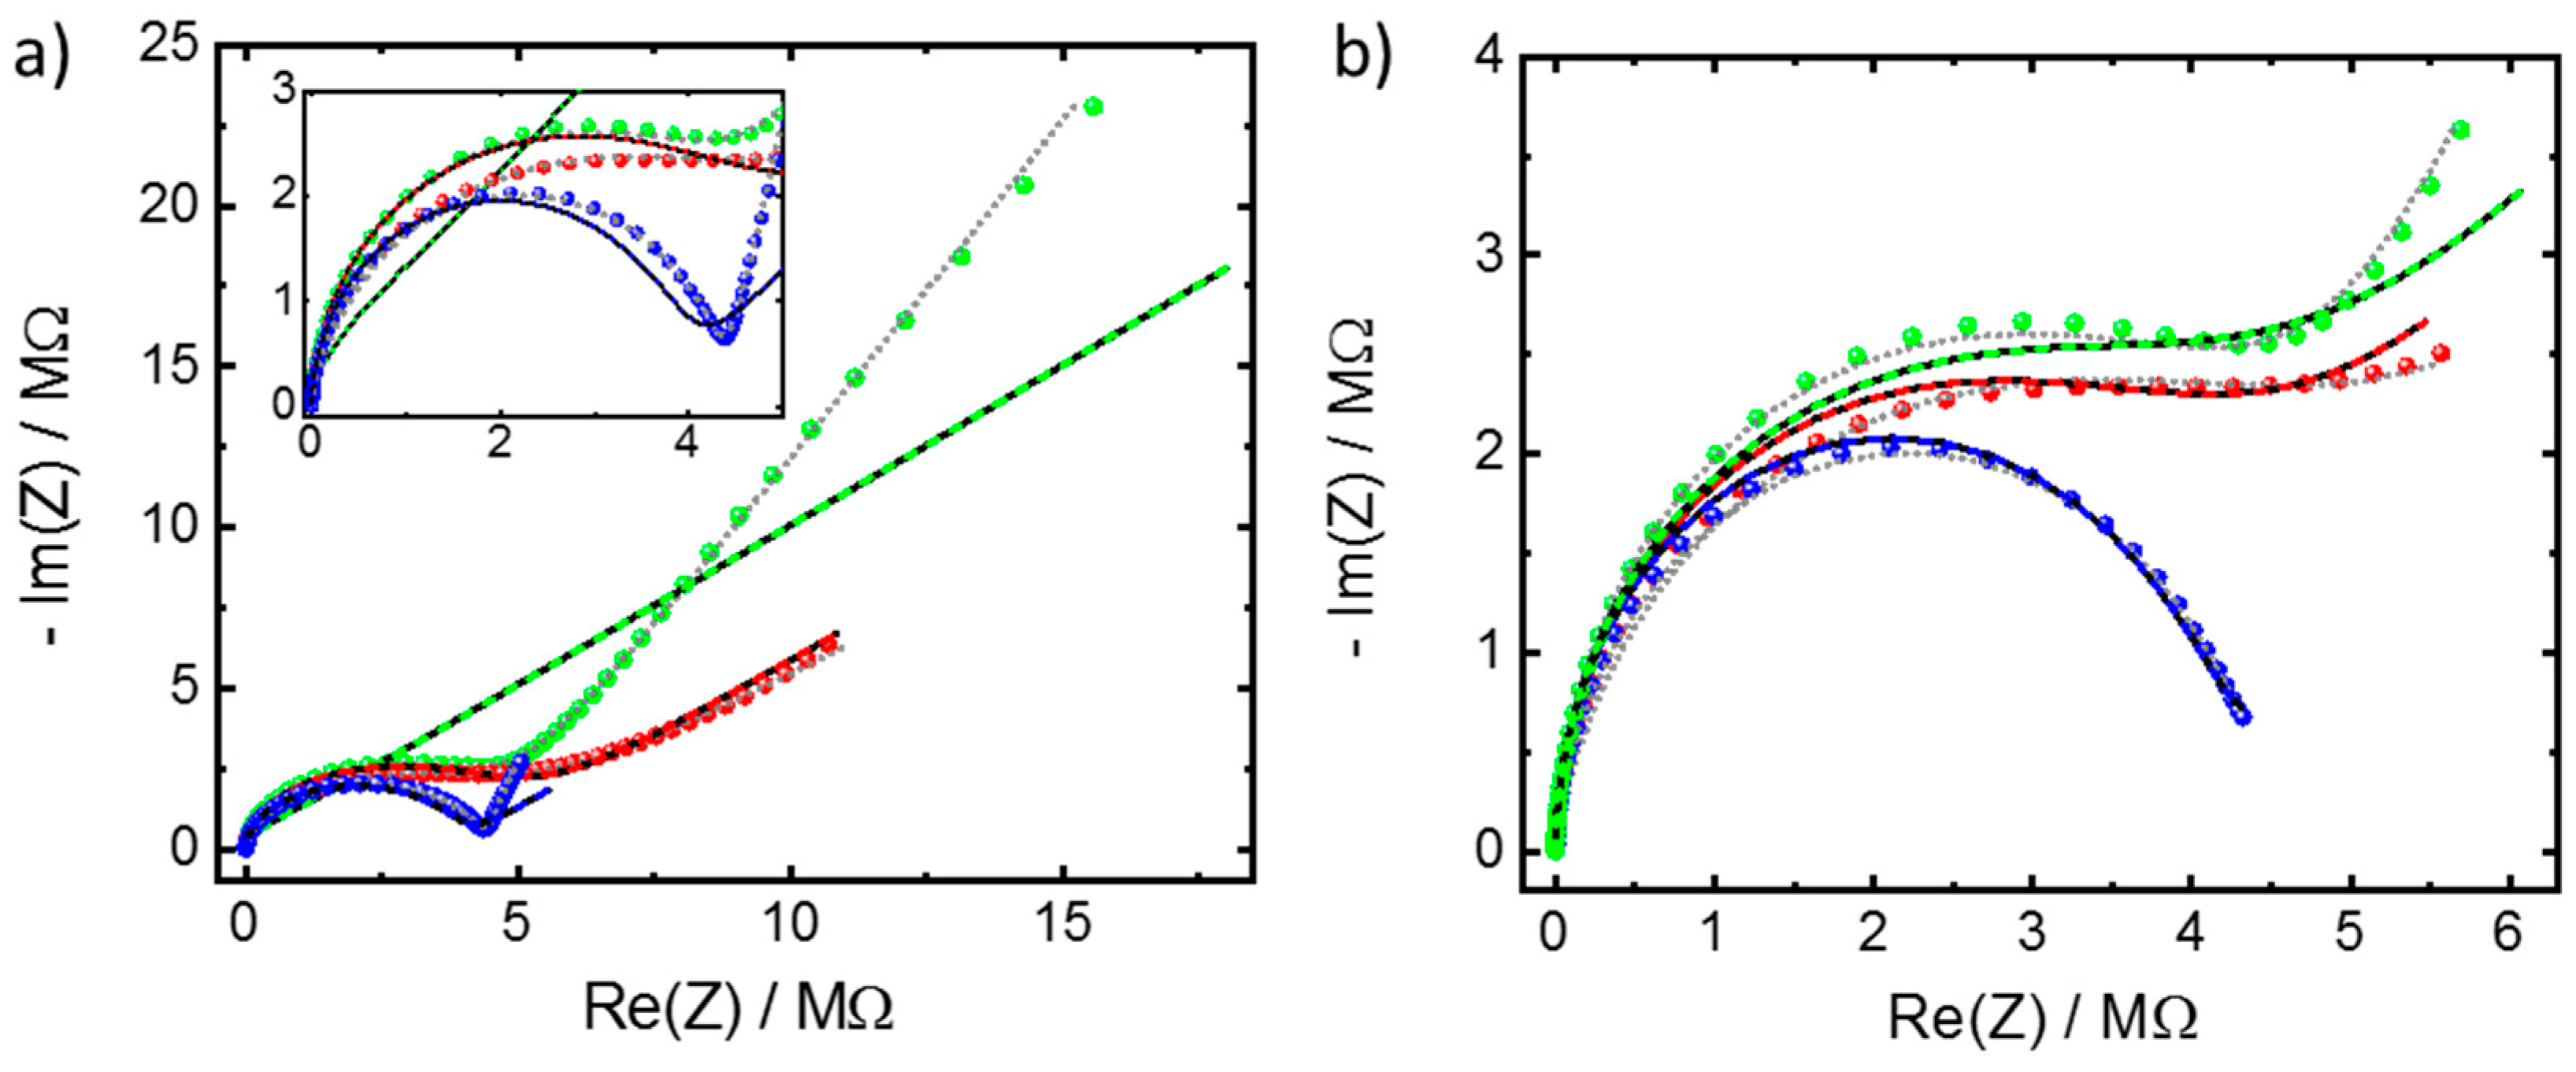
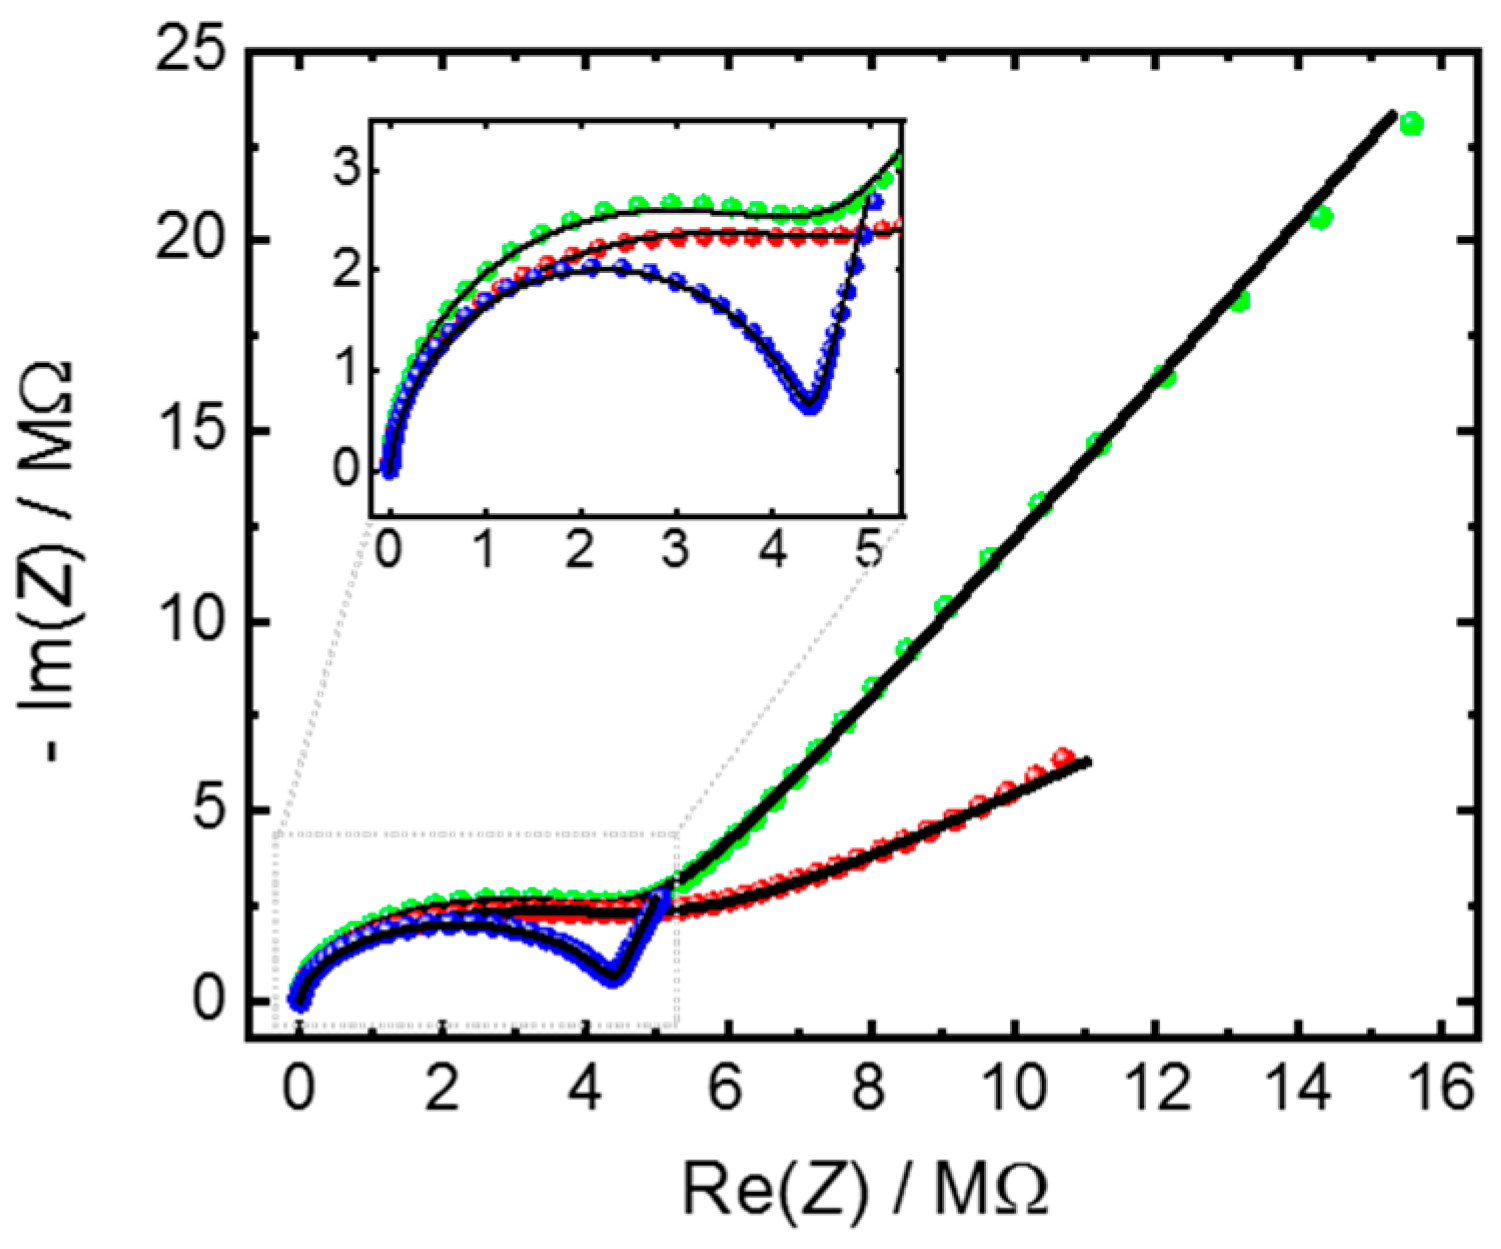
3.3. Insights in the MOF-Electrode Interface

In addition to the quantification of the conductivity, the appropriate equivalent circuit can provide further details of the electrochemical system. We use the method to compare the properties of very similar SURMOF samples of the HKUST-1 structure. The samples are prepared on the same kind of IDE-substrates, but the substrate treatment, before the SURMOF synthesis, varies. To this end, three popular methods for functionalizing the substrate surface prior to the SURMOF-lbl-synthesis were used: (1) one substrate was treated with UV-ozone [50,51,52]; (2) one substrate was functionalized with -OH-terminated MUD-SAM [52,53,54]; and (3) one substrate was functionalized with -COOH-terminated MHDA-SAM [55,56]. The SURMOF films are prepared simultaneously with the same methods, so the MOF film thickness is essentially the same (see also the scanning electron images, Figure A6). The crystallinities of all samples are also comparable—Figure A7. In Figure 5, the Nyquist plots of the three SURMOF samples filled with IL are shown. All Nyquist plots can be described with the (R-CPEdl)‖CPEgeo-reference-circuit, and the parameters are given in Table 2. The ohmic resistances of all three samples are in the range of 4.4–4.9 MΩ, corresponding to a conductivity of approximately 2.5 µS m−1. However, a surprising feature is that the CPEdl-parameter varies significantly, which can be seen by the different size of the low-frequency spike.
The capacitance of a CPE can be calculated by C dl = ( R × C P E dl ) 1 / n dl / R (see ref. [57,58], or chapter 8 in ref. [14])—Table 2. While the SURMOF-sample prepared on the substrate functionalized via UV-ozone treatment shows a large dl-capacitance, the dl-capacitance of the sample on the COOH-functionalized substrate is smaller, and the smallest dl-capacitance has the sample on the OH-functionalized substrate. Due to the inhomogeneity of the IDE and the electric field at the electrode-MOF interface, the precise determination of the dl-thickness is clearly not possible. Nevertheless, we use the dl-capacitance for a comparison of the three samples. The capacitance of the electrical double layer is given by C = ε r ε 0 A / λ , where ε r is the dielectric constant of the electrolyte, ε 0 is the vacuum permittivity ( ε 0 = 8.854 × 10 12   F   m 1 ), and λ is the thickness of the electrical double layer. A is the area of the double layer (i.e., the contact area between the electrode and electrolyte), which is difficult to assess, although the total electrode areas are known. Here, λ and ε r are average values and the total area of the electrode is used for A. Since the geometries of the electrodes, the MOF structure, and the electrolyte of the three samples are identical, the comparison of the estimated dl-thicknesses is possible. It shows that IL in the MOF pores of the UV-ozone treated sample has the smallest dl-thickness, followed by the IL in the MOF on the COOH-terminated SAM substrate, and the OH-terminated SAM substrate. In all these MOF samples, the determined dl-thicknesses are much larger than the dl-thickness determined of pure IL on the Au electrodes—see Table 2 and Table A1, as well as for literature reference values [59,60,61]. We believe that the large dl-thickness of the IL in the MOF confinement is caused by structural defects and deficiency at the MOF-electrode interface. We speculate that defective MOF regions which are impermeable for the IL are present at the electrode interface cause large distances between the IL-electrolyte and the electrode, and, thus, causing large assessed dl-thicknesses. These defective regions are presumably dense copper acetate precursor species, as observed by atomic force microscopy and infrared spectroscopy [62]. In addition, the defective regions decrease the contact area A of the electrolyte-electrode interface. Since A was set constant for calculating the dl-thickness, the calculated dl-thickness is smaller. Regardless of the nature of the defects, we can use the calculated dl-thickness to classify the quality of the MOF samples. The sample where the IL has the smallest dl-thickness has the highest porosity at the interface, and, thus, the highest quality. As result, the interface of the MOF film made on the substrate upon UV-ozone treatments has the highest quality.
It should be noted that calculating the dl capacity for the IL-filled MOF pellets shown in Figure 3b results in values of about 1 nF, and in dl-thicknesses of about 1 µm. We believe this large calculated dl-thickness is not caused by defective MOF regions, rather than by the small contact area between the IL@MOF-pellet and the gold electrodes. Better contact with a larger contact area would increase the dl-capacitance, resulting in a more pronounced semi-circle—see Figure 2b.

4. Conclusions

The conduction of ions in nonconducting nanoporous MOF materials was explored. For the material in the form of pellets sandwiched between two inert, nonpermeable gold electrodes as well as for thin films grown on nonconducting substrates with two deposited electrodes (such as interdigitated electrodes), the equivalent circuit is derived, referred to as (R-CPEdl)‖CPEgeo. The application of the equivalent circuit allows the description of the experimentally determined impedance data, significantly more precisely than with the previously used reference circuits. Moreover, each component has a clear physical meaning and can be correlated to the electrochemical system. In addition to the determination of the material conductivity, the application of the equivalent circuits provides further insights, showing that the double-layer of the electrolyte in the MOF material is significantly more heterogeneous than the double-layer of the pure electrolyte. The IL@MOF-electrode interface can be qualitatively characterized by comparing the assessed double-layer-thicknesses. The analysis shows severe differences in the interface properties although the conduction properties are similar.
Although the interface of the nanoporous film and the substrate is of paramount importance for the application, e.g., in batteries, supercapacitors, and electrocatalysis, their direct exploration by advanced methods, such as high-resolution microscopy, presents a severe challenge. Thus, we believe the presented method will help to explore the MOF-support interface and will contribute to enhanced MOF-device performances.

Author Contributions

Conceptualization, L.H.; experiments, A.C. and Z.Z.; writing—original draft preparation, A.C. and L.H. All authors have read and agreed to the published version of the manuscript.

Funding

This research was funded by the German Science Foundation (DFG HE 7036/5, and SPP 1928 “COORNETs”).

Institutional Review Board Statement

Not applicable.

Informed Consent Statement

Not applicable.

Data Availability Statement

All data generated or analyzed during this study are either already published (as indicated) or are available from the corresponding author on reasonable request.

Acknowledgments

We acknowledge support by the KIT-Publication Fund of the Karlsruhe Institute of Technology.

Conflicts of Interest

The authors declare no conflict of interest.

Appendix A

Appendix A.1. MOF Powder Synthesis, IL Loading and Pellet Preparation

HKUST-1 MOF in the form of crystalline powder was prepared by following standard synthesis methods [44]. In detail, Cu(NO3)2·3H2O (0.87 g, 3.6 mmol) and BTC (0.42 g, 2.0 mmol) were dissolved in 24 mL of a mixture of ethanol and deionized water (1:1 v/v). The solution was kept in a Teflon-lined autoclave at 100 °C for 24 h. Upon cooling to room temperature, a crystalline powder was obtained. The powder was centrifuged and washed thoroughly with a mixture of water and ethanol (1:1 v/v). The powder was activated under a vacuum at 120 °C for 16 h. For the loading of the MOF powder with IL, different amounts of [BMIM][TFSI] were added to the activated HKUST-1 powder separately, homogeneously mixed and heated under a vacuum at 120 °C overnight. In detail, the IL amount was 74.9 mg of IL per 100 mg MOF for 100% loading, 71.1 mg of IL per 100 mg MOF for 95% loading, 59.9 mg of IL per 100 mg MOF for 80% loading, 37.4 mg of IL per 100 mg MOF for 50% loading, and 11.2 mg of IL per 100 mg MOF for 15% loading. The percentage of the pore filling was previously determined [27]. For the preparation of the IL@MOF-pellets, we followed standard directions [45]. In detail, for each pellet, 200–400 mg of the material were placed inside a stainless steel press and the pellet was formed under a pressure of approximately 150 MPa. The resulting pellets had cylindrical shapes of 13 mm diameter with a thickness of approximately 1.7–2.0 mm. The conduction of the pellets was measured by positioning the IL@MOF-pellets between 2 planar electrodes, which are gold thin film (150 nm thickness) on conducting Si-wafer.

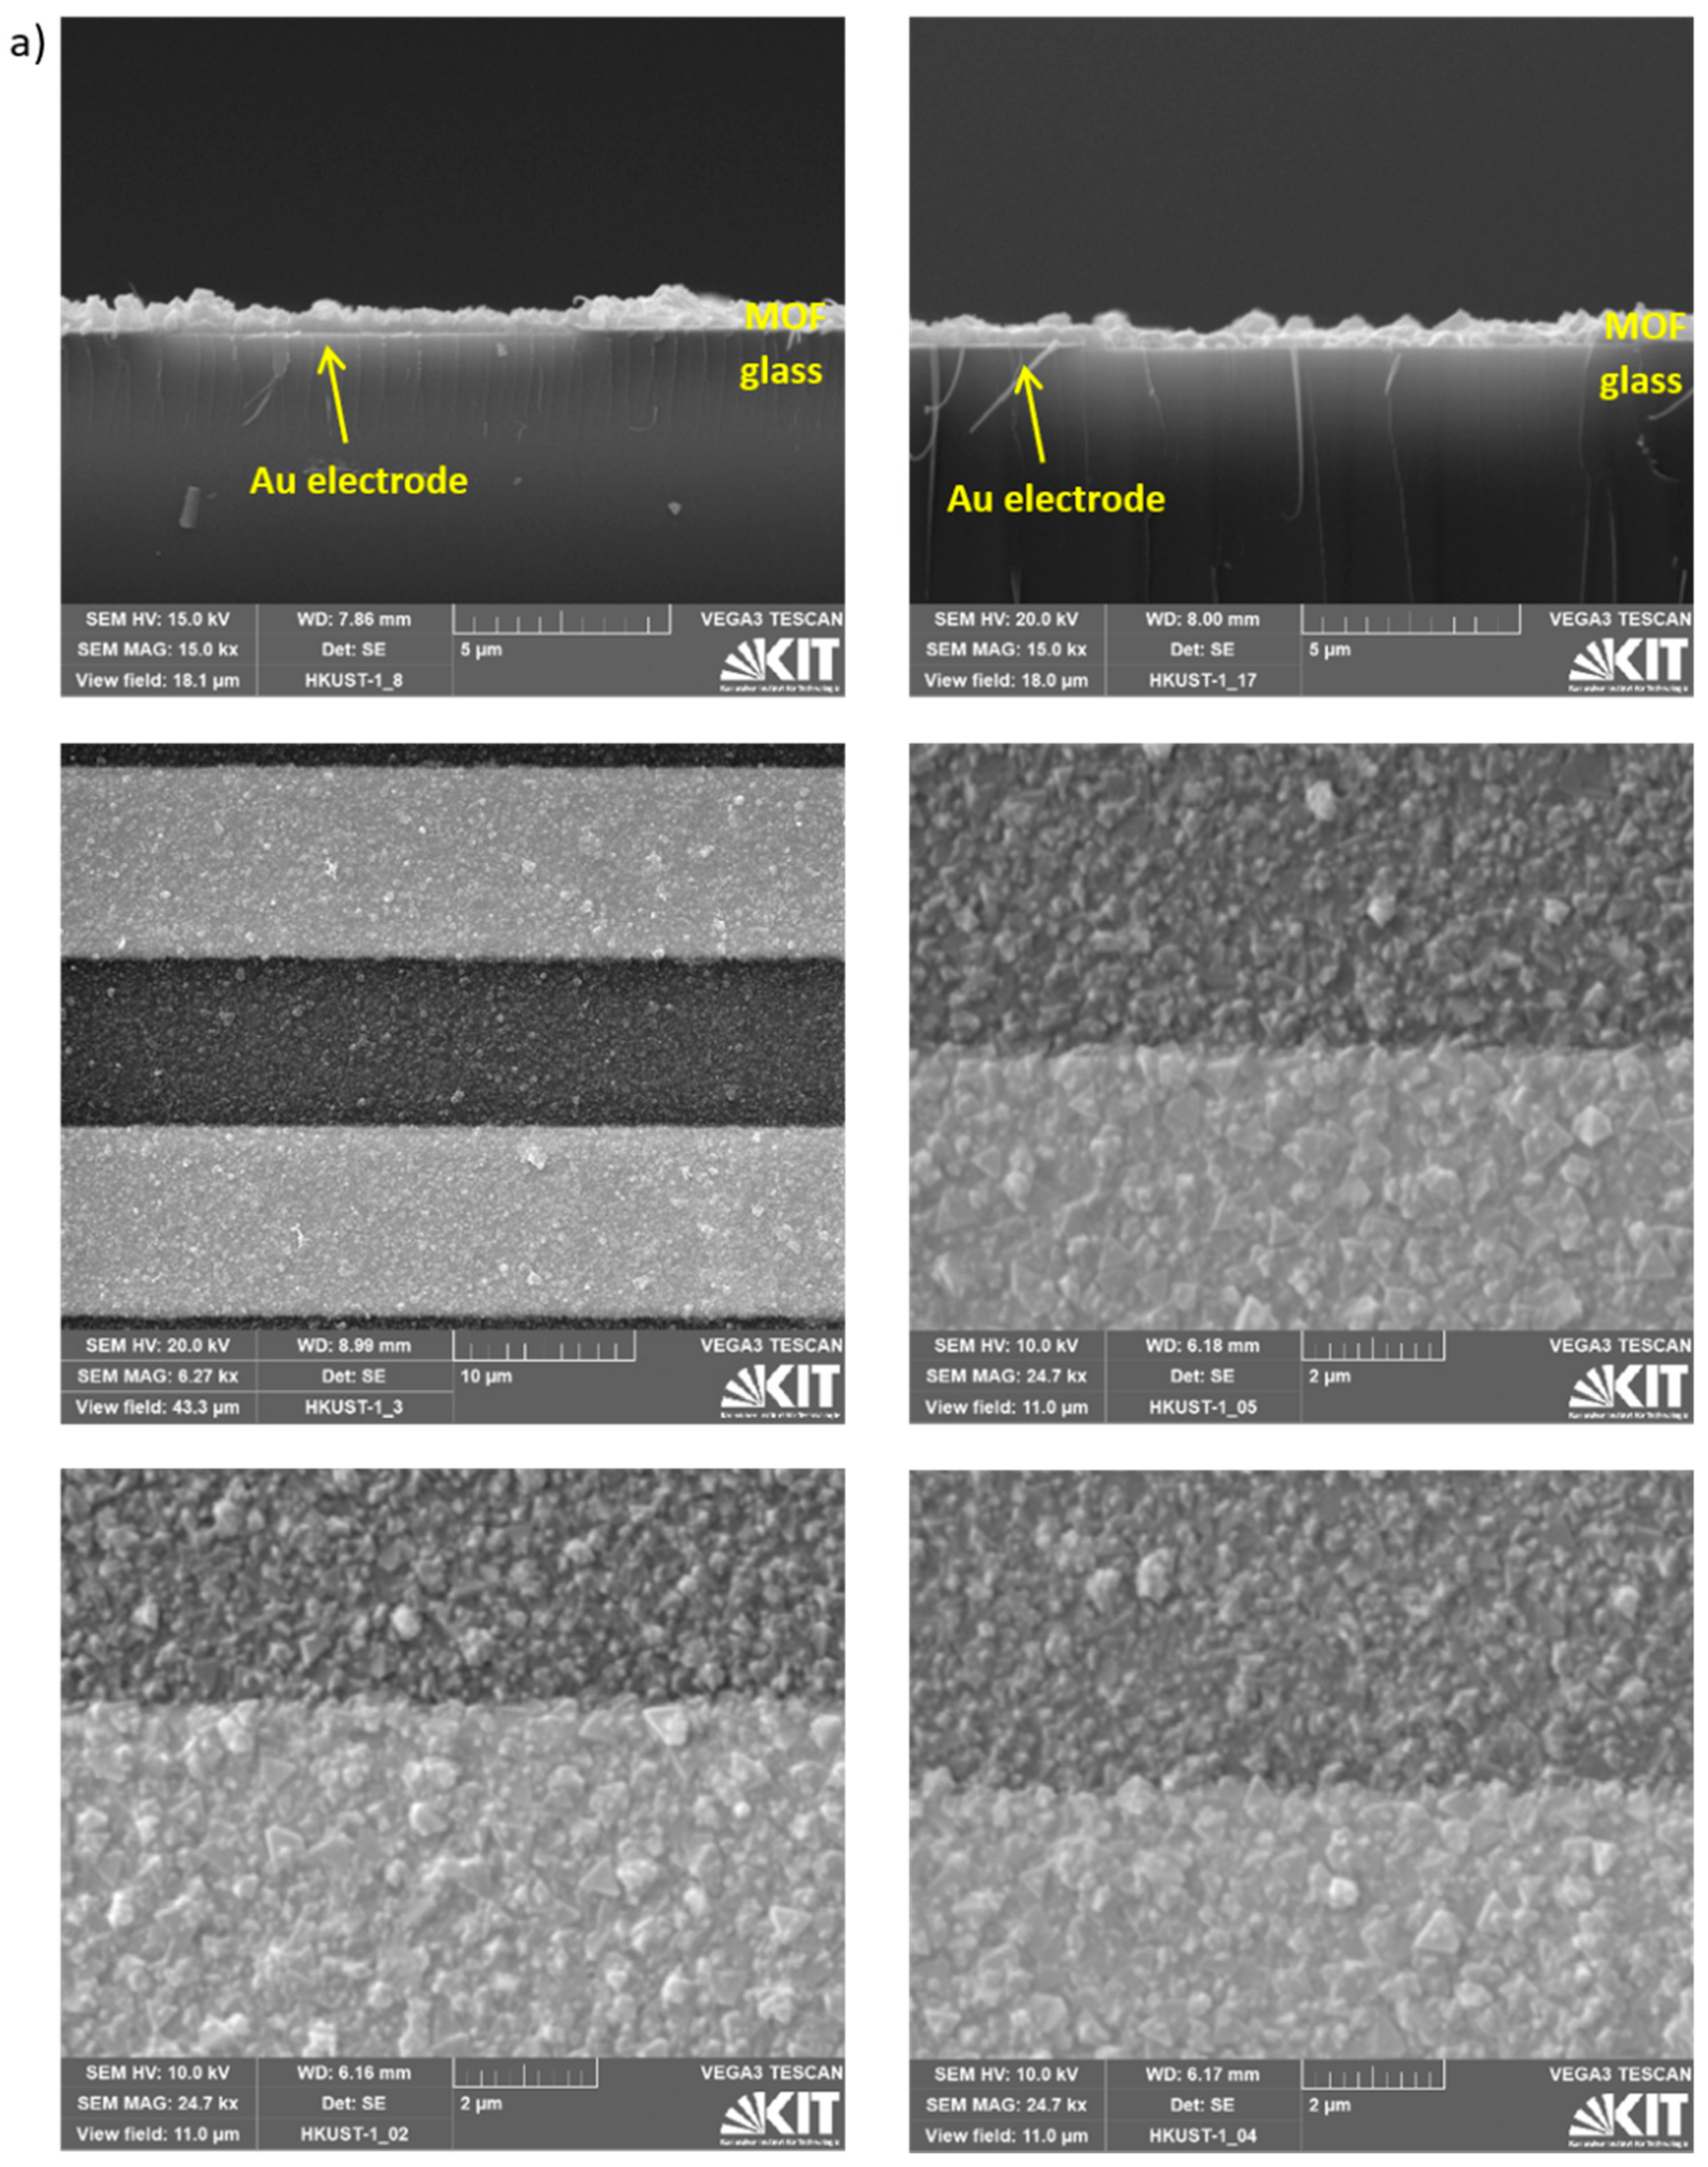
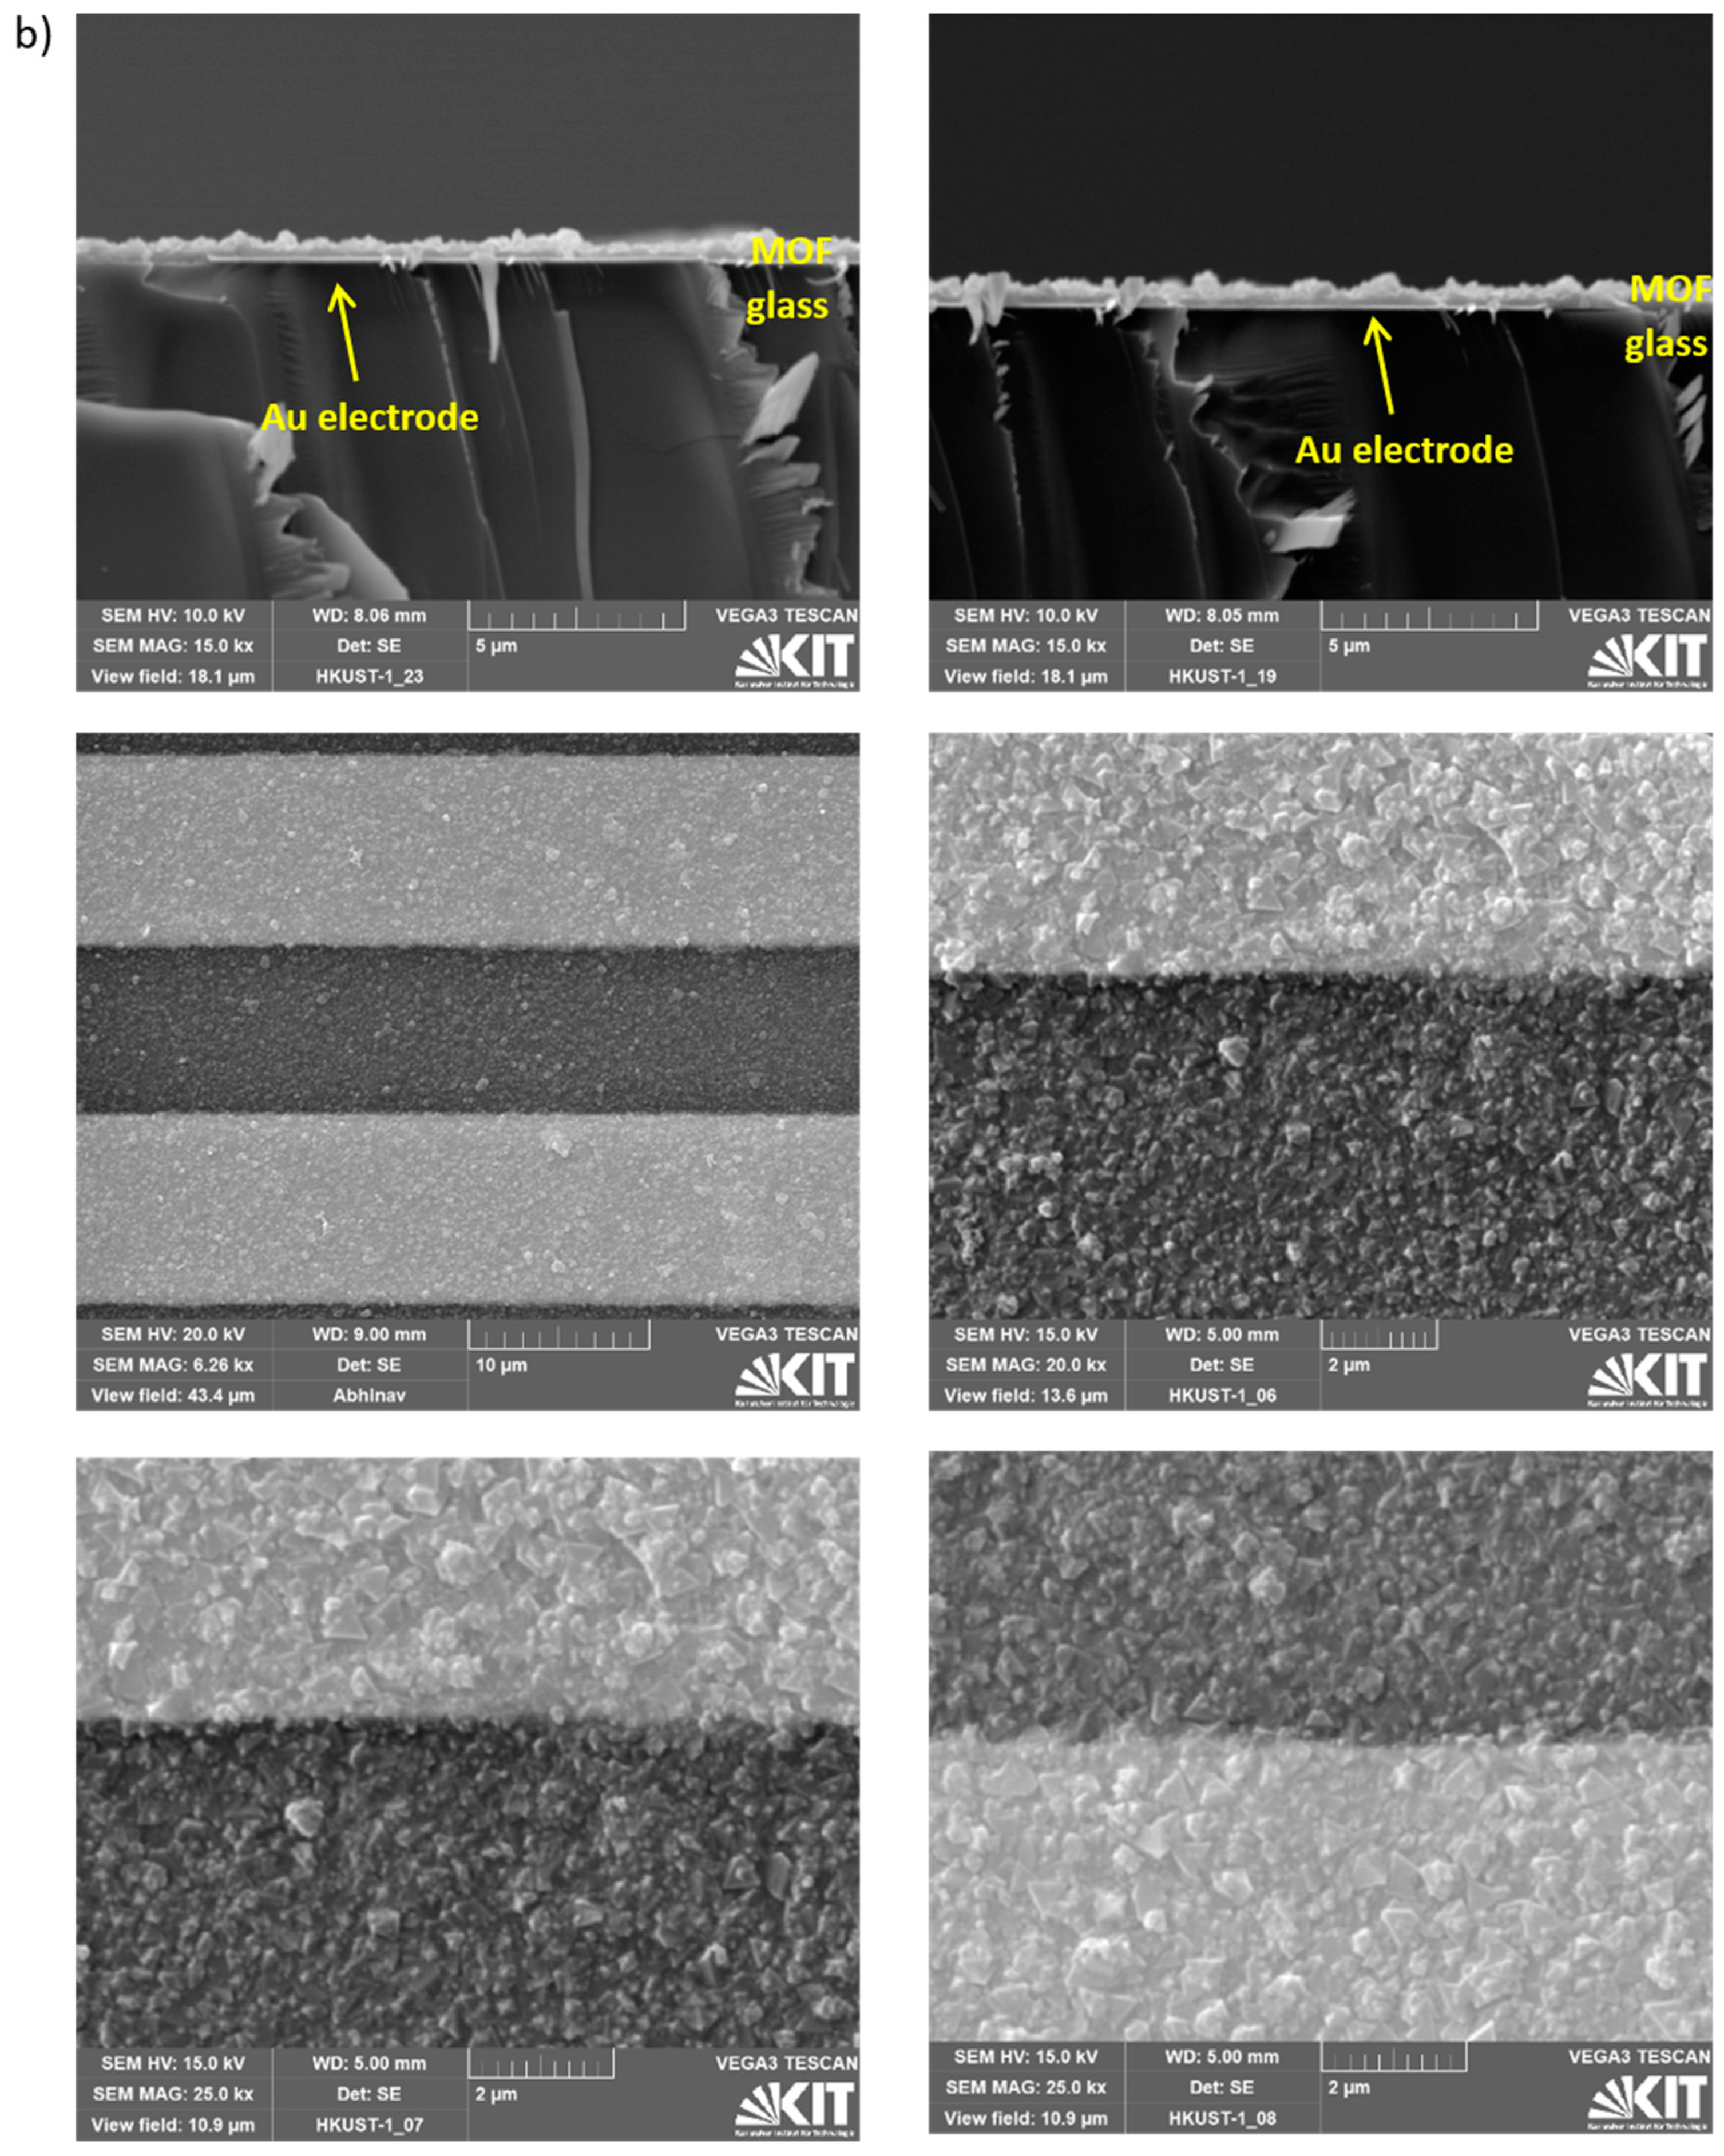
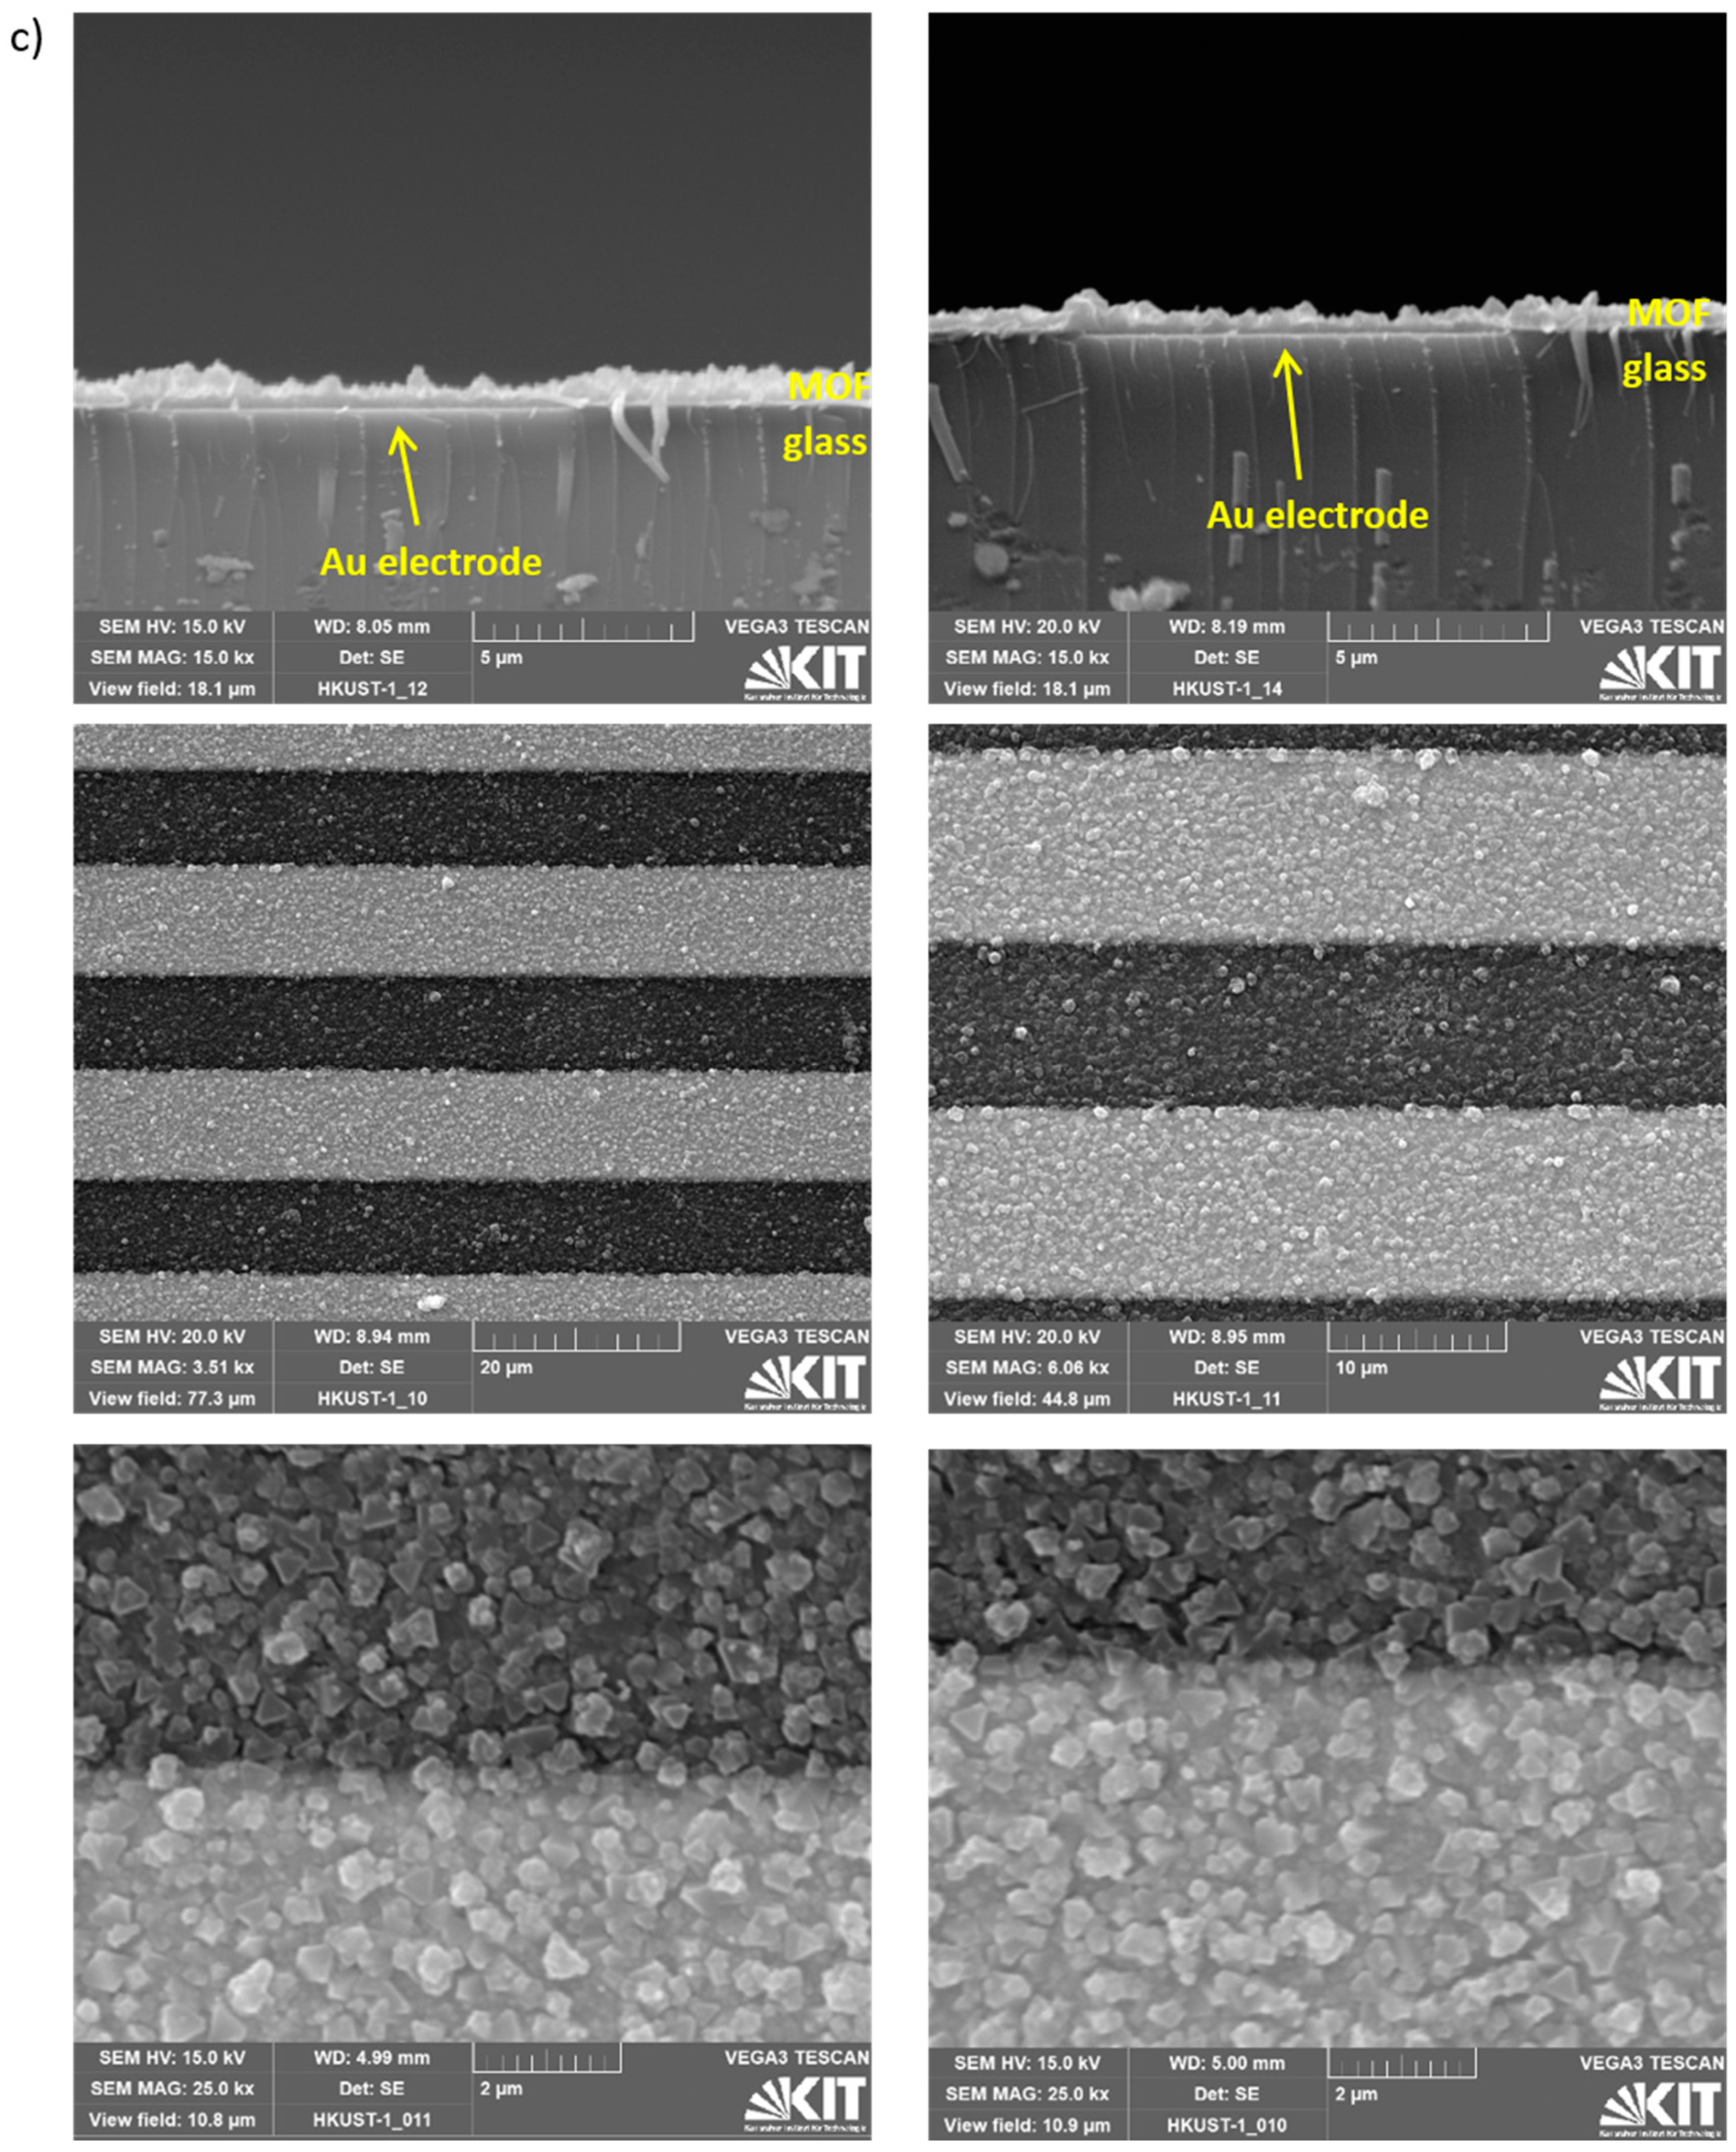
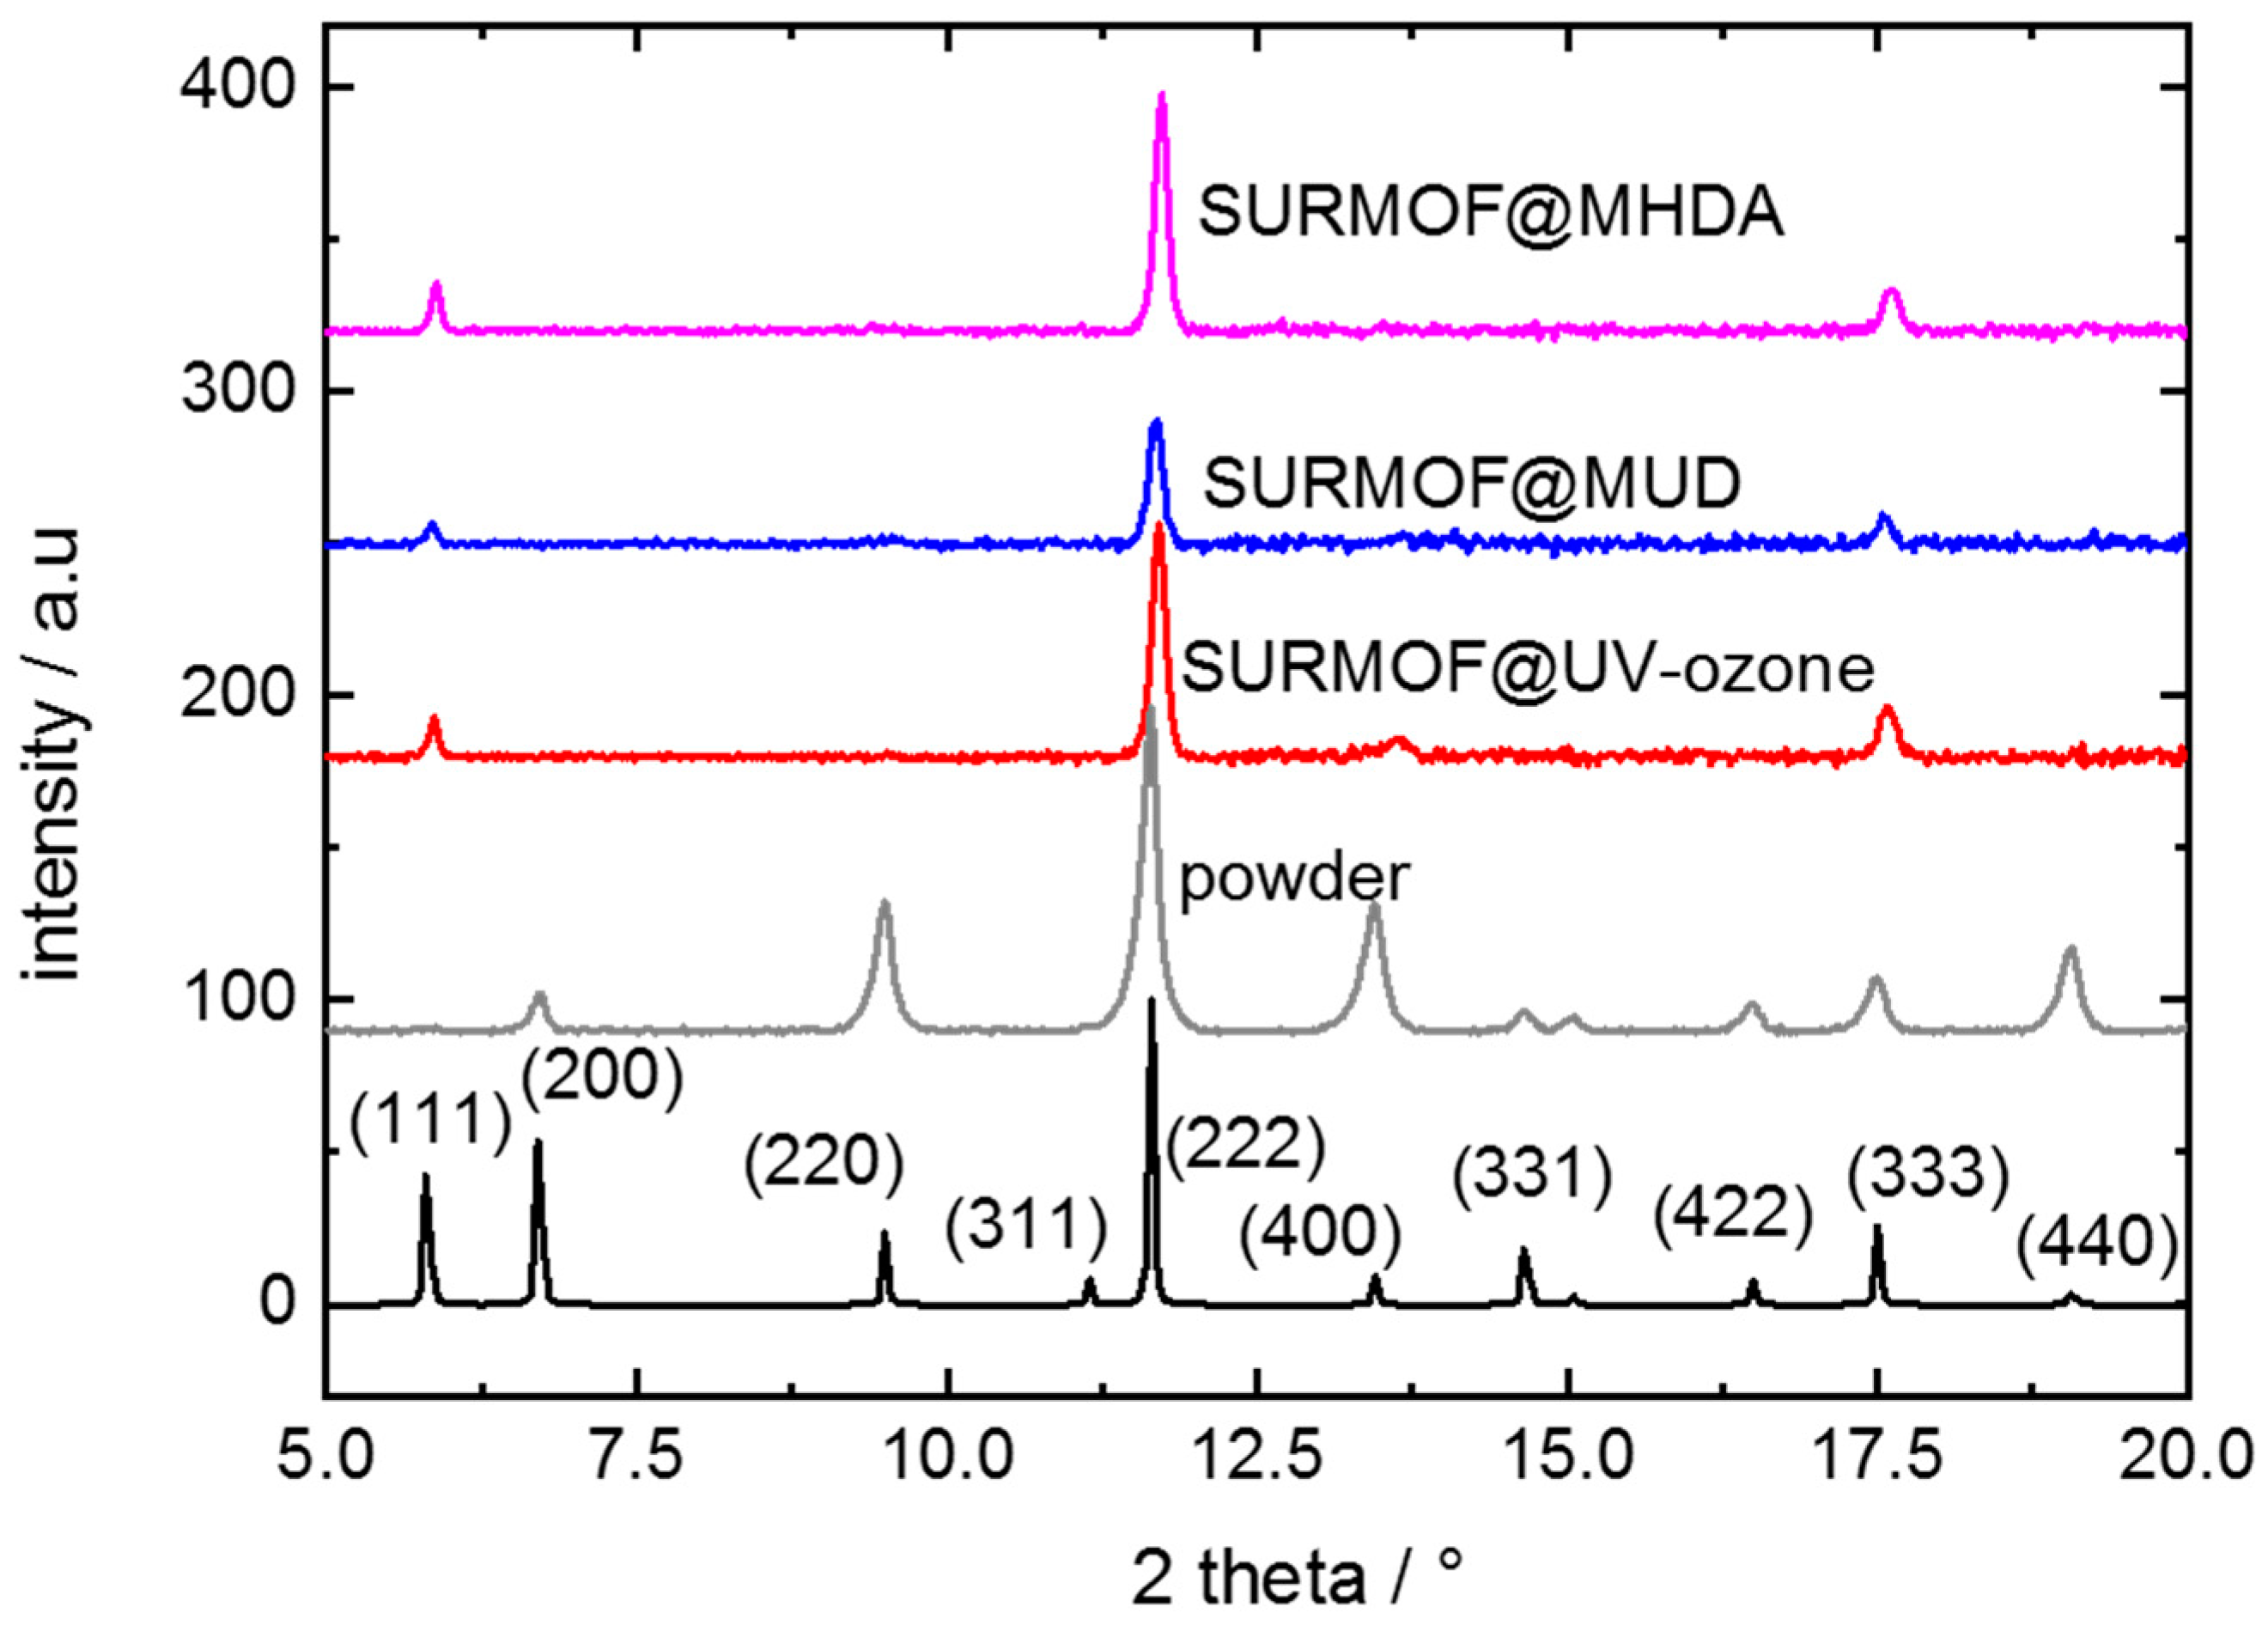
Appendix A.2. Additional Data—Nyquist Plots, Determined Parameters, SEM Images and XRD

Figure A1. Nyquist plots of pure liquids of 1,2,3-triazole (cyan), 1,4-butanediol (magenta), deionized water (orange) and pure IL (green). Butanediol and water droplets were deposited on an IDE-substrates with 10 µm gap distance and a total gap length of 1.69 m. The area of each electrode is approximately 17 mm2. Triazole and IL droplets were deposited on electrodes with a gap of 10 µm gap distance and a gap length of 1 mm. The area of each electrode is 0.01 mm2. The frequency range is from 100 Hz (triazole), 10 Hz (butanediol), 10 Hz (water), and 1000 Hz (IL) to 5 MHz. The data are fitted with the (R-CPEdl)‖CPEgeo equivalent circuit, black lines, and the parameters are given in Table A1.
Materials 14 04352 g0a1
Table A1. The parameters determined for the impedance data in Figure A1. IL refers to [BMIM][TFSI] ionic liquid. The thickness of the double layer is assessed by λ d l = ε r ε 0 A electrode / C dl . For the permittivity ε r , the following values were used: 14 for IL [64], 40 for triazole [65], 31.9 for butanediol [66], and 80 for water.
ElectrolyteR/kΩCPEdl / 10 9   F     s n dl 1 ndlCPEgeo / 10 12   F     s n g e o 1 ngeoDouble Layer Capacitance Cdl/nFEstimated Double Layer Thickness λdl/nm
IL3.7680.671790.951.151
butanediol12112420.732700.996097.8
triazole101820.661680.946.940.5
water7.13530.842481113105
Figure A2. Nyquist plots for the IL@HKUST-1 in the form of a MOF-pellet sandwiched between 2 gold electrodes, see Figure 3b. The experimental data are shown as spheres, the grey-dotted lines are the fits with the (R-CPEdl)‖CPEgeo circuit (same data as in Figure 3b). The black-color-dashed lines are the best fits by Randles equivalent circuit. The IL pore fillings are 50%, 80%, 95%, and 100%, as indicated. The frequency range in panel (a) is 100 Hz to 5 MHz, and in panel (b) is 1109 Hz to 5 MHz. Only the plotted data are used for the fitting by the models. The major reason for the poor description of the experimental data by the Randles circuit is the fact that the Warburg resistance of the Randles circuit results in a low-frequency ray with an angle of 45° in the Nyquist plots, which is often not the case in the experimental data. This results in poor fits, especially when the low-frequency range is recorded, see panel (a).
Materials 14 04352 g0a2
Figure A3. Nyquist plots for the IL@HKUST-1 in the form of a thin film on a glass substrate with interdigitated gold electrodes, see Figure 3c. The experimental data are shown as spheres, the grey-dotted lines are the fits with the (R-CPEdl)‖CPEgeo circuit (same data as in Figure 3c). The black-color-dashed lines are the best fits by Randles equivalent circuit. The IL pore fillings are 50%, 80%, 95%, and 100%, as indicated. The frequency range in panel (a) is 0.5 Hz to 5 MHz, and in panel (b) is 107 Hz to 5 MHz. Only the plotted data are used for the fitting by the models. Like in Figure A2, the major reason for the poor description of the experimental data by the Randles circuit is the fact that the Warburg resistance of the Randles circuit results in a low-frequency ray with an angle of 45° in the Nyquist plots, which is often not the case in the experimental data. This results in poor fits, especially when the EIS data at the low-frequency range is recorded—see panel (a).
Materials 14 04352 g0a3
Figure A4. Nyquist plots of the proton-conduction of triazole (cyan) and butanediol (magenta) in a pillared-layered SURMOF on an IDE-substrate—see Figure 4. The experimental data are shown as spheres, the grey-dotted lines are the fits with the (R-CPEdl)‖CPEgeo circuit (same data as in Figure 4). The black-color-dashed lines are the best fits by Randles equivalent circuit. The frequency range is from 0.5 Hz to 5 MHz.
Materials 14 04352 g0a4
Figure A5. Nyquist plots of IL in HKUST-1 SURMOF films on substrate functionalized with MUD-SAM (green) MHDA-SAM (red) and with UV-ozone for 30 min (blue)—see Figure 5. The experimental data are shown as spheres, the grey-dotted lines are the fits with the (R-CPEdl)‖CPEgeo. The black-color-dashed lines are the best fits by Randles equivalent circuit. The frequency range in panel (a) is 3.5 Hz to 5 MHz, and in panel (b) is 56 Hz to 5 MHz. Only the plotted data are used for the fitting by the models. Like in Figure A2 and Figure A3, the major reason for the poor description of the experimental data by the Randles circuit is the fact that the Warburg resistance of the Randles equivalent circuit results in a low-frequency ray with an angle of 45° in the Nyquist plots, which is often not the case in the experimental data. This results in poor fits, especially when the low-frequency range is recorded, see panel (a).
Materials 14 04352 g0a5
Figure A6. SEM images of the samples used in Figure 5. Cross-sections of the broken samples and top views of the samples are shown. The samples are HKUST-1 SURMOFs, grown on the IDE-substrates upon functionalization with MHDA (a), with MUD (b), and by UV-ozone treatment (c). The thicknesses of all 3 samples are 0.5 ± 0.1 µm, determined from the cross-section pictures.
Materials 14 04352 g0a6aMaterials 14 04352 g0a6bMaterials 14 04352 g0a6c
Figure A7. Out-of-plane XRD of HKUST-1 samples. The XRD of the MOF powder (for Figure 3b) is shown in grey. The XRDs of the SURMOFs grown on substrates with MHDA, MUD, and UV-ozone functionalization (see labels, for Figure 5) are shown in magenta, blue, and red, respectively. The black line is the calculated diffractogram with the labelled diffraction peaks. While the MOF powder shows all diffraction peaks, the SURMOF samples are grown in (111) orientation, showing only the (nnn) XRD peaks.
Materials 14 04352 g0a7

References

  1. Stamenkovic, V.R.; Strmcnik, D.; Lopes, P.P.; Markovic, N.M. Energy and fuels from electrochemical interfaces. Nat. Mater. 2017, 16, 57–69. [Google Scholar] [CrossRef] [PubMed]
  2. Wagner, F.T.; Lakshmanan, B.; Mathias, M.F. Electrochemistry and the Future of the Automobile. J. Phys. Chem. Let. 2010, 1, 2204–2219. [Google Scholar] [CrossRef]
  3. Macfarlane, D.R.; Forsyth, M.; Howlett, P.C.; Pringle, J.M.; Sun, J.; Annat, G.; Neil, W.; Izgorodina, E.I. Ionic liquids in electrochemical devices and processes: Managing interfacial Electrochemistry. Acc. Chem. Res. 2007, 40, 1165–1173. [Google Scholar] [CrossRef]
  4. Kavan, L. Electrochemistry and dye-sensitized solar cells. Curr. Opin. Electrochem. 2017, 2, 88–96. [Google Scholar] [CrossRef]
  5. Dubal, D.P.; Chodankar, N.R.; Kim, D.H.; Gomez-Romero, P. Towards flexible solid-state supercapacitors for smart and wearable electronics. Chem. Soc. Rev. 2018, 47, 2065–2129. [Google Scholar] [CrossRef]
  6. Morozan, A.; Jaouen, F. Metal organic frameworks for electrochemical applications. Energy Environ. Sci. 2012, 5, 9269–9290. [Google Scholar] [CrossRef]
  7. Ramaswamy, P.; Wong, N.E.; Shimizu, G.K.H. MOFs as proton conductors—Challenges and opportunities. Chem. Soc. Rev. 2014, 43, 5913–5932. [Google Scholar] [CrossRef] [PubMed]
  8. Stassen, I.; Burtch, N.C.; Talin, A.A.; Falcaro, P.; Allendorf, M.D.; Ameloot, R. An updated roadmap for the integration of metal-organic frameworks with electronic devices and chemical sensors. Chem. Soc. Rev. 2017, 46, 3185–3241. [Google Scholar] [CrossRef] [PubMed] [Green Version]
  9. Falcaro, P.; Ricco, R.; Doherty, C.M.; Liang, K.; Hill, A.J.; Styles, M.J. MOF positioning technology and device fabrication. Chem. Soc. Rev. 2014, 43, 5513–5560. [Google Scholar] [CrossRef] [Green Version]
  10. Salunkhe, R.R.; Kaneti, Y.V.; Yamauchi, Y. Metal-Organic Framework-Derived Nanoporous Metal Oxides toward Supercapacitor Applications: Progress and Prospects. ACS Nano 2017, 11, 5293–5308. [Google Scholar] [CrossRef]
  11. Liang, W.B.; Wied, P.; Carraro, F.; Sumby, C.J.; Nidetzky, B.; Tsung, C.K.; Falcaro, P.; Doonan, C.J. Metal-Organic Framework-Based Enzyme Biocomposites. Chem. Rev. 2021, 121, 1077–1129. [Google Scholar] [CrossRef] [PubMed]
  12. Andrés, M.A.; Vijjapu, M.T.; Surya, S.G.; Shekhah, O.; Salama, K.N.; Serre, C.; Eddaoudi, M.; Roubeau, O.; Gascón, I. Methanol and Humidity Capacitive Sensors Based on Thin Films of MOF Nanoparticles. ACS App. Mat. Int. 2020, 12, 4155–4162. [Google Scholar] [CrossRef]
  13. Aiyappa, H.B.; Masa, J.; Andronescu, C.; Muhler, M.; Fischer, R.A.; Schuhmann, W. MOFs for Electrocatalysis: From Serendipity to Design Strategies. Small Methods 2019, 3, 13. [Google Scholar] [CrossRef] [Green Version]
  14. Lasia, A. Electrochemical Impedance Spectroscopy and Its Applications; Springer: New York, NY, USA, 2014. [Google Scholar] [CrossRef]
  15. Barsoukov, E.; Macdonald, J.R. Impedance Spectroscopy: Theory, Experiment, and Applications; Wiley: Hoboken, NJ, USA, 2018. [Google Scholar]
  16. Nagarkar, S.S.; Unni, S.M.; Sharma, A.; Kurungot, S.; Ghosh, S.K. Two-in-One: Inherent Anhydrous and Water-Assisted High Proton Conduction in a 3D Metal-Organic Framework. Angew. Chem. Int. Ed. 2014, 53, 2638–2642. [Google Scholar] [CrossRef]
  17. Grancha, T.; Ferrando-Soria, J.; Cano, J.; Amoros, P.; Seoane, B.; Gascon, J.; Bazaga-Garcia, M.; Losilla, E.R.; Cabeza, A.; Armentano, D.; et al. Insights into the Dynamics of Grotthuss Mechanism in a Proton Conducting Chiral bioMOF. Chem. Mat. 2016, 28, 4608–4615. [Google Scholar] [CrossRef]
  18. Nagarkar, S.S.; Horike, S.; Itakura, T.; Le Ouay, B.; Demessence, A.; Tsujimoto, M.; Kitagawa, S. Enhanced and Optically Switchable Proton Conductivity in a Melting Coordination Polymer Crystal. Angew. Chem. Int. Ed. 2017, 56, 4976–4981. [Google Scholar] [CrossRef]
  19. Umeyama, D.; Horike, S.; Inukai, M.; Hijikata, Y.; Kitagawa, S. Confinement of Mobile Histamine in Coordination Nanochannels for Fast Proton Transfer. Angew. Chem. Int. Ed. 2011, 50, 11706–11709. [Google Scholar] [CrossRef] [PubMed]
  20. Gao, Y.; Broersen, R.; Hageman, W.; Yan, N.; Mittelmeijer-Hazeleger, M.C.; Rothenberg, G.; Tanase, S. High proton conductivity in cyanide-bridged metal-organic frameworks: Understanding the role of water. J. Mat. Chem. A 2015, 3, 22347–22352. [Google Scholar] [CrossRef] [Green Version]
  21. Xu, H.; Tao, S.S.; Jiang, D.L. Proton conduction in crystalline and porous covalent organic frameworks. Nat. Mater. 2016, 15, 722–726. [Google Scholar] [CrossRef]
  22. Angulakshmi, N.; Zhou, Y.; Suriyakumar, S.; Dhanalakshmi, R.B.; Satishrajan, M.; Alwarappan, S.; Alkordi, M.H.; Stephan, A.M. Microporous Metal-Organic Framework (MOF)-Based Composite Polymer Electrolyte (CPE) Mitigating Lithium Dendrite Formation in All-Solid-State-Lithium Batteries. ACS Omega 2020, 5, 7885–7894. [Google Scholar] [CrossRef] [Green Version]
  23. Zima, V.; Patil, D.S.; Raja, D.S.; Chang, T.-G.; Lin, C.-H.; Shimakawa, K.; Wagner, T. New MOF based on lithium tetrahydrofuran-2,3,4,5-tetracarboxylate: Its structure and conductivity behavior. J. Solid State Chem. 2014, 217, 150–158. [Google Scholar] [CrossRef]
  24. Abazari, R.; Sanati, S.; Morsali, A.; Slawin, A.M.Z.; Carpenter-Warren, C.L.; Chen, W.; Zheng, A. Ultrafast post-synthetic modification of a pillared cobalt(ii)-based metal–organic framework via sulfurization of its pores for high-performance supercapacitors. J. Mat. Chem. A 2019, 7, 11953–11966. [Google Scholar] [CrossRef]
  25. Shalini, S.; Dhavale, V.M.; Eldho, K.M.; Kurungot, S.; Ajithkumar, T.G.; Vaidhyanathan, R. 1000-fold enhancement in proton conductivity of a MOF using post-synthetically anchored proton transporters. Sci. Rep. 2016, 6, 32489. [Google Scholar] [CrossRef] [Green Version]
  26. Müller, K.; Helfferich, J.; Zhao, F.L.; Verma, R.; Kanj, A.B.; Meded, V.; Bléger, D.; Wenzel, W.; Heinke, L. Switching the Proton Conduction in Nanoporous, Crystalline Materials by Light. Adv. Mater. 2018, 30, 1706551. [Google Scholar] [CrossRef]
  27. Kanj, A.B.; Verma, R.; Liu, M.; Helfferich, J.; Wenzel, W.; Heinke, L. Bunching and Immobilization of Ionic Liquids in Nanoporous Metal–Organic Framework. Nano Lett. 2019, 19, 2114–2120. [Google Scholar] [CrossRef]
  28. Kanj, A.B.; Chandresh, A.; Gerwien, A.; Grosjean, S.; Bräse, S.; Wang, Y.; Dube, H.; Heinke, L. Proton-conduction photomodulation in spiropyran-functionalized MOFs with large on–off ratio. Chem. Sci. 2020, 11, 1404–1410. [Google Scholar] [CrossRef] [Green Version]
  29. Shalini, S.; Vaid, T.P.; Matzger, A.J. Salt nanoconfinement in zirconium-based metal-organic frameworks leads to pore-size and loading-dependent ionic conductivity enhancement. Chem. Comm. 2020, 56, 7245–7248. [Google Scholar] [CrossRef]
  30. Bazant, M.Z.; Thornton, K.; Ajdari, A. Diffuse-charge dynamics in electrochemical systems. Phys. Rev. E 2004, 70, 021506. [Google Scholar] [CrossRef] [Green Version]
  31. Bredar, A.R.C.; Chown, A.L.; Burton, A.R.; Farnum, B.H. Electrochemical Impedance Spectroscopy of Metal Oxide Electrodes for Energy Applications. ACS Appl. Energy Mater. 2020, 3, 66–98. [Google Scholar] [CrossRef] [Green Version]
  32. Lee, J.-S.; Jamnik, J.; Maier, J. Generalized equivalent circuits for mixed conductors: Silver sulfide as a model system. Mon. Fur. Chem. 2009, 140, 1113–1119. [Google Scholar] [CrossRef] [Green Version]
  33. Munoz, J.; Montes, R.; Baeza, M. Trends in electrochemical impedance spectroscopy involving nanocomposite transducers: Characterization, architecture surface and bio-sensing. Trac Trends Anal. Chem. 2017, 97, 201–215. [Google Scholar] [CrossRef]
  34. Choi, W.; Shin, H.-C.; Kim, J.M.; Choi, J.-Y.; Yoon, W.-S. Modeling and Applications of Electrochemical Impedance Spectroscopy (EIS) for Lithium-ion Batteries. J. Electrochem. Sci. Technol. 2020, 11, 1–13. [Google Scholar] [CrossRef] [Green Version]
  35. Small, L.J.; Nenoff, T.M. Direct Electrical Detection of Iodine Gas by a Novel Metal-Organic-Framework-Based Sensor. ACS App. Mat. Int. 2017, 9, 44649–44655. [Google Scholar] [CrossRef]
  36. Fischerauer, A.; Fischerauer, G.; Hagen, G.; Moos, R. Integrated impedance based hydro-carbon gas sensors with Na-zeolite/Cr2O3 thin-film interfaces: From physical modeling to devices. Phys. Status Solidi A Appl. Mater. Sci. 2011, 208, 404–415. [Google Scholar] [CrossRef]
  37. Hagen, G.; Dubbe, A.; Rettig, F.; Jerger, A.; Birkhofer, T.; Mueller, R.; Plog, C.; Moos, R. Selective impedance based gas sensors for hydrocarbons using ZSM-5 zeolite films with chromium(III)oxide interface. Sens. Actuator B-Chem. 2006, 119, 441–448. [Google Scholar] [CrossRef]
  38. Matysik, S.; Matysik, F.M.; Schulze, K.D.; Einicke, W.D. Impedance spectroscopic investigations of zeolite-polydimethylsiloxane electrodes. Electrochim. Acta 2002, 48, 297–301. [Google Scholar] [CrossRef]
  39. Banerjee, P.C.; Woo, R.P.; Grayson, S.M.; Majumder, A.; Raman, R.K.S. Influence of Zeolite Coating on the Corrosion Resistance of AZ91D Magnesium Alloy. Materials 2014, 7, 6092–6104. [Google Scholar] [CrossRef] [Green Version]
  40. Cai, X.; Zhang, Y.; Yin, L.; Ding, D.; Jing, W.; Gu, X. Electrochemical impedance spectroscopy for Analyzing microstructure evolution of NaA zeolite membrane in acid water/ethanol solution. Chem. Eng. Sci. 2016, 153, 1–9. [Google Scholar] [CrossRef]
  41. Chui, S.S.Y.; Lo, S.M.F.; Charmant, J.P.H.; Orpen, A.G.; Williams, I.D. A chemically functionalizable nanoporous material Cu-3(TMA)(2)(H2O)(3) (n). Science 1999, 283, 1148–1150. [Google Scholar] [CrossRef]
  42. Heinke, L.; Wöll, C. Surface-Mounted Metal–Organic Frameworks: Crystalline and Porous Molecular Assemblies for Fundamental Insights and Advanced Applications. Adv. Mater. 2019, 31, 1806324. [Google Scholar] [CrossRef] [PubMed]
  43. Hurrle, S.; Friebe, S.; Wohlgemuth, J.; Wöll, C.; Caro, J.; Heinke, L. Sprayable, Large-Area Metal–Organic Framework Films and Membranes of Varying Thickness. Chem. Eur. J. 2017, 23, 2294–2298. [Google Scholar] [CrossRef] [PubMed]
  44. Al-Janabi, N.; Hill, P.; Torrente-Murciano, L.; Garforth, A.; Gorgojo, P.; Siperstein, F.; Fan, X.L. Mapping the Cu-BTC metal-organic framework (HKUST-1) stability envelope in the presence of water vapour for CO2 adsorption from flue gases. Chem. Eng. J. 2015, 281, 669–677. [Google Scholar] [CrossRef] [Green Version]
  45. Tagliabue, M.; Rizzo, C.; Millini, R.; Dietzel, P.D.C.; Blom, R.; Zanardi, S. Methane storage on CPO-27-Ni pellets. J. Porous Mat. 2011, 18, 289–296. [Google Scholar] [CrossRef]
  46. MacKay, S.; Hermansen, P.; Wishart, D.; Chen, J. Simulations of Interdigitated Electrode Interactions with Gold Nanoparticles for Impedance-Based Biosensing Applications. Sensors 2015, 15, 22192–22208. [Google Scholar] [CrossRef] [Green Version]
  47. De Levie, R. The influence of surface roughness of solid electrodes on electrochemical measurements. Electrochim. Acta 1965, 10, 113–130. [Google Scholar] [CrossRef]
  48. Kerner, Z.; Pajkossy, T. On the origin of capacitance dispersion of rough electrodes. Electrochim. Acta 2000, 46, 207–211. [Google Scholar] [CrossRef]
  49. Singh, M.B.; Kant, R. Debye-Falkenhagen dynamics of electric double layer in presence of electrode heterogeneities. J. Electroanal. Chem. 2013, 704, 197–207. [Google Scholar] [CrossRef]
  50. Gu, Z.-G.; Pfriem, A.; Hamsch, S.; Breitwieser, H.; Wohlgemuth, J.; Heinke, L.; Gliemann, H.; Wöll, C. Transparent films of metal-organic frameworks for optical applications. Micropor. Mesopor. Mat. 2015, 211, 82–87. [Google Scholar] [CrossRef]
  51. Okur, S.; Zhang, Z.; Sarheed, M.; Nick, P.; Lemmer, U.; Heinke, L. Towards a MOF e-Nose: A SURMOF sensor array for detection and discrimination of plant oil scents and their mixtures. Sens. Actuators B. Chem. 2020, 306, 127502. [Google Scholar] [CrossRef]
  52. Müller, K.; Malhi, J.S.; Wohlgemuth, J.; Fischer, R.A.; Wöll, C.; Gliemann, H.; Heinke, L. Water as a modulator in the synthesis of surface-mounted metal–organic framework films of type HKUST-1. Dalt. Trans. 2018, 47, 16474–16479. [Google Scholar] [CrossRef]
  53. Wang, Z.; Knebel, A.; Grosjean, S.; Wagner, D.; Bräse, S.; Wöll, C.; Caro, J.; Heinke, L. Tunable molecular separation by nanoporous membranes. Nat. Comm. 2016, 7, 13872. [Google Scholar] [CrossRef] [Green Version]
  54. Shekhah, O. Layer-by-Layer Method for the Synthesis and Growth of Surface Mounted Metal-Organic Frameworks (SURMOFs). Materials 2010, 3, 1302–1315. [Google Scholar] [CrossRef] [Green Version]
  55. Liu, J.; Shekhah, O.; Stammer, X.; Arslan, H.K.; Liu, B.; Schüpbach, B.; Terfort, A.; Wöll, C. Deposition of Metal-Organic Frameworks by Liquid-Phase Epitaxy: The Influence of Substrate Functional Group Density on Film Orientation. Materials 2012, 5, 1581–1592. [Google Scholar] [CrossRef] [Green Version]
  56. Dragässer, A.; Shekhah, O.; Zybaylo, O.; Shen, C.; Buck, M.; Wöll, C.; Schlettwein, D. Redox mediation enabled by immobilised centres in the pores of a metal-organic framework grown by liquid phase epitaxy. Chem. Comm. 2012, 48, 663–665. [Google Scholar] [CrossRef]
  57. Kakaei, M.N.; Neshati, J.; Rezaierod, A.R. On the Extraction of the Effective Capacitance from Constant Phase Element Parameters. Prot. Met. Phys. Chem. Surf. 2018, 54, 548–556. [Google Scholar] [CrossRef]
  58. Brug, G.J.; van den Eeden, A.L.G.; Sluyters-Rehbach, M.; Sluyters, J.H. The analysis of electrode impedances complicated by the presence of a constant phase element. J. Electroanal. Chem. Interfacial Electrochem. 1984, 176, 275–295. [Google Scholar] [CrossRef]
  59. Ruzanov, A.; Lembinen, M.; Jakovits, P.; Srirama, S.N.; Voroshylova, I.V.; Cordeiro, M.N.D.S.; Pereira, C.M.; Rossmeisl, J.; Ivaništšev, V.B. On the thickness of the double layer in ionic liquids. Phys. Chem. Chem. Phys. 2018, 20, 10275–10285. [Google Scholar] [CrossRef] [Green Version]
  60. Lockett, V.; Horne, M.; Sedev, R.; Rodopoulos, T.; Ralston, J. Differential capacitance of the double layer at the electrode/ionic liquids interface. Phys. Chem. Chem. Phys. 2010, 12, 12499–12512. [Google Scholar] [CrossRef]
  61. Fedorov, M.V.; Kornyshev, A.A. Ionic Liquids at Electrified Interfaces. Chem. Rev. 2014, 114, 2978–3036. [Google Scholar] [CrossRef] [PubMed] [Green Version]
  62. Delen, G.; Ristanovic, Z.; Mandemaker, L.D.B.; Weckhuysen, B.M. Mechanistic Insights into Growth of Surface-Mounted Metal-Organic Framework Films Resolved by Infrared (Nano-) Spectroscopy. Chem. A Eur. J. 2018, 24, 187–195. [Google Scholar] [CrossRef] [Green Version]
  63. Babal, A.S.; Chaudhari, A.K.; Yeung, H.H.M.; Tan, J.-C. Guest-Tunable Dielectric Sensing Using a Single Crystal of HKUST-1. Adv. Mater. Interfaces 2020, 7, 2000408. [Google Scholar] [CrossRef]
  64. Huang, M.-M.; Jiang, Y.; Sasisanker, P.; Driver, G.W.; Weingartner, H. Static Relative Dielectric Permittivities of Ionic Liquids at 25 °C. J. Chem. Eng. Data 2011, 56, 1494–1499. [Google Scholar] [CrossRef]
  65. Pulst, M.; Balko, J.; Golitsyn, Y.; Reichert, D.; Busse, K.; Kressler, J. Proton conductivity and phase transitions in 1,2,3-triazole. Phys. Chem. Chem. Phys. 2016, 18, 6153–6163. [Google Scholar] [CrossRef] [PubMed]
  66. Liu, J.-P.; Wilding, W.V.; Giles, N.F.; Rowley, R.L. A Quantitative Structure Property Relation Correlation of the Dielectric Constant for Organic Chemicals. J. Chem. Eng. Data 2010, 55, 41–45. [Google Scholar] [CrossRef]
Figure 1. Sketch of a MOF-pellet between Au-electrodes (a), and of a MOF film on a glass substrate with deposited gold electrodes (b) with idealized equivalent circuits. The gold electrodes are sketched in yellow, the MOF (filled with electrolyte) in green, and the glass substrate in light blue. The parameters are: R1 and R2 are the charge transfer resistance between the electrodes and the electrolyte. Cdl-1 and Cdl-2 are the capacitances of the electrical double layers forming at the electrodes. Relectrolyte is the ohmic resistance of the electrolyte in the (MOF) material. R5 and R8 are the resistances of the setup, connections, and cables, potentially including some induction parts. C3 is the capacitance between the two electrodes (and also from other parts of the setup) and R3 is the resistance of potential leakage. In panel b, R6 and R7 are the charge transfer resistance from the electrode to the glass substrate, and C1 and C2 are the capacitances at these interfaces. R4 is the resistance of the glass substrate. (c) A simplified equivalent circuit for the ionic conduction in MOFs between two gold electrodes: the ohmic resistance of the electrolyte Relectrolyte in serial with a constant phase element of the double layer CPEdl in parallel combination with a constant phase element of the geometric capacitance CPEgeo. This circuit is referred to as (R-CPEdl)‖CPEgeo circuit.
Materials 14 04352 g001
Figure 2. Nyquist plots for the (R-CPEdl)‖CPEgeo -circuit with typical parameters. (a) The black spectrum is calculated for R = 10 MΩ, CPEdl = 1 × 10⁻⁷    F   s n dl 1 , ndl = 0.8, CPEgeo = 1 × 10⁻¹⁰    F   s n geo 1 , ngeo = 1. The green line is for ngeo = 0.8, orange for R = 7 MΩ, magenta for R = 13 MΩ, red for ndl = 1 and the blue lines are for ndl = 0.6, 0.5 and 0.4 (left to right). The other parameters correspond to the parameters of the black line. (b) The black spectrum is calculated for R = 10 MΩ, CPEdl = 1 × 10⁻⁷    F   s n dl 1 , ndl = 0.6, CPEgeo = 1 × 10⁻¹⁰    F   s n geo 1 , ngeo = 1. The green line is for CPEgeo = 2 × 10⁻¹¹    F   s n geo 1 , orange for CPEdl = 4 × 10⁻⁷  F   s n dl 1 , red for for CPEdl = 5 × 10⁻⁸    F   s n dl 1 , and the blue lines are for CPEgeo = 1, 4 and 10 × 10−9    F   s n geo 1 (lower, middle, and upper line). The other parameters correspond to the parameters of the black line. The frequency range is from 1 Hz to 5 MHz. The high frequency range is close to zero impedance.
Materials 14 04352 g002
Figure 3. IL@HKUST-1. (a) Structure of IL of type [BMIM][TFSI] in HKUST-1 (b) and (c) Nyquist plots for the sample in the form of a MOF-pellet sandwiched between 2 gold electrodes (b), and in the form of a thin film on a glass substrate with interdigitated gold electrodes (c). The IL pore fillings are 50%, 80%, 95%, and 100%, as indicated. The black lines are the fits with the (R-CPEdl)‖CPEgeo circuit. The frequency range is 100 Hz to 5 MHz (b), and 0.5 Hz to 5 MHz (c). Please note, for better visibility, the impedance values for 100%-loading in panel (c) are divided by 4, to allow the presentation in the same plot. The SURMOF sample was 0.25 µm thick, deposited on a substrate with IDEs of 10 µm gap distance and a total gap length of 1.69 m. The data of panel (c) are taken from [27] with copyright permission from 2019 American Chemical Society.
Materials 14 04352 g003
Figure 4. Nyquist plots of the proton-conduction of triazole (cyan) and butanediol (magenta) in a pillared-layered SURMOF on an IDE-substrate. The SURMOF structure and the molecules are sketched in the insets. The impedance values for butanediol are divided by 10, to allow the presentation in the same plot. The black lines are the fits with the (R-CPEdl)‖CPEgeo. The frequency range is 0.5 Hz to 5 MHz. The SURMOF sample was 150 nm thick, deposited on a substrate with IDEs of 10 µm gap distance, with a total gap length of 2 cm. The frequency range is 0.5 Hz to 5 MHz. The data were previously published in [26] with copyright permission from 2018 WILEY-VCH Verlag GmbH & Co. KGaA.
Materials 14 04352 g004
Figure 5. Nyquist plots of IL [BMIM][TFSI] in HKUST-1 SURMOF films. The SURMOF films are grown on the IDE substrates, whose surface has been treated in different ways before the SURMOF synthesis: One substrate has an OH-terminated MUD-SAM (green), one has a COOH-terminated MHDA-SAM (red) and one substrate was exposed to UV-ozone for 30 min before the SURMOF synthesis (blue). The black lines are the fits with the (R-CPEdl)‖CPEgeo circuit, where the parameters are shown in Table 2. The substrates are glass sheets with IDEs of 10 µm gap distance and a total gap length of 1.69 m. The area of each electrode is approximately 17 mm2. The frequency range is 3.5 Hz to 5 MHz.
Materials 14 04352 g005
Table 1. The parameters determined for the examples shown in Figure 3 and Figure 4. IL refers to [BMIM][TFSI] ionic liquid. The percentage gives the IL pore filling. pl-MOF stands for pillared-layer SURMOF; here, it is Cu2(F2AzoBDC)2(dabco).
FormElectrolyteMOF HostR/MΩ C P E dl / 10 9     F     s n dl 1 ndl C P E geo / 10 12   F     s n g e o 1 ngeoConductivity σ/µS m−1
MOF pellets between Au-electrodesIL 100%HKUST-11.2920.40.5525.10.955.8
IL 95%HKUST-10.3419.90.6412.00.9822.2
IL 80%HKUST-10.18250.7018.00.9643.1
IL 50%HKUST-10.576.360.7334.70.8413.2
MOF thin film on IDE-substrateIL 100%HKUST-12054.580.511.910.900.12
IL 95%HKUST-118.79.140.611.910.891.3
IL 80%HKUST-19.989.560.681.830.902.4
IL 50%HKUST-13.217.580.711.850.917.4
butanediolpl-MOF3936.640.528.8780.848.5
triazolepl-MOF27.3520.539.90.93122
Table 2. The parameters determined from the EIS data in Figure 5. The HKUST-1 SURMOFs are prepared on the same kind of IDE-substrates but with different substrate functionalizations. The electrolyte is [BMIM][TFSI] ionic liquid with 50% pore filling. The thickness of the double layer is assessed by λ dl = ε r ε 0 A electrode / C dl . A value of 2.8 was used for the permittivity, ε r , which is the value for the empty HKUST-1 MOF [63]. Please note, the permittivity value of the MOF is actually somewhat larger, due to the IL pore fillings, increasing the calculated thickness of the double layer.
Substrate FunctionalizationR/MΩCPEdl / 10 9     F     s n dl 1 ndlCPEgeo / 10 12   F     s n g e o 1 ngeoConductivity σ/µS m−1Double Layer Capacitance Cdl/nFEstimated Double Layer Thickness λdl/nm #
UV-ozone4.4051.90.8599.20.942.740.210.4
MUD SAM4.878.20.7153.00.992.42.3179.9
MHDA SAM4.5751.00.461540.892.69.643.5
# The estimation of the double layer thickness requires a homogenous double-layer, which is not given in the present case. Since all 3 samples are prepared on the same kind of substrates, the calculated numbers can be compared but their absolute values are debatable.
Publisher’s Note: MDPI stays neutral with regard to jurisdictional claims in published maps and institutional affiliations.

