Article

Growth Kinetics and Some Mechanical Properties of Plasma Paste Borided Layers Produced on Nimonic 80A-Alloy

1
Institute of Materials Science and Engineering, Poznan University of Technology, Pl. M.Sklodowskiej-Curie 5, 60-965 Poznan, Poland
2
Laboratoire de Technologie des Matériaux, Faculté de Génie Mécanique et Génie des Procédés, Université des Sciences et de la Technologie Houari Boumediene, BP 32 Bab Ezzouar, Algiers 16111, Algeria
*
Author to whom correspondence should be addressed.
Materials 2021, 14(18), 5146; https://doi.org/10.3390/ma14185146
Submission received: 17 August 2021 / Revised: 4 September 2021 / Accepted: 6 September 2021 / Published: 8 September 2021
(This article belongs to the Section Metals and Alloys)

Abstract

:
Plasma paste boriding was employed in order to produce the boride layers on Nimonic 80A-alloy. The process was carried out at temperatures of 1023 K, 1073 K and 1123 K for 3, 4 and 6 h in a gas mixture of 50% H2-50% Ar. Borax paste was used as a boron source. The microstructure of the produced surface layers consisted of the mixture of nickel borides and chromium borides. The effect of processing temperature and duration on the thickness of the borided layers was observed. The theoretical thicknesses of the borided layers were estimated using an integral diffusion model. A good correlation was obtained between the theoretical (modeled) and experimental depths of the plasma paste borided layers. The boride layers were characterized by a high hardness ranging from 1160 HV to 2132 HV. The multiphase character of the produced layers resulted in differences in hardness. A significant improvement of the wear resistance of the plasma paste borided Nimonic 80A-alloy was observed in comparison with the non-borided alloy.

1. Introduction

Nickel alloys, including Nimonic 80A, are commonly known for their excellent resistance to oxidation and corrosion. However, the poor wear resistance, as an important disadvantage, causes the limited use of these alloys. Under conditions of appreciable mechanical wear (abrasive or adhesive), such materials have to be characterized by suitable wear protection. One of the techniques, which can be used in order to obtain their improved wear resistance, is the surface treatment.
Plasma-assisted surface treatment is a thermo-chemical treatment technique with great potential for industrial application. Due to the high energy of the plasma source, a relatively high efficiency of plasma-assisted processes is ensured. When compared to the conventional thermo-chemical boriding processes, plasma-assisted boriding has many advantages: shorter duration of process, lower temperature of process, relatively low gas consumption, lower activation energy for the formation of the boride layers, and reduction in emission of pollutants and toxic wastes [1,2]. Plasma-assisted boriding has become an interesting technique for producing the borided layers on various materials such as: steels [1,2,3,4,5,6,7], titanium alloys [8,9,10,11,12,13], nickel alloys [14,15], molybdenum alloys [16] and cobalt alloys [17].
An interesting variant of plasma-assisted boriding was the plasma paste boriding process, in which the boron source was a component of paste, and the gases, used in process (e.g., argon, nitrogen), have an inert characteristic [1,9,12,13,14,15]. Titanium and its alloys could be successfully borided using the plasma paste boriding technique [9,12,13]. It was found that the plasma paste boriding processes required a lower activation energy for the formation of the boride layer on the pure titanium or titanium alloys in comparison to the conventional diffusion boriding processes [9]. The gas mixture consisted of 70% hydrogen and 30% argon, and the process was carried out in the temperature range of 973–1073 K for 3, 5 and 7 h [9]. The use of borax paste as a boron source resulted in the formation of dual-phase boride layer (TiB2 + TiB) of a high hardness of 2077–2373 HK. The paste used for plasma paste boriding could also contain amorphous boron, as was reported in the case of boriding of AISI 304 stainless steel [1]. It was proved that the activation energy for the formation of boride layer on this steel was 123 kJ·mol−1, and was lower in comparison with the conventional diffusion boriding. Multiphase layers contained iron borides, nickel borides and chromium borides and were characterized by a high hardness ranging from 1800 HV to 2000 HV [1]. The activation energy, calculated for the plasma paste boriding of steel and titanium, indicated that this treatment technique ensured the possibility of thick boride layers forming at lower temperatures and shorter duration. Nickel and its alloys are materials which could be also easily subjected to diffusion boriding using different methods. Therefore, in previous works [14,15] the plasma paste boriding was also applied to produce the boride layers on such materials. The substrate materials were as follows: Nickel 201, Inconel 600-alloy and Nimonic 80A-alloy. The chemical composition of Ni-based alloy influenced the phase composition and properties of the produced layers. The increase in Cr content in substrate material diminished the average thickness of the boride layers. Simultaneously, the high chromium concentration in Ni-based alloy was the reason for increasing the hardness and Young’s modulus as well as diminishing the fracture toughness [14]. The phase composition of nickel alloy also influenced the corrosion resistance of borided samples, due to the formation of multiphase layers [15].
The effects of the chemical composition of nickel-based alloys on the microstructure and some mechanical properties of boride layers, produced using the plasma paste boriding, have been described in detail [14,15]. However, there is no information in the literature data reported about the wear resistance or the growth kinetics of boride layers and activation energy required for their formation on Ni-based alloys which were subjected to plasma paste boriding. Therefore, in the present study, the growth kinetics of the boride layers, produced on Nimonic 80A-alloy using this boriding technique with various processing parameters, was studied. The temperature ranged from 1023 K to 1123 K, and process duration from 3 to 6 h. The microstructure, phase composition, microhardness, wear resistance and cohesion of the produced layers were also investigated.

2. Materials and Methods

2.1. Material and Specimens’ Preparation

The selected experimental substrate material was Nimonic 80A alloy with the following chemical composition: 19.52% Cr, 0.01% Mn, 0.01% Cu, 0.25% Fe, 2.55% Ti, 0.09% Si, 0.085% C, 1.44% Al, 76.045% Ni. The flat slice-shape samples with a diameter of 25 mm and height of 7 mm were used. Before thermo-chemical treatment, the flat surfaces of the samples were ground using SiC abrasive paper (600-grit), and then cleaned with acetone and alcohol.

2.2. Plasma Paste Boriding

The first preparatory step for thermo-chemical treatment was coating the flat surface of the samples with boriding paste. The boron source, used for paste preparation, was borax (Na2B4O7). The samples coated with the paste of a thickness of 1–1.5 mm required drying at room temperature for 24 h. The devices used for plasma paste boriding were described in previous works in details [13,14,15]. The gaseous mixture used during the processes was composed of argon and hydrogen in a ratio of 1:1. Plasma paste boriding was carried out at temperature of 1023 K, 1073 K and 1123 K for 3 h, 4 h and 6 h. The process was carried out under glow discharge conditions with a potential difference of 300–350 V using a DC (direct current) power supply and under a constant pressure of 5 mbar (500 Pa). After boriding, the samples were cooled in the vacuum chamber under a protective argon atmosphere.

2.3. Microstructure and Properties Characterization

Directly after plasma paste boriding, the phase analysis was carried out using X-ray diffraction (XRD). For this study, the PANalytical EMPYREAN X-ray diffractometer (Malvern Panalytical Ltd., Poznan, Poland) was used. XRD patterns were obtained using a Cu Kα radiation.
In order to prepare samples for cross-sectional analysis, plasma paste borided samples were first cut out and then mounted in a conductive resin. The metallographic samples were ground using abrasive papers, polished using aluminum oxide paste and, finally, etched with Marble’s reagent. The boride layer microstructure and thickness were investigated using a scanning electron microscope (SEM) Vega 5135 (TESCAN, Poznan, Poland). The thicknesses of plasma paste borided layers were calculated as an average value from 50 measurements carried out in different areas in the cross-section of metallographic samples.
Microhardness profiles were investigated using a Micromet II hardness tester (Buehler, Poznan, Poland) under a load of 10 gf (0.098 N) and a peak-load contact of 15 s. The Vickers diamond indenter was used for this study.
Wear resistance tests were performed under conditions of dry friction using the following parameters: load of 5 kgf (49 N), counter-specimen speed of 0.26 m/s, duration of 4 h. Two specimens were investigated: non-borided Nimonic 80A-alloy and Nimonic 80A-alloy that was plasma paste borided at 1123 K for 6 h. The frictional pair consisted of a tested specimen in the shape of a plate with dimensions 12 mm × 12 mm × 4 mm, and a ring-shaped counter-specimen with the external diameter of 20 mm. The counter-specimen was made of quenched and low-temperature tempered 100CrMnSi6-4 bearing steel of a hardness of 64 HRC. During the tests, the tested specimen was immobile, whereas the counter-specimen was rotated with a speed of 250 min−1. Specimen and counter-specimen weights were measured every half hour during the 4 h test. Wear resistance was calculated as a mass wear intensity factor Imw according to the following equation:
I m w = m S · t
where Δm is mass loss (mg), S is friction surface (cm2), and t is friction time (h).
Wear behavior of specimens and counter-specimens was also evaluated using a relative mass loss Δm/mi according to the equation:
m m i = m i m f m i
where Δm is mass loss (mg), mi is initial mass of specimen or counter-specimen (mg), and mf is final mass of specimen or counter-specimen (mg).
After the wear tests were finished, the worn surfaces of a specimens were observed with an optical microscope (OM) LAB-40 (OPTA-TECH, Poznan, Poland).
The cohesion of the plasma paste borided layer, produced at a temperature of 1123 K for 6 h, with the substrate material was evaluated according to the VDI 3198 standard [18]. This destructive method uses the standard Rockwell C method to induce massive plastic deformation of the borided layer. The generated failures show the cohesion level of the layer. Generally, according to the VDI 3198 standard, cohesion could be classified as sufficient (quality maps HF1–HF4) or insufficient (quality maps HF5–HF6). After the cohesion tests, the indentation craters with the generated damage were observed using an optical microscope.

3. Results and Discussion

3.1. Microstructure of Boride Layers

Boride layers were successfully formed on the Nimonic 80A-alloy using the plasma paste boriding. SEM micrographs of the cross-sections of the borided samples using various processing parameters are presented in Figure 1, whereas the XRD patterns of borided samples were shown in Figure 2. The morphology of the borided layers resulted from the presence of alloying elements in the substrate material. Nimonic 80A-alloy is a chromium-rich alloy. Therefore, during boriding the atoms of chromium could be a diffusion barrier hindering the diffusion of boron atoms into the substrate material during the plasma paste boriding process [19,20,21,22]. The visible effect of the hindered diffusion of boron atoms was the characteristic smooth interface between the borided layers and the substrate material. Such a situation was independent of the processing parameters (Figure 1). Simultaneously, the significant effect of processing temperature and duration on the thickness of the borided layers was observed.
The average thickness of plasma paste borided layer increased with increasing processing temperature and duration. The layers, produced at the temperature of 1023 K, were characterized by average thickness from 19.06 μm to 29.34 µm with increasing processing time. The increase in the boriding temperature to 1073 K resulted in obtaining higher layer depths, from 40.23 µm to 56.97 µm. The use of an even higher temperature of 1123 K caused a further increase in the thickness of the borided layers. Hence, the average layer depths were 55.81 µm, 66.04 µm and 77.81 µm, for the processing time of 3 h, 4 h, and 6 h, respectively.
All the produced layers consisted of various types of nickel borides and chromium borides. The XRD patterns obtained for the plasma paste borided Nimonic 80A-alloy at different processing parameters are presented in Figure 2. The results of phase analysis are provided only for extreme values of treatment time, i.e., 3 and 6 h. In the case of the processing temperature of 1023 K, the produced layers contained chromium borides (Figure 2a,b). However, the quantity and intensity of the peaks corresponding to chromium borides (CrB or Cr2B) were lower compared to those visible in the diffraction patterns of the samples that were borided at higher temperatures (Figure 2c–f). Both samples borided at 1023 K contained nickel borides Ni2B, Ni3B and Ni4B3. However, in the case of the process, carried out for 6 h, the boron-rich nickel boride NiB was also produced. The increase in processing temperature still resulted in the formation of both types of chromium borides (CrB and Cr2B) with the increased quantity and intensity of peaks corresponding to these phases. Simultaneously, in the case of the highest boriding temperature of 1123 K, all the types of nickel borides (NiB, Ni2B, Ni3B, Ni4B3) were produced (Figure 2e,f).

3.2. Diffusion Model

3.2.1. The Integral Diffusion Model

The integral diffusion model [23] has been used to investigate the growth kinetics of the entire boride layer thickness. It was assumed that the boride layers were composed of a mixture of nickel borides (Ni4B3, NiB, Ni2B and Ni3B) with some percentage of chromium borides (CrB and Cr2B). The temperature range of the diffusion process is far below from the melting point of the Nimonic 80A-alloy. So, this alloy does not undergo any phase transformation during the boriding treatment. The choice of the three temperatures (1023 K, 1073 K and 1123 K) is related to the nature of the boriding process, called the plasma paste boriding process. This process has the advantage of using lower temperatures compared to the conventional boriding processes (e.g., powder-pack boriding or gas boriding) to generate the boride layers due to activation of plasma.
In this kinetic approach, the boride incubation periods were neglected. A schematic representation of the boron concentration–depth profile inside the entire boride layer is shown in Figure 3. The term Cads represent the adsorbed quantity of boron atoms at the material surface [24]. Cup denotes the maximum boron content in the entire boride layer (=11.615 wt.%) and Clow is the minimum boron content in the same layer (=6.00 wt.%) according to the Boron–Nickel binary phase diagram [25]. The variable x(t) = u is relative to the entire boride layer thickness. C0 is the boron solubility in the matrix which is extremely low.
The initial and boundary conditions for the diffusion problem are given by:
t = 0 ,   x > 0 ,   with   C ( x , t = 0 ) = C 0 0   wt . %
Boundary conditions:
C ( x = 0 ,   t = 0 ) = C u p   for   C a d s > 6.00   wt . %
C ( x = u ( t ) ,   t = t ) = C l o w   for   C a d s < 6.00   wt . %
The boron concentration-depth profile inside the entire boride layer is parabolic following the Goodman’s method [26]:
C ( x , t ) = C l o w + a ( t ) ( u ( t ) x ) + b ( t ) ( u ( t ) x ) 2   for   0 x u
The three time-dependent unknowns a(t), b(t) and u(t) must fulfil the boundary conditions provided by Equations (4) and (5). The two parameters a(t) and b(t) should be positive for the applicability of the integral diffusion model.
This diffusion problem is based on the differential algebraic system given by Equations (7)–(9):
a ( t ) u ( t ) + b ( t ) u ( t ) 2 = ( C u p C l o w )
u ( t ) 2 2 d a ( t ) d t + a ( t ) u ( t ) d u ( t ) d t + u ( t ) 3 3 d b ( t ) d t + b ( t ) u ( t ) 2 d u ( t ) d t = 2 D b ( t ) u ( t )
( C u p + C l o w ) b ( t ) = a ( t ) 2
In order to obtain the numerical solution of DAE (differential algebraic equations) systems defined by the Equations (7)–(9), there was a need to establish the initial conditions which should be consistent. So, the initial conditions were given above. For the numerical resolution of the obtained DAE system, the freely available software called the Interactive Thermodynamics software (version 3.2) was used.
To obtain the expression of boron diffusion coefficient through the entire boride layer, the following change of variables was considered:
u ( t ) = 2 ε D t
a ( t ) = a u ( t )
and
b ( t ) = β u ( t ) 2
where u(t) is the entire boride layer thickness, and ε is non-dimensional parameter to be determined.
After some mathematical manipulations (substitution and derivation) in the obtained DAE system [27], it is possible to estimate the three unknowns α, β and ε.
α = ( C u p + C l o w ) 2 [ 1 + 1 + 4 ( C u p C l o w C u p + C l o w ) ]
β = α 2 ( C u p + C l o w )
and
ε = 6 β 3 α + 2 β = 3 [ 1 + 1 + 4 ( C u p C l o w ) ( C u p + C l o w ) ] 2 + 1 + 4 ( C u p C l o w ) ( C u p + C l o w )
The term k = 2 ε D represents the slope of the experimental curve giving the variation of entire boride layer thickness as a function of square root of time. So, it is easy to deduce the value of boron diffusion coefficient D through the entire boride layer as follows:
D = ( k 2 ε ) 2
with ε = 0.6593.

3.2.2. Calculation of Boron Diffusion Coefficients through the Entire Boride Layer

The experimental data in terms of kinetics were analyzed by plotting the evolution of entire boride layer thickness versus the square root of treatment time at 1023, 1073 and 1123 K as shown in Figure 4. Table 1 lists the experimental values of parabolic growth constants in the temperature range of 1023–1123 K.
The boron diffusion coefficient D inside the entire boride layer can be obtained from Equation (16) by using the data given in Table 1. Table 2 gives the calculated values of boron diffusion coefficients by the integral diffusion model with a maximum boron concentration of 11.615 wt.%.
The value of boron activation energy can be readily obtained from the slope of the curve relating the natural logarithm of boron diffusivity versus the reciprocal temperature (Figure 5). As a result, the expression of boron diffusion coefficient D is given by Equation (17) with a coefficient of determination of 0.976:
D = 1.392 · 10 4 e x p ( 190.93 kJ mol R T ) m 2 / s
when R2 = 0.976, T is the absolute temperature (K), and R is the ideal gas constant (R = 8.314 J·mol−1·K−1).

3.2.3. Comparison of Boron Activation Energy with the Literature Results

The values of boron activation energies in nickel 201 alloy and Ni3Al substrates [28,29,30,31] are listed in Table 3, together with the values obtained on Nimonic 80 A alloy. It can be observed that the reported values of boron activation energies are affected by the following factors: the boriding technique, the chemical composition of material substrate, the method of computation.
For instance, Calik et al. [28] studied the powder-pack boriding of the pure nickel in the temperature range 1123–1273 K. They obtained a value of 47.3 kJ·mol−1, which is very low compared with the data given in Table 3. This result is incompatible with other literature data [29,30,31]. Furthermore, Kahvecioglu et al. [30] used an ultra-fast electrochemical boriding for nickel aluminide between 1073 and 1223 K by changing the value of current density from 0.1 to 0.5 A·cm−2. They obtained a value of boron activation energy in Ni3Al equal to 185.96 kJ·mol−1. Torun [31] investigated the powder-pack boriding of the Ni3Al substrate between 1073 and 1223 K. The estimated value of boron activation energy in this substrate was found to be equal to 188 ± 14.4 kJ·mol−1. The obtained value of boron activation energy in Nimonic 80A-alloy in the present study was in line with the data [28,29,30,31,32] listed in Table 3.
In all the above-mentioned papers [28,29,30,31], including the present work, the activation energy was calculated taking into consideration the growth kinetics of the total boride layers, containing the mixture of borides. In one paper [32], the zonation of the boride layers, produced on Inconel 718-alloy by powder-pack boriding, was assumed. The presence of the three successive boride zones (Ni4B3, Ni2B and Ni3B) with the increase in distance from the surface was considered in the cross-section of borided layers. The heat balance integral model was proposed to describe the growth kinetics of such layers. As a consequence, the boron activation energy depended on the zone considered, obtaining the slightly higher values when compared to the papers [29,30,31] or the present study (see Table 3).

3.2.4. Prediction of Entire Boride Layer Thickness Using the Numerical Solution of DAE System

The experimental and predicted values of entire boride layer thickness for a maximum boron concentration equal to 11.615 wt.% are gathered in Table 4.
The estimation of layers’ thicknesses by the integral diffusion model was carried out via a numerical solution of DAE system [27] by taking as initial conditions a0 = 44.77, b0 = 113.791 and u0 = 0.10 µm with the help of a computer simulation program (using the Interactive Thermodynamics software version 3.2) It is seen that the predicted values of layers’ thicknesses are in line with the predicted results (see Table 4).

3.3. Microhardness Profiles

The microhardness measurements were carried out in the cross-section of the plasma paste borided layers up to the substrate material. The microhardness profiles presented the Vickers microhardness values as a function of the distance from the surface for the Nimonic 80A-alloy which was plasma paste borided with different processing parameters. The results are shown only for extreme values of treatment duration, i.e., 3 and 6 h (Figure 6).
Due to the multiphase character of the produced layers, which contained a mixture of various nickel and chromium borides, the microhardness measured in the borided layers ranged from 1160 HV to 2132 HV. Such a situation was expected, because it was a characteristic dependence of hardness on the phase composition of the tested area, often occurring in the case of a multiphase structure. In general, the presence of chromium borides in the microstructure of borided layers, produced on nickel alloys, caused an increase in hardness. Such a behavior was observed in the case of nickel alloys borided using gaseous technique [33,34] and laser alloying with boron [35,36]. In the case of plasma paste boriding, the applied processing parameters slightly influenced the phase composition of the surface layers formed on Nimonic 80A-alloy. All the produced layers were composed of a mixture of nickel and chromium borides. However, some differences were visible in the intensity of the peaks corresponding to the chromium borides (CrB and Cr2B). In the case of the lowest boriding temperature (1023 K), the quantity and intensity of these peaks were lower (Figure 2a,b) compared to those presented in the diffraction patterns obtained for higher boriding temperatures (Figure 2c–f). Probably, these differences caused a slight decrease in the maximum hardness of the boride layers produced at 1023 K for 3 and 6 h. It is clearly visible in Figure 6a,b, respectively.

3.4. Cohesion

The standard Rockwell C hardness test was applied for cohesion evaluation. The Rockwell C indentation craters with failures produced on the surface of Nimonic 80A-alloy, plasma paste borided at 1123 K for 6 h, are shown in Figure 7. In general, the cohesion of the produced boride layer into the substrate material can be classified as a sufficient. Based on the cohesion quality maps in the VDI 3198 standard [18], the more detailed classification of the cohesion level can be determined. The Rockwell indentation under a load of 150 kgf (1471 N) caused the production of a multiple cracking system in a form of radial cracks (Figure 7a,b). Simultaneously, the presence of areas with flaking and delamination was also detected using higher magnifications of the optical microscope (Figure 7c,d). The type and quantity of the identified failures indicated the cohesion corresponding to the HF3 standard.

3.5. Wear Resistance

The tribological properties of the plasma paste borided Nimonic 80A-alloy were compared to those of the non-borided Nimonic 80A-alloy. The plasma paste borided layer, produced on Nimonic 80A-alloy at 1123 K for 6 h, was investigated. The wear resistance was determined in two ways: by calculating the mass wear intensity factor Imw (Figure 8a) and by calculating the relative mass loss (Figure 8b). The lower value of Imw, the better wear resistance of the studied material.
The analysis of mass wear intensity factors indicated the improved wear resistance of the plasma paste borided sample (Imw = 1.47 mg/cm2) in comparison to the non-borided sample (Imw = 9.06 mg/cm2). A significant reduction in the relative mass loss Δm/mi of the plasma paste borided Nimonic 80A-alloy was demonstrated (Figure 8b). The calculated Δm/mi ratio for the non-borided Nimonic 80A-alloy was 2.5-times higher compared to the plasma paste borided Nimonic 80A-alloy. The produced borided layer contained a mixture of nickel and chromium borides of high hardness. Therefore, an intense mass loss of the counter-specimen (quenched and low-temperature tempered 100CrMnSi6-4 bearing steel) was visible for the friction pair consisting of the borided Nimonic 80A-alloy and counter-specimen. The worn surfaces of borided and non-borided samples after the wear tests were observed using an optical microscope and shown in Figure 8c,d, respectively. The worn surface of the plasma paste borided Nimonic 80A-alloy was characterized by the presence of numerous shallow grooves. Simultaneously, no signs of plastic deformation and adhesion were visible (Figure 8c). On the contrary, the surface of the non-borided Nimonic 80A-alloy was characterized by obvious signs of severe plastic deformation after the wear resistance test (Figure 8d).

4. Summary and Conclusions

The plasma paste boriding process was used in order to produce the multi-phase boride layers on Nimonic 80A-alloy. The process was carried out in a H2-Ar gas mixture using borax paste as a boron source. The treatment temperature range of 1023–1123 K and treatment time of 3 h, 4 h and 6 h were applied during plasma paste boriding processes. Growth kinetics and some mechanical properties of plasma paste borided Nimonic 80A-alloy were studied using the integral diffusion model. Based on the detailed analysis of the results, the following conclusions could be formulated:
  • The increased processing temperature and longer processing duration ensured the production of thicker borided layers;
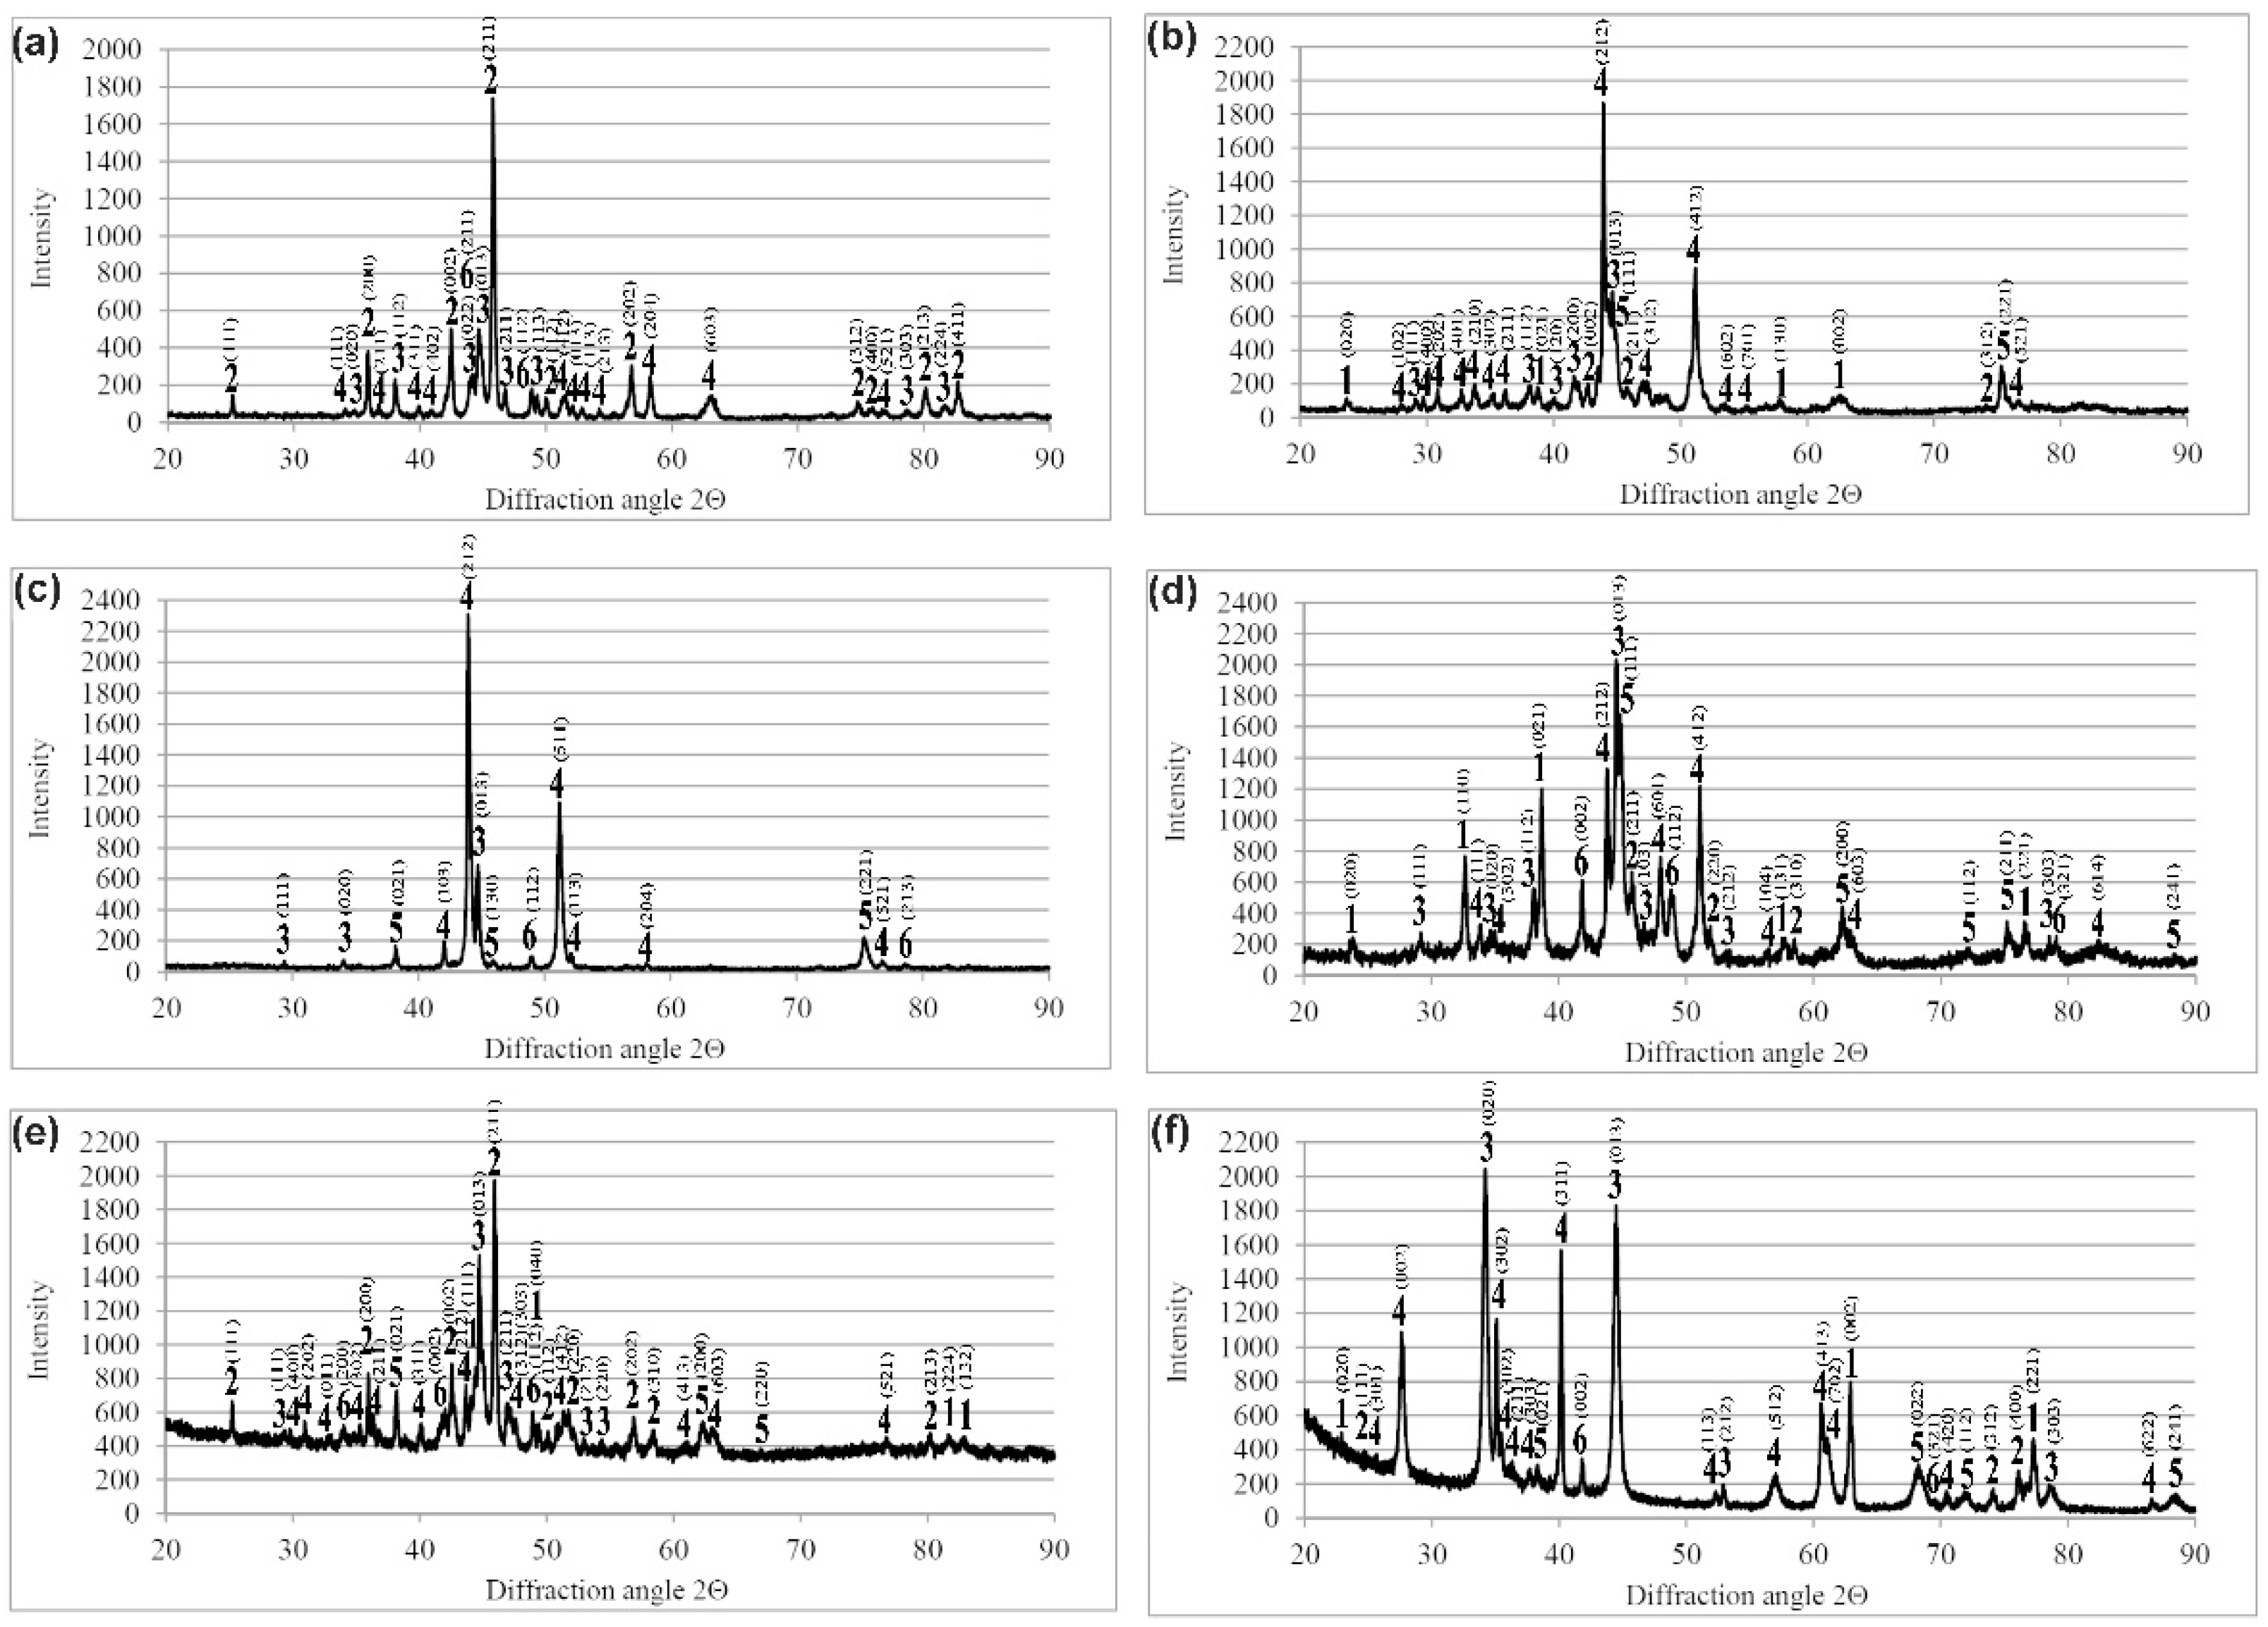
  • All the produced layers consisted of a mixture of nickel borides and chromium borides;
  • The quantity and intensity of the peaks corresponding to chromium borides (CrB or Cr2B) increased at elevated boriding temperature;
  • The theoretical thicknesses of the borided layers were estimated using an integral diffusion model. A good correlation was obtained between the theoretical (modeled) and experimental depths of the plasma paste borided layers;
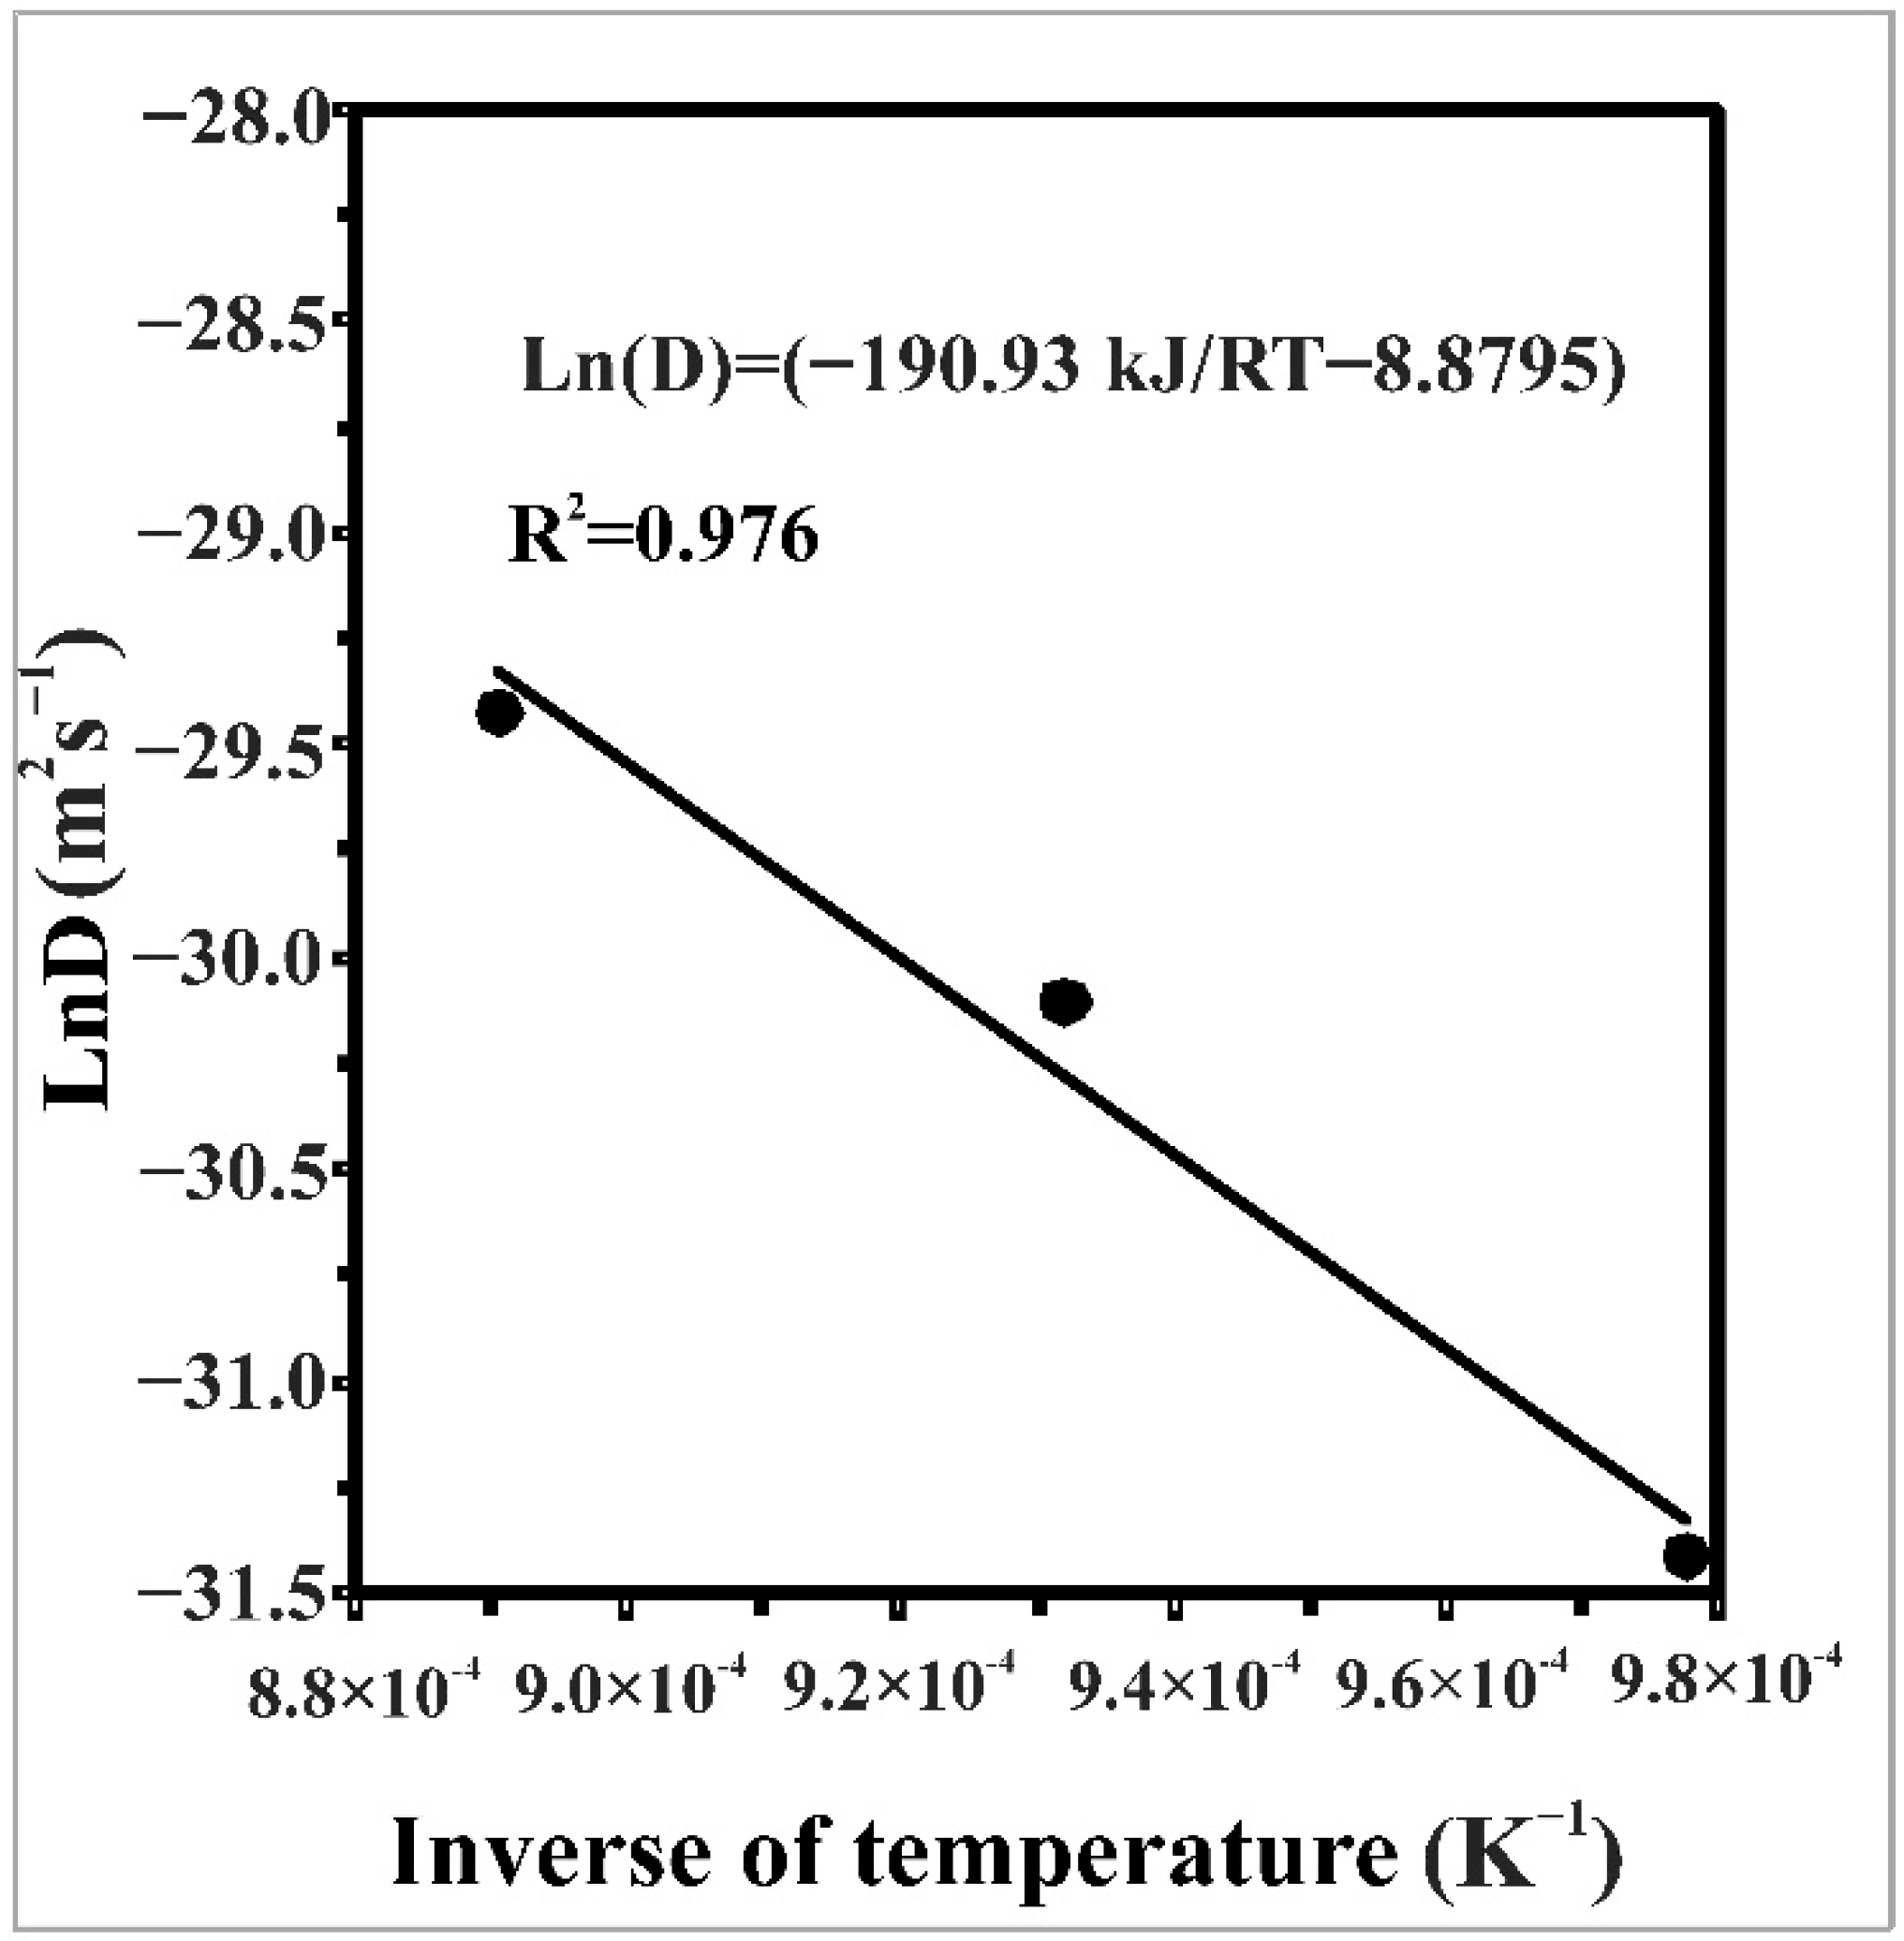
  • The estimated value of boron activation energy was found to be equal to 188 ± 14.4 kJ·mol−1. This value was in line with the data of other papers which considered the growth kinetics of the total boride layers, containing the mixture of borides;
  • The produced layers were characterized by high hardness ranging from 1160 HV to 2132 HV. It resulted from the multiphase character of the produced layers, which contained a mixture of various nickel borides and chromium borides of different hardness;
  • The cohesion of produced boride layers into the substrate material can be classified as a sufficient, corresponding to the HF3 quality map;
  • The analysis of mass wear intensity factors indicated the improved wear resistance of the plasma paste borided sample (Imw = 1.47 mg/cm2) in comparison to the non-borided sample (Imw = 9.06 mg/cm2). A significant reduction in the relative mass loss Δm/mi of the plasma paste borided Nimonic 80A-alloy was also demonstrated.

Author Contributions

Conceptualization, N.M., P.D. and M.K. (Michał Kulka); Data Curation, N.M., P.D., M.K. (Michał Kulka) and M.K. (Mourad Keddam); Formal Analysis, N.M. and M.K. (Michał Kulka); Funding Acquisition, M.K. (Michał Kulka); Investigation, N.M., P.D., M.K. (Michał Kulka) and M.K. (Mourad Keddam); Methodology, N.M., P.D., M.K. (Michał Kulka) and M.K. (Mourad Keddam); Project Administration, M.K. (Michał Kulka); Resources, N.M. and M.K. (Michał Kulka); Supervision, N.M. and M.K. (Michał Kulka); Validation, N.M., P.D., M.K. (Michał Kulka) and M.K. (Mourad Keddam); Visualization, N.M. and M.K. (Michał Kulka); Writing—Original Draft, N.M. and M.K. (Michał Kulka); Writing—Review and Editing, N.M., M.K. (Michał Kulka) and M.K. (Mourad Keddam); All authors have read and agreed to the published version of the manuscript.

Funding

This research was funded by Ministry of Science and Higher Education in Poland, grant number 0513/SBAD/4739.

Institutional Review Board Statement

Not applicable.

Informed Consent Statement

Not applicable.

Data Availability Statement

The authors confirm that the data supporting the findings of this study is available within the article.

Acknowledgments

The authors wish to thank S. Taktak from Department of Metallurgical and Materials Engineering, Faculty of Technology, Afyon Kocatepe University, for his help and cooperation during the plasma paste boriding treatment.

Conflicts of Interest

The authors declare no conflict of interest. The funders had no role in the design of the study; in the collection, analyses, or interpretation of data; in the writing of the manuscript, or in the decision to publish the results.

References

  1. Yoon, J.H.; Jee, Y.K.; Lee, S.Y. Plasma paste boronizing treatment of the stainless steel AISI 304. Surf. Coat. Technol. 1999, 112, 71–75. [Google Scholar] [CrossRef]
  2. Gunes, I.; Ulker, S.; Taktak, S. Plasma paste boronizing of AISI 8620, 52100 and 440C steels. Mater. Des. 2011, 32, 2380–2386. [Google Scholar] [CrossRef]
  3. Nam, K.-S.; Lee, K.-H.; Lee, D.Y.; Song, Y.-S. Metal surface modification by plasma boronizing in a two-temperature-stage process. Surf. Coat. Technol. 2005, 197, 51–55. [Google Scholar] [CrossRef]
  4. Filep, E.; Farkas, S. Kinetics of plasma-assisted boriding. Surf. Coat. Technol. 2005, 199, 1–6. [Google Scholar] [CrossRef]
  5. Rie, K.-T. Recent advances in plasma diffusion processes. Surf. Coat. Technol. 1999, 112, 56–62. [Google Scholar] [CrossRef]
  6. Rodriguez Cabeo, E.; Laudien, G.; Biemer, S.; Rie, K.-T.; Hoppe, S. Plasma-assisted boriding of industrial components in a pulsed d.c. glow discharge. Surf. Coat. Technol. 1999, 116, 229–233. [Google Scholar] [CrossRef]
  7. Scheuer, C.J.; Cardoso, R.P.; Brunatto, S.F. Low-temperature plasma assisted thermochemical treatments of AISI 420 steel: Comparative study of obtained layers. Mater. Res. 2015, 18, 1392–1399. [Google Scholar] [CrossRef] [Green Version]
  8. Kaestner, P.; Olfe, J.; Rie, K.-T. Plasma-assisted boriding of pure titanium and TiAl6V4. Surf. Coat. Technol. 2001, 142, 248–252. [Google Scholar] [CrossRef]
  9. Ataibis, V.; Taktak, S. Characteristics and growth kinetics of plasma paste borided Cp–Ti and Ti6Al4V alloy. Surf. Coat. Technol. 2015, 279, 65–71. [Google Scholar] [CrossRef]
  10. Belkin, P.N.; Kusmanov, S.A. Plasma electrolytic boriding of steels and titanium alloys. Surf. Eng. Appl. Electrochem. 2019, 55, 1–30. [Google Scholar] [CrossRef]
  11. Qin, L.; Liu, C.; Yang, K.; Tang, B. Characteristics and wear performance of borided Ti6Al4V alloy prepared by double glow plasma surface alloying. Surf. Coat. Technol. 2013, 225, 92–96. [Google Scholar] [CrossRef]
  12. Keddam, M.; Taktak, S. Characterization and diffusion model for the titanium boride layers formed on the Ti6Al4V alloy by plasma paste boriding. Appl. Surf. Sci. 2017, 399, 229–236. [Google Scholar] [CrossRef]
  13. Makuch, N.; Kulka, M.; Keddam, M.; Taktak, S.; Ataibis, V.; Dziarski, P. Growth kinetics and some mechanical properties of two-phase boride layers produced on commercially pure titanium during plasma paste boriding. Thin Solid Films 2017, 626, 25–37. [Google Scholar] [CrossRef]
  14. Makuch, N.; Kulka, M.; Dziarski, P.; Taktak, S. The influence of chemical composition of Ni-based alloys on microstructure and mechanical properties of plasma paste borided layers. Surf. Coat. Technol. 2019, 367, 187–202. [Google Scholar] [CrossRef]
  15. Makuch, N. The importance of phase composition for corrosion resistance of borided layers produced on nickel alloys. Materials 2020, 13, 5131. [Google Scholar] [CrossRef]
  16. Qin, L.; Yang, K.; Liu, C.; Tang, B. Enhanced plasma boriding with molybdenum using double glow plasma surface alloying technique. Mater. Lett. 2012, 82, 127–129. [Google Scholar] [CrossRef]
  17. Johnston, J.M.; Jubinsky, M.; Catledge, S.A. Plasma boriding of a cobalt–chromium alloy as an interlayer for nanostructured diamond growth. Appl. Surf. Sci. 2015, 328, 133–139. [Google Scholar] [CrossRef]
  18. Verein Deutscher Ingenieure Normen; VDI 3198 VDI Verlag: Berlin, Germany, 1991.
  19. Taktak, S. Some mechanical properties of borided AISI H13 and 304 steels. Mater. Des. 2007, 28, 1836–1843. [Google Scholar] [CrossRef]
  20. Kayali, Y.; Günes, I.; Ulu, S. Diffusion kinetics of borided AISI 52100 and AISI 440C steels. Vacuum 2012, 86, 1428–1434. [Google Scholar] [CrossRef]
  21. Kayali, Y.; Taktak, S. Characterization and Rockwell-C adhesion properties of chromium-based borided steels. J. Adhes. Sci. Technol. 2015, 29, 2065–2075. [Google Scholar] [CrossRef]
  22. Taktak, S. A study on the diffusion kinetics of borides on boronizedCr-based steel. J. Mater. Sci. 2006, 41, 7590–7596. [Google Scholar] [CrossRef]
  23. Keddam, M.; Ortiz-Dominguez, M.; Elias-Espinosa, M.; Arenas-flores, A.; Zuno-Silva, J.; Zamarripa–Zepeda, D.; Gomez-Vargas, O.A. Kinetic investigation and wear properties of Fe2B layers on AISI 12L14 steel. Metall. Mater. Trans. A 2018, 49, 1895–1907. [Google Scholar] [CrossRef]
  24. Yu, L.G.; Chen, X.J.; Khor, K.A.; Sundararajan, G. FeB/Fe2B phase transformation during SPS pack-boriding: Boride layer growth kinetics. Acta Mater. 2005, 53, 2361–2368. [Google Scholar] [CrossRef]
  25. Predel, B. B-Ni (Boron-Nickel). In Landolt-Börnstein-Group IV Physical Chemistry; Springer: Berlin/Heidelberg, Germany, 2012; p. 61. [Google Scholar]
  26. Goodman, T.R. Application of integral methods to transient nonlinear heat transfer. Adv. Heat Transf. 1964, 1, 51–122. [Google Scholar]
  27. Ascher, U.; Petzold, L. Computer Methods for Ordinary Differential Equations and Differential-Algebraic Equations; SIAM: Philadelphia, PA, USA, 1998. [Google Scholar]
  28. Calik, A.; Ucar, N.; Denikanli, K.; Carkci, M.; Karakas, S. Boriding kinetics and mechanical properties of borided commercial-purity nickel. Indian J. Eng. Mater. Sci. 2017, 24, 362–368. [Google Scholar]
  29. Gunes, I.; Keddam, M.; Chegroune, R.; Ozcatal, M. Growth kinetics of boride layers formed on 99.0% purity nickel. Bull. Mater. Sci. 2015, 38, 1113–1118. [Google Scholar] [CrossRef]
  30. Kahvecioglu, O.; Sista, V.; Eryilmaz, O.L.; Erdemir, A.; Timur, S. Ultra-fast boriding of nickel aluminide. Thin Solid Films 2011, 520, 1575–1581. [Google Scholar] [CrossRef]
  31. Torun, O. Boriding of nickel aluminide. Surf. Coat. Technol. 2008, 202, 3549–3554. [Google Scholar] [CrossRef]
  32. Contla-Pacheco, A.D.; Keddam, M.; Lartundo-Rojas, L.; Ortega-Aviles, M.; Mejía-Caballero, I.; Campos-Silva, I. Application of the Heat Balance Integral Method to the growth kinetics of nickel boride layers on an Inconel 718 superalloy. Surf. Coat. Technol. 2021, 420, 127355. [Google Scholar] [CrossRef]
  33. Makuch, N. Nanomechanical properties and fracture toughness of hard ceramic layer produced by gas boriding of Inconel 600 alloy. Trans. Nonferrous Met. Soc. China 2020, 30, 428–448. [Google Scholar] [CrossRef]
  34. Makuch, N.; Kulka, M.; Piasecki, A. The effects of chemical composition of Nimonic 80A-alloy on the microstructure and properties of gas-buried layer. Surf. Coat. Technol. 2015, 276, 440–455. [Google Scholar] [CrossRef]
  35. Kulka, M.; Makuch, N.; Dziarski, P.; Piasecki, A. A study of nanoindentation for mechanical characterization of chromium and nickel borides′ mixtures formed by laser boriding. Ceram. Int. 2014, 40, 6083–6094. [Google Scholar] [CrossRef]
  36. Makuch, N.; Piasecki, A.; Dziarski, P.; Kulka, M. Influence of laser alloying with boron and niobium on microstructure and properties of Nimonic 80A-alloy. Opt. Laser Technol. 2015, 75, 229–239. [Google Scholar] [CrossRef]
Figure 1. Microstructure of Nimonic 80A-alloy after plasma paste boriding using various parameters: (a) 1023 K for 3 h, (b) 1023 K for 4 h, (c) 1023 K for 6 h, (d) 1073 K for 3 h, (e) 1073 K for 4 h, (f) 1073 K for 6 h, (g) 1123 K for 3 h, (h) 1123 K for 4 h, (i) 1123 K for 6 h; 1—compact boride layer, 2—substrate material.
Materials 14 05146 g001
Figure 2. XRD patterns of Nimonic 80A-alloy after plasma paste boriding using selected parameters: (a) 1023 K for 3 h, (b) 1023 K for 6 h, (c) 1073 K for 3 h, (d) 1073 K for 6 h, (e) 1123 K for 3 h, (f) 1123 K for 6 h; 1—NiB, 2—Ni2B, 3—Ni3B, 4—Ni4B3, 5—CrB, 6—Cr2B.
Materials 14 05146 g002
Figure 3. Schematic representation of boron concentration-depth profile inside the entire boride layer in a saturated substrate with boron atoms.
Materials 14 05146 g003
Figure 4. Time dependence of entire boride layer thickness for increasing temperatures.
Materials 14 05146 g004
Figure 5. Temperature dependence of D versus the inverse of temperature.
Materials 14 05146 g005
Figure 6. Microhardness profiles of Nimonic 80A-alloy after plasma paste boriding using selected parameters: (a) 1023 K for 3 h, (b) 1023 K for 6 h, (c) 1073 K for 3 h, (d) 1073 K for 6 h, (e) 1123 K for 3 h, (f) 1123 K for 6 h.
Materials 14 05146 g006
Figure 7. Rockwell C indentation craters with failure marks produced on the surface of plasma paste borided Nimonic 80A-alloy at 1123 K for 6 h; the entire crater (a), enlargement of selected fragments of the crater (bd).
Materials 14 05146 g007
Figure 8. Results of wear resistance tests: (a) mass loss on a unit of friction surface vs. time of friction with calculated Imw factors, (b) relative mass loss of specimens and counter-specimens, (c) worn surface of plasma paste borided Nimonic 80A-alloy, (d) worn surface of non-borided Nimonic 80A-alloy.
Materials 14 05146 g008
Table 1. Experimental values of parabolic growth constants in the temperature range of 1023–1123 K.
Temperature (K)k (µm s−0.5)
at the Entire Boride Layer/Substrate Interface
10230.1987
10730.3825
11230.5376
Table 2. Estimated values of boron diffusion coefficients by the integral diffusion model with an upper boron content of 11.615 wt.%.
Temperature (K)D (×10−14 m2/s)
10232.27
10738.41
112316.62
Table 3. Boron activation energies in pure nickel and its alloys depending on the boriding technique.
MaterialBoriding TechniqueTemperature Range (K)Phases Present in the Boride LayerBoron Activation Energy (Kj·Mol−1)Calculation MethodRefs.
Pure NiPowder-pack boriding (Ekabor II)1123–1273Ni2B, Ni6Si2B47.3Parabolic growth law [28]
Nickel 201Powder-pack boriding (B4C + KBF4)1123–1273NiB, Ni2B, Ni3B, Ni4B3203.87Parabolic growth law [29]
Ni3AlElectrochemical boriding1073–1223Ni3B, Ni4B3, Ni20AlB14185.95Parabolic growth law [30]
Ni3AlPowder-pack boriding (Ekabor-Ni)1073–1223Ni3B, Ni4B3, Ni3Al188 ± 14.4Parabolic growth law [31]
Inconel 718Powder-pack boriding (90% B4C + 10% KBF4)1123–1223Ni4B3, Ni2B, Ni3B, Fe2B, Cr2B233.20 (Ni4B3) 206.17 (Ni2B)
218.06 (Ni3B)
Integral diffusion model [32]
Nimonic 80APlasma paste boriding1023–1123NiB, Ni2B, Ni3B, Ni4B3190.93Integral diffusion model [The present work]
Table 4. Experimental and simulated values of entire boride layers’ thicknesses.
Temperature (K)Time (h)Experimental Layer Thickness (µm)Standard
Deviation (mm)
Predicted Layer
Thickness (µm)
10230000
319.060.6721.58
425.060.6124.92
629.341.7330.52
10730000
340.230.8236.41
444.561.2842.04
656.972.351.49
11230000
355.810.8558.63
466.041.2867.7
677.823.0982.93
Publisher’s Note: MDPI stays neutral with regard to jurisdictional claims in published maps and institutional affiliations.

