Abstract
The relationship between the angles of misorientation of macroscopic low-angle boundaries (LABs) and changes in the lattice parameter of the γ′-phase around the LABs in the root of single-crystalline (SX) turbine blades made of CMSX-4 superalloy were studied. The blades with an axial orientation of the [001] type were solidified using an industrial Bridgman furnace with a 3 mm/min withdrawal rate. X-ray diffraction topography, the EFG Ω-scan X-ray diffraction method, scanning electron microscopy, and Laue diffraction were used to study the thin lamellar samples with a thickness of 0.5 mm and orientation of the surface perpendicular to the [001] direction. It is found that in the areas with a width of a few millimetres around LABs, decreases in the lattice parameter of the γ′-phase occur. These lattice parameter changes are related to the internal stresses of the γ′-phase caused by local changes in the concentration of alloying elements and/or to the dendrite bending near the LABs. X-ray topography used on two surfaces of thin lamellar samples coupled with the lattice parameter measurements of the γ′-phase near the LAB allows separating the misorientation component of LAB diffraction contrast from the component and visualising the internal stresses of the γ′-phase.
1. Introduction
Single-crystalline (SX) CMSX-4 turbine blades are used in the hot part of aircraft engines in a gas stream with a temperature of about 1700 °C and a centrifugal force of the order of tons [1]. They are made of CMSX-4 superalloy characterised by excellent mechanical and strength properties, especially at high temperatures. The alloy contains 10 major alloying elements, and its chemical composition is as follows (in wt %): Ni–9.5 Co–6.4 Cr–6.4 Ta–6.4 W–5.6 Al–2.9 Re–1.0 Ti–0.6 Mo–0.1 Hf [1]. Currently, these alloys are used most often on production lines. During production, at the stage of directional dendritic crystallisation using the Bridgman technique, obtained blade casts contain a set of parallel dendrites with the same crystal orientation of the [001] type. This ensures that the blades have high creep resistance at high temperatures [1]. The orientation is given to the cast by a selector with a narrow diameter, which is cut off at the next stage of production. The selector is connected to a wide root. During crystallisation, change in the cross-sectional area where crystallisation occurs from the narrow selector to the wide root causes the formation of various defects such as low-angle boundaries (LABs) [2,3], vacancies [4], and casting stress [5,6]. These root defects are inherited by airfoil during crystallisation of the blade and often do not disappear even after heat treatment is applied on production lines [7]. Therefore, studies of LABs in the research of the root are very important.
Low-angle boundaries and casting stresses may cause delamination and crack of the protective coatings of blades during implementation [8], thus reducing their service life. The cross-sectional area of the root is much larger than the airfoil. In the areas of the root with macroscopic low-angle boundaries (LABs), the concentration of vacancies and their clusters in the γ′-phase is increased [6]. Therefore, it can be assumed that near the LABs, changes in the lattice parameter of the γ′-phase (hereinafter referred to simply as aγ′) may occur.
The X-ray diffraction topography methods used to study single-crystalline blades are very useful for characterising macroscopic defects related to local changes in crystal orientation, such as LABs [3,6,9]. Based on X-ray topograms of single-crystalline blades, crystal misorientation of adjacent dendrites or their groups and low-angle boundaries (LABs) can be visualised. A value of misorientation angle may also be defined by the method described in Ref. [10]. Additionally, the diffraction contrast that creates the topograms also contains information about the change in the lattice parameter. In Ref. [11], it is shown that the lattice parameter of the γ′-phase of the SX CMSX-4 superalloys near the LABs is decreased. However, precise measurements of the lattice parameter near the LABs have not been made. In Ref. [3], X-ray reflection topography of two surfaces of lamellar samples was investigated for the first time. It was found that the image of misorientation defects (i.e., LABs) from both sample surfaces, having the size of the sample thickness, is characterised by the contrast inversion in the topograms. However, a detailed analysis of the angles of misorientation determined for the topograms from both surfaces has not been performed.
It is generally assumed that in the X-ray topograms of SX superalloys, two types of macroscopic LAB contrast can be distinguished. The first is related to the abrupt crystal lattice rotation of local macroscopic regions called the subgrains. This rotation is characterised by the angle of misorientation. The second is related to a local change in the interplanar spacing of crystal lattices near the LAB. These changes may be related to the bending of the dendrites [12,13] or a local change in the chemical composition of the cast.
The superalloy cast consists mainly of two phases, γ and γ′, at room temperature. The creation of LABs and areas of lattice parameter changes occurs during dendritic crystallisation of the γ-phase in a complex-shaped casting mould. After crystallisation, both in the dendrites and the interdendritic regions, the γ-phase changes according to the transition γI → γ′ + γII, where γI has a chemical composition corresponding to the mushy zone of Ni-Al phase equilibrium diagram, and γII corresponds to the γ and γ′ equilibrium region of this diagram. In the vicinity of the LAB, changes in the lattice parameter aγ′ may occur due to inheriting the original γI lattice parameter changes. These changes in lattice parameters are related to the heterogeneity of the chemical composition resulting from the segregation of numerous alloying elements both on the dendrite scale and on the γ/γ′ structure scale. The LABs in CMSX-4 are located in the interdendritic regions, where the chemical composition of the superalloy is different from the nominal composition of CMSX-4 [14,15]. It is related to the so-called dendritic segregation of alloying elements during the directional crystallisation process [16,17]. In the airfoil of the blades, dendritic segregation has a very complex nature, as the set of parallel dendrites crystallises in a reasonably narrow area between the suction and pressure surfaces of the airfoil. The changes in the chemical composition and aγ′ heterogeneity around the LABs, in this case, can have complex mechanisms related to the crystallisation of the dendrites near the surface of the casting mould [18]. However, in the bulk root, the side surfaces are mostly parallel to the direction of crystallisation. Therefore, to examine the relationship between LAB angles of misorientation and lattice parameter aγ′ changes near the LABs, the blade roots were chosen. The interaction of dendrites with the walls of the mould is much smaller than in the airfoil. Therefore, the relationship between the LAB and the lattice parameter of the γ′-phase is devoid of the influence of these walls. The interpretation of the measurement result should be significantly simplified. Additionally, the measurement of aγ′ by X-ray diffraction methods is relatively simple as the content of this phase in CMSX-4 superalloy is high and amounts to 70% [1], so its contribution to the X-ray diffraction pattern is large.
The aim of the study is to determine the relationship between the misorientation angles of LABs and changes in the lattice parameter of the γ′-phase near the LABs in the roots of single-crystalline blades made of the CMSX-4 alloy.
2. Materials and Methods
The single-crystalline blades were produced at the Research and Development Laboratory for Aerospace Materials at the Rzeszów University of Technology, Rzeszów, Poland. The specimens were prepared from the roots of CMSX-4 turbine blades obtained with a 3 mm/min withdrawal rate by the Bridgman method.
The sample studies were carried out using X-ray diffraction topography and the measurement of the lattice parameter aγ′ by the EFG Ω-scan X-ray diffraction method using the EFG Freiberg Instruments X-ray diffractometer (Freiberg Instruments, Freiberg, Germany) [19]. The dendritic structure was visualised by scanning electron microscopy (SEM) with backscattered electron imaging (BSE). The JSM-6480 JEOL electron microscope (JEOL Ltd., Tokyo, Japan) was used to visualise the dendrite array. The crystal orientation of the samples was determined in back-reflection geometry by the Laue diffraction using the X-ray diffractometer of an XRT-100 system provided by EFG Freiberg Instruments.
The studies used X-ray reflective diffraction topography with oscillation of the samples and the X-ray film around the Bragg angle. The divergent X-ray beam of characteristic CuKα radiation was applied using the PANalytical Microfocus DY0601 diffractometer (Malvern PANalytical, Almelo, The Netherlands). During topogram recording, the divergent beam coming from a quasi-point X-ray source illuminates the whole surface of the sample. The topograms were obtained using 002 type of reflexes coupled with an X-ray film sample oscillating about the vertical axis T by an angle of ±4° about the Bragg angle θ (Figure 1). Topograms were recorded on AGFA Structurix D7 films.
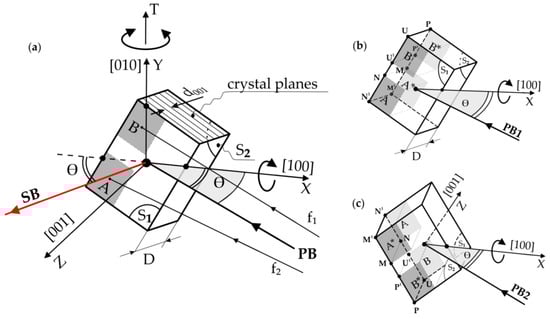
Figure 1.
Scheme of the X-ray diffraction topography method with oscillation about the T-axis of the diffractometer, which is consistent with the Y-axis of a plate-shaped sample (a) and sample settings during X-ray topogram recording from surfaces S1 (b) and S2 (c). The X and Y axes lie in the sample surface S1, and the Z-axis is perpendicular to it. d001—an interplanar spacing. PB and SB—the fragments of the primary and secondary (diffracted) beam. f1 and f2—the divergent fragments of PB.
The plate-shaped specimens, with a small thickness of D = 0.5 mm and surfaces S1 and S2, perpendicular to the direction [001]γ/γ′, were prepared from the blade root (Figure 1). The tested surfaces were prepared according to the procedures for preparing the specimens necessary for X-ray measurements [20]. X-ray topograms were recorded from both surfaces S1 and S2.
In the first stage, the sample was mounted on the goniometer head of the diffractometer in such a way that the crystal direction [010], parallel to the Y-axis of the sample (Figure 1), was arranged parallel to the vertical axis T of the diffractometer. The direction [100] of the sample was parallel to the X-axis and horizontal. The divergent primary beam (PB) covered the entire surface S1 of the sample. In Figure 1, only the central fragments and two divergent fragments f1 and f2 of the primary and central fragments of the secondary beam (SB) are shown for clarity. The distance of the radiation source from the sample surface (about 500 mm) was much greater than the sample size (20 mm × 15 mm). During the oscillation of the sample, various fragments of the surface S1 successively fulfil the Bragg condition, and a topogram of the entire surface S1 is gradually recorded on the film. After recording the topogram from the S1 surface, the sample was rotated about the X-axis by 180°, and the X-ray topogram from the S2 surface was then recorded.
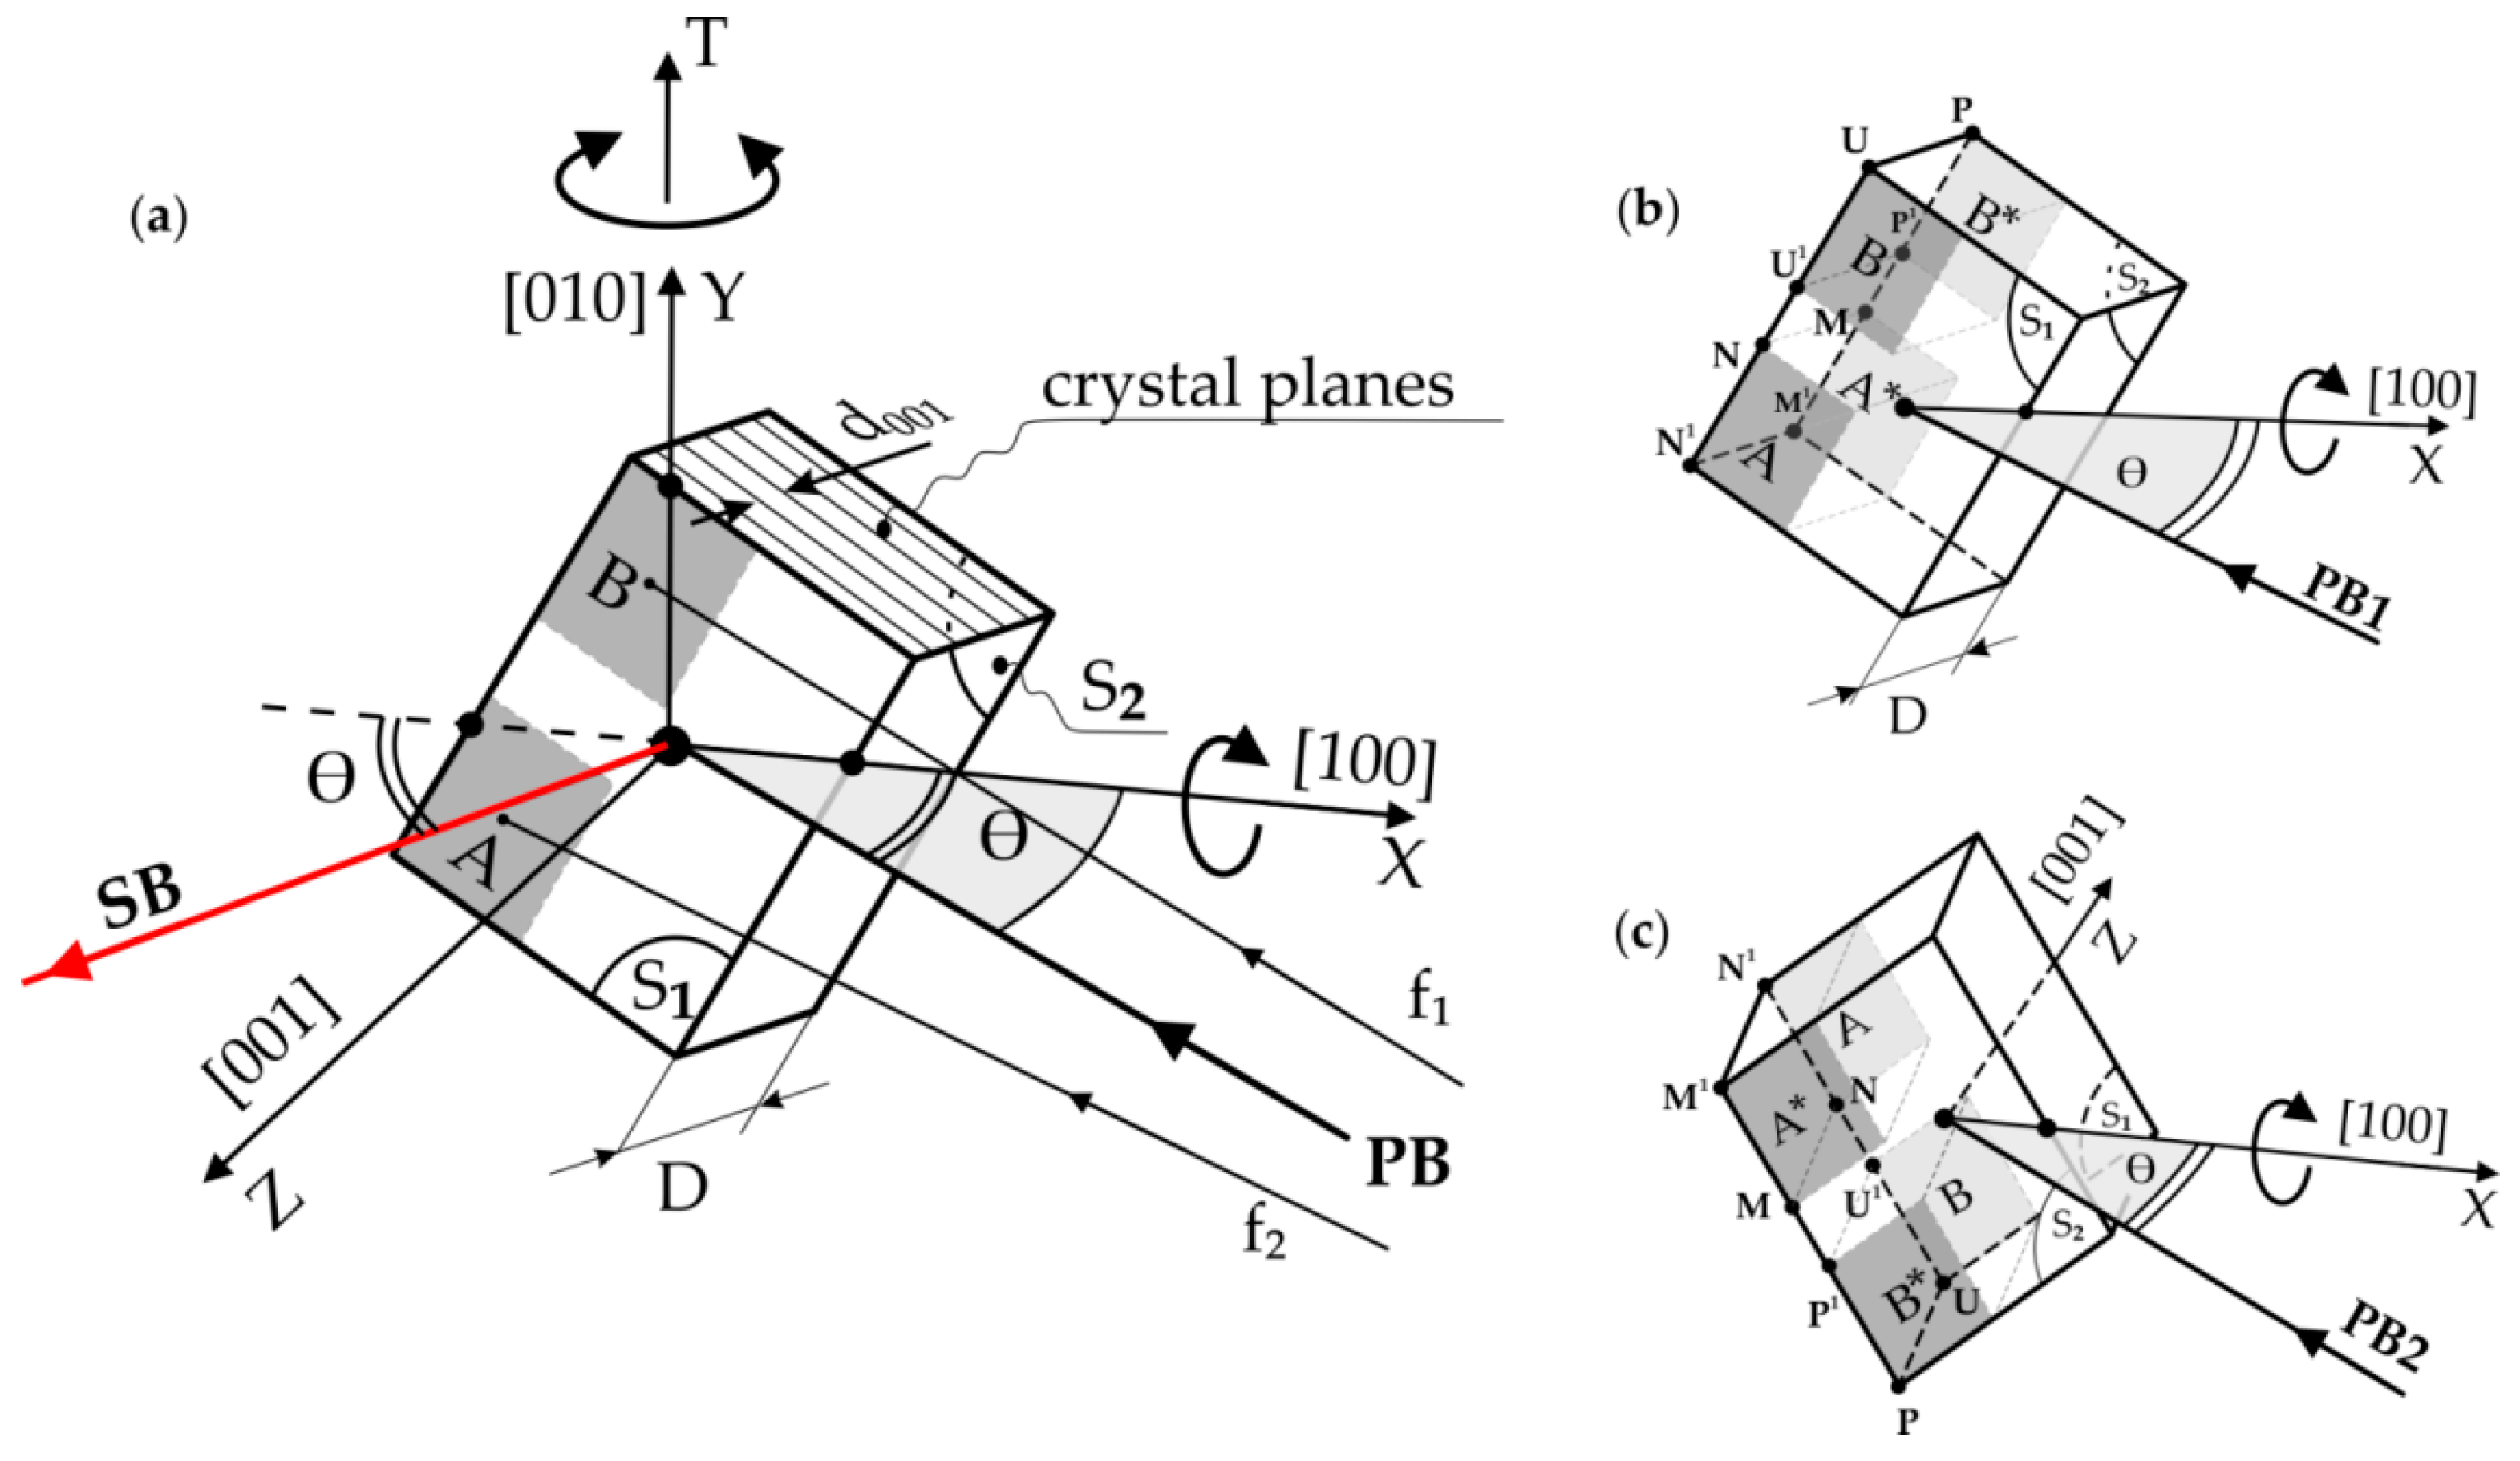
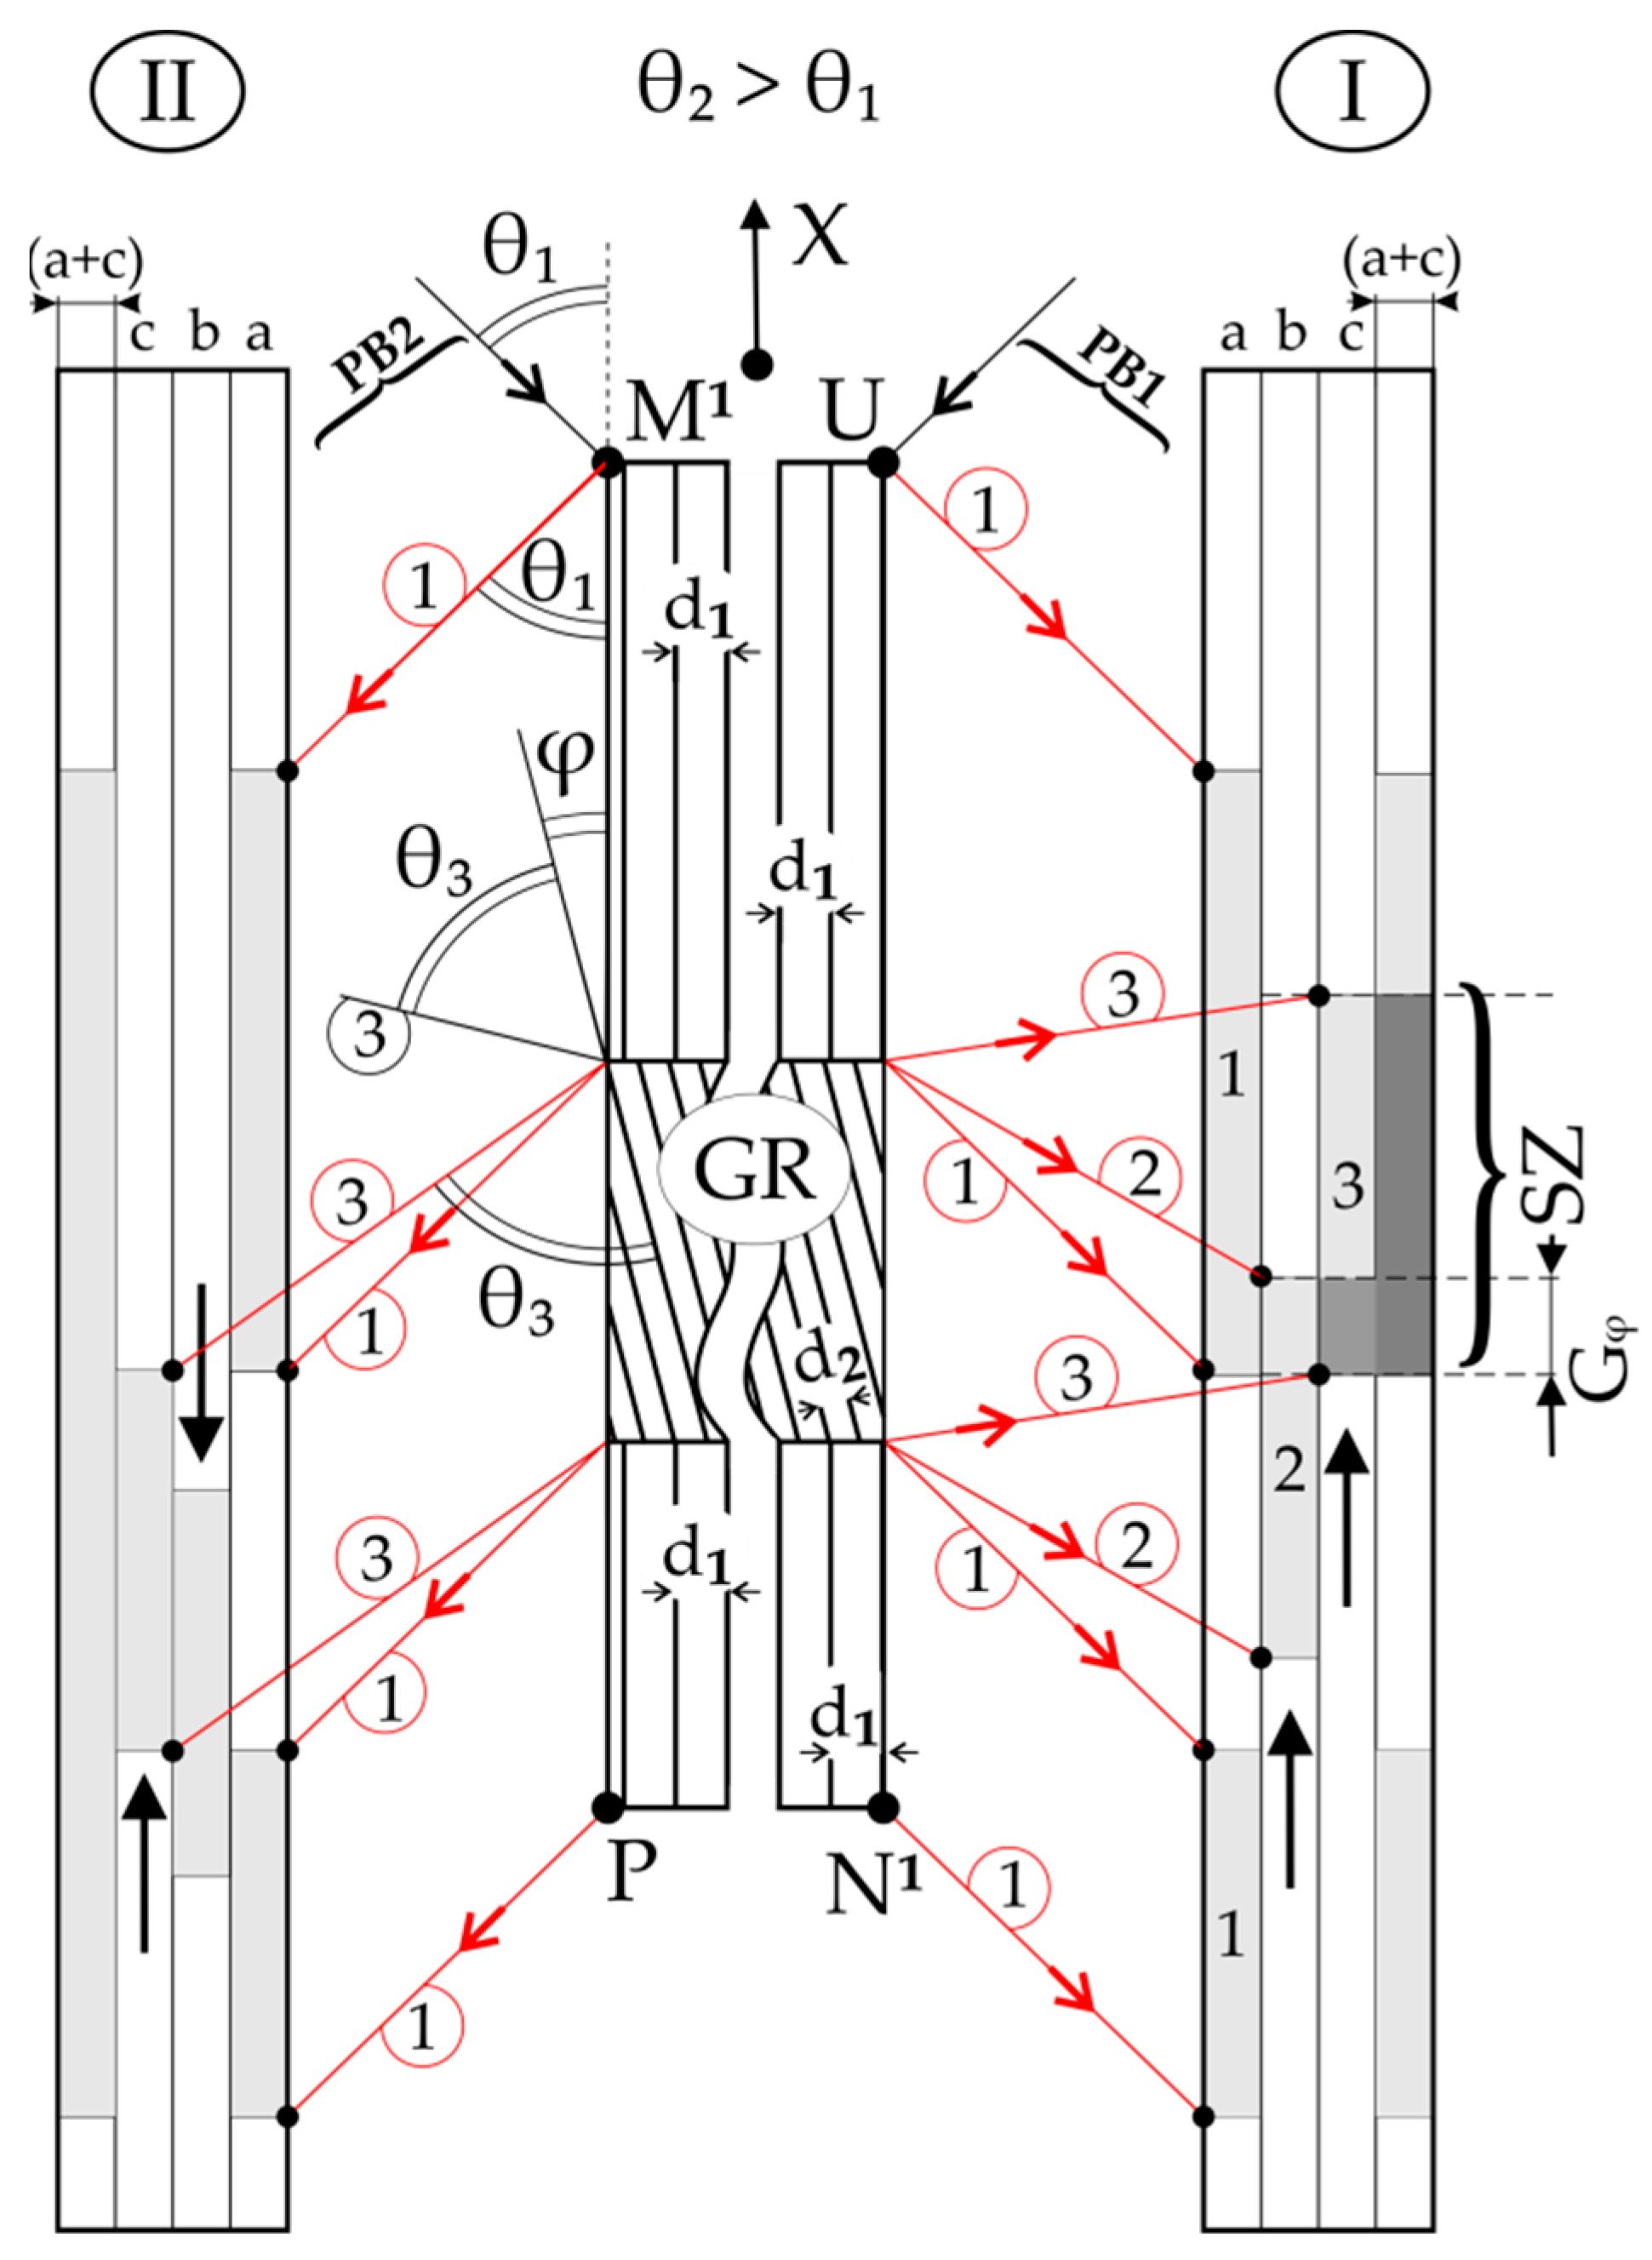
Let us consider the hypothetical case of X-ray diffraction from two surfaces of the thin sample, where, in the area G, there is the rotation of the crystal lattice by the angle φ relative to the rest of the sample (Figure 2). Additionally, the interplanar spacing d of diffraction planes of the G area is the same as outside of this area. The diffraction planes of the (001) type are parallel to the S1 and S2 surfaces of the sample, and the size of G is of the order of the thickness D of the sample (Figure 1). In order to reduce the number of drawings, Figure 2a shows two diffraction geometries as if there were two primary beams PB1 and PB2 and two X-ray film placements, I and II.
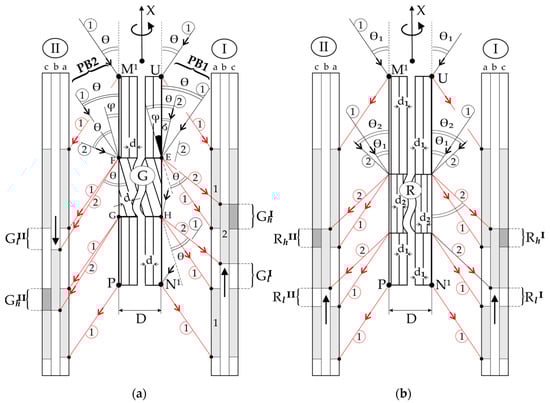
Figure 2.
Schemes of contrast inversion of the G area with a lattice rotation by the angle φ (a) and the lack of contrast inversion in the case of the R area with a changed interplanar spacing d (b). Black arrows correspond to the fragments of the primary beam, and red arrows correspond to the secondary (diffracted) beam fragments. The φ is enlarged to figure clarity. I and II—marked the two sets of X-ray film and primary beam placement.
These two diffraction geometries may be named as two sets of PB and film placement. Set I with PB1, which corresponds to the diffraction scheme from the surface S1 (Figure 1), is shown in Figure 2 in the top view. In contrast, set II with PB2 corresponds to the diffraction scheme from the surface S2 (Figure 2) in the bottom view. The axis T (Figure 1) of coupled film and sample oscillation is perpendicular to the surface of Figure 2.
These two sets can be realised when we rotate the sample about the X-axis by 180°, with a constant position of the primary beam, marked as PB1 or PB2 in Figure 1.
It was assumed that the size of area G is so large that it is “visible” on both surfaces S1 and S2 (Figure 1), marked in Figure 2 as UN1 and PM1. In both cases, the divergent primary beam covers the surface completely. At a certain arrangement of coupled sample and X-ray film oscillation, some fragments of the primary beam satisfy the Bragg condition for the E point of the upper sample surface part UE. This fragment is deflected in the direction of the secondary beam 1 (red arrow 1). The points of the UE part satisfy the Bragg condition at different times when the various parts of the primary beam fall on it at the Bragg angle. In this way, the image of part UE is gradually recorded on the hypothetical layer a of the X-ray film 1 (Figure 2a). The recording of the image topogram of part HN1 on the hypothetical layer “a” is similar. This is performed by reflecting various fragments of the primary beam at the same angle (Bragg) taking place at different moments in the sample and X-ray film oscillation.
During the oscillation of the sample around the T (Y) axis (Figure 1), for a certain range of sample oscillation angles, some fragments of the PB1 beam, marked as black arrows 1 in Figure 2a, met the Bragg condition for various parts of the UN1 surface, except for the part EH (Figure 2a) corresponding to the G area of the sample. Different fragments of the primary beam (black arrows 1) deflect on various points of the upper and lower parts of the UN1 surface, creating diffracted beam fragments that are marked with red arrows 1. At this range of oscillation angles of the sample on the X-ray film, the exposition of the 1st part of hypothetical layer “a” of the film is created. As a result of exposition, the contrast of these fragments increases, i.e., its blackening is gradually increased.
Where PB1 fragments are reflected from the region G, the angle of its incidence must be equal to the angle δ = θ − φ (Figure 2a). The angle δ is shown in Figure 2a for point E, common to area G and upper region UE of the sample. The angle δ is constant for the entire surface EH of area G. The fragments of the diffracted beam are shown in Figure 2a for the surface of the G area in the form of red arrows 2. The blackening of the 2nd part of hypothetical layer b of the X-ray film is created at different sample oscillation angles. Based on Figure 2a, it can be seen that the image of area G on the hypothetical layer b of the X-ray film will be shifted upwards. On the real X-ray film, the blackening of both hypothetical layers a and b overlap, creating a topogram, the contrast of which is shown on the c layer. As a result of the above-described overlap, an area of increased contrast GhI causes increased contrast on the X-ray film, and an area of lowered GlI contrast, which causes decreased contrast on the X-ray film, will be formed on the real topogram. Similar reasoning can be made for the situation in which the primary beam PB2, which some fragment marked as 1 in Figure 2a, covers the surface of PM1 corresponding to the S2 surface in Figure 1. For set II in Figure 2a, not all fragments of the primary beam are shown. In this case, on the hypothetical layer b of the film, the image of the area G will be shifted downwards, resulting from which areas of increased GhII and lowered GlII contrast will be created on layer c, i.e., on the topogram. When we compare the topograms obtained from the two surfaces of the sample, instead of the high-contrast area GhI obtained with set I on the topogram, there will be a low-contrast area GlII obtained with set II. Similar relationships exist for the areas GlI and GhII. Comparing the topograms (layers c) obtained with sets I and II, the inversion of the contrast originating from the same defect of misorienting character can be observed. This type of contrast inversion was first presented in Ref [7].
Figure 2b shows a scheme of diffraction, wherein in a certain area R of the sample, there is a reduction in the interplanar spacing (d2 < d1), without the crystal lattice rotation. For the upper and lower sample fragments with interplanar spacing d1, the Bragg angle is θ1. However, in this case, the deflection of X-ray according to Bragg conditions will take place at a greater θ2 angle for the R area. The scheme shows that the image shift of this area on the hypothetical layer b of the X-ray film will be for both surfaces UN1 and PM1 in the same direction—upward. Therefore, for sets I and II for the area R, an increased contrast of RhI and RhII will be created in the same place of both topograms, i.e., on layers c. The low-contrast areas RlI and RlII will also be in the same place, so there will be no contrast inversion.
3. Results and Discussion
Figure 3 and Figure 4 show representative examples of X-ray topograms of the blade root fragments with the schemes of the topograms and the dendritic structure visualised on the S1 surface.
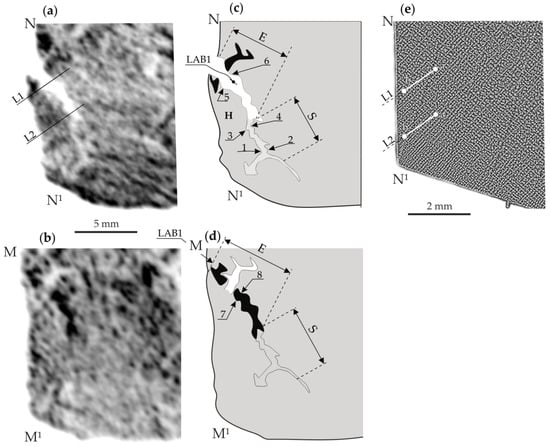
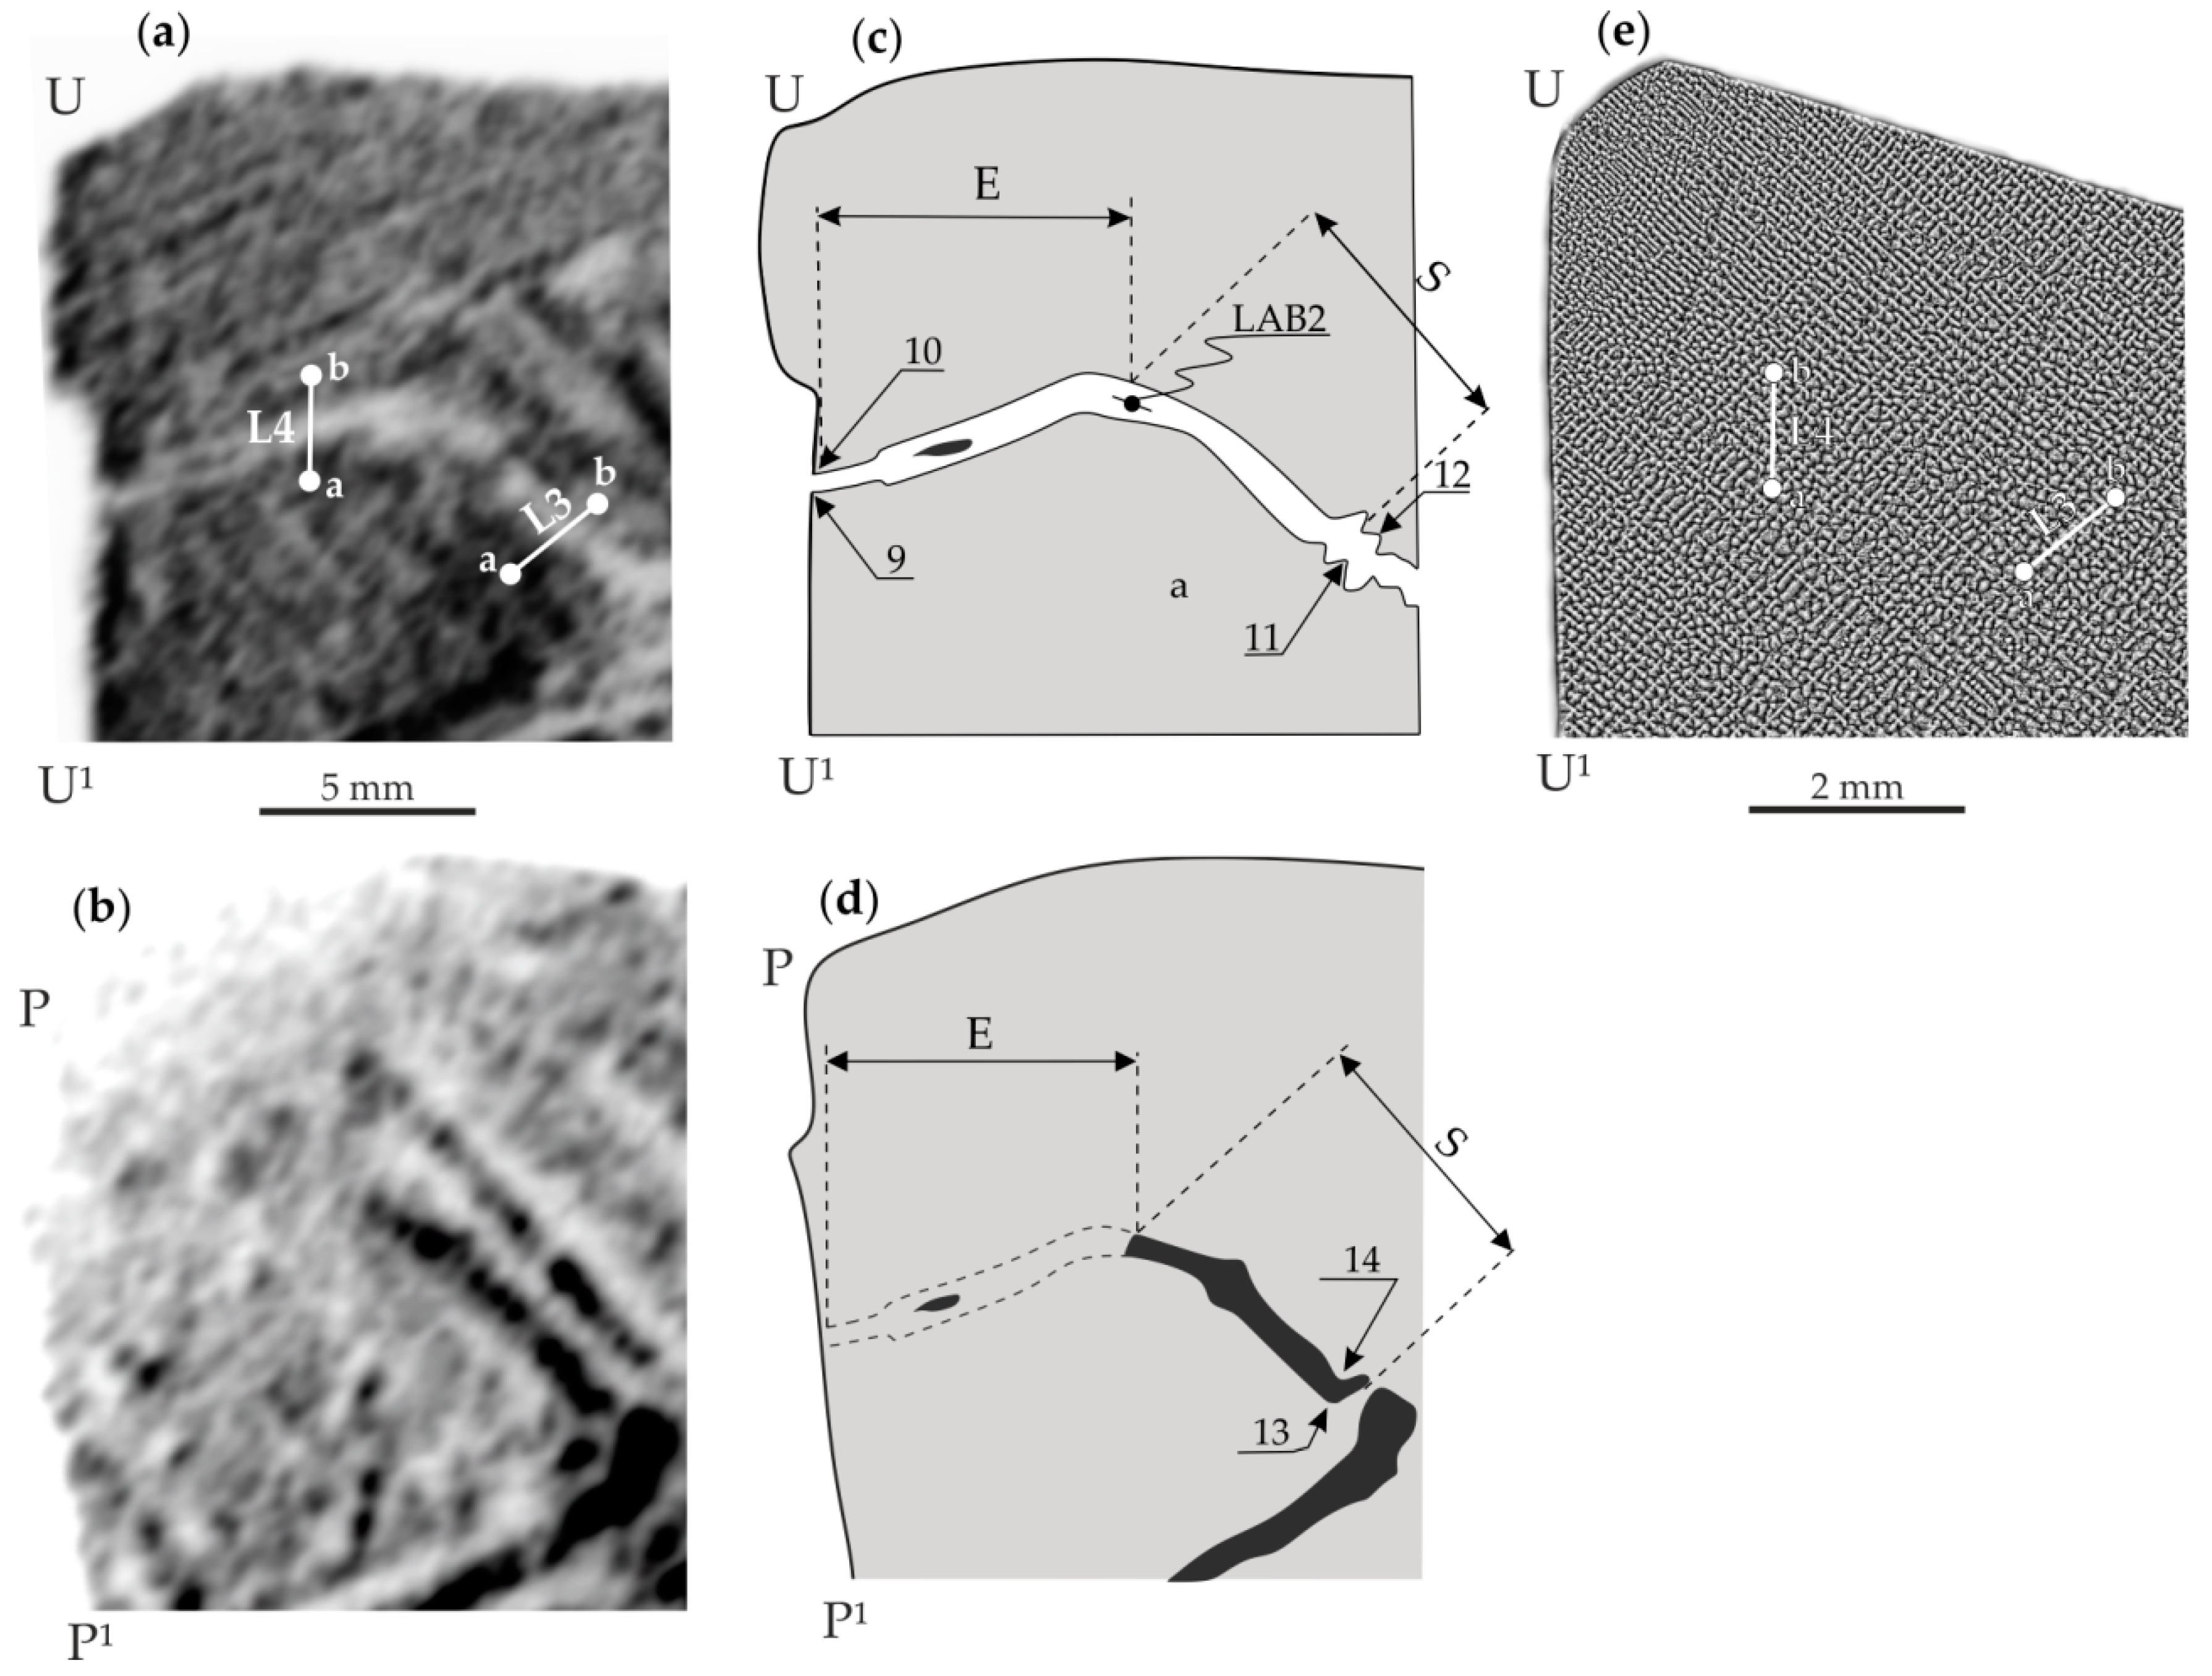
Figure 3.
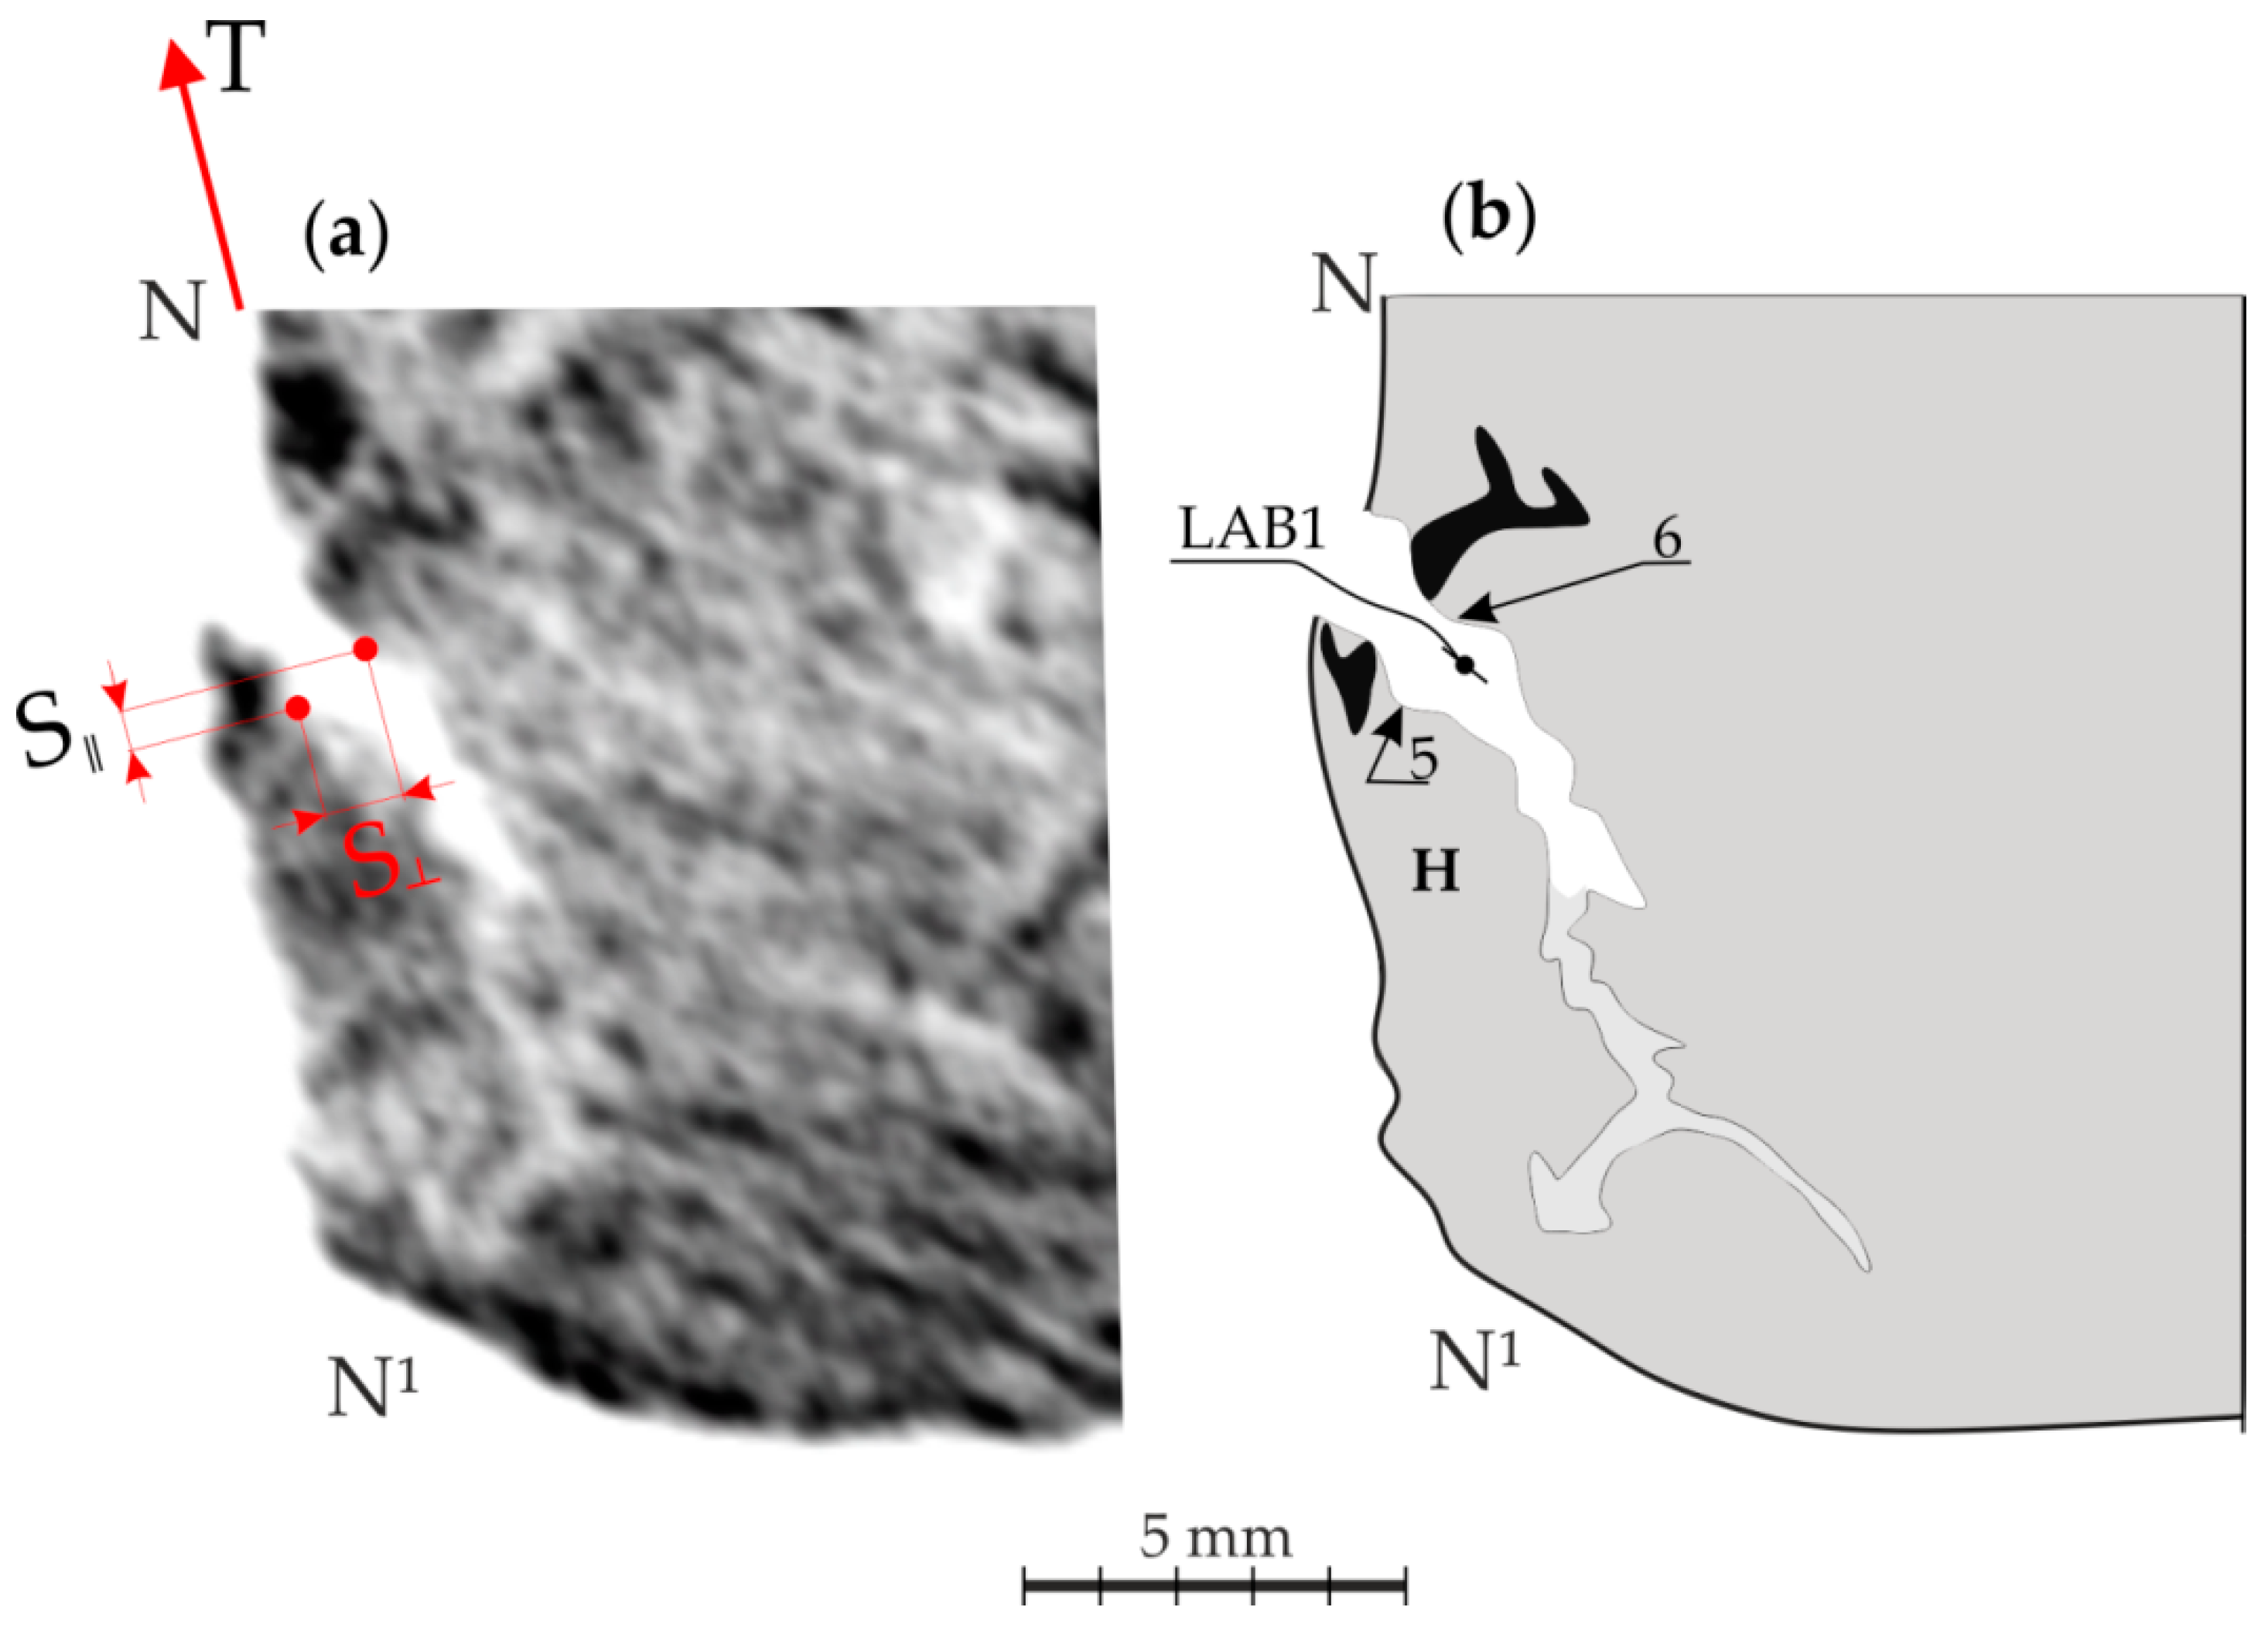
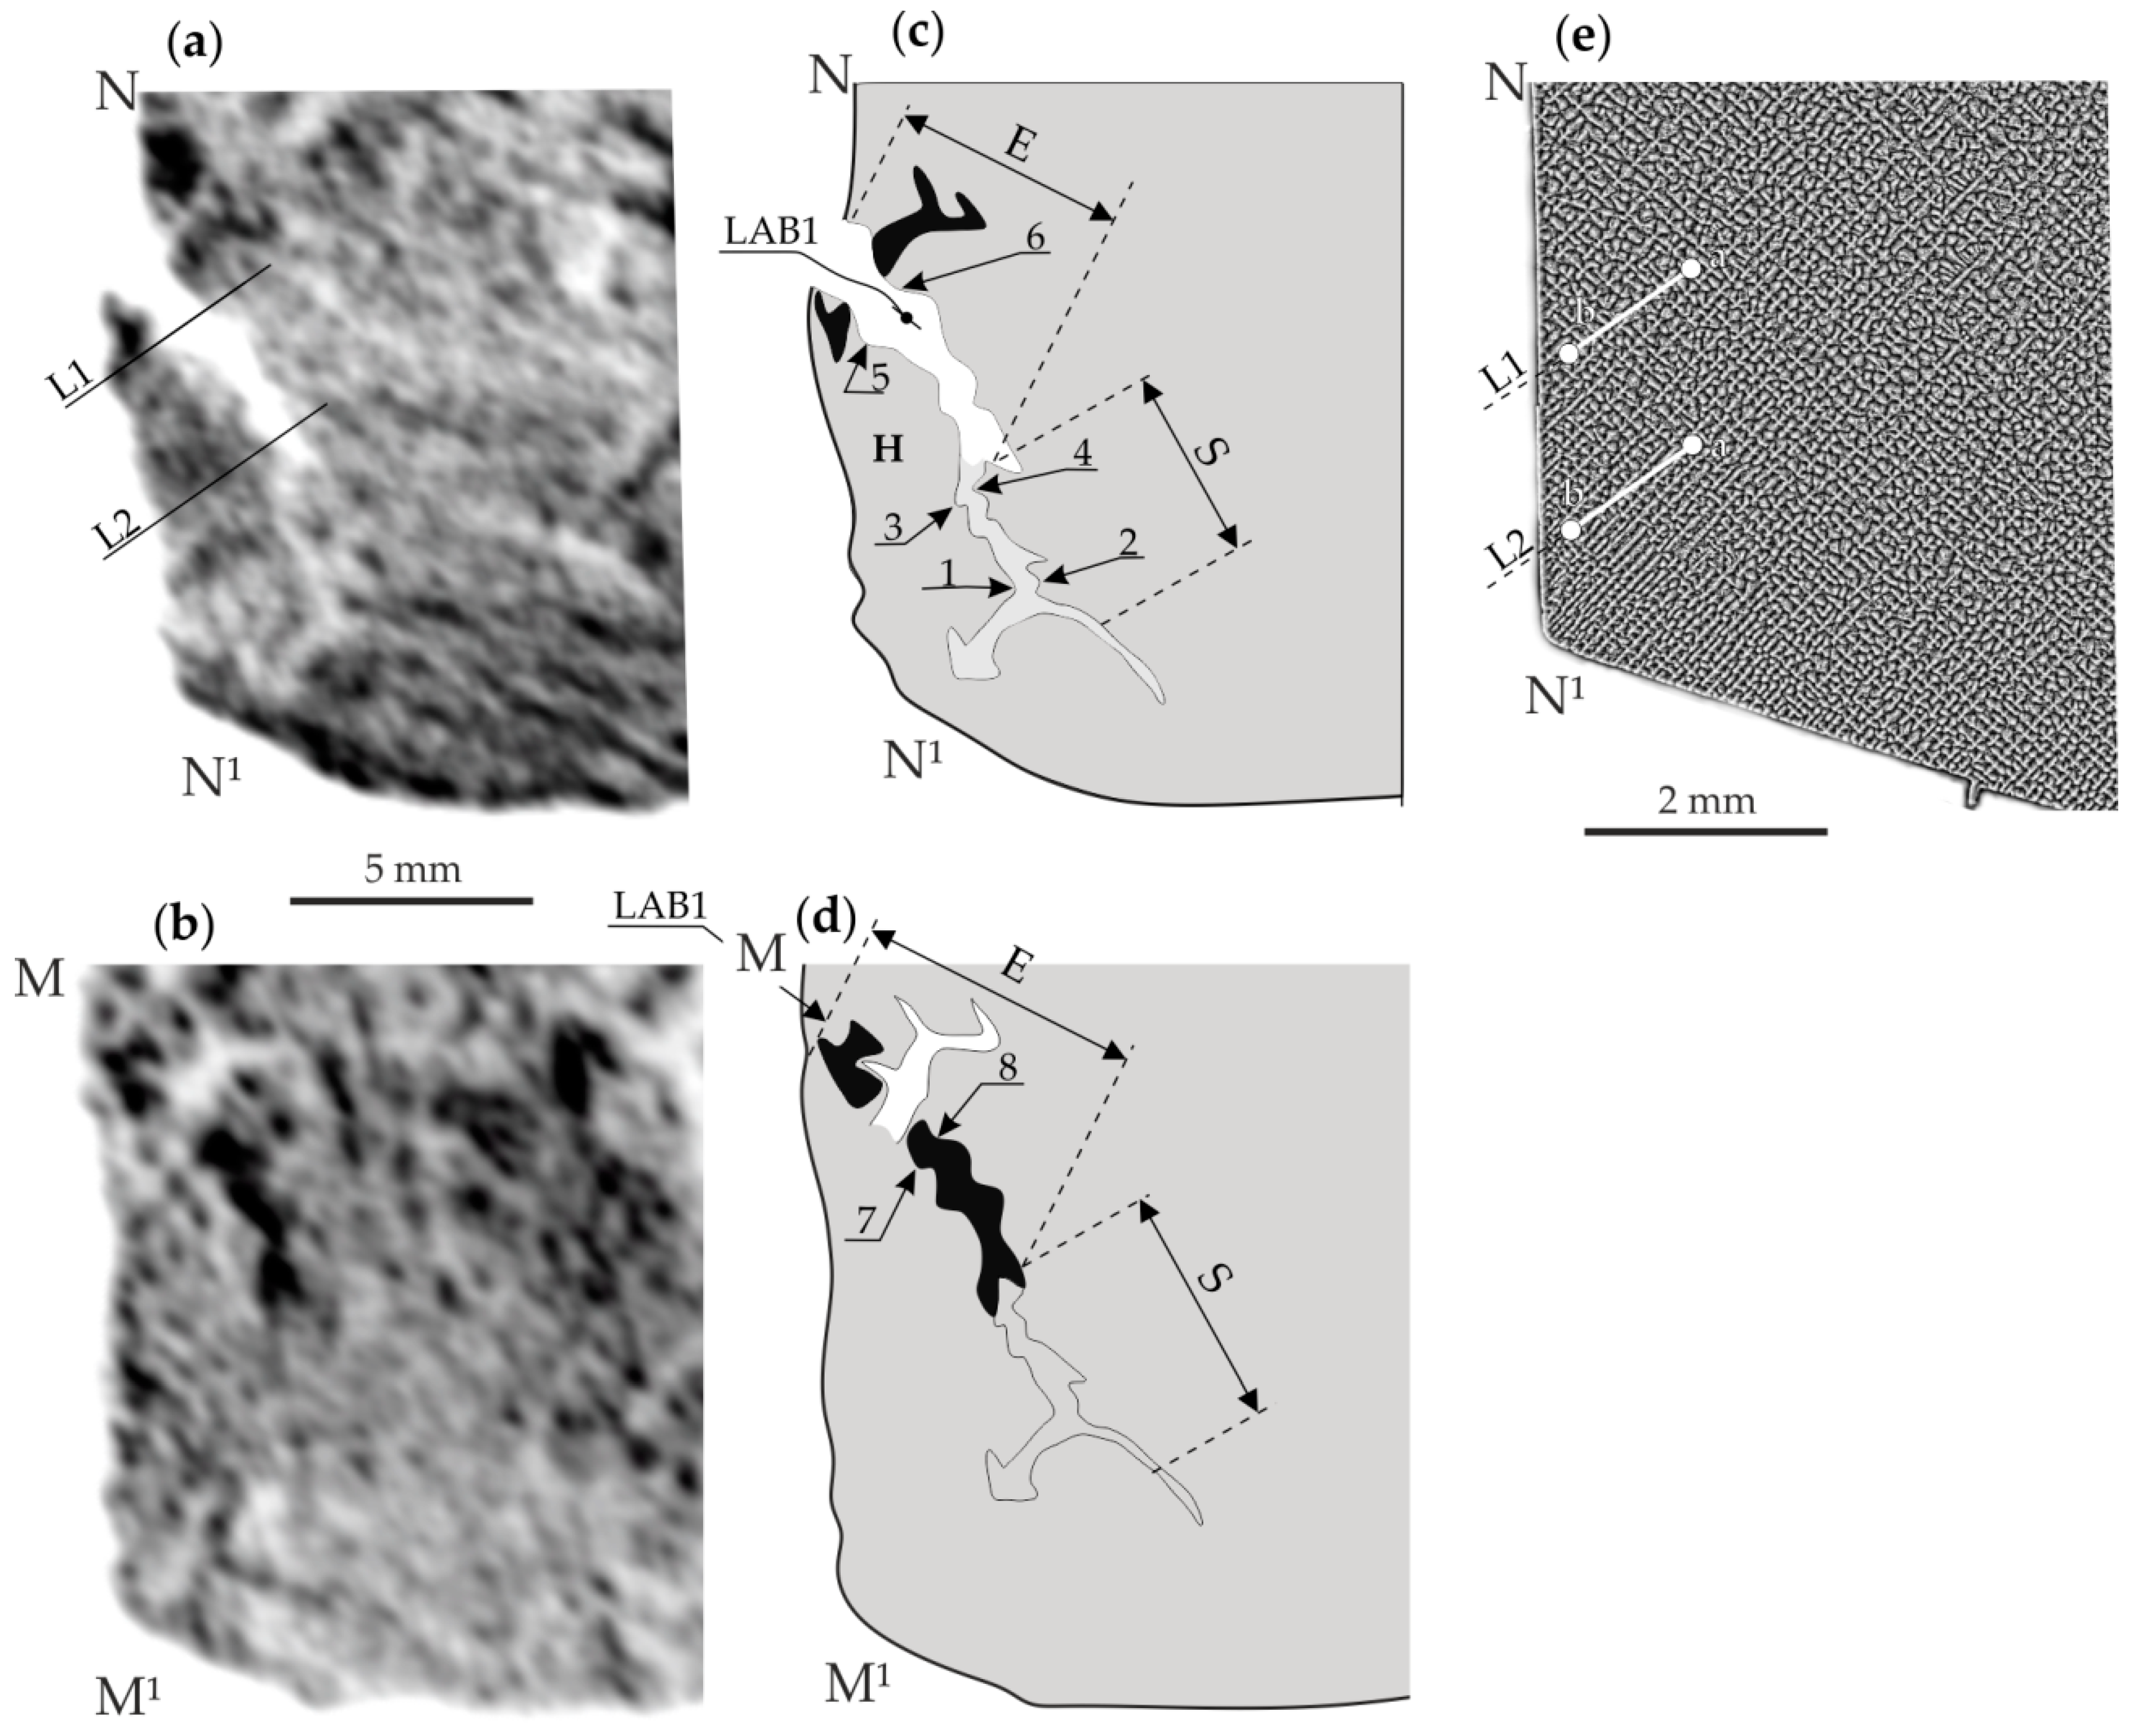
Examples of X-ray topograms obtained from fragment A of surface S1 and fragment A* of the S2 surface (a,b) with their schemes (c,d) and the dendritic structure visualised on surface S1 (e). Since the topogram from fragment A* was obtained from the mirror surface of fragment A, it was transformed by mirroring for easier comparison of areas of the same LAB visualised on both surfaces S1 and S2.
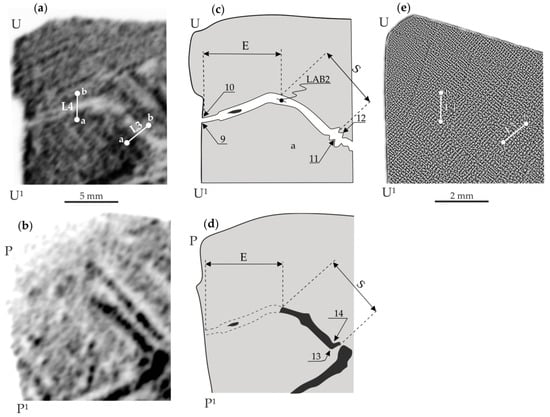
Figure 4.
Examples of X-ray topograms obtained from fragment B of surface S1 and fragment B* of surface S2 (a,b) with their schemes (c,d) and the dendritic structure visualised on the surface S1 (e). Since the topogram from fragment B* was obtained from the mirror surface of fragment B, it was transformed by mirroring for easier comparison of areas of the same LAB visualised on both surfaces S1 and S2.
Figure 3a,b shows the topograms obtained from the fragments NN1 and MM1 obtained from fragment A of surface S1 and fragment A* of the S2 surface. Low-angle boundary 1 (LAB1) is clearly visible in Figure 3a as a serpentine strip of decreased contrast. Additionally, part of LAB1 in the form of inverted increased contrast is shown in Figure 3b. LAB1 schemes are shown in Figure 3c,d. Figure 3e shows the image of the dendritic structure of the area from which the topogram presented in Figure 3a was obtained. The analysis of the dendritic structure does not allow perceiving the shape of LAB1. The image LAB1 in the topogram in Figure 3a was created by shifting fragment H (Figure 3c) about the rest of the topogram. Based on the analysis of Figure 3a, it can be concluded that the initial parts of the LAB1 distance, determined from the edge of the sample near the point N of the local shift to the width of the bright serpentine band in the topogram, is small. The final part E (Figure 3c), near the edge of the sample of fragment A, is greater. This means that the initial part’s misorientation angle is small, and the ending part E is greater. Comparing the images of LAB1 in Figure 3a,b, it can be concluded that the initial part S visible in the topogram in Figure 3a (scheme in Figure 3c) is not visible on the topogram in Figure 3b.
Additionally, in the topogram obtained from fragment A* (Figure 3b), the width of the dark strip of part E compared to the width of the bright strip of part E visible in Figure 3a (obtained from fragment A) is generally smaller. Using the method described in Refs [3,4,21], Appendix A and based on shifts of characteristic points 1 and 2, 3 and 4, and 5 and 6 of the topogram in Figure 3a, obtained from fragment A of the surface S1, the misorientation angles corresponding to these points were determined: α12 = 0.07°, α34 = 0.18°, and α56 = 0.43°, respectively. However, for the topogram in Figure 3b obtained from fragment A* of the surface S2, only the LAB1 local misorientation angle for points 7 and 8 was calculated: α78* = 0.11°.
Figure 4a,b shows the topograms obtained from fragment B of surface S1 and fragment B* of surface S2 of another sample cut from the blade root. In Figure 4a (obtained from fragment B), the low-angle boundary 2 (LAB2, scheme in Figure 4c) is visible in the form of a bright band that changes the orientation roughly in the point of E and S parts’ connection (Figure 4c). However, in Figure 4b (obtained from fragment B*), the beginning of part S of LAB2 is visualised as a dark band, and the image of its end (part E) is not visible. Using the topograms in Figure 4a,c, the local misorientation angles for LAB2 were calculated for characteristic points 11 and 12, as well as for 9 and 10: α11,12 = 0.39°, α9,10 = 0.08°, respectively. Additionally, for the topogram in Figure 4b recorded from the surface S2, the α*13,14 value was calculated, which was 0.32°. Comparing the topograms in Figure 3 and Figure 4 shows that images of the S part of LAB1 and the E part of LAB2 are not visible on the topogram obtained from the surface S2 of the samples.
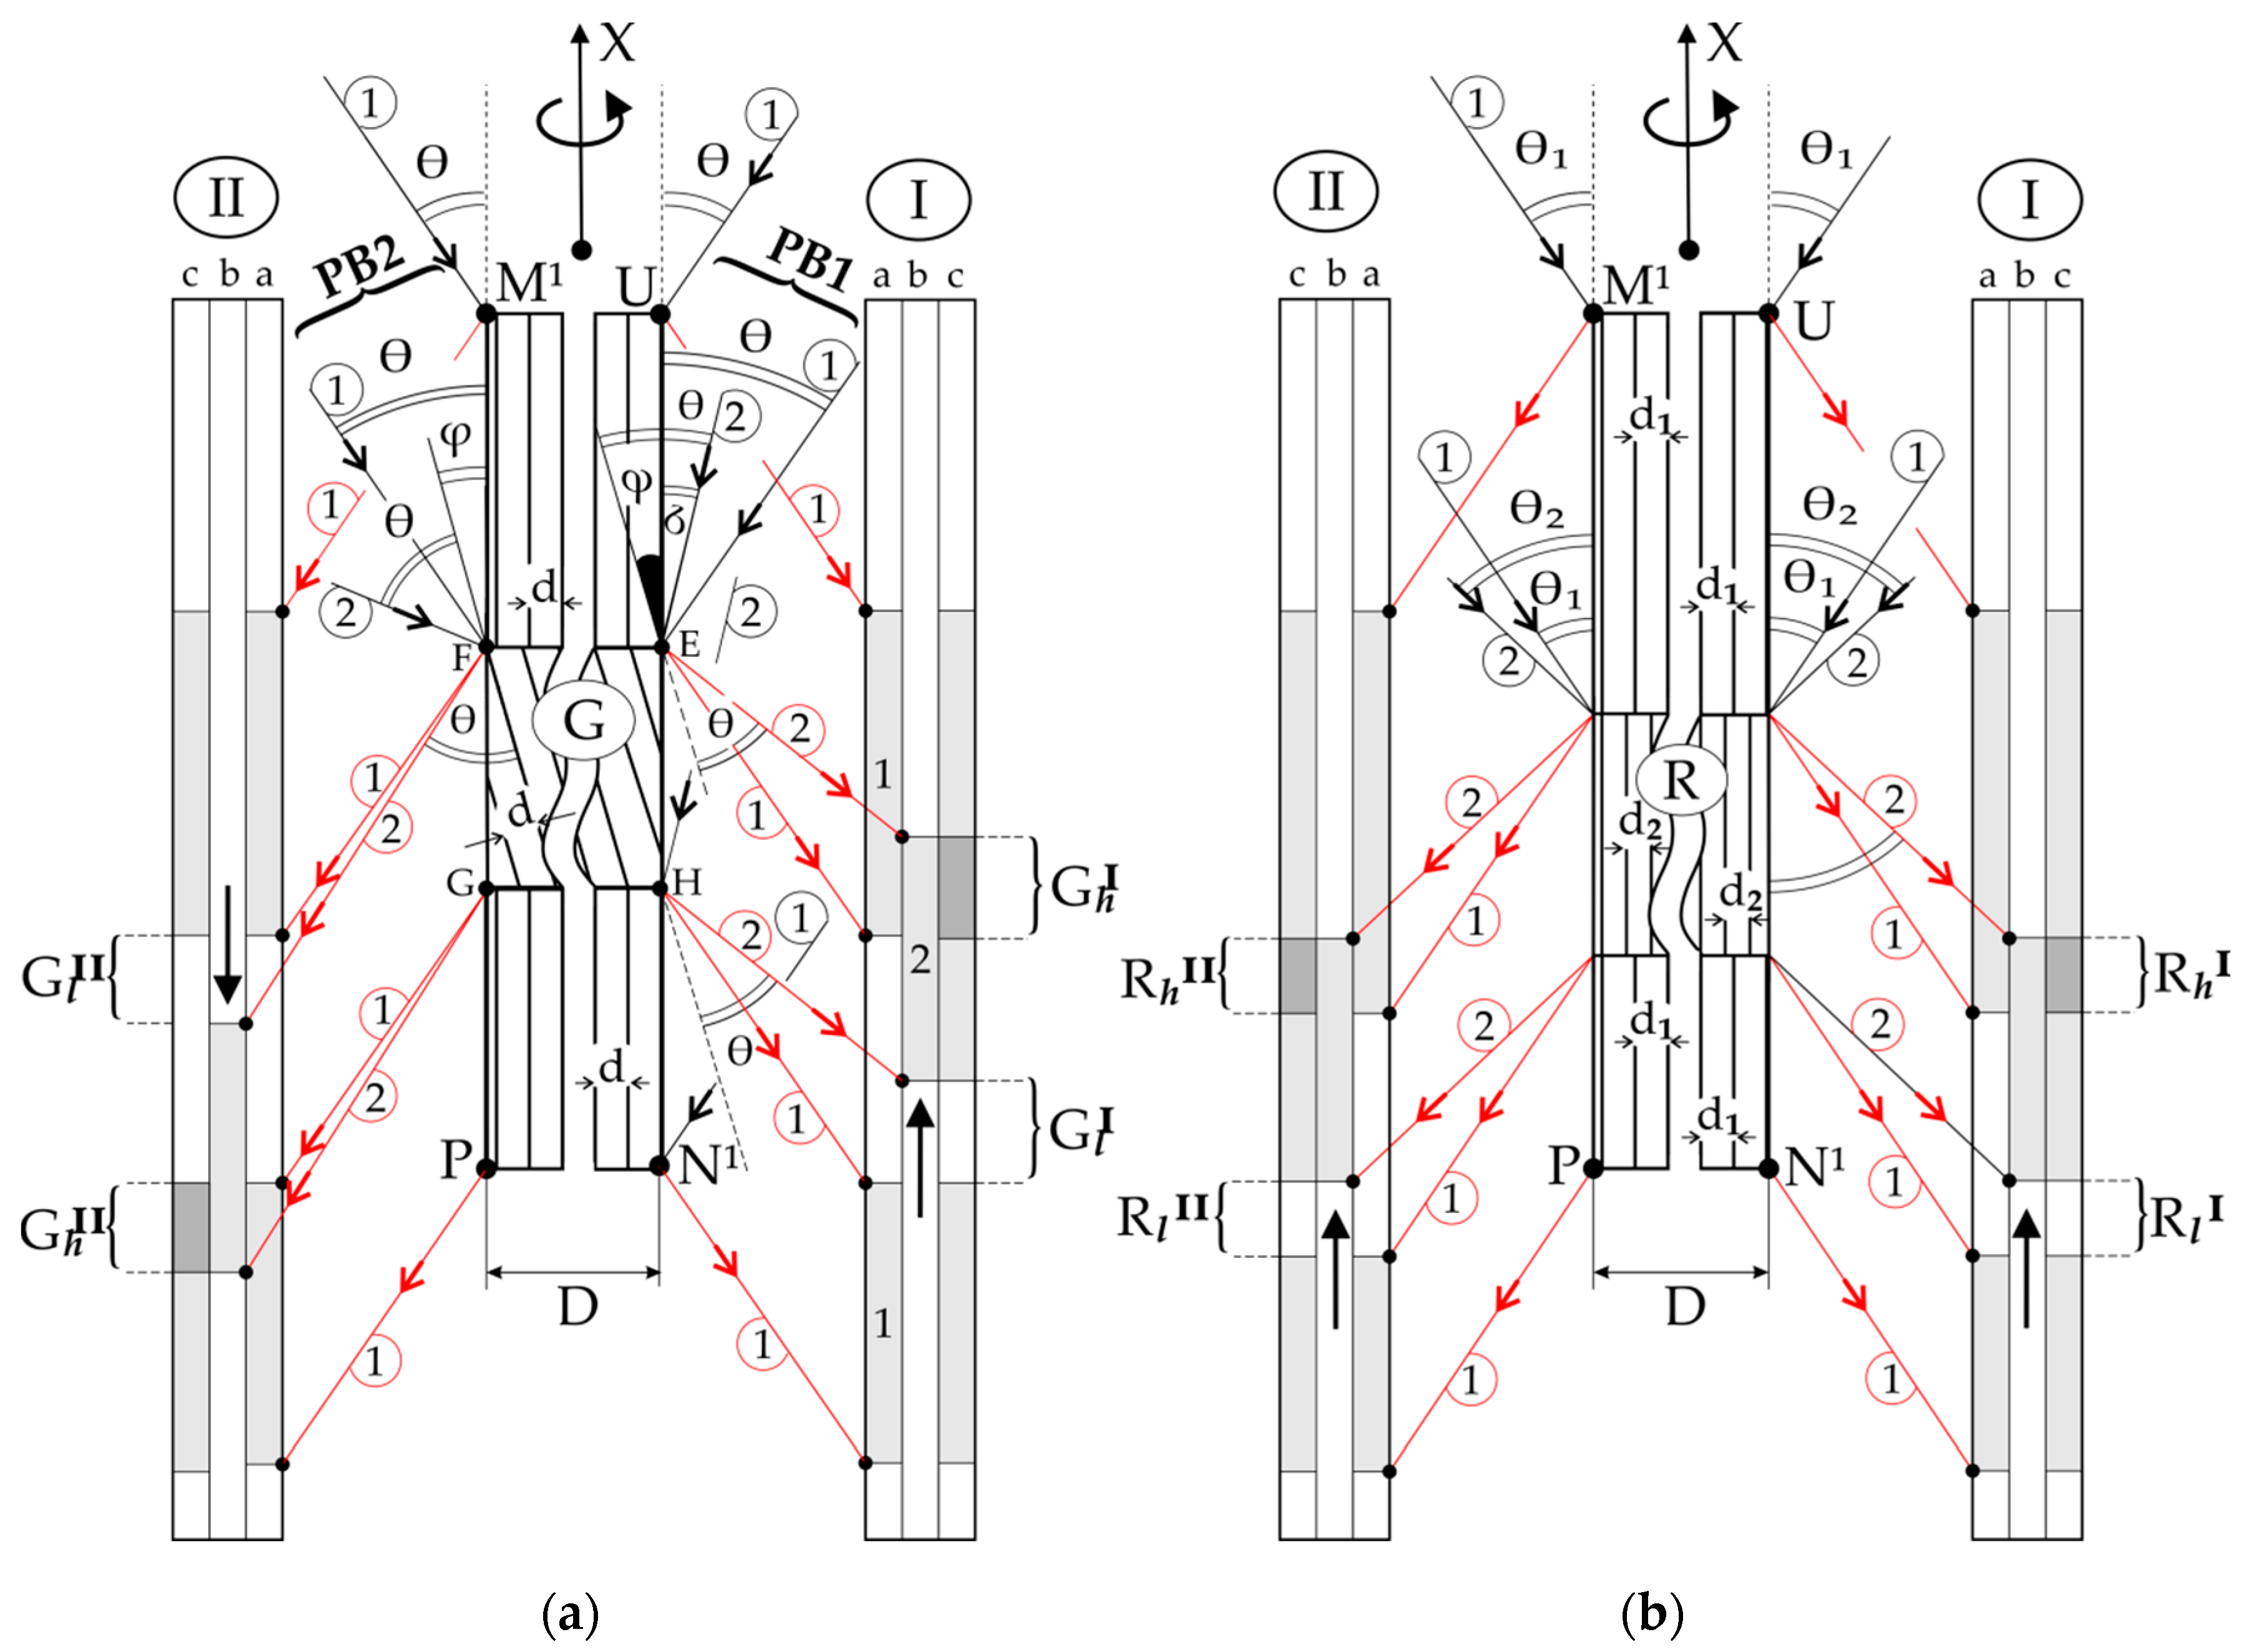
On the other hand, the images of part E of LAB1 (Figure 3a) and part S (Figure 4a) of LAB2 obtained from the surfaces S1 and S2 are related by contrast inversion. In other words, low-contrast areas have been converted to high-contrast areas. This effect corresponds to the scheme shown in Figure 2a. However, the disappearance of a part of the LABs image may be related to the interplanar spacing of crystal lattices. The mechanism of this phenomenon can be explained based on the topogram contrast creation scheme shown in Figure 5. In this figure, the diffraction planes of the GR area with a spacing d2 smaller than d1 are rotated according to the rest of the sample by a misorientation angle φ.
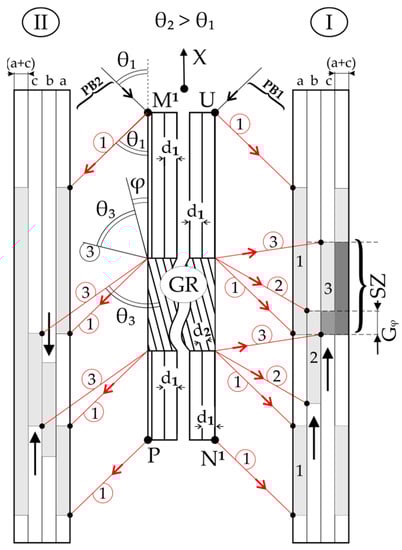
Figure 5.
Scheme of contrast creation on two surfaces of a lamellar sample, where the crystal planes of the GR area are rotated by the angle φ and the spacing of their diffraction planes d2 is smaller than in the rest of the sample. For clarity of the figure, only some primary beams are marked. φ angle is also enlarged to figure clarity.
Similar to the case described above in the Materials and Methods section (Figure 2 and its description), the deflection of fragment 1 of the primary beam PB1 from the surface of the GR area occurs at a different angle than the Bragg angle of the rest of the surface UN1. During the oscillation of the sample, for a certain range of oscillation angles, the Bragg condition is satisfied for the entire surface UN1, except for the fragment corresponding to the GR area of the sample. For this range of sample oscillation angles, on the hypothetical layer “a” of X-ray film, the increased contrast of the first parts is recorded. At a different range of the sample oscillation angles, a shift in the second part of hypothetical layer “b” is created. This part is related to the rotation of the diffraction plane by the angle φ. If d2 is equal to d1, then as a result of the overlap of layers 1 and 2, the area Gφ of increased contrast is created in the topogram (layer “c”). Additionally, considering condition d2 < d1, the Bragg angle θ3 of the GR area will be greater than θ1 of the remaining sample areas. This condition causes the additional upward shift of the third contrast part of the hypothetical layer “c”. The third contrast part of the hypothetical layer “c” will take the position determined by the shift due to the rotation of the crystal planes of the GR area by the angle φ and additionally by the shift related to the increase in the Bragg angle of the GR area. In this case, area SZ of increased contrast will appear in the topogram (Figure 5).
On the topogram obtained from the surface UN1 (S1), the contrast of the SZ area resulting from the overlapping the effect of crystal misorientation and the effect of lowering the value of d (d2 < d1) will be expanded and compared to the contrast Gφ as a result of crystal misorientation only. However, in the topogram from the S2 surface, the contrast may not occur at all due to shifts in contrast of the GR area in opposite directions. This case is illustrated in Figure 5 for set II and primary beam PB2. The downward shift of the contrast from GR on the hypothetical layer b is related to the rotation of the GR lattice by the angle φ. This shift can be completely compensated by an upward shift related to decreasing d and consequently increasing the Bragg angle to the value θ3. Then, on the real topogram, which is the sum of the images of the hypothetical layers “a” and “c”, there will be no GR contrast shifts at all. In this case, in the topogram from the surface S2 of the sample, the contrast from the LAB between GR and the rest of the sample is not created.
To verify that the disappearance of a part of the LAB image on the topograms from the S2 surface is related to the change in d, the lattice parameter aγ′ of the γ′-phase was measured for the sections a-b of two lines L1 and L2 passing through LAB1 (Figure 3a,e) and for two sections of the lines L3 and L4 passing through LAB2 (Figure 4a,e). It was assumed that the diffraction contrast on the topograms of the CMSX-4 superalloy blade roots was created by the γ′-phase because the share of this phase compared to the γ-phase is significantly higher (about 70% by volume).
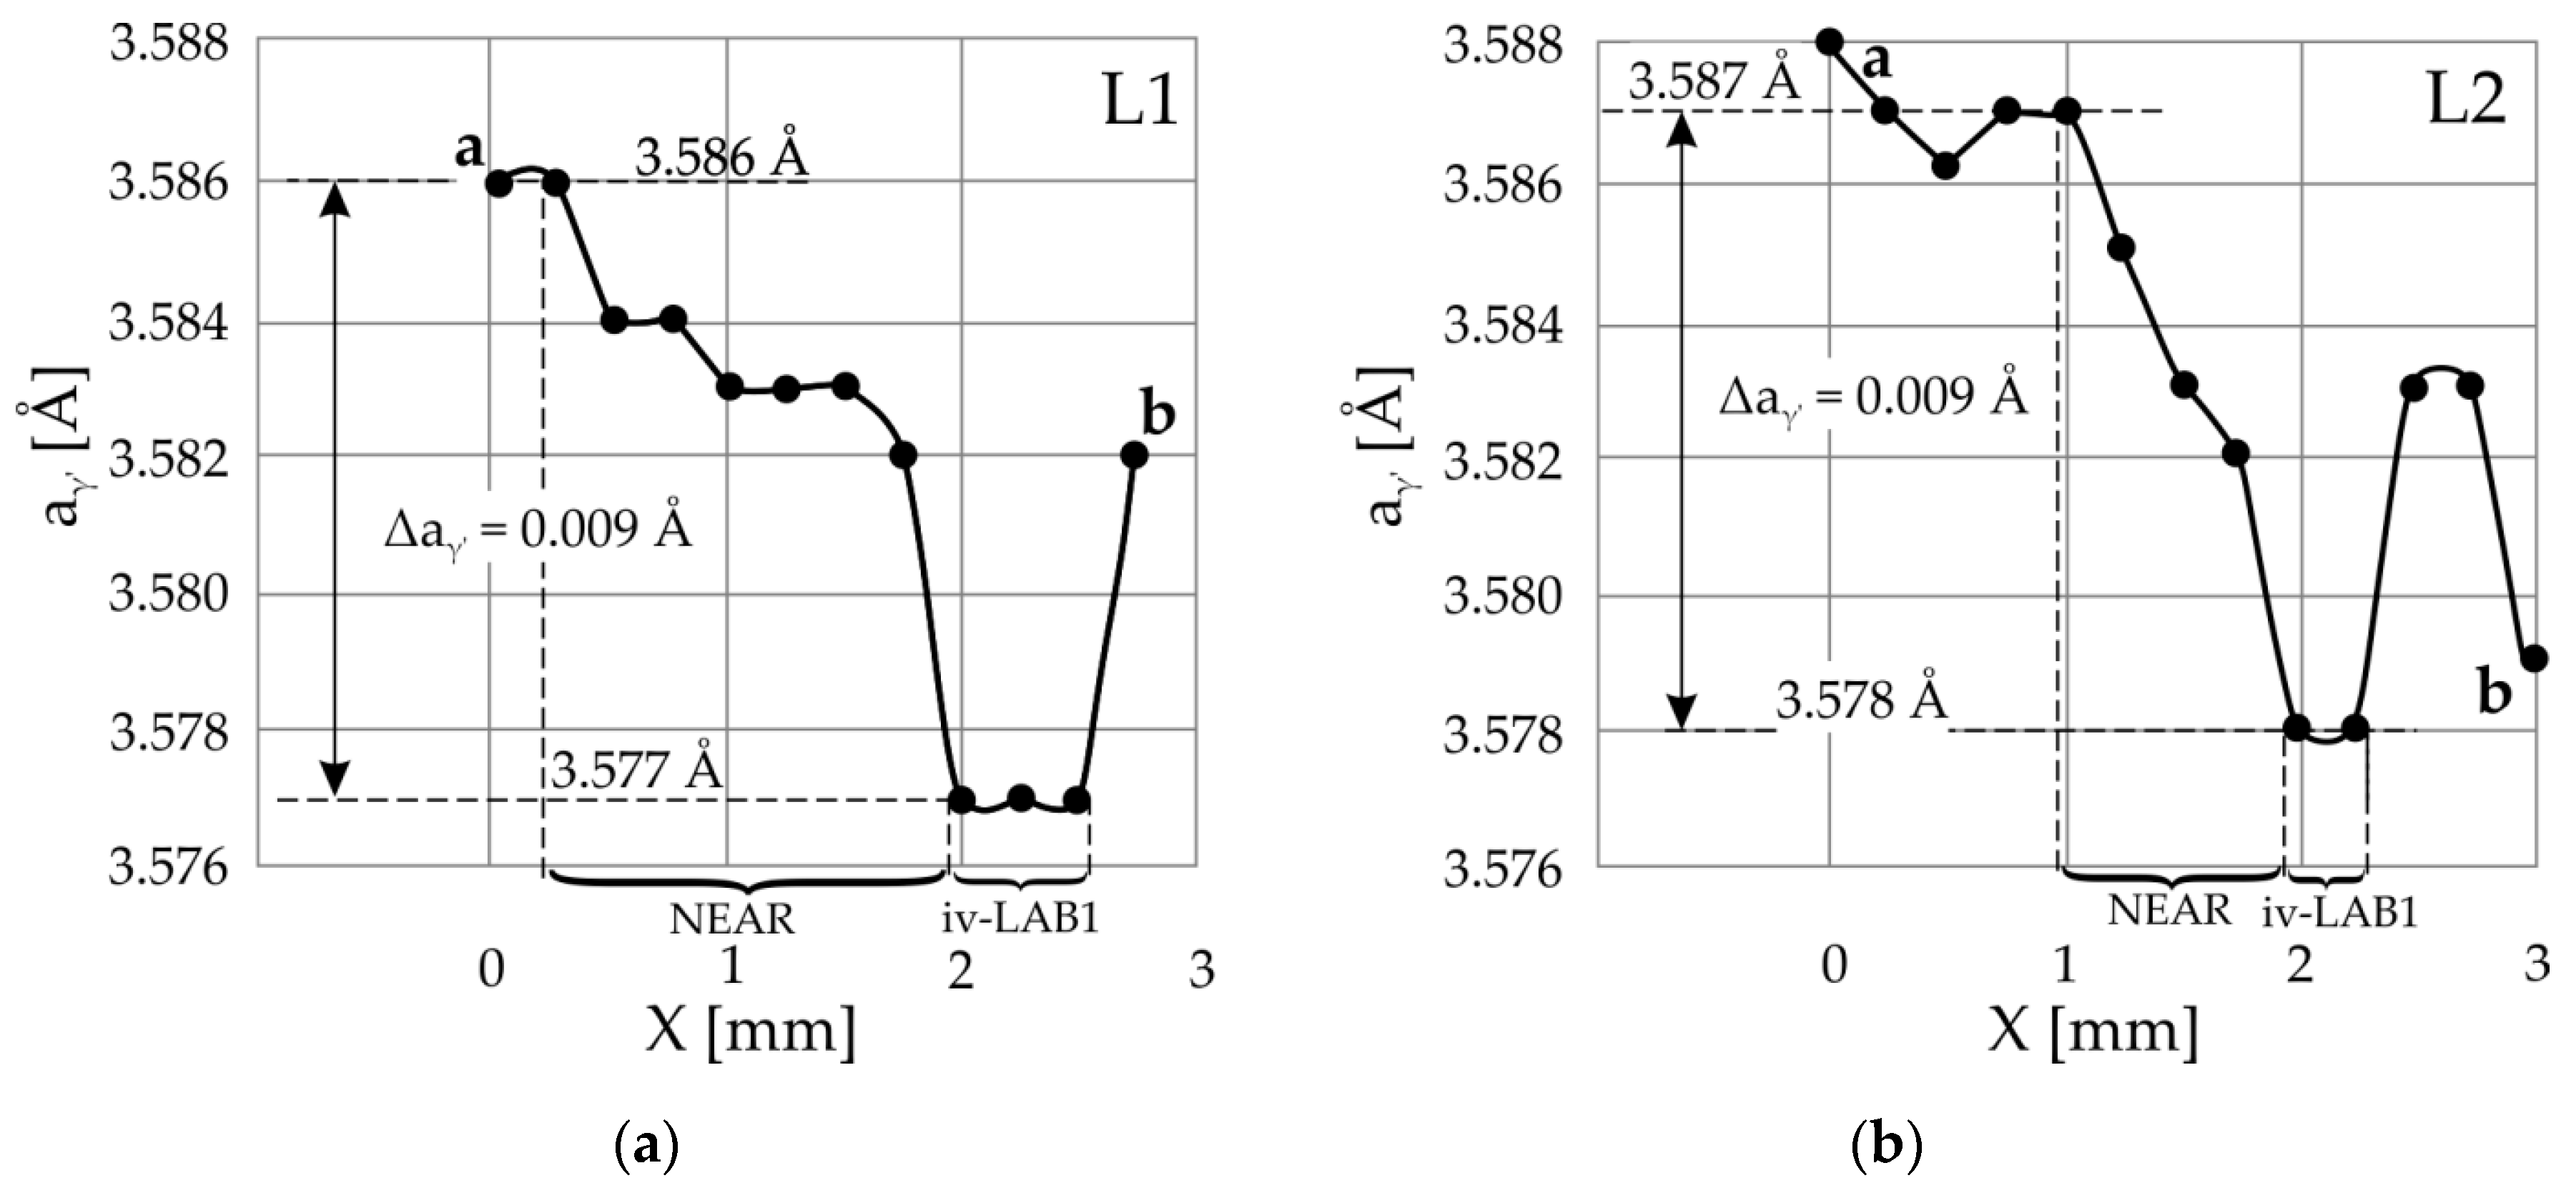
Figure 6a,b and Figure 7a,b shows the distribution of lattice parameter aγ′ along two lines L1 and L2, passing in the immediate vicinity of LAB1, and along two lines L3 and L4, passing in the immediate vicinity of LAB2. The graphs show that near LAB1, there is a significant decrease in aγ′ and hence a decrease in the interplanar spacing d.
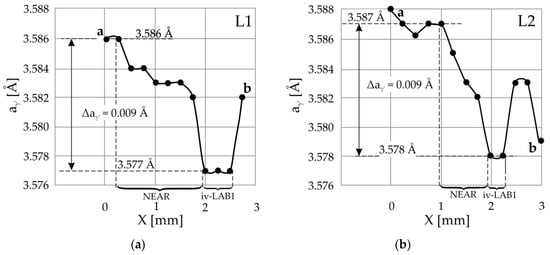
Figure 6.
Distribution of the lattice parameter aγ′ of the γ′-phase for Sections a-b along with Line L1 (a) and the line L2 (b) passing in the immediate vicinity of LAB1 (iv-LAB1). The arrangement of lines L1 and L2 is shown in Figure 3a,e.
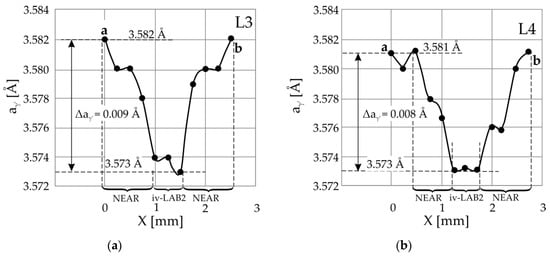
Figure 7.
Distribution of the lattice parameter aγ′ of the γ′-phase for the sections a-b along with the line L3 (a) and the line L4 (b) passing in the immediate vicinity of LAB2 (iv-LAB2). The arrangement of lines L3 and L4 is shown in Figure 4a,e.
For the L1 line in the immediate vicinity of the LAB1 boundary, the lattice parameter value is in the order of 3.577 Å and far from it, where the low-angle boundary is not clearly visible in the topogram is in the order of 3.586 Å. Near point a (Figure 6), the lattice parameter aγ′ changes stochastically around 3.586 Å. Therefore, the change in the lattice parameter aγ′ near the area iv-LAB1 region is 0.009 Å for all their characteristic points 1–6. The aγ′ values presented in Figure 6a,b on the right side of area iv-LAB1 correspond to the points located near the edge of the sample corresponding to the root’s surface. They can be disturbed by a change in the crystallisation conditions near the wall of the casting mould in contact with the areas located far from the root surfaces. Using the Bragg equation, it can be calculated that the change in the Bragg angle ∆θ for the 002 CuKα reflex corresponds to the change in the ∆d = 0.009 Å is 0.06°. Based on significant changes in the lattice parameter aγ′ in the immediate vicinity of LAB1, it can be concluded that the lattice of the γ′-phase is stressed. The disappearance of a part of the image of LAB1 on the topograms obtained from the surface S2 according to the scheme presented in Figure 5 can be explained by decreasing the shifts of contrast in topogram related to the reduction of the interplanar spacing d. The following calculations confirm this.
Calculated from the topogram on the surface S1, the misorientation angle α34 of the LAB1 area located near points 3 and 4 is 0.18°, whereas the α*78 corresponding to the same LAB1 area, calculated from the topogram of the S2 surface, is α*78 = 0.11°. The difference α34 − α*78 = 0.07° is very close to the value Δθ = 0.06° related to the change in the lattice parameter aγ′. It should be assumed that between the misorientation angles specified for the surfaces S1 and S2, there will be a relationship:
where α* is the misorientation angle defined from the topogram obtained from the surface S2, and α is the misorientation angle defined from the topogram obtained from the surface S1. Δθ is a change in the lattice parameter aγ′.
α* = α − Δθ,
For the value of α12 = 0.07° using Equation (1), it was found that the angle of misorientation calculated for the same LAB1 area using the topogram obtained from the S2 surface will be almost equal to “0” (0.07° − 0.06° = 0.01°). Therefore, the contrast of the LAB1 area near points 1 and 2 will not be visible on the topogram from the S2 surface.
Based on the graphs presented in Figure 7, the change in the Bragg angle related to the lattice parameter changes in the immediate vicinity of the LAB2 was also determined. The mean value of Δθ, in this case, is 0.06°. For the LAB2 area near points 9 and 10, the value of α9,10 is 0.08°. Therefore, the angle α*9,10, which would correspond to the topogram on the surface S2 according to Formula (1) α* = α − 0.06°, should be equal to: 0.08° − 0.06° = −0.02°. This value differs from zero, although fragment E of LAB2 is not visible on the topogram obtained from the S2 surface. This may be related to the location of points 9 and 10 close to the root’s surface, where the displacement of points 9 and 10 was influenced by the interaction of the root with the walls of the casting mould. Unfortunately, in the image of fragment E of LAB2, there are no other characteristic points apart from points 9 and 10. A comparison of the values of α11,12 (0.39°) with α*13,14 (0.32°) obtained for the same area of LAB2 shows that the difference (α11,12 − α13,14 = 0.07°) is very close to the value of the changing Bragg angle Δθ (equal 0.06°) related to the change in the interplanar spacing d.
The lattice parameter aγ′ changes in the immediate vicinity of the LABs shown in Figure 6 and Figure 7 have very distinctive features. In areas with a width of 0.5–1 mm, designated as iv-LAB1 and iv-LAB2, value aγ′ is almost constant and the smallest. However, near these areas, there are 1–1.5 mm wide “NEAR” areas. In these areas, the lattice parameter aγ′ decreases when approaching the LAB, which may be related to the casting stresses probably located in those. Additionally, they may be probably related to the change in the concentration of alloying elements or to dendrite bending near the LAB. According to Ref. [6], it may also be related to the formation of vacancy clusters in areas containing low-angle boundaries, which may be based on diffusion of vacancies to dislocations and the Kirkendall effect of alloying elements in γ-phase, which was described for nickel-based superalloys in Ref. [22]. In Ref. [23], it was additionally found that the width of the γ-phase channels varies in the range of 40–100 nm. In our paper [6], it was found that the LAB passes through the γ-phase and “writhes” between the cubes of the γ′-phase with a size of about 1 µm. However, in our present study, the width of the LAB is in the order of 1 mm, and the width of the “NEAR” regions is approximately 1–1.5 mm in total. This is probably related to the fact that the LAB “writhes” in the area between the arms of the dendrites at the primary arm spacing of the order of hundreds of µm and the adjacent dendrites “writhes” by deviating from each other by millimetres. This morphology of LABs confirms the serpentine strip of LAB1 in the topogram shown in Figure 3a.
4. Conclusions
(1) The X-ray diffraction topography method used for the first time on two surfaces of thin lamellar samples coupled with the lattice parameter measurements near the LAB may allow separating the misorientation component of diffraction contrast from the component that arises as a result of lattice parameter changes. The last component of topography contrast allows the creation of a stress distribution map of single-crystalline blades made of superalloys in the aerospace industry. This, in turn, will allow identifying the areas of possible delamination of the protective layers applied to the blades.
(2) For the first time, it was found that there are two areas of the decreased lattice parameter of the γ′-phase, as follows:
- In the immediate vicinity of the low-angle boundaries, the lattice parameter aγ′ in the area about 0.5–1.0 mm wide is lowered by 0.008–0.009 Å in relation to areas distant from the LAB.
- Additionally, near the low-angle boundaries, there are 1–1.5 mm wide areas (“NEAR” areas) in which lattice parameter aγ′ decreases when approaching the LAB. Based on local changes of the lattice parameter, it can be concluded that the internal stress might be located in these areas. They may be related to the change in the concentration of alloying elements or/and dendrite bending.
Author Contributions
Conceptualisation, W.B. and R.P.; methodology, R.P; software, R.P.; investigation, R.P.; data curation, W.B. and R.P.; writing—original draft preparation, W.B. and R.P.; writing—review and editing, W.B. and R.P.; visualisation, R.P.; supervision, D.S.; project administration, D.S.; funding acquisition, R.P. All authors have read and agreed to the published version of the manuscript.
Funding
The APC was funded by the Research Excellence Initiative of the University of Silesia in Katowice.
Institutional Review Board Statement
Not applicable.
Informed Consent Statement
Not applicable.
Data Availability Statement
Data sharing is not applicable to this article.
Conflicts of Interest
The authors declare no conflict of interest.
Appendix A
An example of calculating misorientation angle for points 5 and 6.
Based on the topogram presented in Figure A1 (simplified topogram of Figure 3a), the components αx and αz of misorientation angle for LAB1 were calculated using Formulas (A1) and (A2) [10]:
where S║ equal to 0.51 mm and S┴ equal to 1.04 mm are the shifts along the X and Z axes measured in the topogram, θ002 is the Bragg angle equal to 25°, and R is the sample film distance equal to 100 mm. The total misorientation angle for LAB1 was calculated based on Formula (A3):
where αx and αz are equal to 0.35° and 0.25°, respectively. The calculated value of α for LAB1 was 0.43°. The misorientation angles for the remaining points visible in Figure 3 and Figure 4 were calculated similarly.
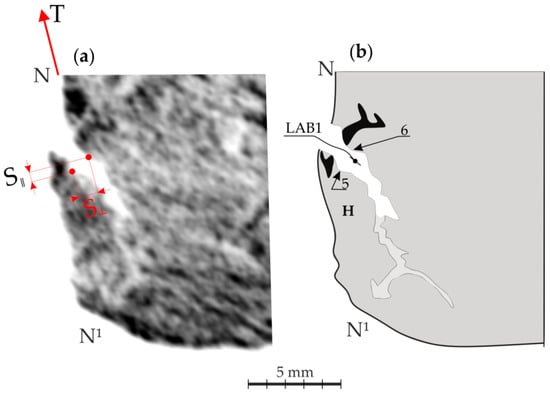
Figure A1.
Exemplary X-ray topogram with marked for calculations components S┴ and S║ (a) and its scheme with marked points 5 and 6 (b). S║—displacement in the direction of oscillation axis T, and S┴—displacement along axis X perpendicular to T.
Figure A1.
Exemplary X-ray topogram with marked for calculations components S┴ and S║ (a) and its scheme with marked points 5 and 6 (b). S║—displacement in the direction of oscillation axis T, and S┴—displacement along axis X perpendicular to T.
References
- Reed, R. The Superalloys, Fundamentals and Applications; Cambridge University Press: Cambridge, UK, 2006. [Google Scholar]
- Newell, M.; Devendra, K.; Jennings, P.A.; D’Souza, N. Role of dendrite branching and growth kinetics in the formation of low angle boundaries in Ni–base superalloys. Mat. Sci. Eng. A 2005, 412, 307–315. [Google Scholar] [CrossRef]
- Bogdanowicz, W.; Krawczyk, J.; Paszkowski, R.; Sieniawski, J. Variation of crystal orientation and dendrite array generated in the root of SX turbine blades. Materials 2019, 12, 4126. [Google Scholar] [CrossRef] [PubMed] [Green Version]
- Körner, C.; Ramsperger, M.; Meid, C.; Bürger, D.; Wollgramm, P.; Bartsch, M.; Eggeler, G. Microstructure and Mechanical Properties of CMSX-4 Single Crystals Prepared by Additive Manufacturing. Metall. Mater. Trans. A 2018, 49, 3781–3792. [Google Scholar] [CrossRef] [Green Version]
- D’Souza, N.; Kelleher, J.; Qiu, C.; Zhang, S.Y.; Gardner, S.; Jones, R.E.; Putman, D.; Panwisawas, C. The role of stress relaxation and creep during high temperature deformation in Ni-base single crystal superalloys—Implications to strain build-up during directional solidification. Acta Mater. 2016, 106, 322–332. [Google Scholar] [CrossRef] [Green Version]
- Krawczyk, J.; Paszkowski, R.; Bogdanowicz, W.; Hanc-Kuczkowska, A.; Sieniawski, J.; Terlecki, B. Defect creation in the root of single-crystalline turbine blades made of Ni-based superalloy. Materials 2019, 12, 870. [Google Scholar] [CrossRef] [Green Version]
- Krawczyk, J.; Bogdanowicz, W.; Hanc-Kuczkowska, A.; Tondos, A.; Sieniawski, J. Influence of heat treatment on defect structures in single-crystalline blade roots studied by X-ray topography and positron annihilation lifetime spectroscopy. Met. Mater. Trans. A 2018, 49, 4353–4361. [Google Scholar] [CrossRef] [Green Version]
- Tamarin, Y.; Low, H. Thermal Fatigue of Protective Coatings on CMSX-4 Superalloy. Mater. Sci. Forum 2001, 369–372, 647–654. [Google Scholar] [CrossRef]
- Paszkowski, R.; Krawczyk, J.; Bogdanowicz, W.; Szeliga, D.; Sieniawski, J. Heterogeneity of the Dendrite Array Created in the Root of Cored SX Turbine Blades during Initial Stage of Crystallization. Materials 2021, 14, 80. [Google Scholar] [CrossRef] [PubMed]
- Bogdanowicz, W. Martensitic transformations in β1-CuZnAl single crystals studied by X-ray topography method. Scr. Mater. 1997, 37, 829–835. [Google Scholar] [CrossRef]
- Bogdanowicz, W.; Albrecht, R.; Sieniawski, J.; Kubiak, K. The subgrain structure in turbine blade roots of CMSX-4 superalloy. J. Cryst. Growth 2014, 401, 418–422. [Google Scholar] [CrossRef]
- Aveson, J.W.; Reinhart, G.; Goddard, C.J.L.; Nguyen-Thi, H.; Mangelinck-Noël, N.; Tandjaoui, A.; Davenport, J.R. On the Deformation of Dendrites During Directional Solidification of a Nickel-Based Superalloy. Metall. Mater. Trans. A 2019, 50, 5234–5241. [Google Scholar] [CrossRef] [Green Version]
- Hallensleben, P.; Scholz, F.; Thome, P.; Schaar, H.; Steinbach, I.; Eggeler, G.; Frenzel, J. On Crystal Mosaicity in Single Crystal Ni-Based Superalloys. Crystals 2019, 9, 149. [Google Scholar] [CrossRef] [Green Version]
- Zhou, Z.; Huang, L.; Shang, Y.; Li, Y.; Jiang, L.; Lei, Q. Causes analysis on cracks in nickel-based single crystal superalloy fabricated by laser powder deposition additive manufacturing. Mater. Des. 2018, 160, 1238–1249. [Google Scholar] [CrossRef]
- Huo, M.; Liu, L.; Yang, W.; Li, Y.; Hu, S.; Su, H.; Fu, H. Formation of low-angle grain boundaries under different solidification conditions in the rejoined platforms of Ni-based single crystal superalloys. J. Mater. Res. 2018, 34, 1–10. [Google Scholar] [CrossRef]
- Cheng, K.; Jo, C.Y.; Kim, D.H.; Jin, T.; Hu, Z. Influence of local chemical segregation on the γ′ directional coarsening behavior in single crystal superalloy CMSX-4. Mater. Charact. 2009, 60, 210–218. [Google Scholar] [CrossRef]
- Warnken, N. Studies on the Solidification Path of Single Crystal Superalloys. J. Phase Equilib. Diffus. 2016, 37, 100–107. [Google Scholar] [CrossRef] [Green Version]
- Krawczyk, J.; Bogdanowicz, W.; Sieniawski, J. The Number of Subgrain Boundaries in the Airfoils of Heat-Treated Single-Crystalline Turbine Blades. Materials 2021, 14, 8. [Google Scholar] [CrossRef]
- Hans, B.; Hans-Arthur, B.; Hans, B. Omega-Scan: An X-ray tool for the characterisation of crystal properties. J. Mater. Sci. Mater. Electron. 2008, 19, 351–355. [Google Scholar]
- Zipperian, D.C. Metallographic Handbook; Chief Technical Officier PACE Technologies: Tucson, AR, USA, 2011. [Google Scholar]
- Bogdanowicz, W.; Krawczyk, J.; Paszkowski, R.; Sieniawski, J. Primary crystal orientation of the thin-walled area of single-crystalline turbine blade airfoils. Materials 2019, 12, 2699. [Google Scholar] [CrossRef] [Green Version]
- Epishin, A.I.; Link, T.; Noltze, G.; Svetlov, I.L.; Bokshtein, B.S.; Rodin, A.O.; Salivan-Neumann, R.; Oder, G. Diffusion processes in multicomponent nickel-base superalloy-nickel system. Phys. Met. Metallogr. 2014, 115, 21–29. [Google Scholar] [CrossRef]
- Parsa, A.B.; Wollgramm, P.; Buck, H.; Somsen, C.; Kostka, A.; Povstugar, I.; Choi, P.-P.; Raabe, D.; Dlouhy, A.; Müller, J.; et al. Advanced Scale Bridging Microstructure Analysis of Single Crystal Ni-Base Superalloys. Adv. Eng. Mater. 2015, 17, 216–230. [Google Scholar] [CrossRef]

Publisher’s Note: MDPI stays neutral with regard to jurisdictional claims in published maps and institutional affiliations. |
© 2021 by the authors. Licensee MDPI, Basel, Switzerland. This article is an open access article distributed under the terms and conditions of the Creative Commons Attribution (CC BY) license (https://creativecommons.org/licenses/by/4.0/).