
Micromagnetic Microstructure- and Stress-Independent Materials Characterization in Reactor Safety Research

Abstract
:1. Introduction
2. Materials and Methods
2.1. Materials
2.2. Influences
2.2.1. Plastic Deformation
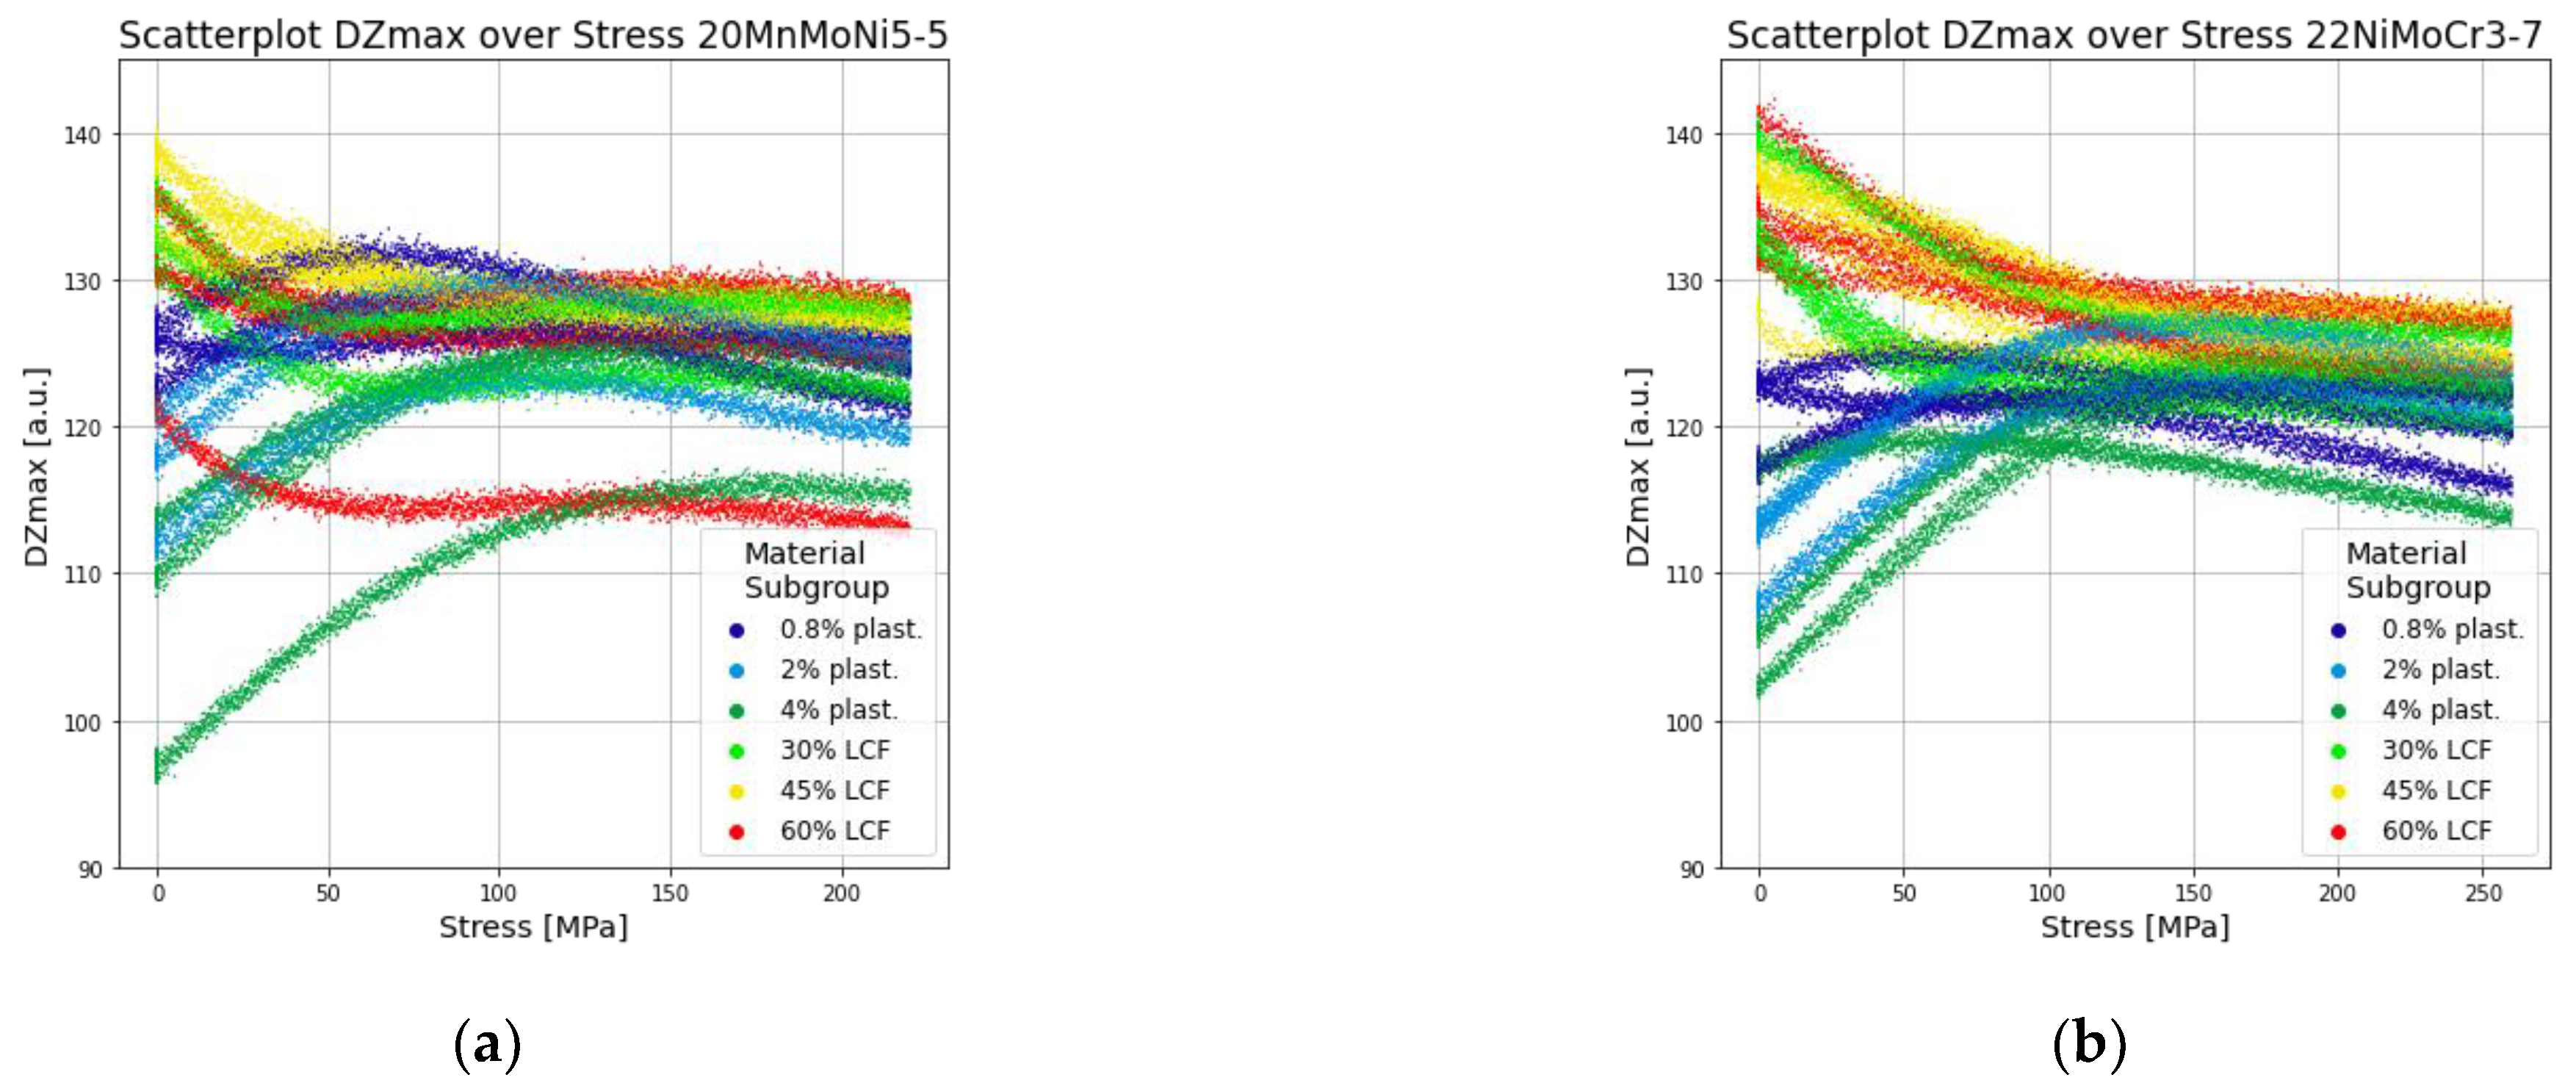
2.2.2. Elastic Stresses
2.3. Feature Engineering
2.3.1. Subjective Feature Extraction
2.3.2. Automated Feature Extraction
2.3.3. Signals as Features
2.4. Machine Learning Methods
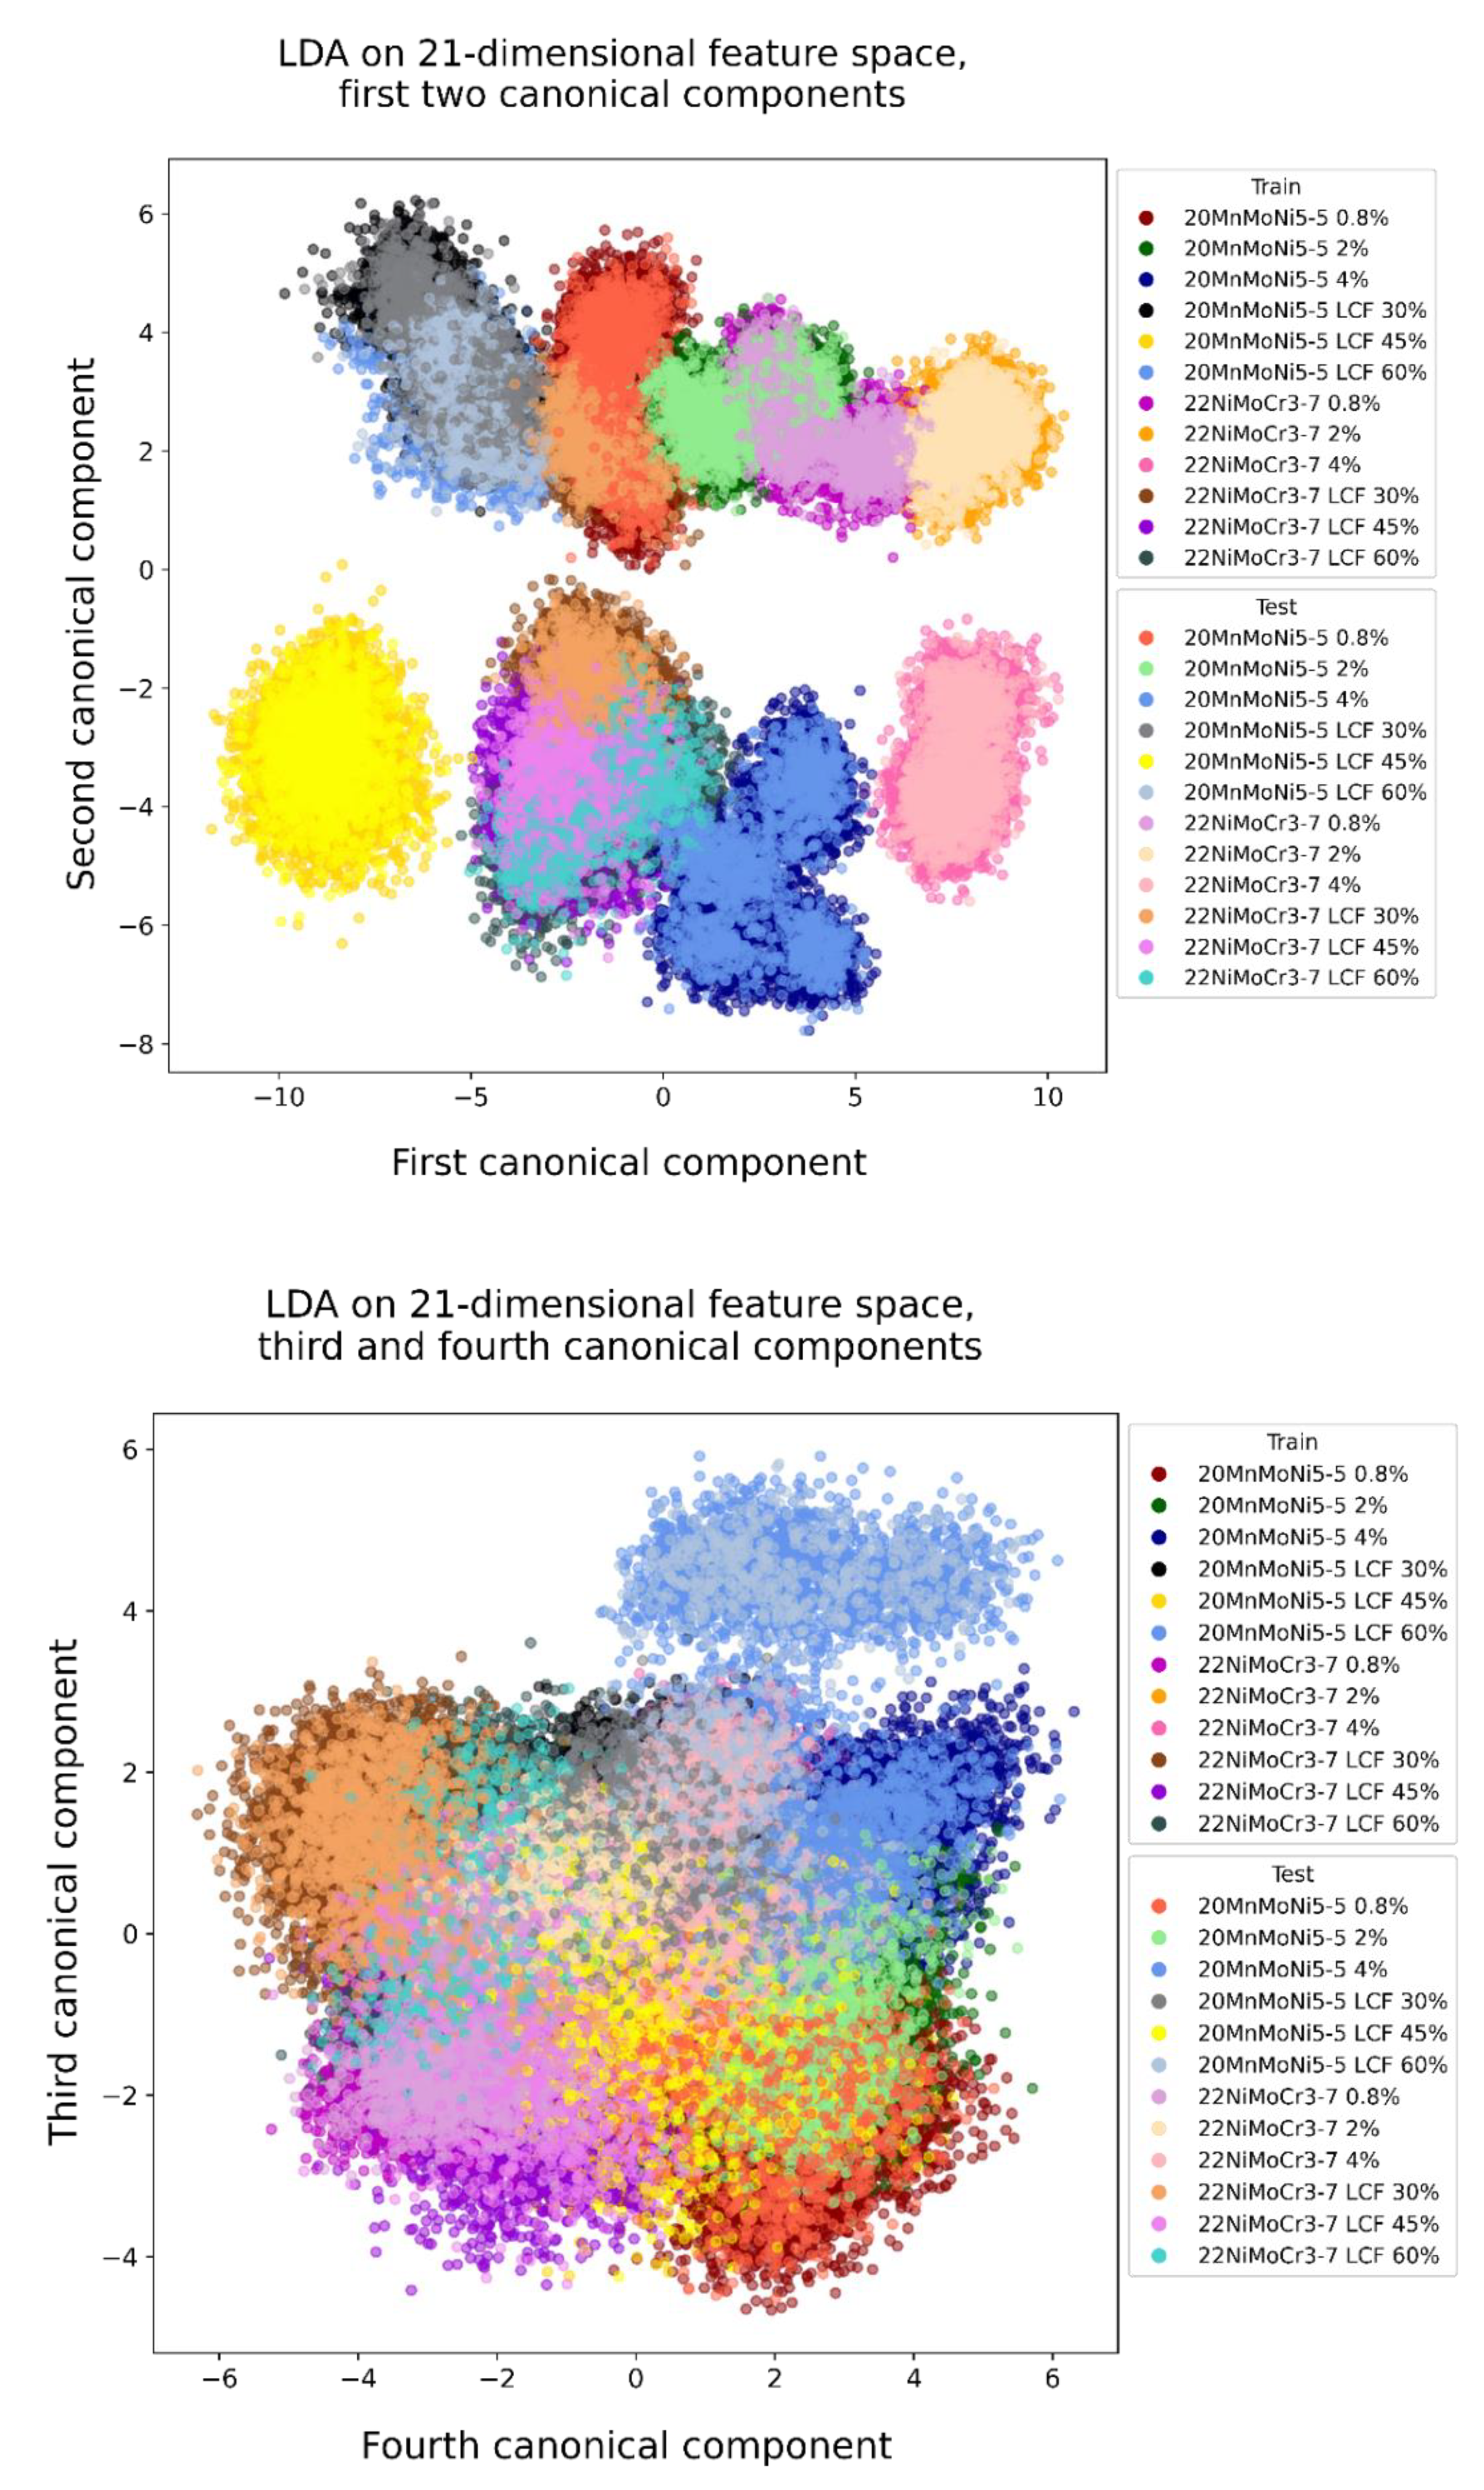
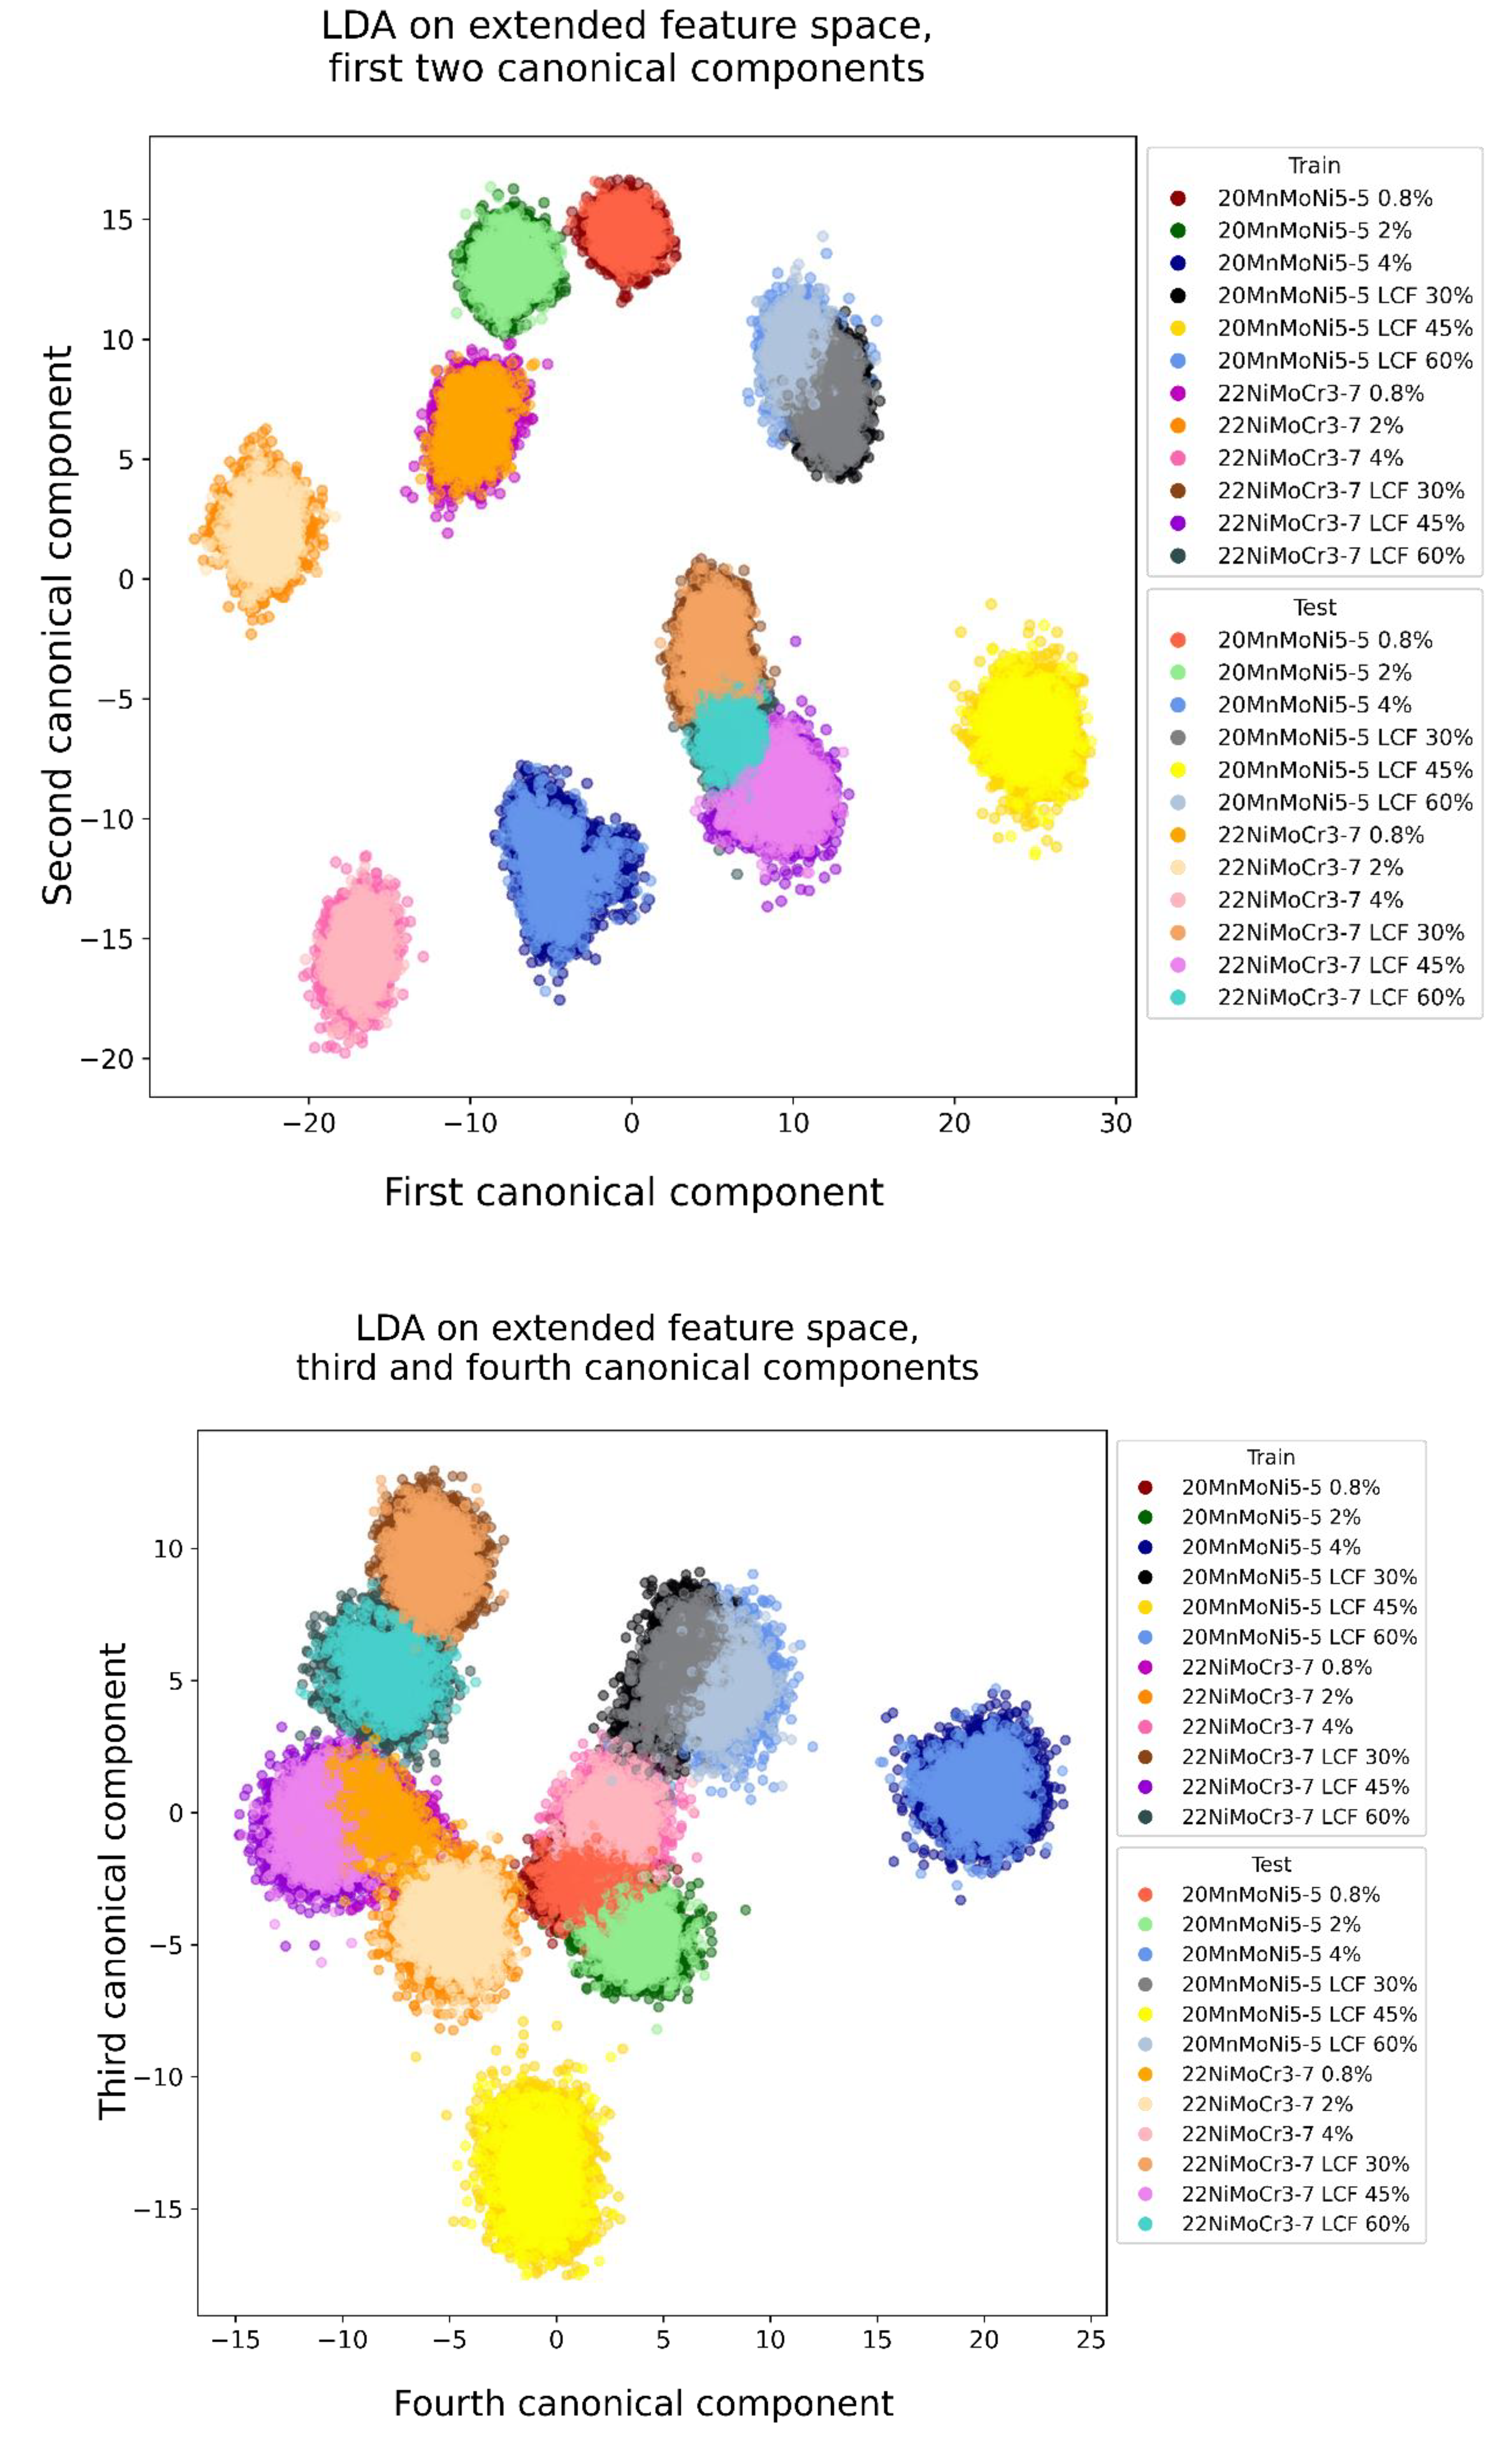
2.4.1. LDA
2.4.2. KNN-Classifier
3. Results
3.1. Preliminary Examinations
3.2. Stress-Independent Microstructure Characterization
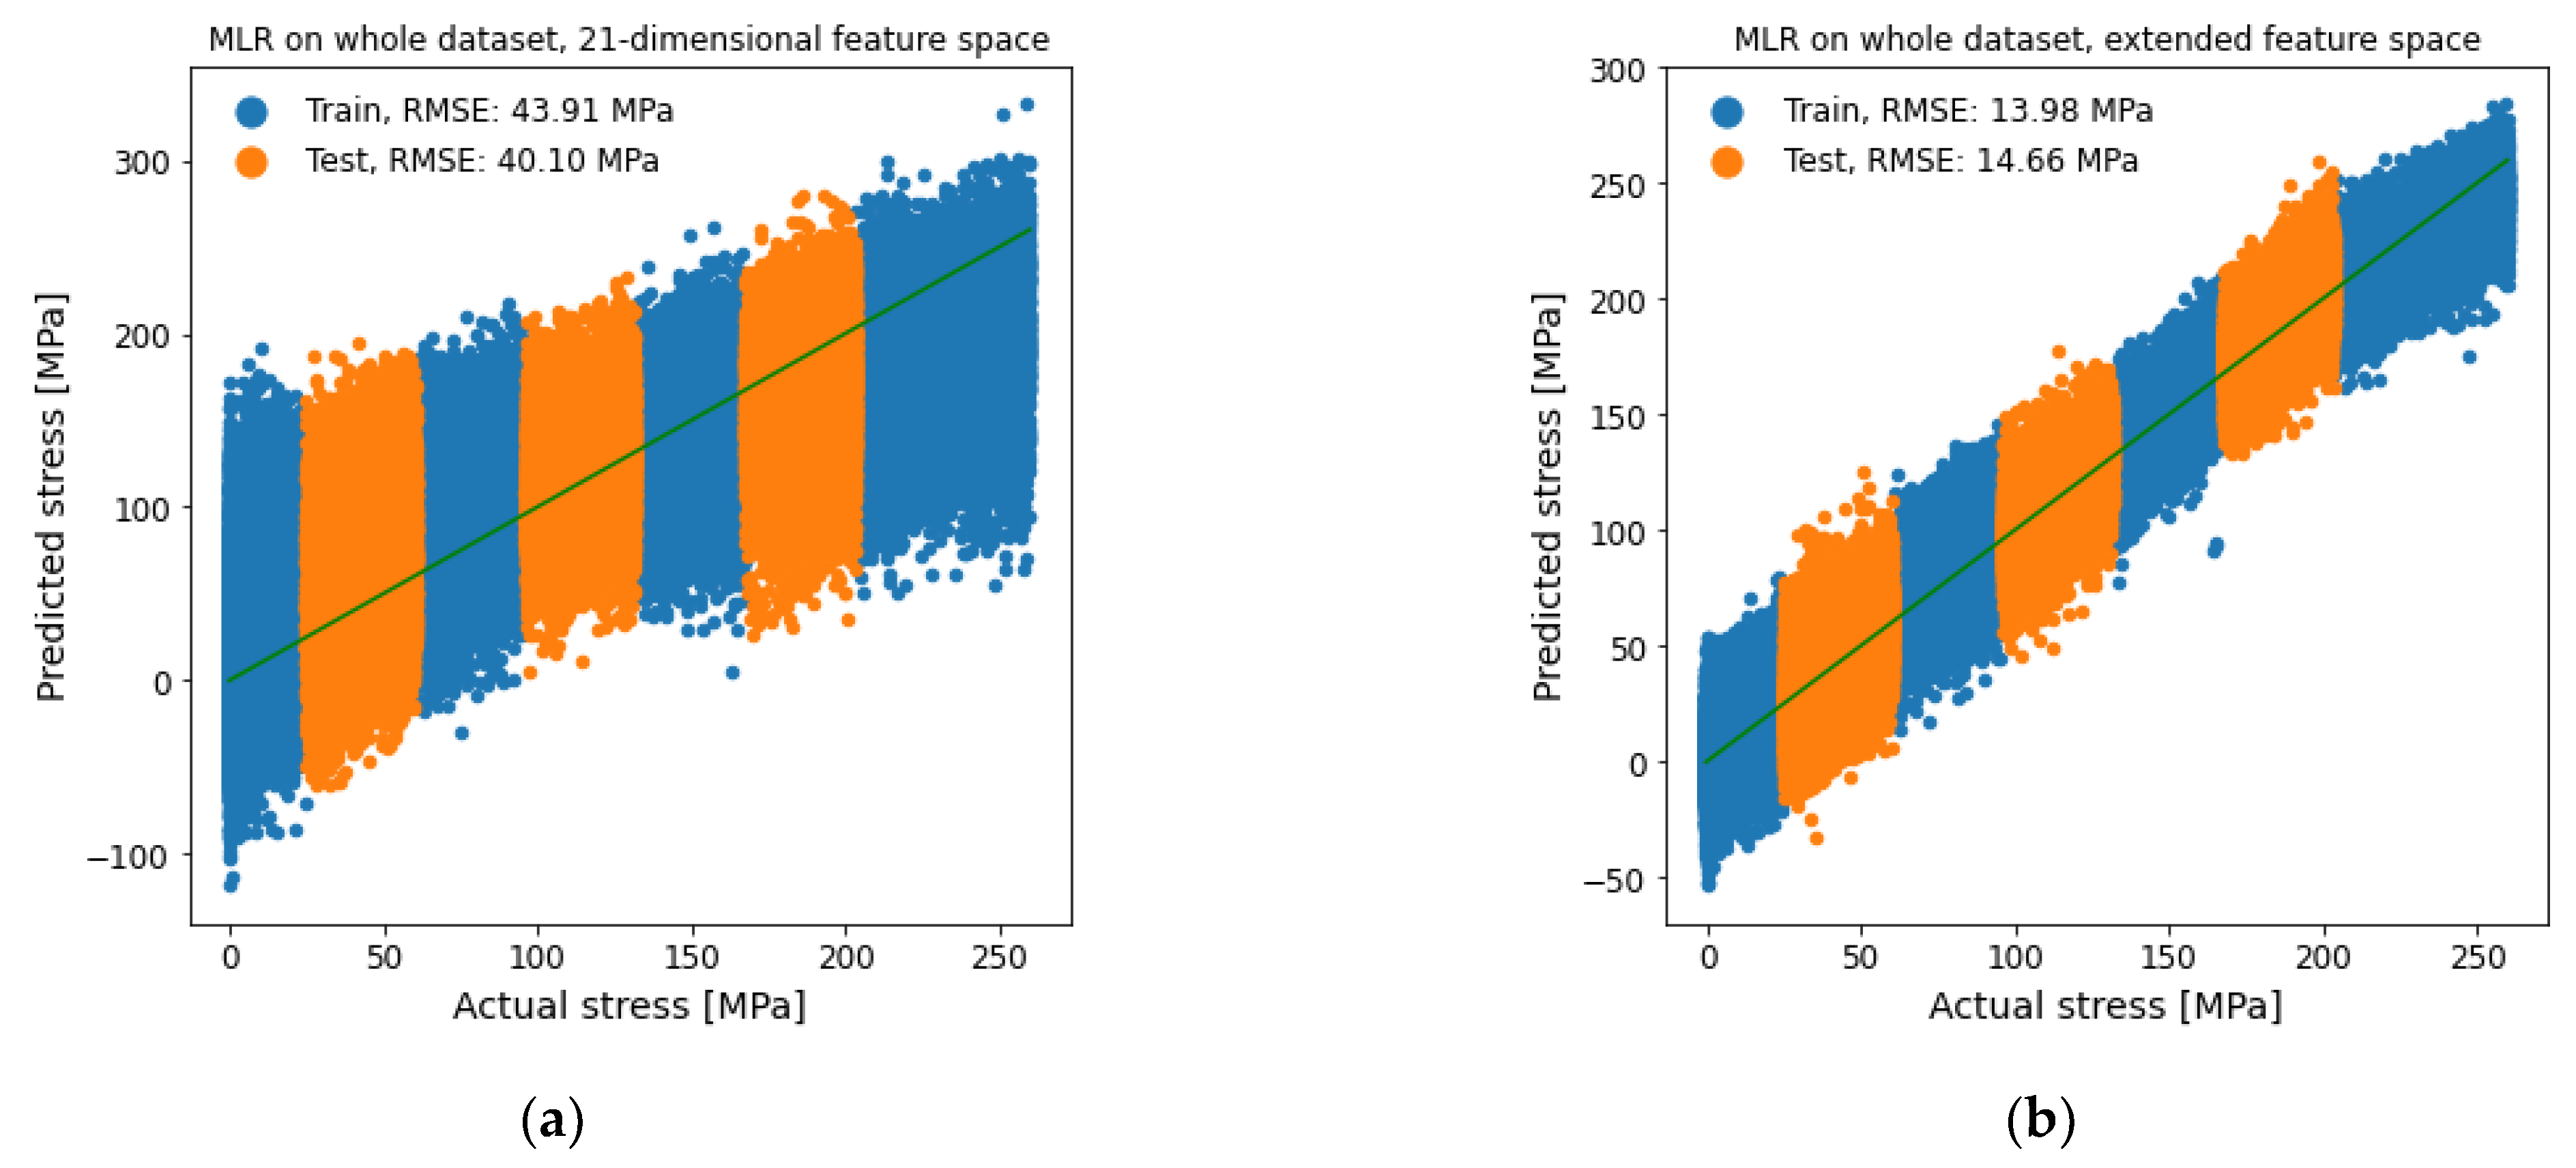
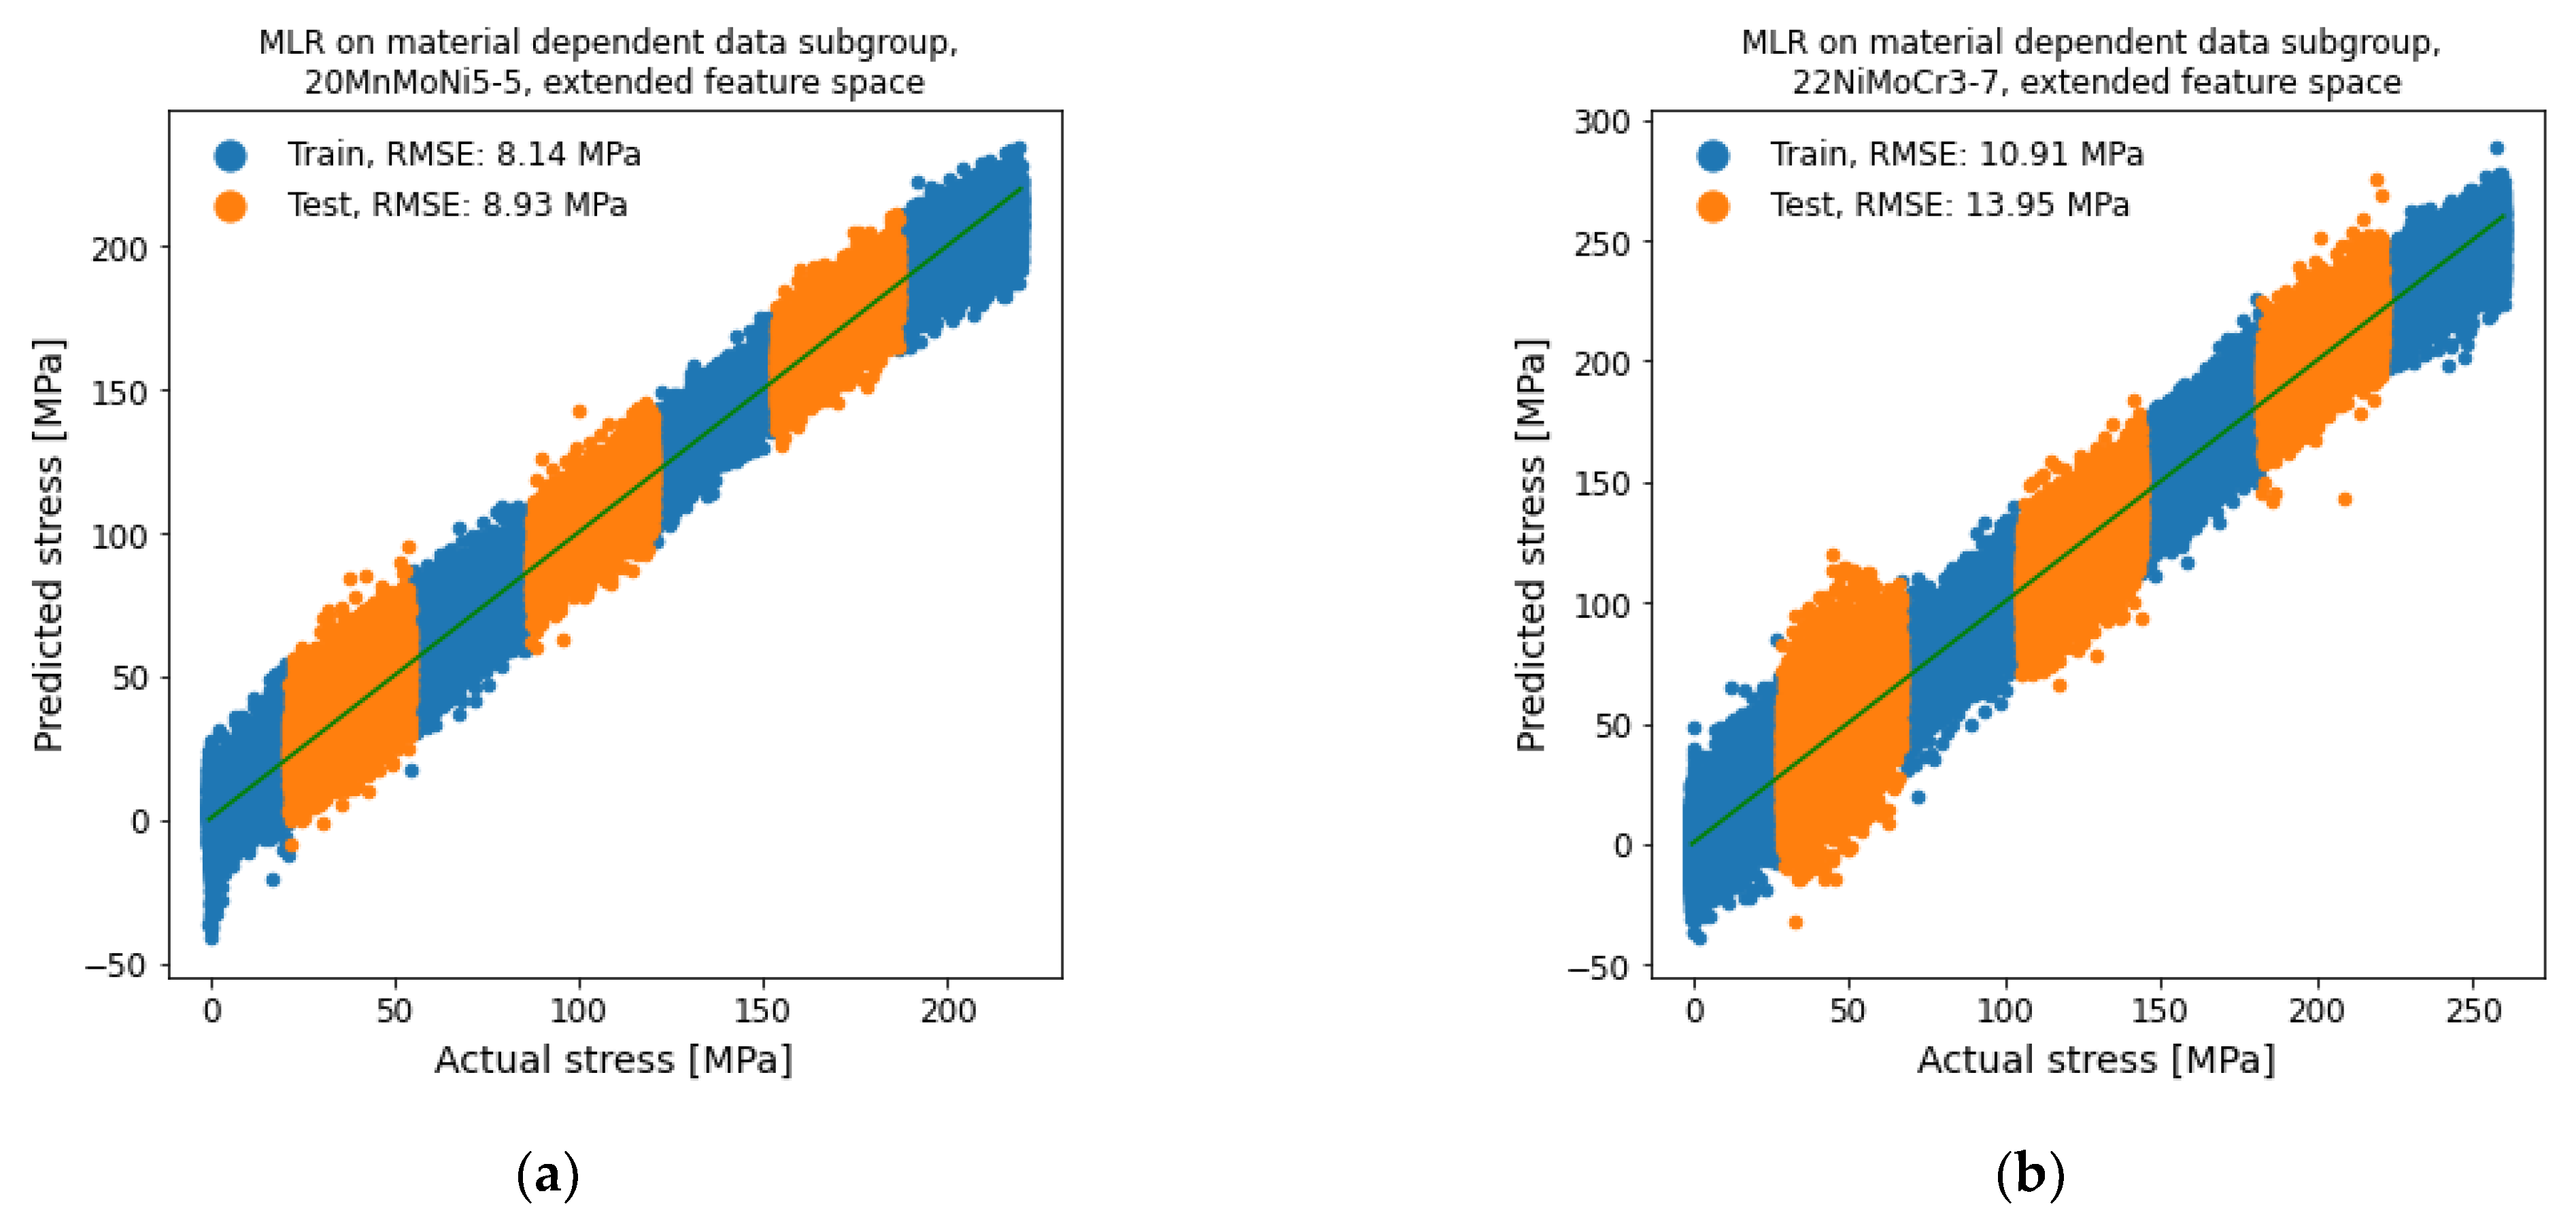
3.3. Microstructure-Independent Stress Determination
4. Discussion
Author Contributions
Funding
Institutional Review Board Statement
Informed Consent Statement
Data Availability Statement
Acknowledgments
Conflicts of Interest
References
- Dobmann, G. NDE for material characterisation of ageing due to thermal embrittlement, fatigue and neutron degradation. IJMPT 2006, 26, 122–139. [Google Scholar] [CrossRef]
- Altpeter, I.; Dobmann, G.; Szielasko, K. Detection of copper precipitates in 15 NiCuMoNb5 (WB 36) steel by using micromagnetic NDE techniques. In Proceedings of the 3rd International Conference on NDE in Relation to Structural Integrity for Nuclear and Pressurised Components, Sevilla, Spain, 14–16 October 2001. [Google Scholar]
- Altpeter, I.; Dobmann, G.; Hübschen, G.; Kopp, M.; Tschuncky, R. Nondestructive characterization of neutron induced embrittlement in nuclear pressure vessel steel microstructure by using electromagnetic testing. In Proceedings of the 8th International Conference on NDE in Relation to Structural Integrity for Nuclear and Pressurized Components, Berlin, Germany, 29 October–1 November 2010. [Google Scholar]
- Rabung, M.; Kopp, M.; Gasparics, A.; Vértesy, G.; Szenthe, I.; Uytdenhouwen, I.; Szielasko, K. Micromagnetic characterization of operation-induced damage in charpy specimens of RPV steels. Appl. Sci. 2021, 11, 2917. [Google Scholar] [CrossRef]
- Rabung, M.; Amiri, M.; Becker, M.M.; Kopp, M.; Tschuncky, R.; Veile, I.; Weber, F.; Weikert-Müller, M.; Szielasko, K. nondestructive characterization of Residual Stresses Using Micromagnetic and Ultrasonic Techniques. In New Challenges in Residual Stress Measurements and Evaluation; Casavola, C., Ed.; IntechOpen: London, UK, 2020. [Google Scholar]
- Dobmann, G.; Boller, C.; Herrmann, H.G.; Altpeter, I. Electromagnetic NDT for lifetime management by monitoring of ageingphenomena. In Proceedings of the 12th International Conference of the Slovenian Society for NDT, Portorož, Slovenia, 4–6 September 2013. [Google Scholar]
- Youssef, S.; Amiri, M.; Ballman, H.; Molenda, D.; Tschuncky, R.; Youssef, A. Detection of hard spots and other material inhomogeneities on steel plates. In Proceedings of the 12th ECNDT, Gothenburg, Sweden, 15 June 2018. [Google Scholar]
- Kurz, J.H.; Szielasko, K.; Tschuncky, R. Non-destructive stress determination of steel elements in pre-stressed constructions using micromagnetic and ultrasound methods. In Proceedings of the NDTCE, Berlin, Germany, 15–17 September 2015. [Google Scholar]
- Cullity, B.D.; Graham, B. Introduction to Magnetic Materials, 2nd ed.; Wiley: Hoboken, NJ, USA, 2008. [Google Scholar]
- Bertotti, G. Hysteresis in Magnetism; Academic Press: San Diego, CA, USA, 1998. [Google Scholar]
- Kneller, E. Ferromagnetism; Springer: Berlin, Germany, 1962. [Google Scholar]
- Youssef, S.; Zimmer, C.; Szielasko, K.; Schütze, A. Automatic feature extraction of periodic time signals using 3MA-X8 method. TM-Tech. Mess. 2019, 86, 267–277. [Google Scholar] [CrossRef]
- Szielasko, K.; Wolter, B.; Tschuncky, R.; Youssef, S. Micromagnetic materials characterization using machine learning—Progress in nondestructive prediction of mechanical properties of steel and iron. TM-Tech. Mess. 2019, 87, 428–437. [Google Scholar] [CrossRef]
- Sarkar, A.; Kumawat, B.K.; Chakravartty, J.K. Ratchetting behavior of 20MnMoNi55 reactor pressure vessel steel. J. Nucl. Mater. 2015, 467, 500–504. [Google Scholar] [CrossRef]
- Balart, M.J.; Knott, J.F. Low temperature fracture properties of DIN 22NiMoCr37 steel in fine-grained bainite and coarse-grained tempered embrittled martensite microstructures. Eng. Fract. Mech. 2008, 75, 2480–2513. [Google Scholar] [CrossRef]
- Korzekwa, D.A.; Matlock, D.K.; Krauss, G. Dislocation substructure as a function of strain in a dual-phase steel. Metall. Mater. Trans. A 1984, 15, 1221–1228. [Google Scholar] [CrossRef]
- Pedregosa, F.; Varoquaux, G.; Gramfort, A.; Michel, V.; Thirion, B.; Grisel, O.; Blondel, M.; Prettenhofer, P.; Weiss, R.; Dubourg, V.; et al. Scikit-learn: Machine learning in Python. JMLR 12 2011, 12, 2825–2830. [Google Scholar]
- Müller, A.C.; Guido, S. Introduction to Machine Learning with Python: A Guide for Data Scientists; O’Reilly Media, Inc.: Sebastopol, CA, USA, 2016. [Google Scholar]


| Feature | Description |
|---|---|
| Zmean | Average of absolute impedance of impedance loop |
| Zmin | Minimum of absolute impedance of impedance loop |
| Zmax | Maximum of absolute impedance of impedance loop |
| Phizmean | Phase of the average impedance |
| Phizmin | Phase of the minimum impedance |
| Phizmax | Phase of the maximum impedance |
| W3Z | Width of the impedance loop at 3% of maximum |
| W10Z | Width of the impedance loop at 10% of maximum |
| Feature | Description |
|---|---|
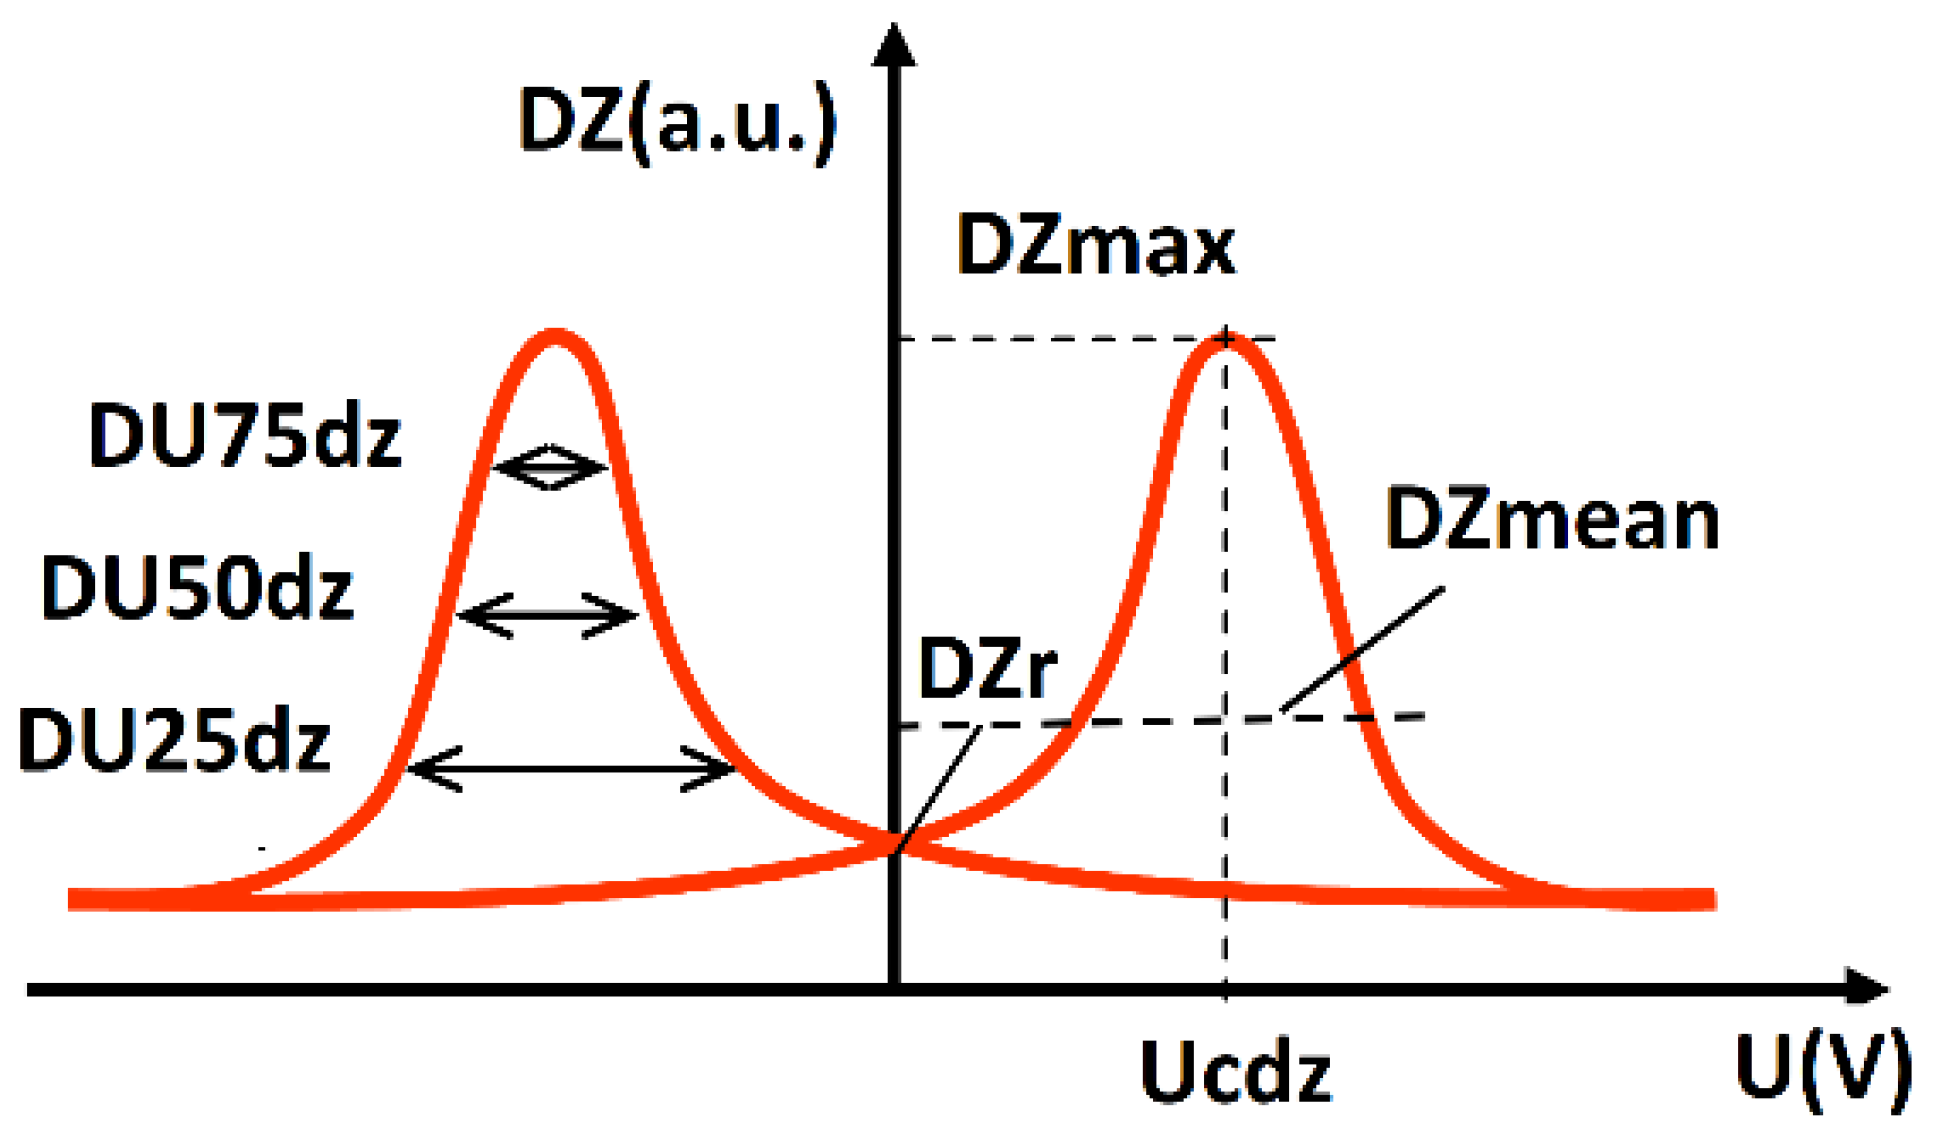
| DZmax | Maximum value of incremental permeability |
| DZmean | Average value of incremental permeability |
| DZr | Value of incremental permeability at U = 0 |
| Ucdz | Voltage at maximum of incremental permeability |
| DU75dz | Width of incremental permeability at 75% of maximum |
| DU50dz | Width of incremental permeability at 50% of maximum |
| DU25dz | Width of incremental permeability at 25% of maximum |
| Rem | Voltage offset of DZmax |
| Feature | Description |
|---|---|
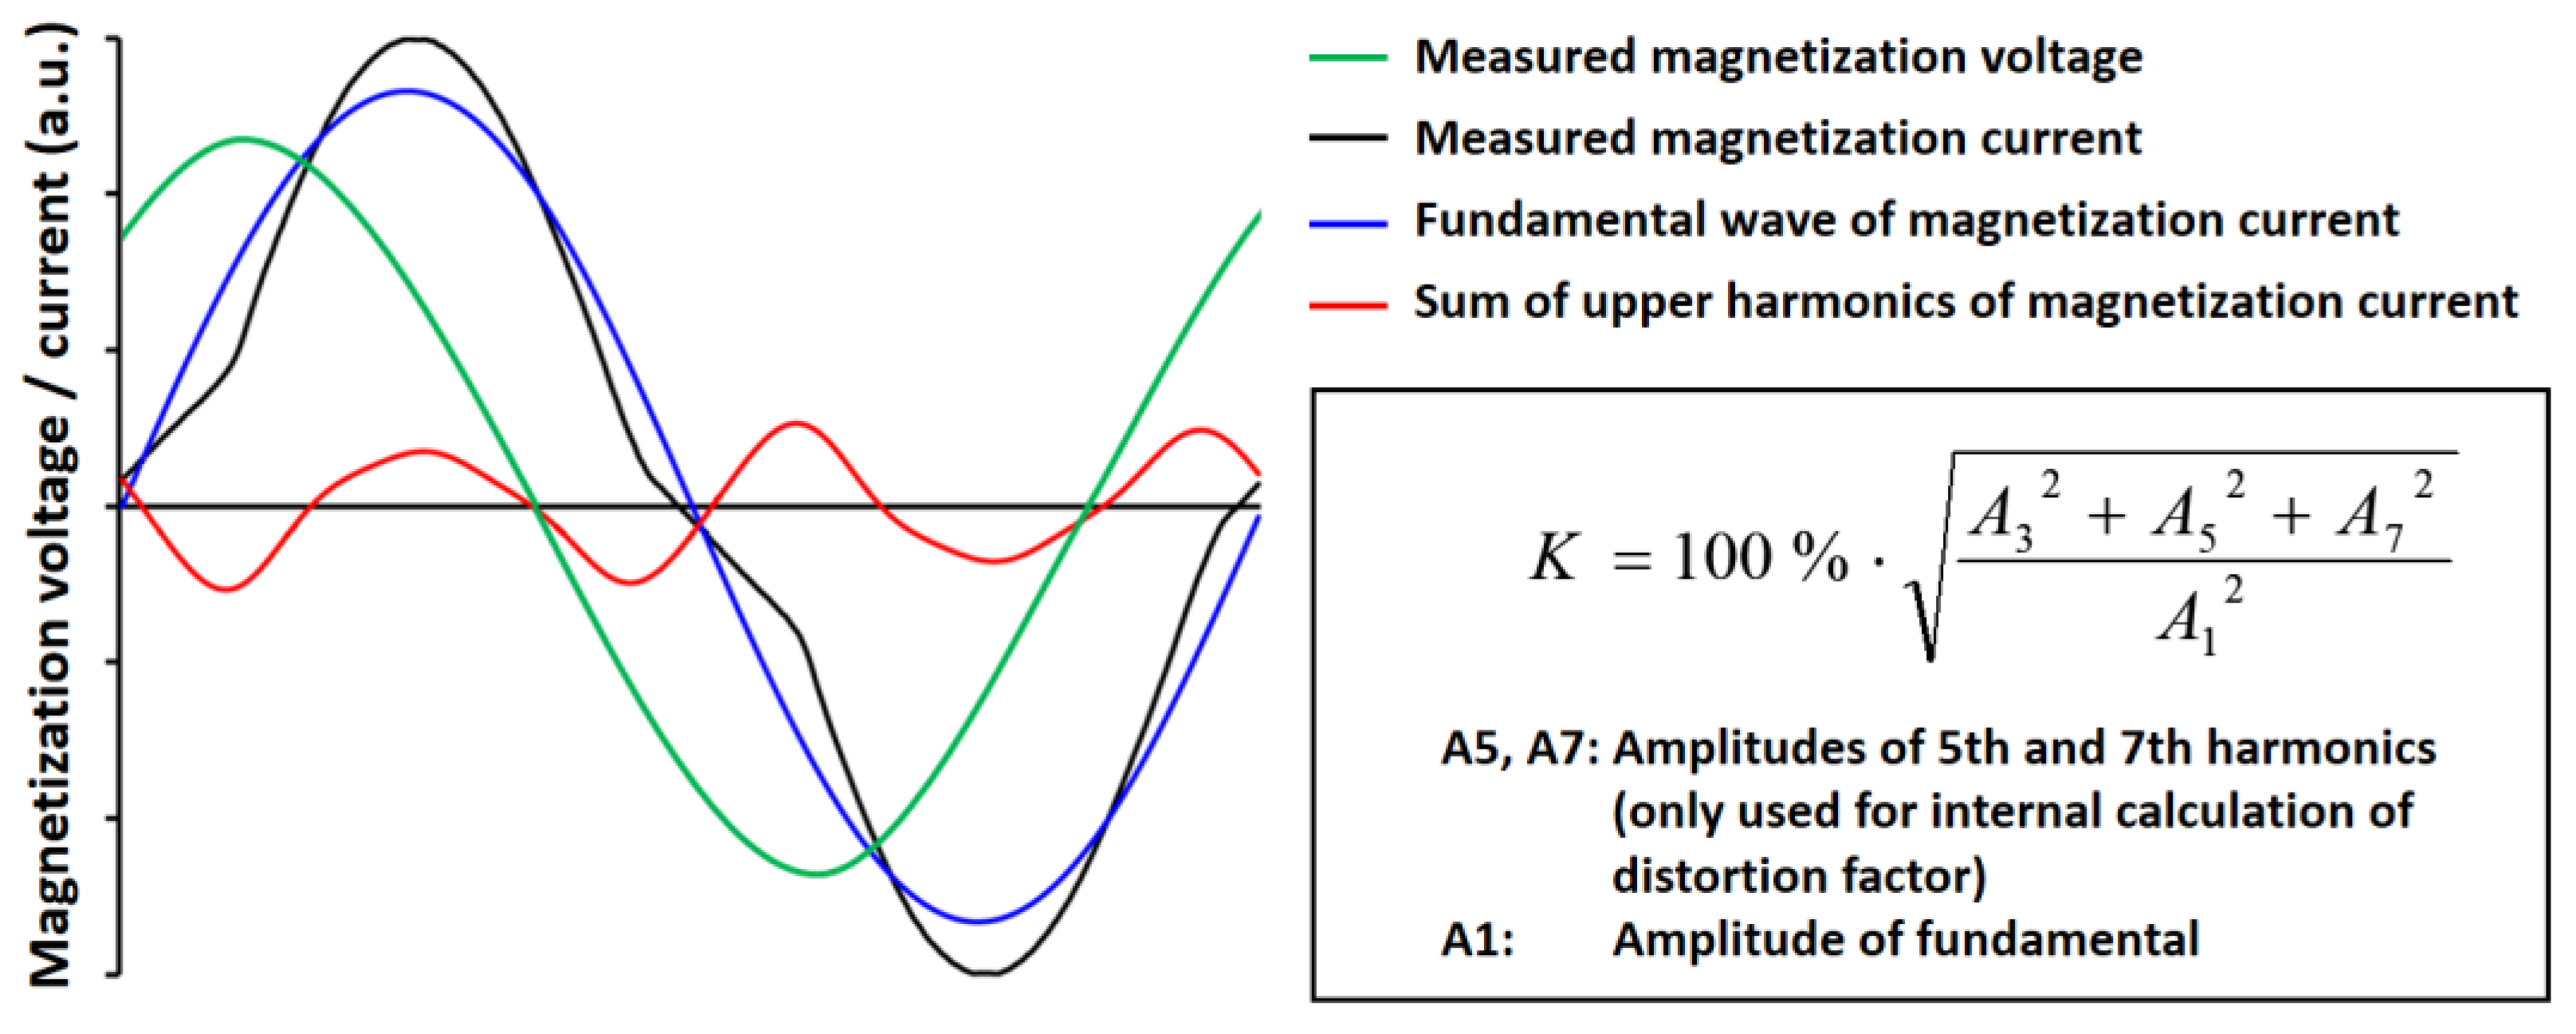
| Vmag | Amplitude of magnetization voltage |
| Imag | Amplitude of magnetization current |
| K | Distortion factor |
| A3 | Amplitude of third harmonic |
| P3 | Phase shift of third harmonics |
| Material | Cycles to Failure | Standard Deviation |
|---|---|---|
| 20MnMoNi5-5 | 3238 | 432 (13.34%) |
| 22NiMoCr3-7 | 6020 | 1322 (21.96%) |
Publisher’s Note: MDPI stays neutral with regard to jurisdictional claims in published maps and institutional affiliations. |
© 2021 by the authors. Licensee MDPI, Basel, Switzerland. This article is an open access article distributed under the terms and conditions of the Creative Commons Attribution (CC BY) license (https://creativecommons.org/licenses/by/4.0/).
Share and Cite
Zimmer, C.; Rallabandi, Y.N.; Szielasko, K.; Eichheimer, C.; Luke, M.; Youssef, S. Micromagnetic Microstructure- and Stress-Independent Materials Characterization in Reactor Safety Research. Materials 2021, 14, 5258. https://doi.org/10.3390/ma14185258
Zimmer C, Rallabandi YN, Szielasko K, Eichheimer C, Luke M, Youssef S. Micromagnetic Microstructure- and Stress-Independent Materials Characterization in Reactor Safety Research. Materials. 2021; 14(18):5258. https://doi.org/10.3390/ma14185258
Chicago/Turabian StyleZimmer, Cyril, Yashashwini Nikhitha Rallabandi, Klaus Szielasko, Christian Eichheimer, Michael Luke, and Sargon Youssef. 2021. "Micromagnetic Microstructure- and Stress-Independent Materials Characterization in Reactor Safety Research" Materials 14, no. 18: 5258. https://doi.org/10.3390/ma14185258