
Phase Transformations and Subsurface Changes in Three Dental Zirconia Grades after Sandblasting with Various Al2O3 Particle Sizes


Abstract
:1. Introduction
2. Materials and Methods
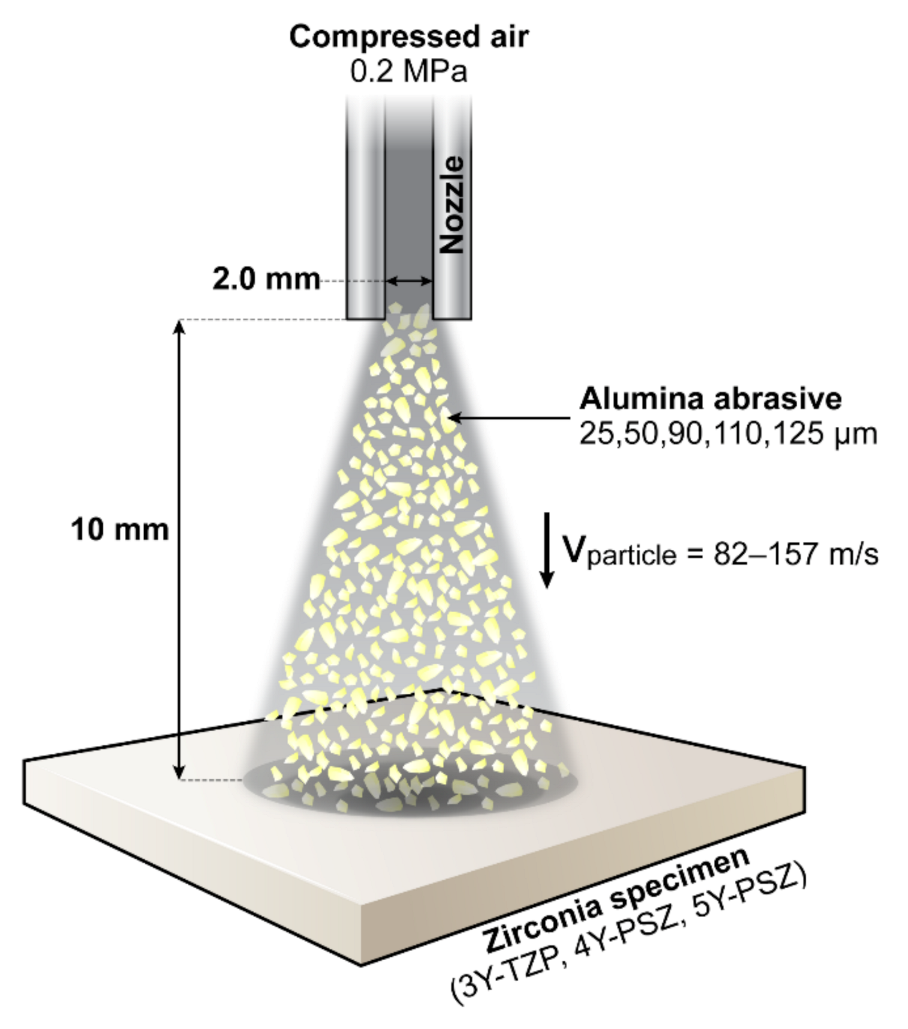
2.1. Specimen Preparation
2.2. Phase Transformation and Compressive Strain Evaluation
2.3. Microstructural Analyses
2.4. D-Finite Element Analysis (FEA)
2.5. Statistics
3. Results
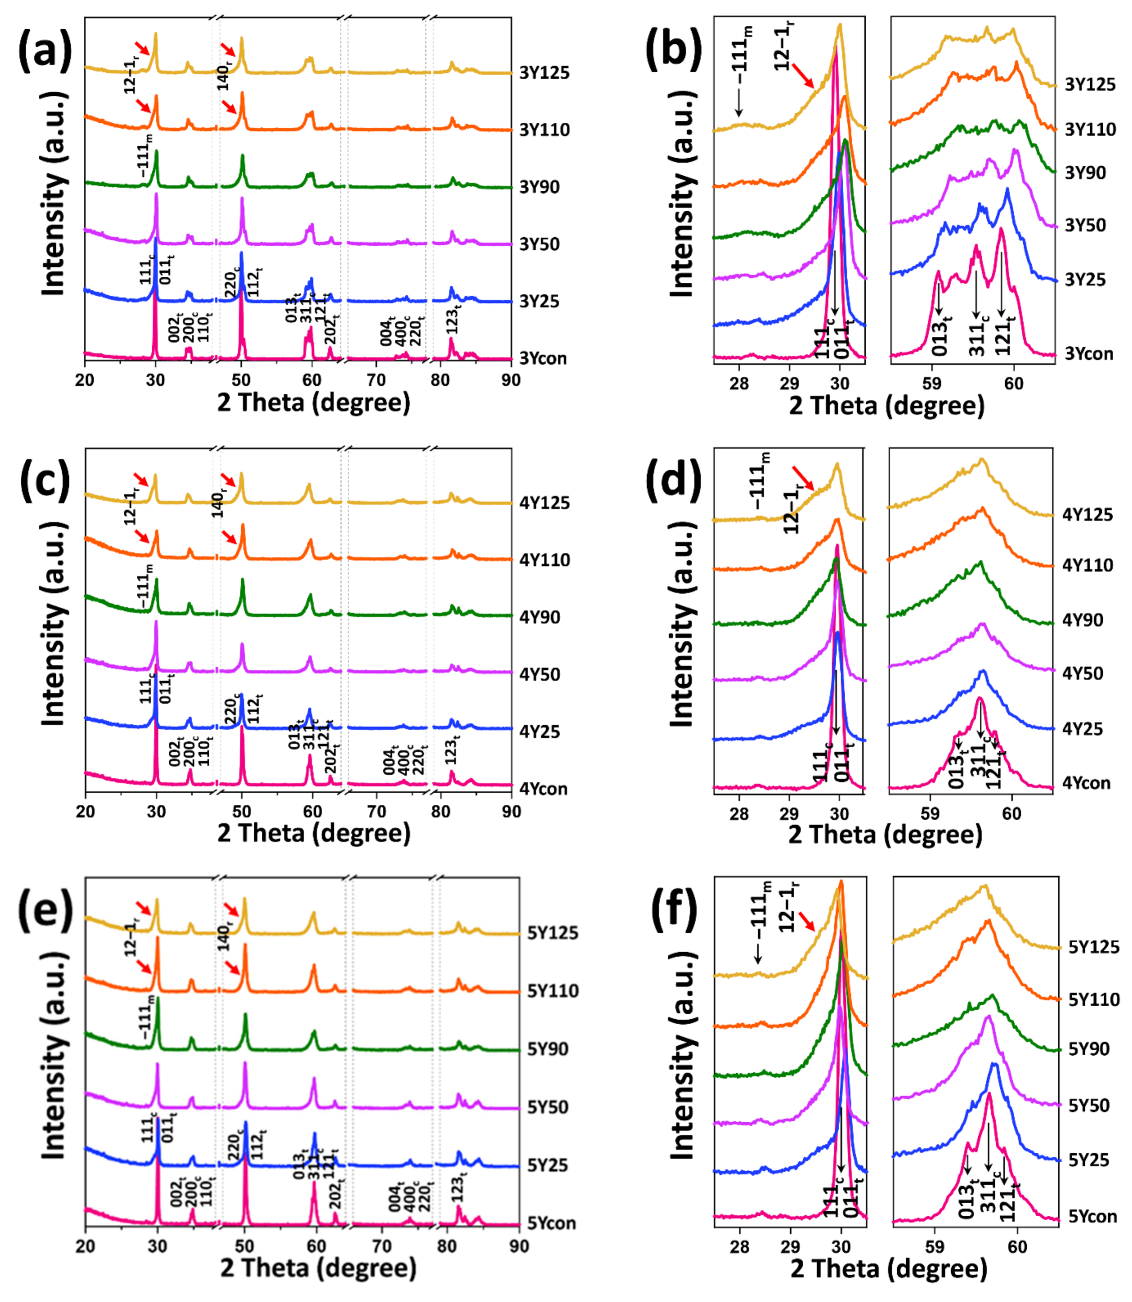
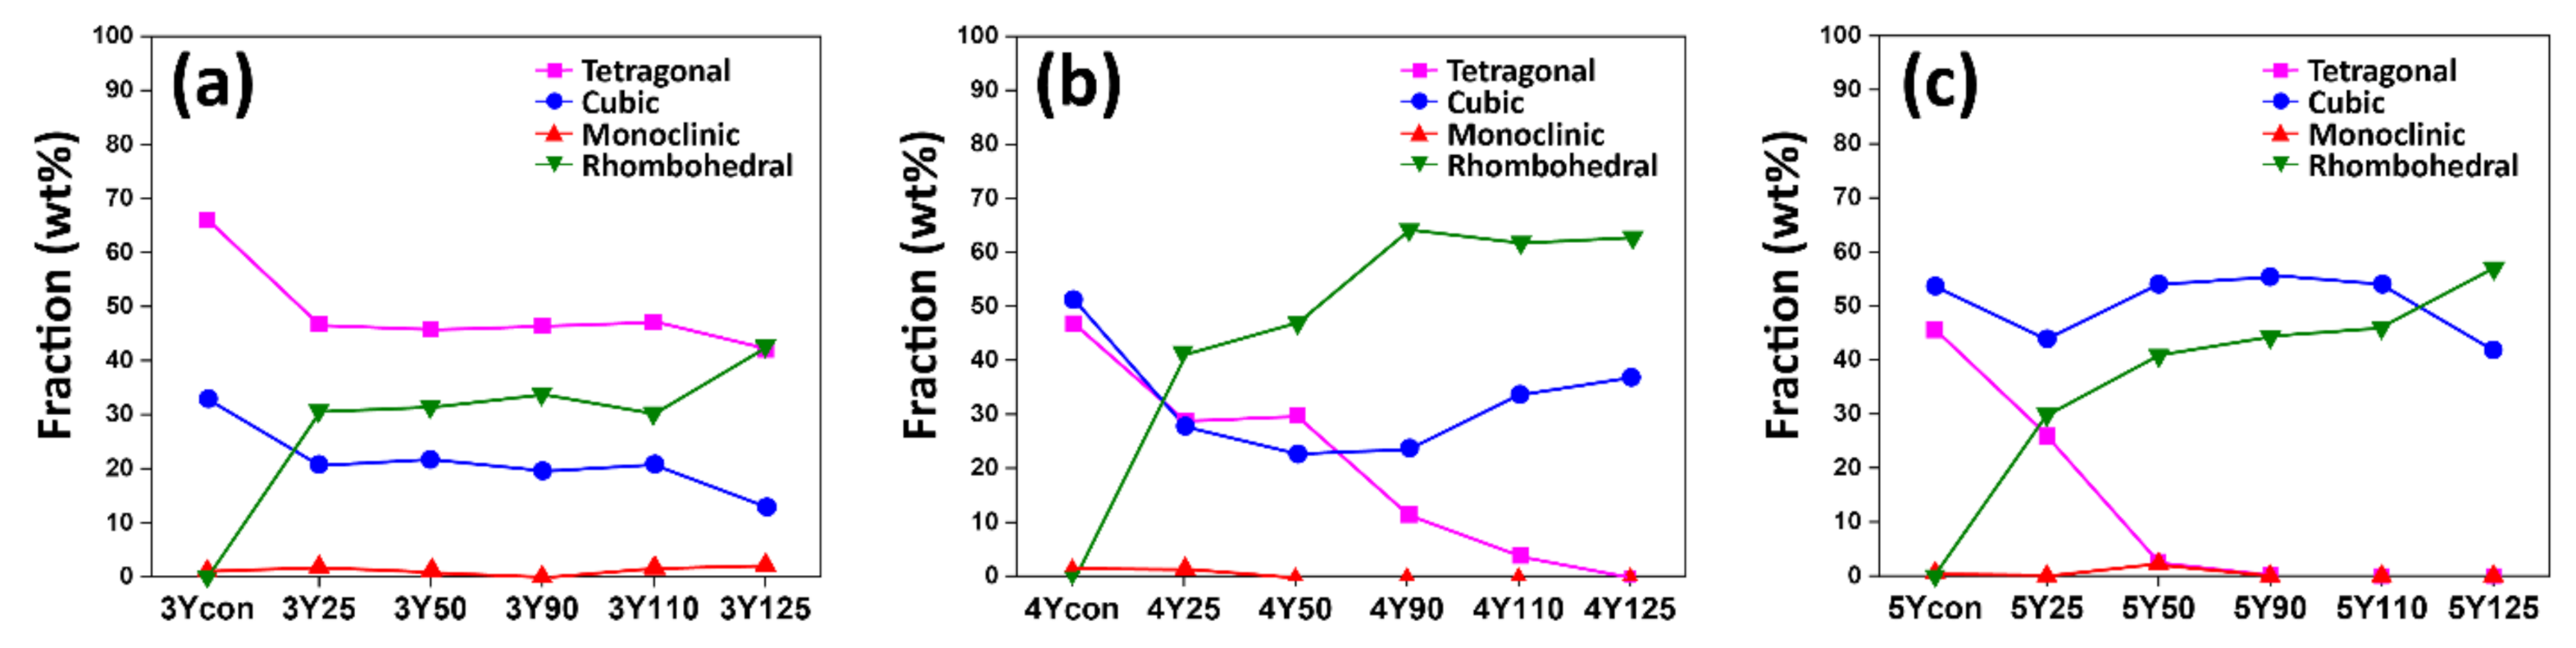
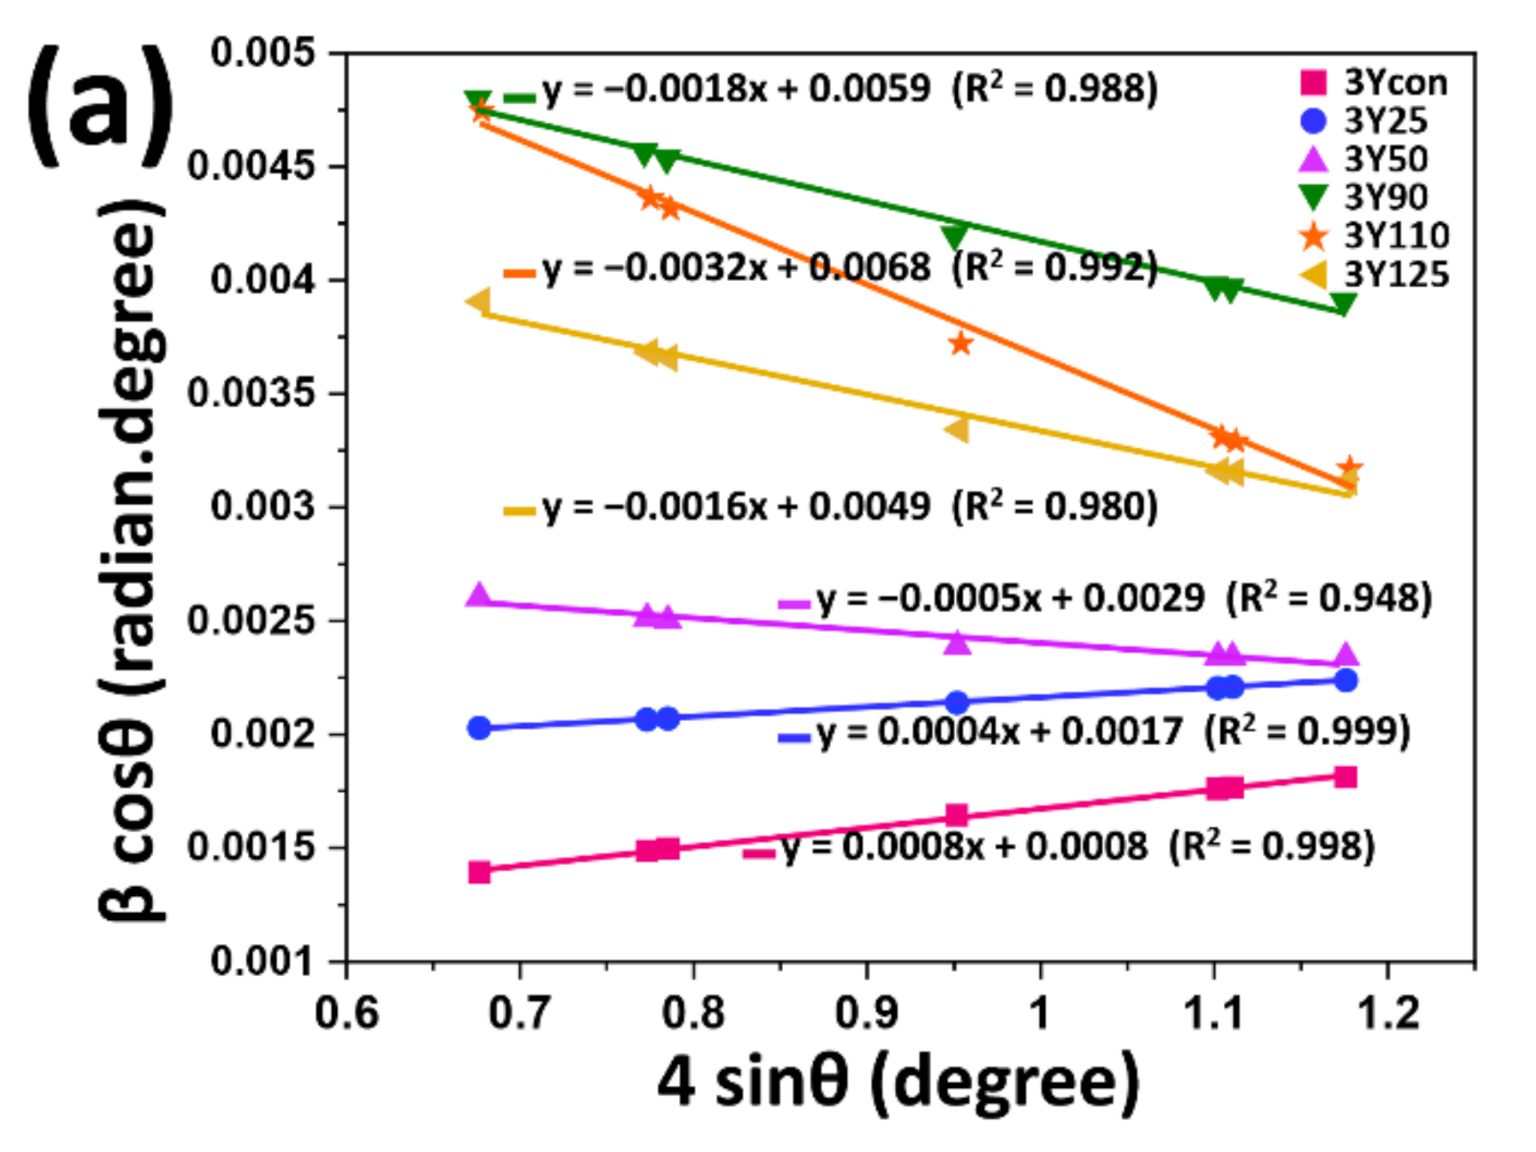
3.1. XRD Analysis
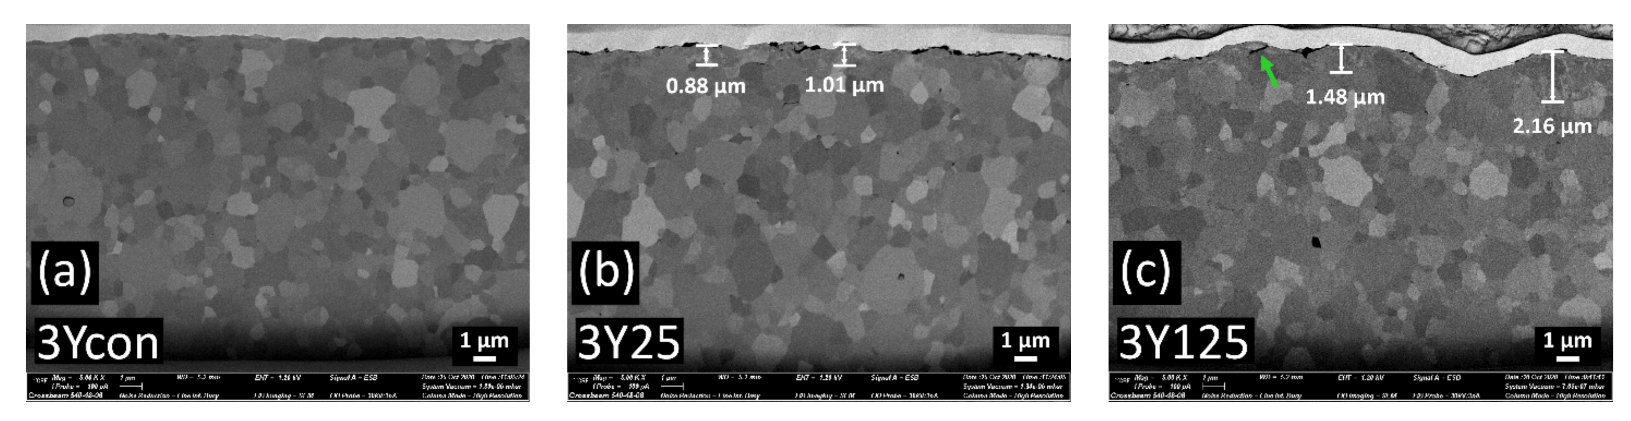
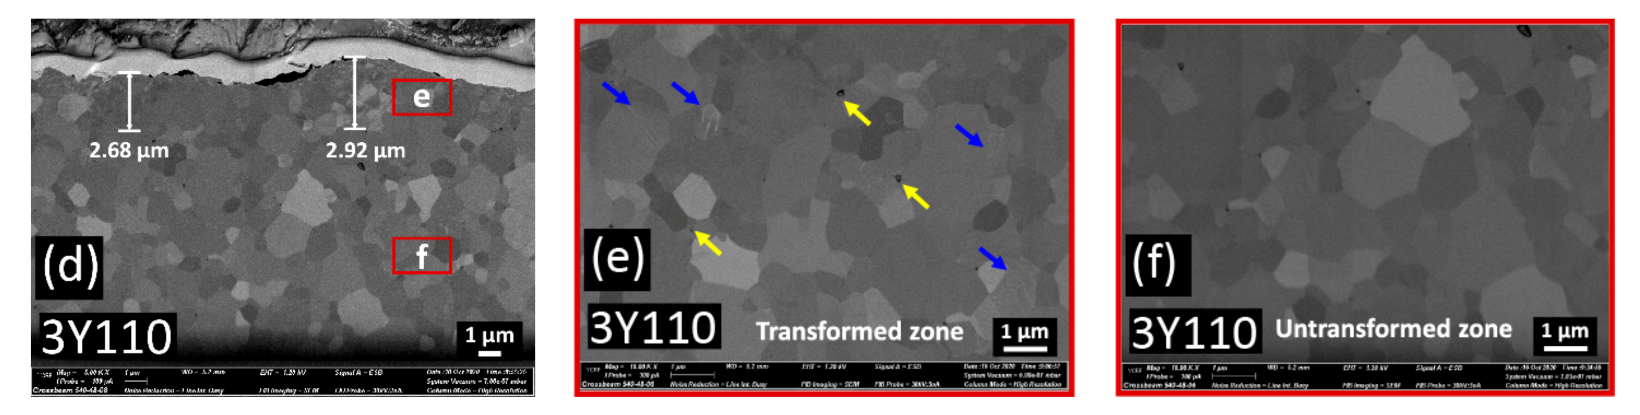
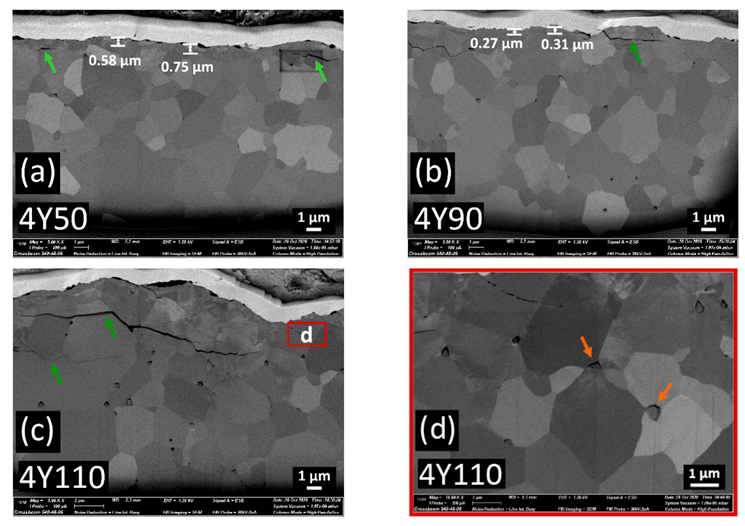
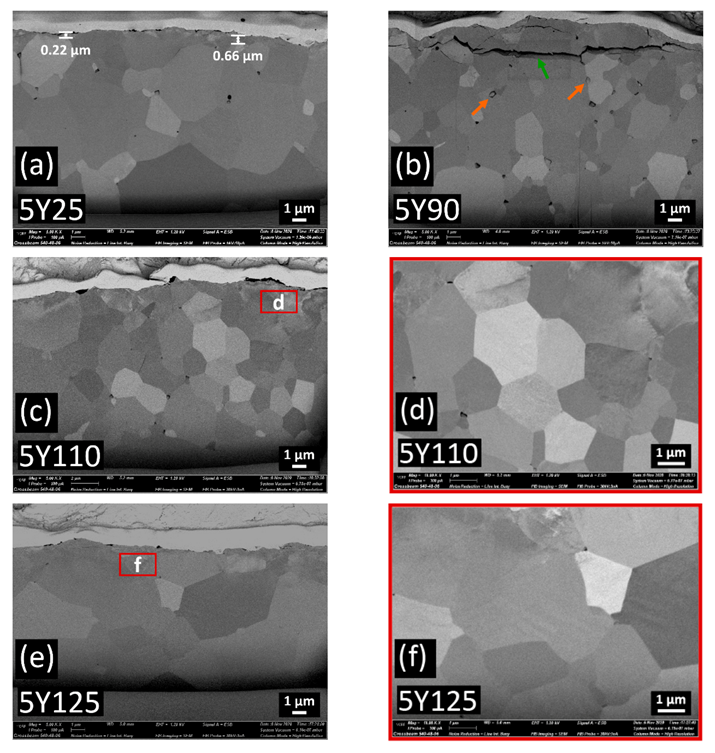
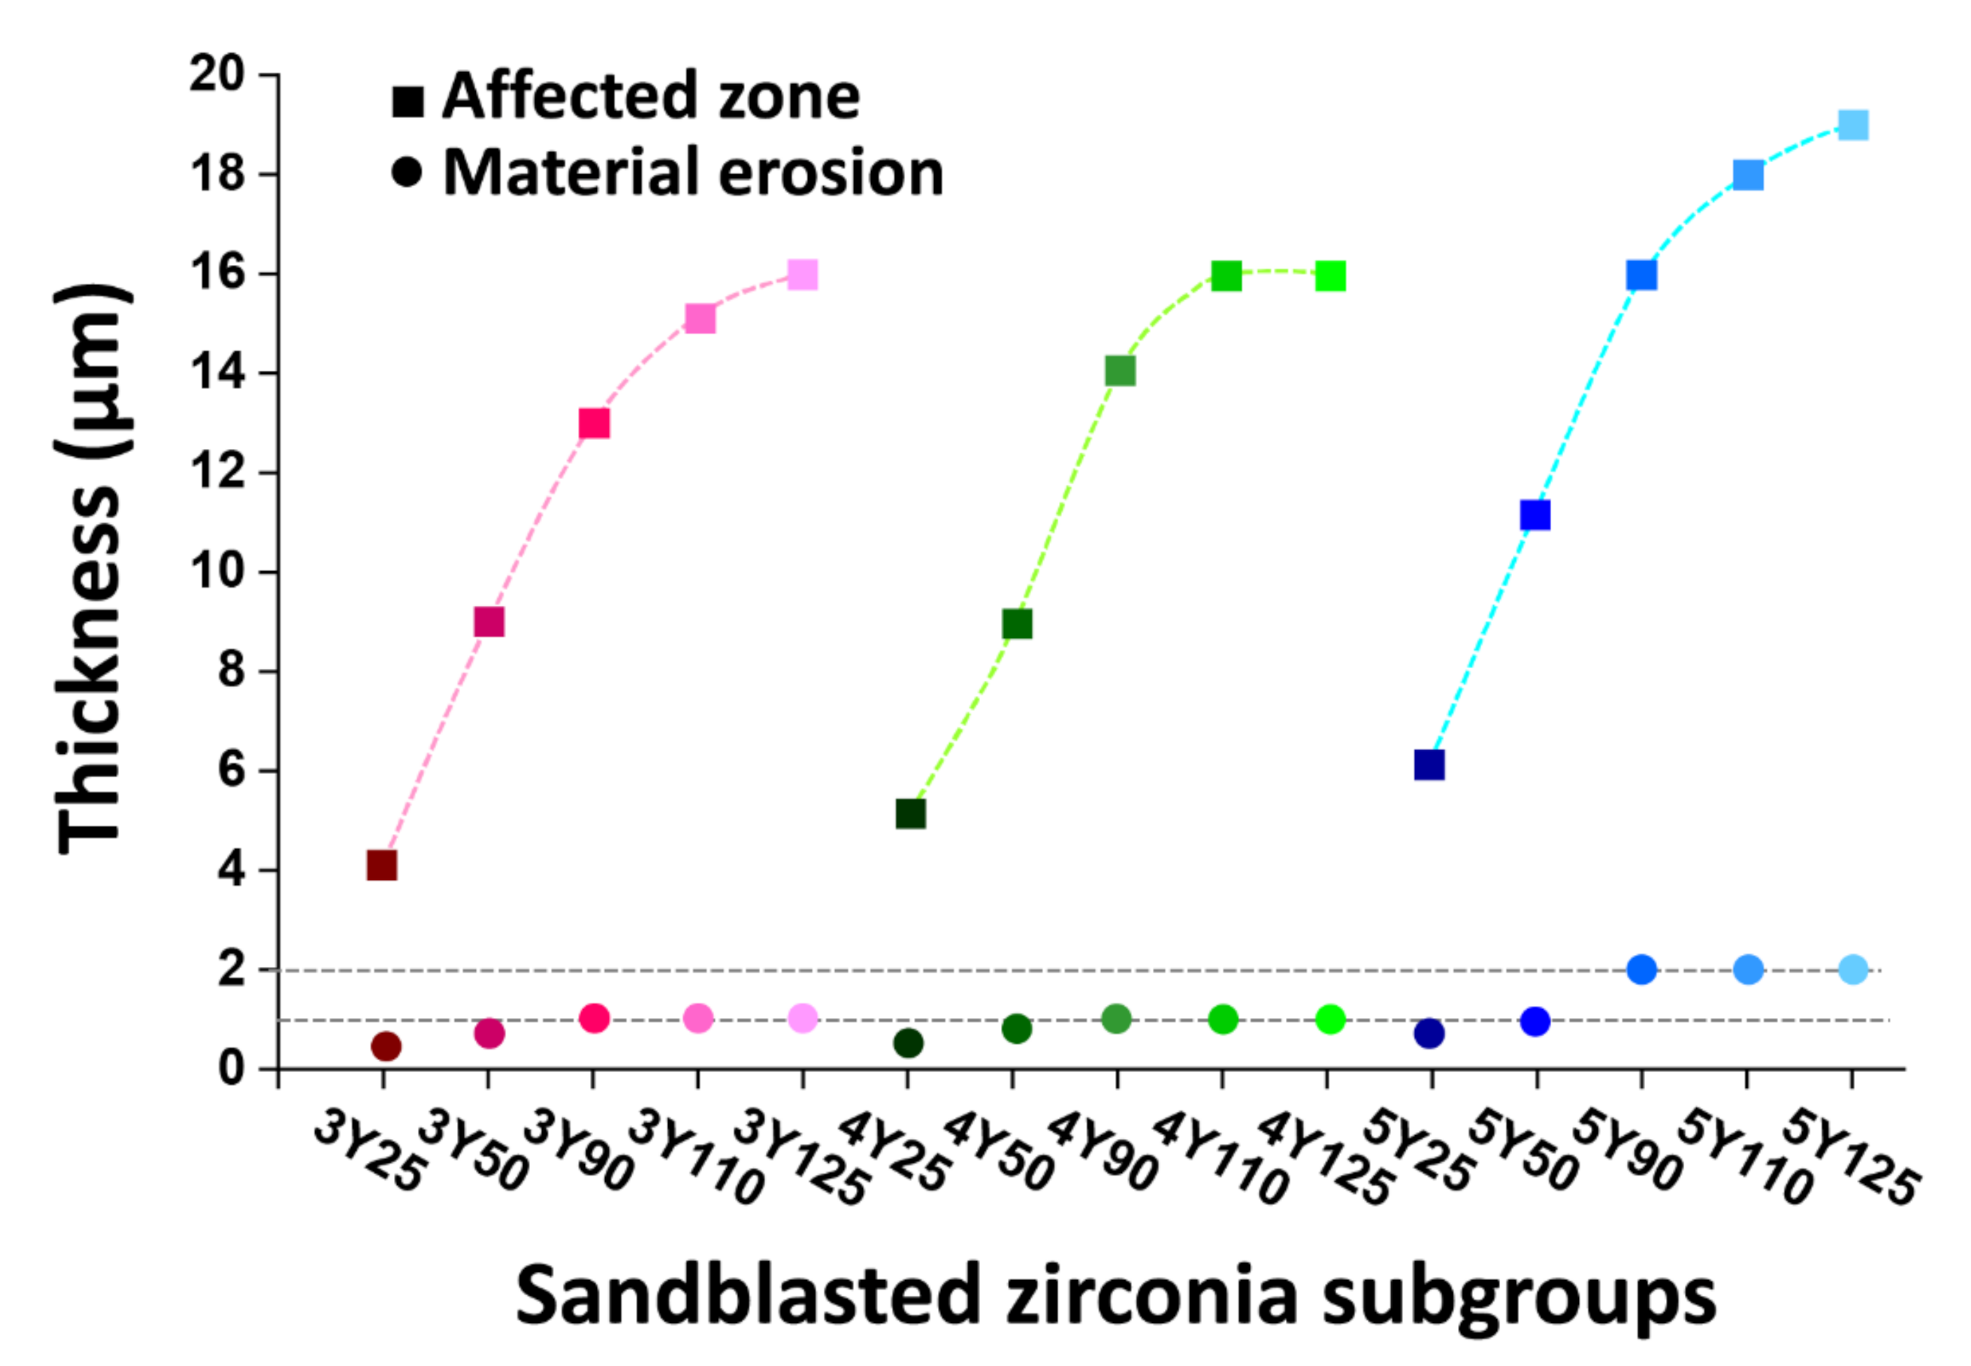
3.2. FIB/SEM Analysis
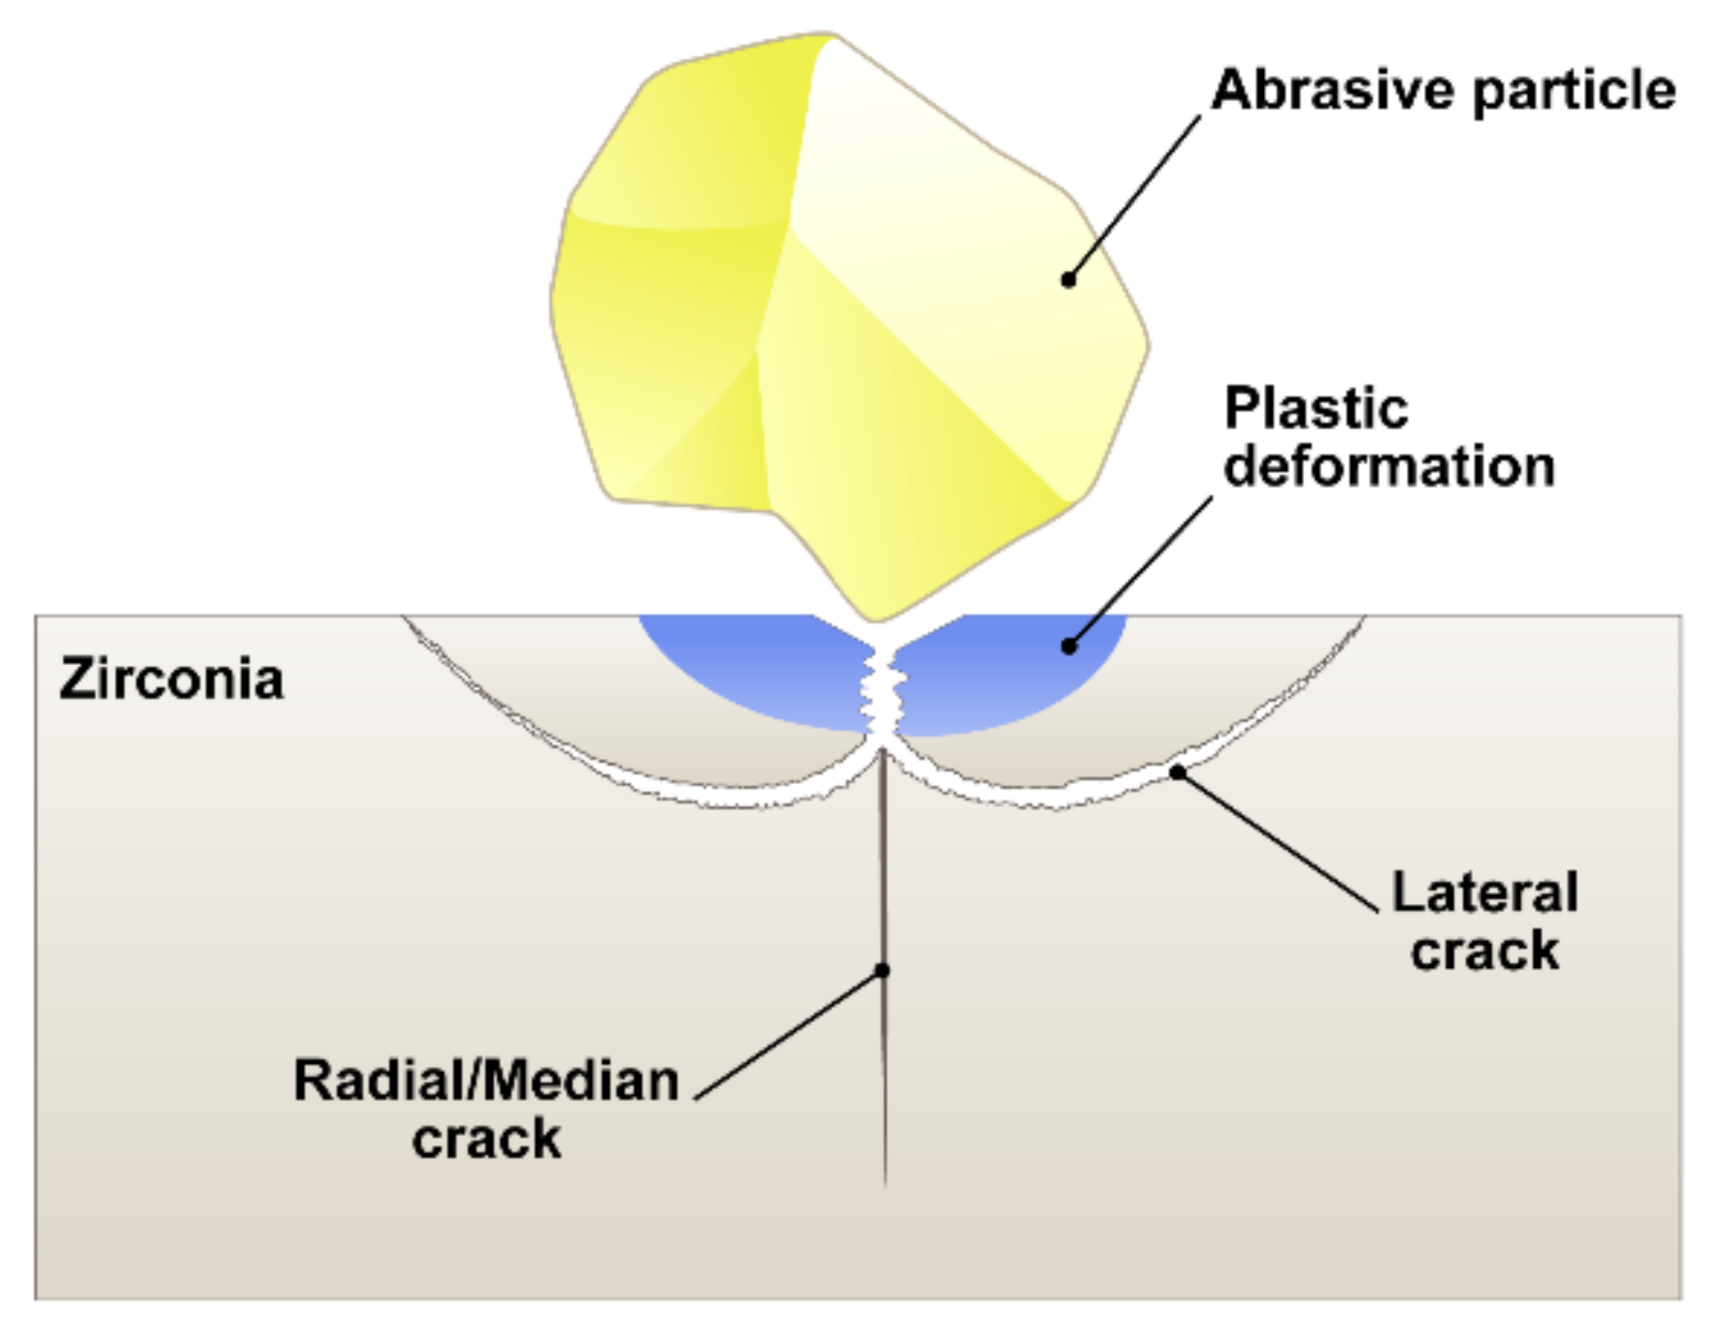
3.3. Interaction between the Abrasive Particle and Zirconia Substrate
4. Discussion
5. Conclusions
- (1)
- Although alumina sandblasting induced tetragonal to monoclinic phase transformation in the conventional zirconia, the phase transformation would depend on the amount of metastable tetragonal phase in highly translucent zirconia.
- (2)
- When selecting the appropriate sandblasting protocols of highly translucent zirconia, care should be taken in order not to deteriorate the mechanical properties due to the high susceptibility to surface damage under applied stress.
- (3)
- Within the range of treatment parameters investigated in this study, the recommended sandblasting particles were 110 µm for 3Y-TZP and 50 µm for 4Y-PSZ or 5Y-PSZ at a pressure of 0.2 MPa and a distance of 10 mm from the specimen’s surface for 10 s/cm2 to implement compressive stress-induced phase transformations without significant subsurface damages.
Author Contributions
Funding
Institutional Review Board Statement
Informed Consent Statement
Data Availability Statement
Conflicts of Interest
References
- Zhang, Y.; Lawn, B.R. Novel Zirconia Materials in Dentistry. J. Dent. Res. 2018, 97, 140–147. [Google Scholar] [CrossRef]
- Zhu, J.; Luo, J.; Sun, Y. Study of the Fracture Behavior of Tetragonal Zirconia Polycrystal with a Modified Phase Field Model. Materials 2020, 13, 4430. [Google Scholar] [CrossRef]
- Kim, H.K. Optical and Mechanical Properties of Highly Translucent Dental Zirconia. Materials 2020, 13, 3395. [Google Scholar] [CrossRef] [PubMed]
- Okutan, Y.; Yucel, M.T.; Gezer, T.; Donmez, M.B. Effect of airborne particle abrasion and sintering order on the surface roughness and shear bond strength between Y-TZP ceramic and resin cement. Dent. Mater. J. 2019, 38, 241–249. [Google Scholar] [CrossRef] [Green Version]
- Ruales-Carrera, E.; Cesar, P.F.; Henriques, B.; Fredel, M.C.; Ozcan, M.; Volpato, C.A.M. Adhesion behavior of conventional and high-translucent zirconia: Effect of surface conditioning methods and aging using an experimental methodology. J. Esthet. Restor. Dent. 2019, 31, 388–397. [Google Scholar] [CrossRef]
- Shimoe, S.; Peng, T.Y.; Otaku, M.; Tsumura, N.; Iwaguro, S.; Satoda, T. Influence of various airborne-particle abrasion conditions on bonding between zirconia ceramics and an indirect composite resin material. J. Prosthet. Dent. 2019, 122, 491.e491–491.e499. [Google Scholar] [CrossRef] [PubMed]
- Yoshida, K. Influence of alumina air-abrasion for highly translucent partially stabilized zirconia on flexural strength, surface properties, and bond strength of resin cement. J. Appl. Oral. Sci. 2020, 28, e20190371. [Google Scholar] [CrossRef] [PubMed]
- Kim, H.K.; Ahn, B. Effect of Al2O3 Sandblasting Particle Size on the Surface Topography and Residual Compressive Stresses of Three Different Dental Zirconia Grades. Materials 2021, 14, 610. [Google Scholar] [CrossRef] [PubMed]
- Hallmann, L.; Ulmer, P.; Reusser, E.; Hämmerle, C.H. Surface characterization of dental Y-TZP ceramic after air abrasion treatment. J. Dent. 2012, 40, 723–735. [Google Scholar] [CrossRef]
- Ozdogan, A.; Yesil Duymus, Z. Investigating the Effect of Different Surface Treatments on Vickers Hardness and Flexural Strength of Zirconium and Lithium Disilicate Ceramics. J. Prosthodont. 2020, 29, 129–135. [Google Scholar] [CrossRef]
- Inokoshi, M.; Shimizubata, M.; Nozaki, K.; Takagaki, T.; Yoshihara, K.; Minakuchi, S.; Vleugels, J.; Van Meerbeek, B.; Zhang, F. Impact of sandblasting on the flexural strength of highly translucent zirconia. J. Mech. Behav. Biomed. Mater. 2021, 115, 104268. [Google Scholar] [CrossRef]
- Fonseca, R.G.; de Oliveira Abi-Rached, F.; dos Santos Nunes Reis, J.M.; Rambaldi, E.; Baldissara, P. Effect of particle size on the flexural strength and phase transformation of an airborne-particle abraded yttria-stabilized tetragonal zirconia polycrystal ceramic. J. Prosthet. Dent. 2013, 110, 510–514. [Google Scholar] [CrossRef] [PubMed]
- Aurélio, I.L.; Marchionatti, A.M.; Montagner, A.F.; May, L.G.; Soares, F.Z. Does air particle abrasion affect the flexural strength and phase transformation of Y-TZP? A systematic review and meta-analysis. Dent. Mater. 2016, 32, 827–845. [Google Scholar] [CrossRef] [PubMed]
- Wongkamhaeng, K.; Dawson, D.V.; Holloway, J.A.; Denry, I. Effect of Surface Modification on In-Depth Transformations and Flexural Strength of Zirconia Ceramics. J. Prosthodont. 2019, 28, e364–e375. [Google Scholar] [CrossRef] [Green Version]
- Chintapalli, R.K.; Mestra Rodriguez, A.; Garcia Marro, F.; Anglada, M. Effect of sandblasting and residual stress on strength of zirconia for restorative dentistry applications. J. Mech. Behav. Biomed. Mater. 2014, 29, 126–137. [Google Scholar] [CrossRef]
- Zhang, D.; Li, C.; Jia, D.; Wang, S.; Li, R.; Qi, X. Grinding model and material removal mechanism of medical nanometer zirconia ceramics. Recent Pat. Nanotechnol. 2014, 8, 2–17. [Google Scholar] [CrossRef]
- Balza, J.C.; Zujur, D.; Gil, L.; Subero, R.; Dominguez, E.; Delvasto, P.; Alvarez, J. Sandblasting as a surface modification technique on titanium alloys for biomedical applications: Abrasive particle behave. Mater. Sci. Eng. 2013, 45, 012004. [Google Scholar] [CrossRef]
- Zhao, P.; Yu, P.; Xiong, Y.; Yue, L.; Arola, D.; Gao, S. Does the bond strength of highly translucent zirconia show a different dependence on the airborne-particle abrasion parameters in comparison to conventional zirconia? J. Prosthodont. Res. 2020, 64, 60–70. [Google Scholar] [CrossRef] [PubMed]
- Chintapalli, R.K.; Marro, F.G.; Jimenez-Pique, E.; Anglada, M. Phase transformation and subsurface damage in 3Y-TZP after sandblasting. Dent. Mater. 2013, 29, 566–572. [Google Scholar] [CrossRef] [PubMed]
- Lim, J.S.; Kim, D.H.; Mathew, V.; Ahn, D.C.; Kim, J.K. Synthesis of LiFePO4 nanoparticles by solvothermal process using various polyol media and their electrochemical properties. J. Nanosci. Nanotechnol. 2011, 11, 1451–1454. [Google Scholar] [CrossRef]
- Rabiei, M.; Palevicius, A.; Monshi, A.; Nasiri, S.; Vilkauskas, A.; Janusas, G. Comparing Methods for Calculating Nano Crystal Size of Natural Hydroxyapatite Using X-Ray Diffraction. Nanomaterials 2020, 10, 1627. [Google Scholar] [CrossRef]
- Rabiei, M.; Palevicius, A.; Dashti, A.; Nasiri, S.; Monshi, A.; Doustmohammadi, A.; Vilkauskas, A.; Janusas, G. X-ray Diffraction Analysis and Williamson-Hall Method in USDM Model for Estimating More Accurate Values of Stress-Strain of Unit Cell and Super Cells (2 × 2 × 2) of Hydroxyapatite, Confirmed by Ultrasonic Pulse-Echo Test. Materials 2021, 14, 2949. [Google Scholar] [CrossRef]
- Bakitian, F.; Papia, E.; Larsson, C.; Vult von Steyern, P. Evaluation of Stress Distribution in Tooth-Supported Fixed Dental Prostheses Made of Translucent Zirconia with Variations in Framework Designs: A Three-Dimensional Finite Element Analysis. J. Prosthodont. 2020, 29, 315–322. [Google Scholar] [CrossRef]
- Jafar, R.H.M.; Spelt, J.K.; Papini, M. Numerical simulation of surface roughness and erosion rate of abrasive et micro-machined channels. Wear 2013, 303, 302–312. [Google Scholar] [CrossRef]
- Kaizer, M.R.; Kolakarnprasert, N.; Rodrigues, C.; Chai, H.; Zhang, Y. Probing the interfacial strength of novel multi-layer zirconias. Dent. Mater. 2020, 36, 60–67. [Google Scholar] [CrossRef] [PubMed]
- Boniecki, M.; Sadowski, T.; Gołębiewski, P.; Węglarz, H.; Piątkowska, A.; Romaniec, M.; Krzyżak, K.; Łosiewicz, K. Mechanical properties of alumina/zirconia composites. Ceram. Int. 2020, 46, 1033–1039. [Google Scholar] [CrossRef]
- Maruo, Y.; Yoshihara, K.; Irie, M.; Nishigawa, G.; Nagaoka, N.; Matsumoto, T.; Minagi, S. Flexural properties, bond ability, and crystallographic phase of highly translucent multi-layered zirconia. J. Appl. Biomater. Funct. Mater. 2020, 18. [Google Scholar] [CrossRef] [PubMed]
- Mote, V.D.; Purushotham, Y.; Dole, B.N. Williamson-Hall analysis in estimation of lattice strain in nanometer-sized ZnO particles. J. Theor. Appl. Phys. 2012, 6, 6. [Google Scholar] [CrossRef] [Green Version]
- Rabiei, M.; Palevicius, A.; Dashti, A.; Nasiri, S.; Monshi, A.; Vilkauskas, A.; Janusas, G. Measurement Modulus of Elasticity Related to the Atomic Density of Planes in Unit Cell of Crystal Lattices. Materials 2020, 13, 4380. [Google Scholar] [CrossRef] [PubMed]
- Mamivand, M.; Zaeem, M.A.; El Kadiri, H.; Chen, L.Q. Phase field modeling of the tetragonal-to-monoclinic phase transformation in zirconia. Acta Mater. 2013, 61, 5223–5235. [Google Scholar] [CrossRef] [Green Version]
- Bilal, A.; Perveen, A.; Talamona, D.; Jahan, M.P. Understanding Material Removal Mechanism and Effects of Machining Parameters during EDM of Zirconia-Toughened Alumina Ceramic. Micromachines 2021, 12, 67. [Google Scholar] [CrossRef]
- Baya, M.; Heinz, M.V.F.; Linte, C.; German, A.; Blugan, G.; Battaglia, C.; Vogta, U.F. Impact of sintering conditions and zirconia addition on flexural strength and ion conductivity of Na-β”-alumina ceramics. Mater. Today Commun. 2020, 23, 101118. [Google Scholar] [CrossRef]
- Hasegawa, H. Rhombohedral phase produced in abraded surfaces of partially stabilized zirconia (PSZ). J. Mater. Sci. Lett. 1983, 2, 91–93. [Google Scholar] [CrossRef]
- Mitra, N.; Vijayan, K.; Pramila Bai, B.N.; Biswas, S.K. Phase transformation introduced by mechanical and chemical surface preparations of tetragonal zirconia polycrystals. J. Am. Ceram. Soc. 1993, 76, 533–535. [Google Scholar] [CrossRef]
- Denry, I.L.; Holloway, J.A. Microstructural and crystallographic surface changes after grinding zirconia-based dental ceramics. J. Biomed. Mater. Res. B Appl. Biomater. 2006, 76, 440–448. [Google Scholar] [CrossRef] [PubMed]
- Franco-Tabares, S.; Wardecki, D.; Nakamura, K.; Ardalani, S.; Hjalmarsson, L.; Franke Stenport, V.; Johansson, C.B. Effect of airborne-particle abrasion and polishing on novel translucent zirconias: Surface morphology, phase transformation and insights into bonding. J. Prosthodont. Res. 2021, 65, 97–105. [Google Scholar] [CrossRef]
- Chevalier, J.; Gremillard, L.; Virkar, A.V.; Clarke, D.R. The tetragonal-monoclinic transformation in zirconi: Lessons learned and future trends. J. Am. Ceram. Soc. 2009, 92, 1901–1920. [Google Scholar] [CrossRef]
- Juy, A.; Anglada, M. Strength and grinding residual stresses of Y-TZP with duplex microstructures. Eng. Fail. Anal. 2009, 16, 2586–2597. [Google Scholar] [CrossRef]
- Guazzato, M.; Quach, L.; Albakry, M.; Swain, M.V. Influence of surface and heat treatments on the flexural strength of Y-TZP dental ceramic. J. Dent. 2005, 33, 9–18. [Google Scholar] [CrossRef]
- Zhang, T.; Jiang, F.; Huang, H.; Lu, J.; Wu, Y.; Jiang, Z.; Xu, X. Towards understanding the brittle-ductile transition in the extreme manufacturing. Int. J. Extrem. Manuf. 2021, 3, 022001. [Google Scholar] [CrossRef]
- de Araújo-Júnior, E.N.S.; Bergamo, E.T.P.; Campos, T.M.B.; Benalcázar Jalkh, E.B.; Lopes, A.C.O.; Monteiro, K.N.; Cesar, P.F.; Tognolo, F.C.; Tanaka, R.; Bonfante, E.A. Hydrothermal degradation methods affect the properties and phase transformation depth of translucent zirconia. J. Mech. Behav. Biomed. Mater. 2020, 112, 104021. [Google Scholar] [CrossRef] [PubMed]
- Ho, C.J.; Liu, H.C.; Tuan, W.H.M. Effect of abrasive grinding on the strength of Y-TZP. J. Eur. Ceram. Soc. 2009, 29, 2665–2669. [Google Scholar] [CrossRef]
- Karlsen, C.Å.; Schriwer, C.; Øilo, M. Damage tolerance of six dental zirconias with different translucencies. Biomater. Investig. Dent. 2020, 7, 126–133. [Google Scholar] [CrossRef] [PubMed]
- Amat, N.F.; Muchtar, A.; Amril, M.S.; Ghazali, M.J.; Yahaya, N. Effect of sintering temperature on the aging resistance and mechanical properties of monolithic zirconia. J. Mater. Res. Technol. 2019, 8, 1092–1101. [Google Scholar] [CrossRef]
- Stawarczyk, B.; Özcan, M.; Hallmann, L.; Ender, A.; Mehl, A.; Hämmerlet, C.H.F. The effect of zirconia sintering temperature on flexural strength, grain size, and contrast ratio. Clin. Oral. Investig. 2013, 17, 269–274. [Google Scholar] [CrossRef] [PubMed] [Green Version]
- Hooi, P.; Addison, O.; Fleming, G.J. Strength determination of brittle materials as curved monolithic structures. J. Dent. Res. 2014, 93, 412–416. [Google Scholar] [CrossRef] [PubMed]
- Du, M.; Li, Z.; Feng, L.; Dong, X.; Che, J.; Zhang, Y. Numerical simulation of particle fracture and surface erosion due to single particle impact. AIP Adv. 2021, 11, 035218. [Google Scholar] [CrossRef]
- Nimplod, P.; Tansalarak, R.; Sornsuwan, T. Effect of the different debonding strength of metal and ceramic brackets on the degree of enamel microcrack healing. Dent. Press J. Orthod. 2021, 26, e2119177. [Google Scholar] [CrossRef]


| Material | Particle Size (µm) | Density (g/cm3) | Poisson’s Ratio | Young’s Modulus (GPa) | Flexural Strength (MPa) | |
|---|---|---|---|---|---|---|
| Zirconia | ML (3Y-TZP) | 0.52 ± 0.05 | 6.10 a | 0.30 a | 210 a | 800–900 a |
| STML (4Y-PSZ) | 1.19 ± 0.20 | 6.10 a | 0.30 a | 210 a | 560–650 a | |
| UTML (5Y-PSZ) | 1.58 ± 0.17 | 6.10 a | 0.30 a | 210 a | 470–500 a | |
| Abrasive Particle | Al2O3 | 25, 50, 90, 110, 125 | 3.95 b | 0.22 b | 375 b | 379 b |
| Model Design | Maximum Principal Tensile Stress (Positive Values) | Maximum Principal Compressive Stress (Negative Values) | |
|---|---|---|---|
| 3Y | 3Y25 | 416.06 | 1533.85 |
| 3Y50 | 402.89 | 1542.26 | |
| 3Y90 | 480.76 | 1460.81 | |
| 3Y110 | 425.25 | 1416.71 | |
| 3Y125 | 397.41 | 1576.75 | |
| 4Y | 4Y25 | 412.96 | 1543.43 |
| 4Y50 | 402.98 | 1554.53 | |
| 4Y90 | 479.02 | 1472.94 | |
| 4Y110 | 430.63 | 1423.44 | |
| 4Y125 | 399.69 | 1570.46 | |
| 5Y | 5Y25 | 402.63 | 1397.91 |
| 5Y50 | 399.91 | 1408.50 | |
| 5Y90 | 397.71 | 1308.88 | |
| 5Y110 | 376.20 | 1240.51 | |
| 5Y125 | 336.36 | 1306.07 | |
Publisher’s Note: MDPI stays neutral with regard to jurisdictional claims in published maps and institutional affiliations. |
© 2021 by the authors. Licensee MDPI, Basel, Switzerland. This article is an open access article distributed under the terms and conditions of the Creative Commons Attribution (CC BY) license (https://creativecommons.org/licenses/by/4.0/).
Share and Cite
Kim, H.-K.; Yoo, K.-W.; Kim, S.-J.; Jung, C.-H. Phase Transformations and Subsurface Changes in Three Dental Zirconia Grades after Sandblasting with Various Al2O3 Particle Sizes. Materials 2021, 14, 5321. https://doi.org/10.3390/ma14185321
Kim H-K, Yoo K-W, Kim S-J, Jung C-H. Phase Transformations and Subsurface Changes in Three Dental Zirconia Grades after Sandblasting with Various Al2O3 Particle Sizes. Materials. 2021; 14(18):5321. https://doi.org/10.3390/ma14185321
Chicago/Turabian StyleKim, Hee-Kyung, Kun-Woo Yoo, Seung-Joo Kim, and Chang-Ho Jung. 2021. "Phase Transformations and Subsurface Changes in Three Dental Zirconia Grades after Sandblasting with Various Al2O3 Particle Sizes" Materials 14, no. 18: 5321. https://doi.org/10.3390/ma14185321
APA StyleKim, H.-K., Yoo, K.-W., Kim, S.-J., & Jung, C.-H. (2021). Phase Transformations and Subsurface Changes in Three Dental Zirconia Grades after Sandblasting with Various Al2O3 Particle Sizes. Materials, 14(18), 5321. https://doi.org/10.3390/ma14185321