
Influence of 3d Transition Metal Doping on Lithium Stabilized Na-β″-Alumina Solid Electrolytes


Abstract
:1. Introduction
2. Materials and Methods
2.1. Sample Preparation
2.2. Sample Characterization
3. Results
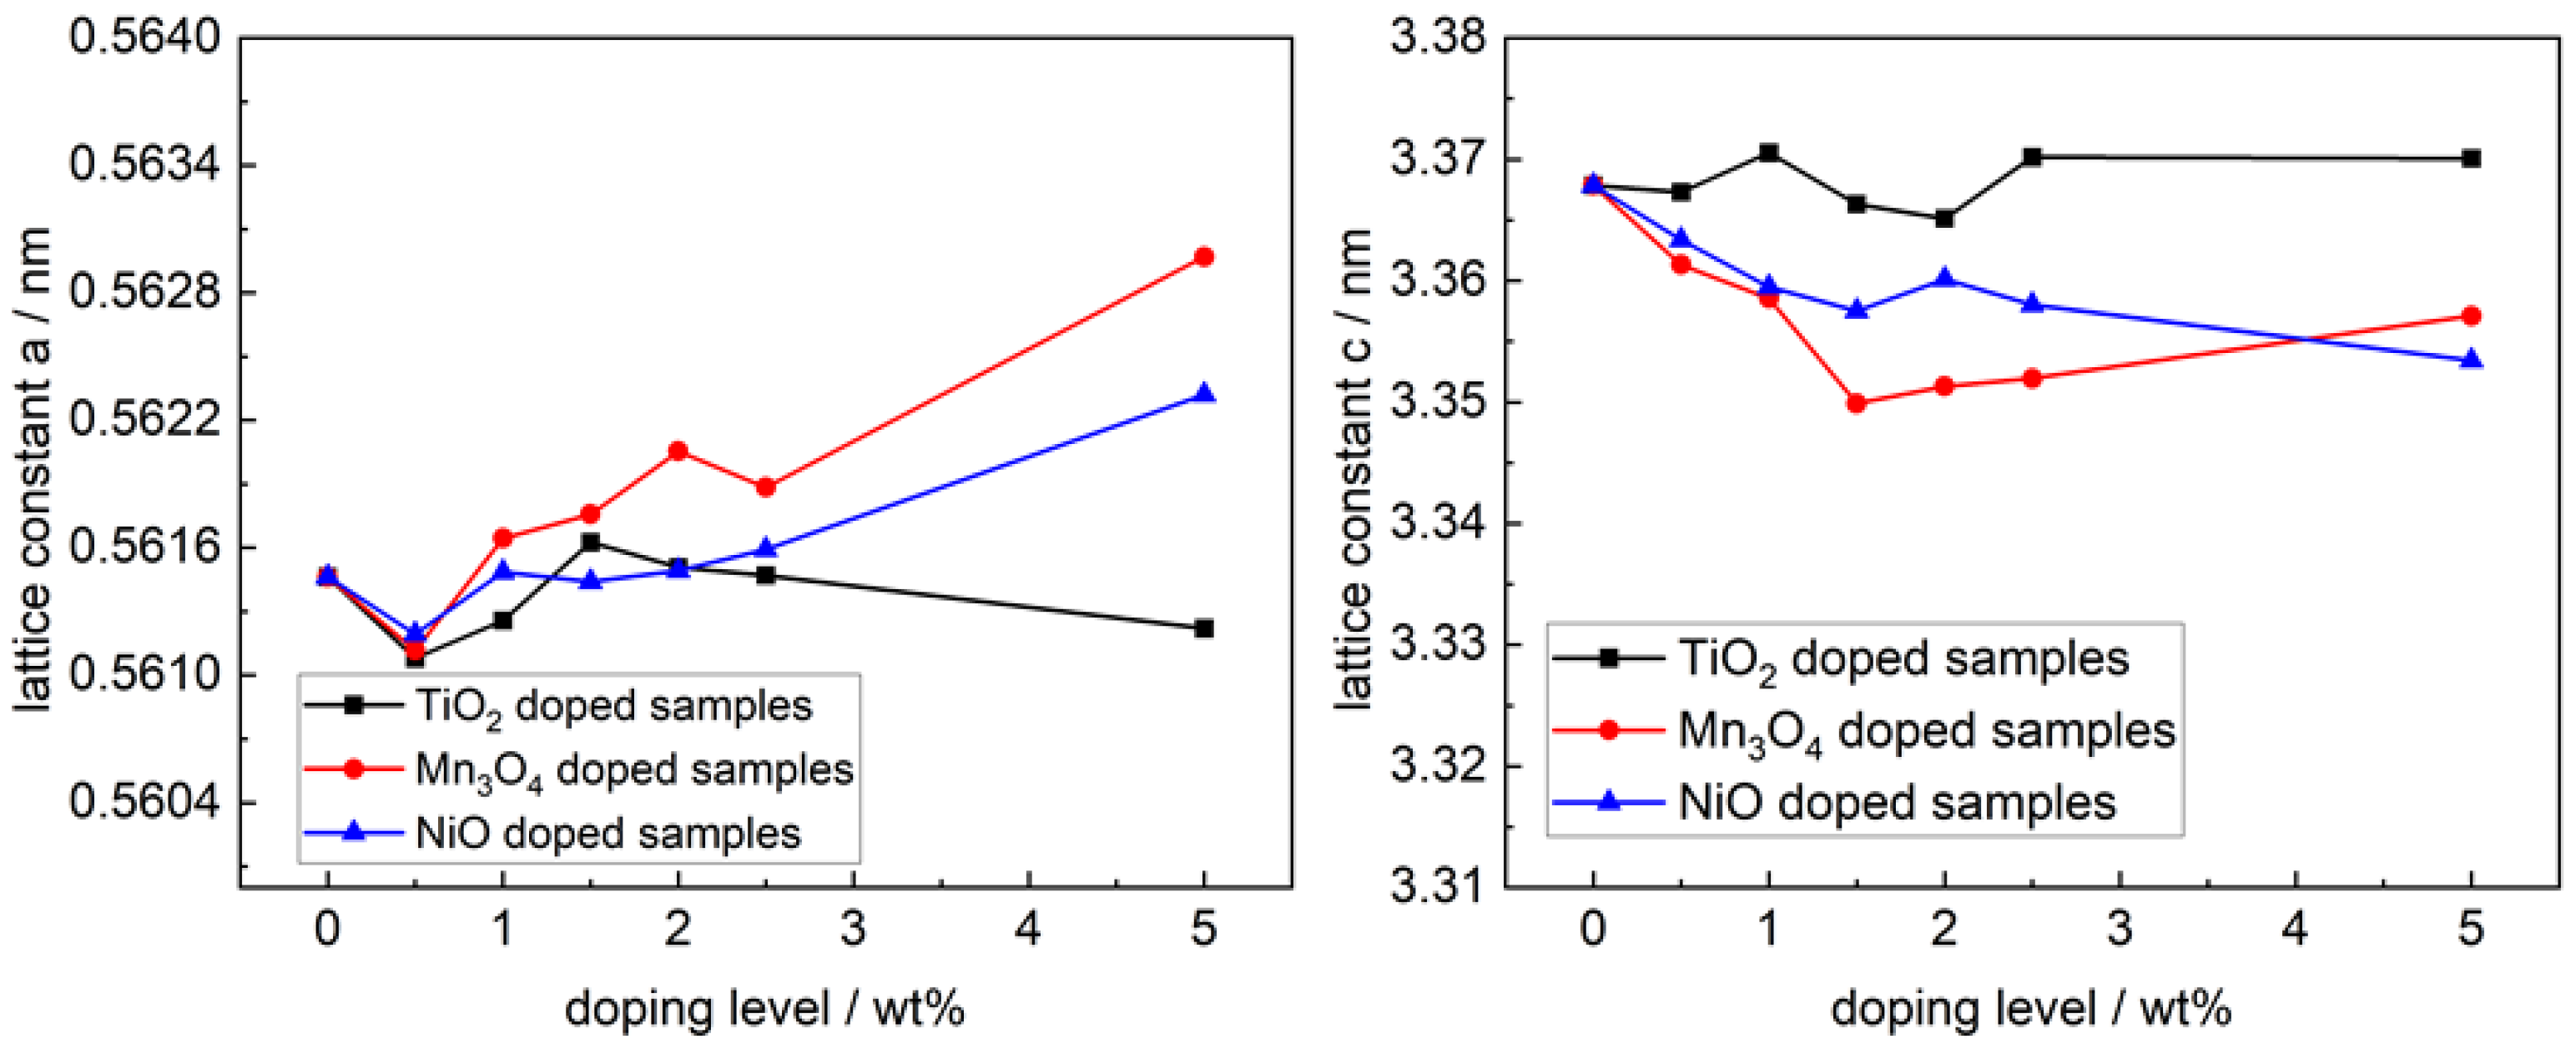
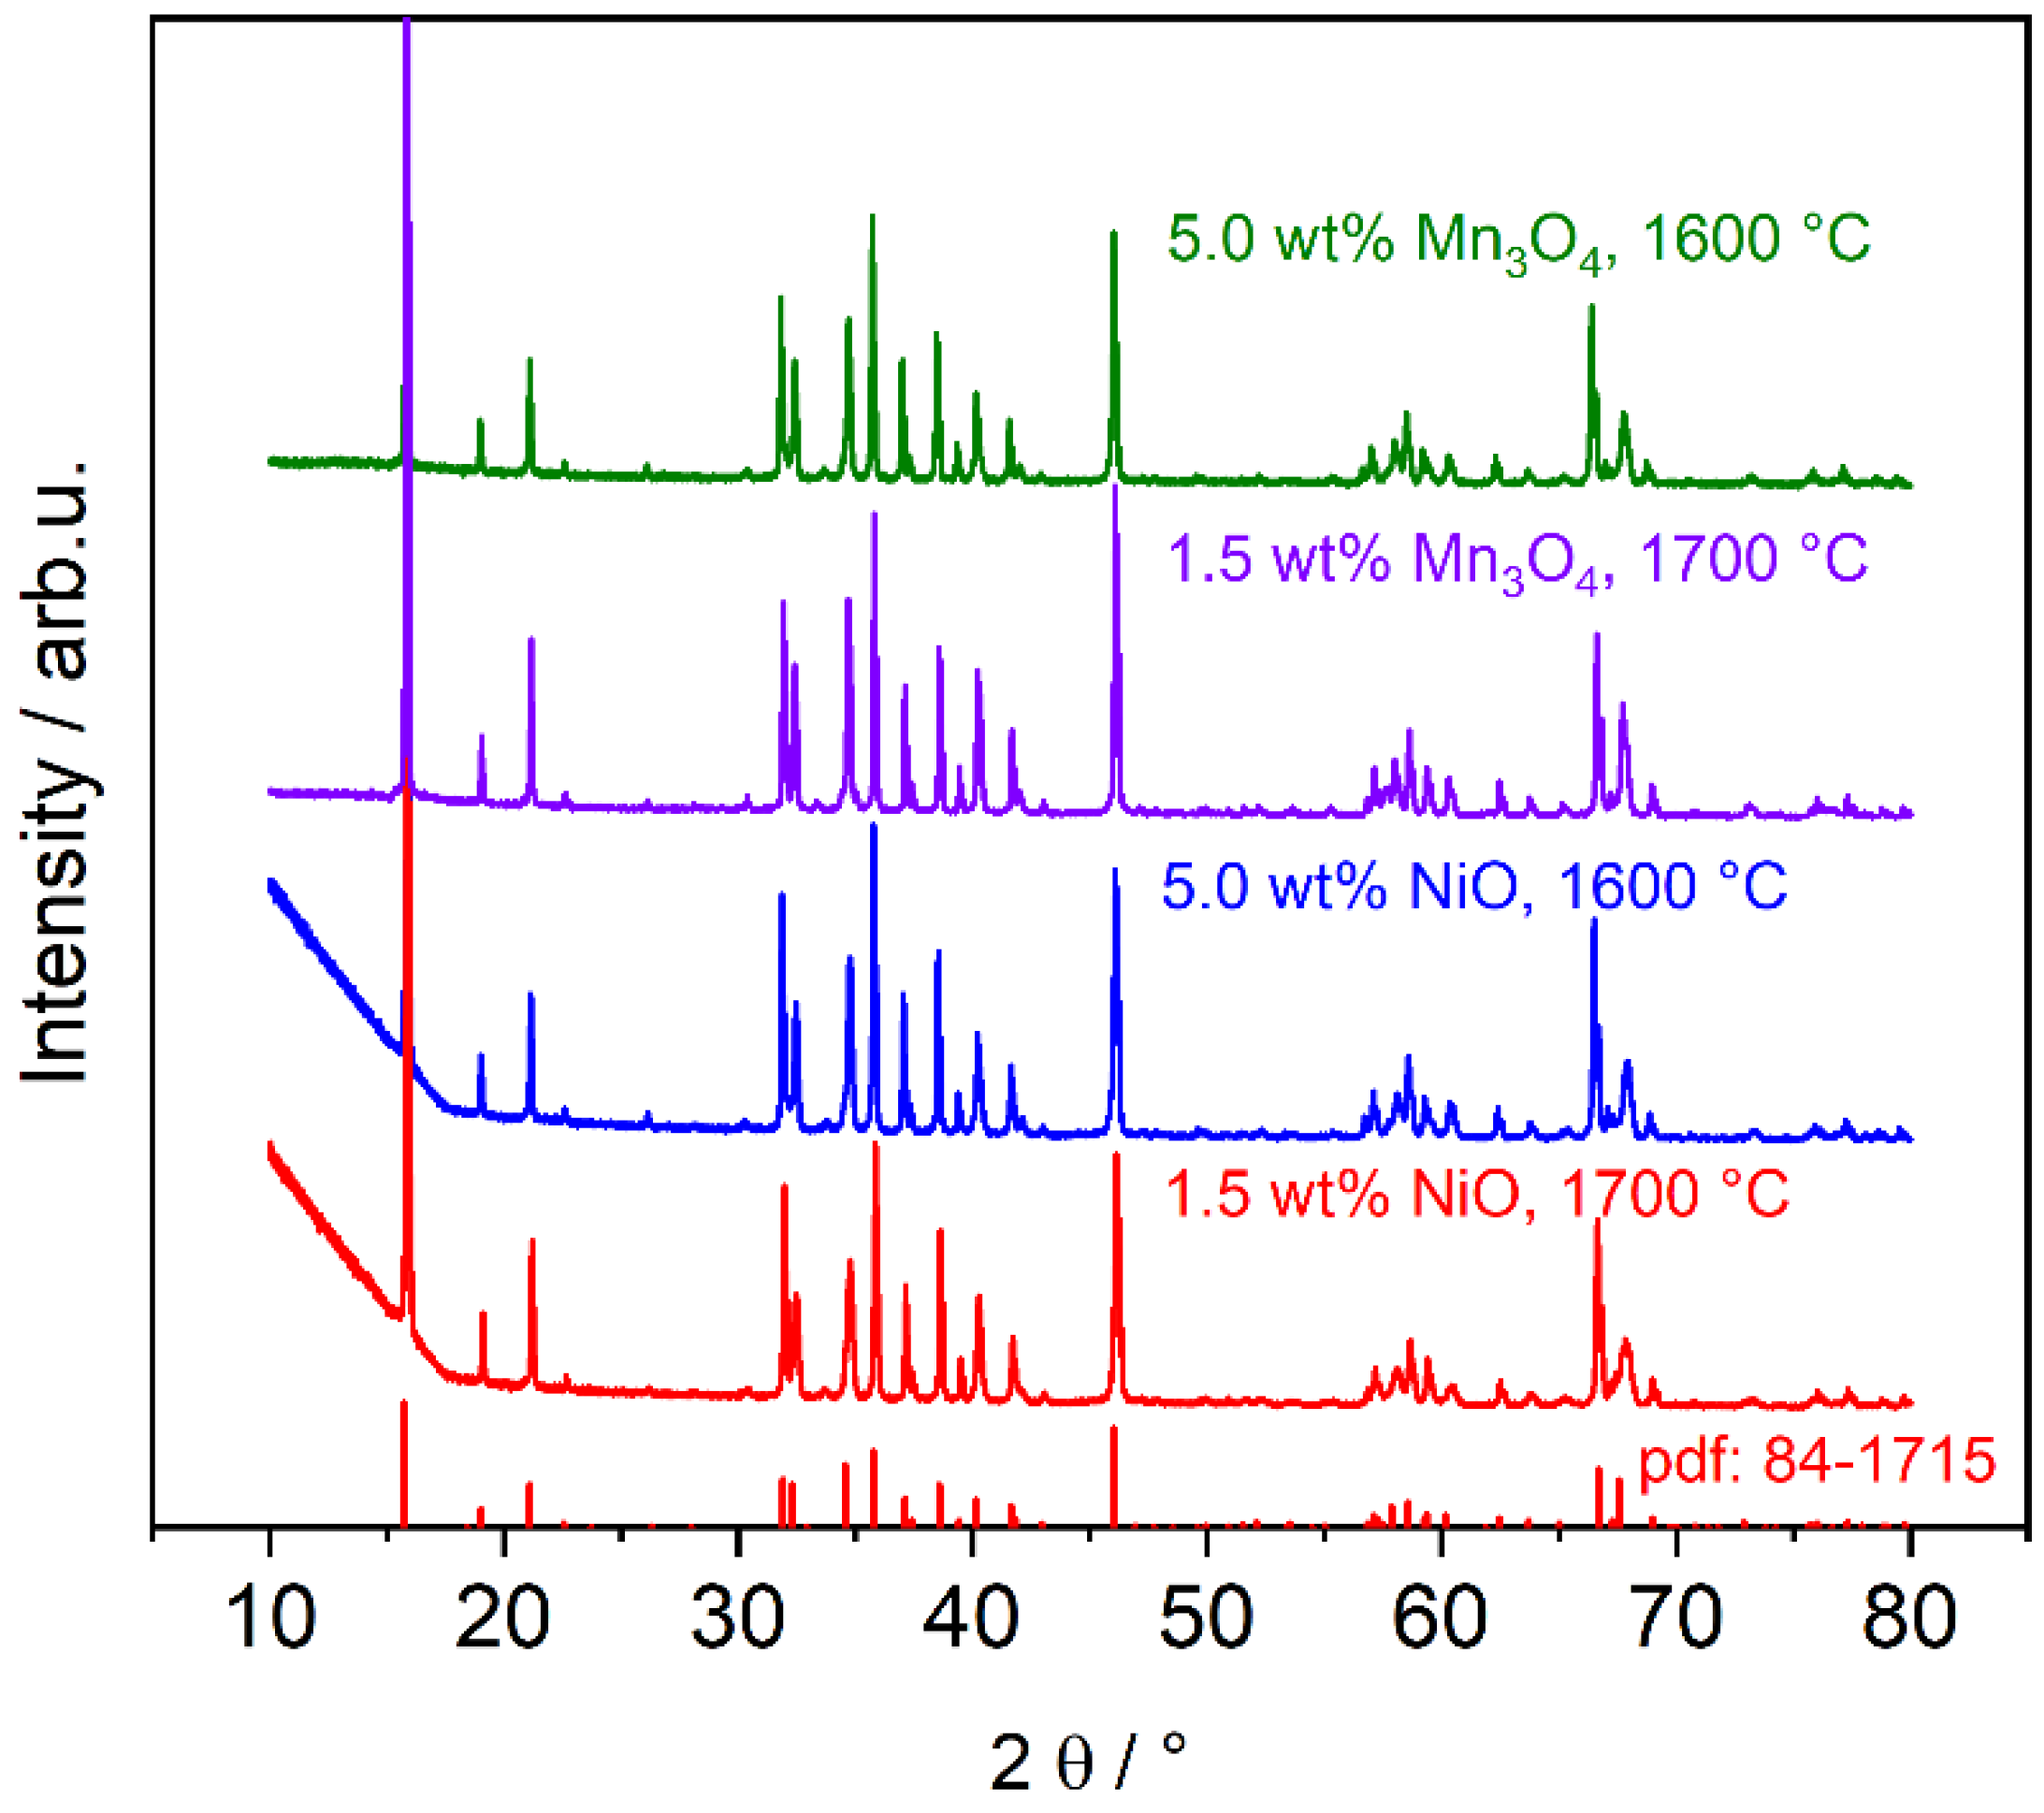
3.1. XRD Analysis
3.1.1. Phase Composition of TiO2-Doped Electrolytes
3.1.2. Phase Composition of Mn3O4- and NiO-Doped Electrolytes
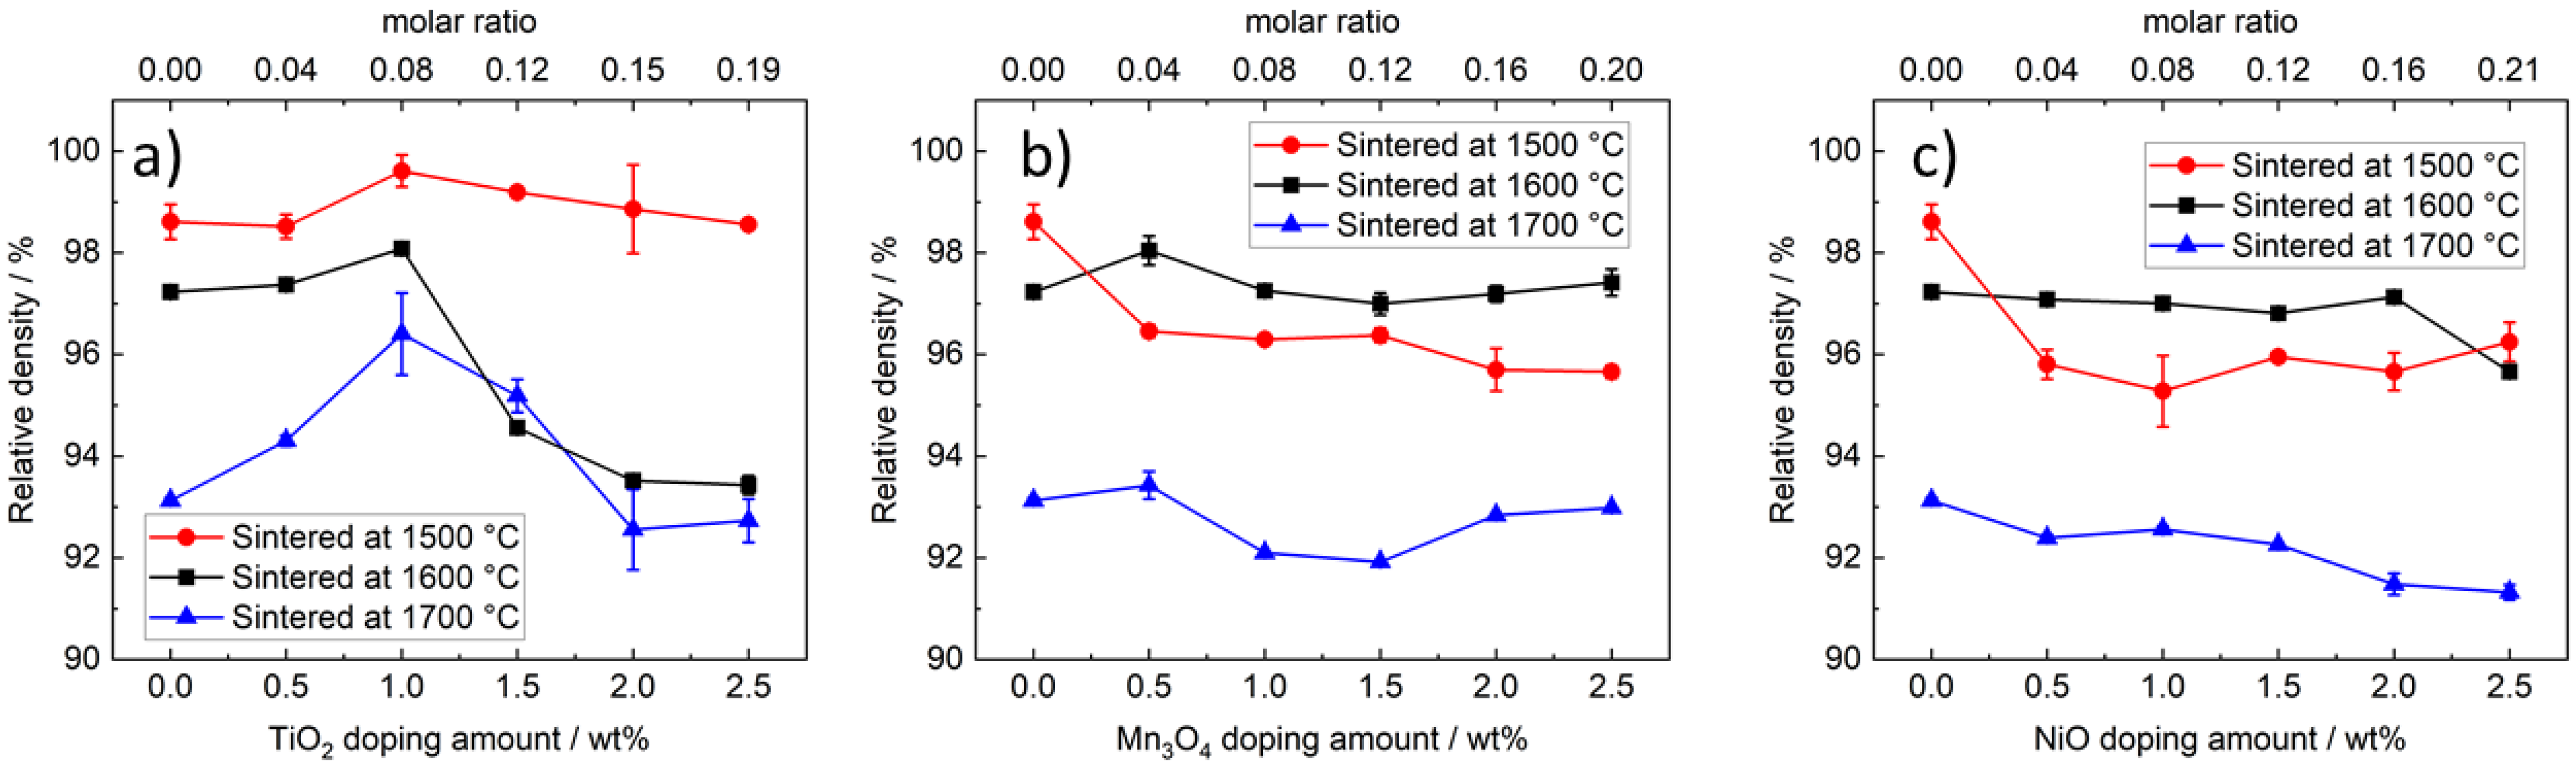
3.2. Density Analysis
3.2.1. Density of TiO2-Doped Na-β″-Alumina
3.2.2. Density of Mn3O4- and NiO-Doped Na-β″-Alumina
3.3. SEM and EDX Analysis
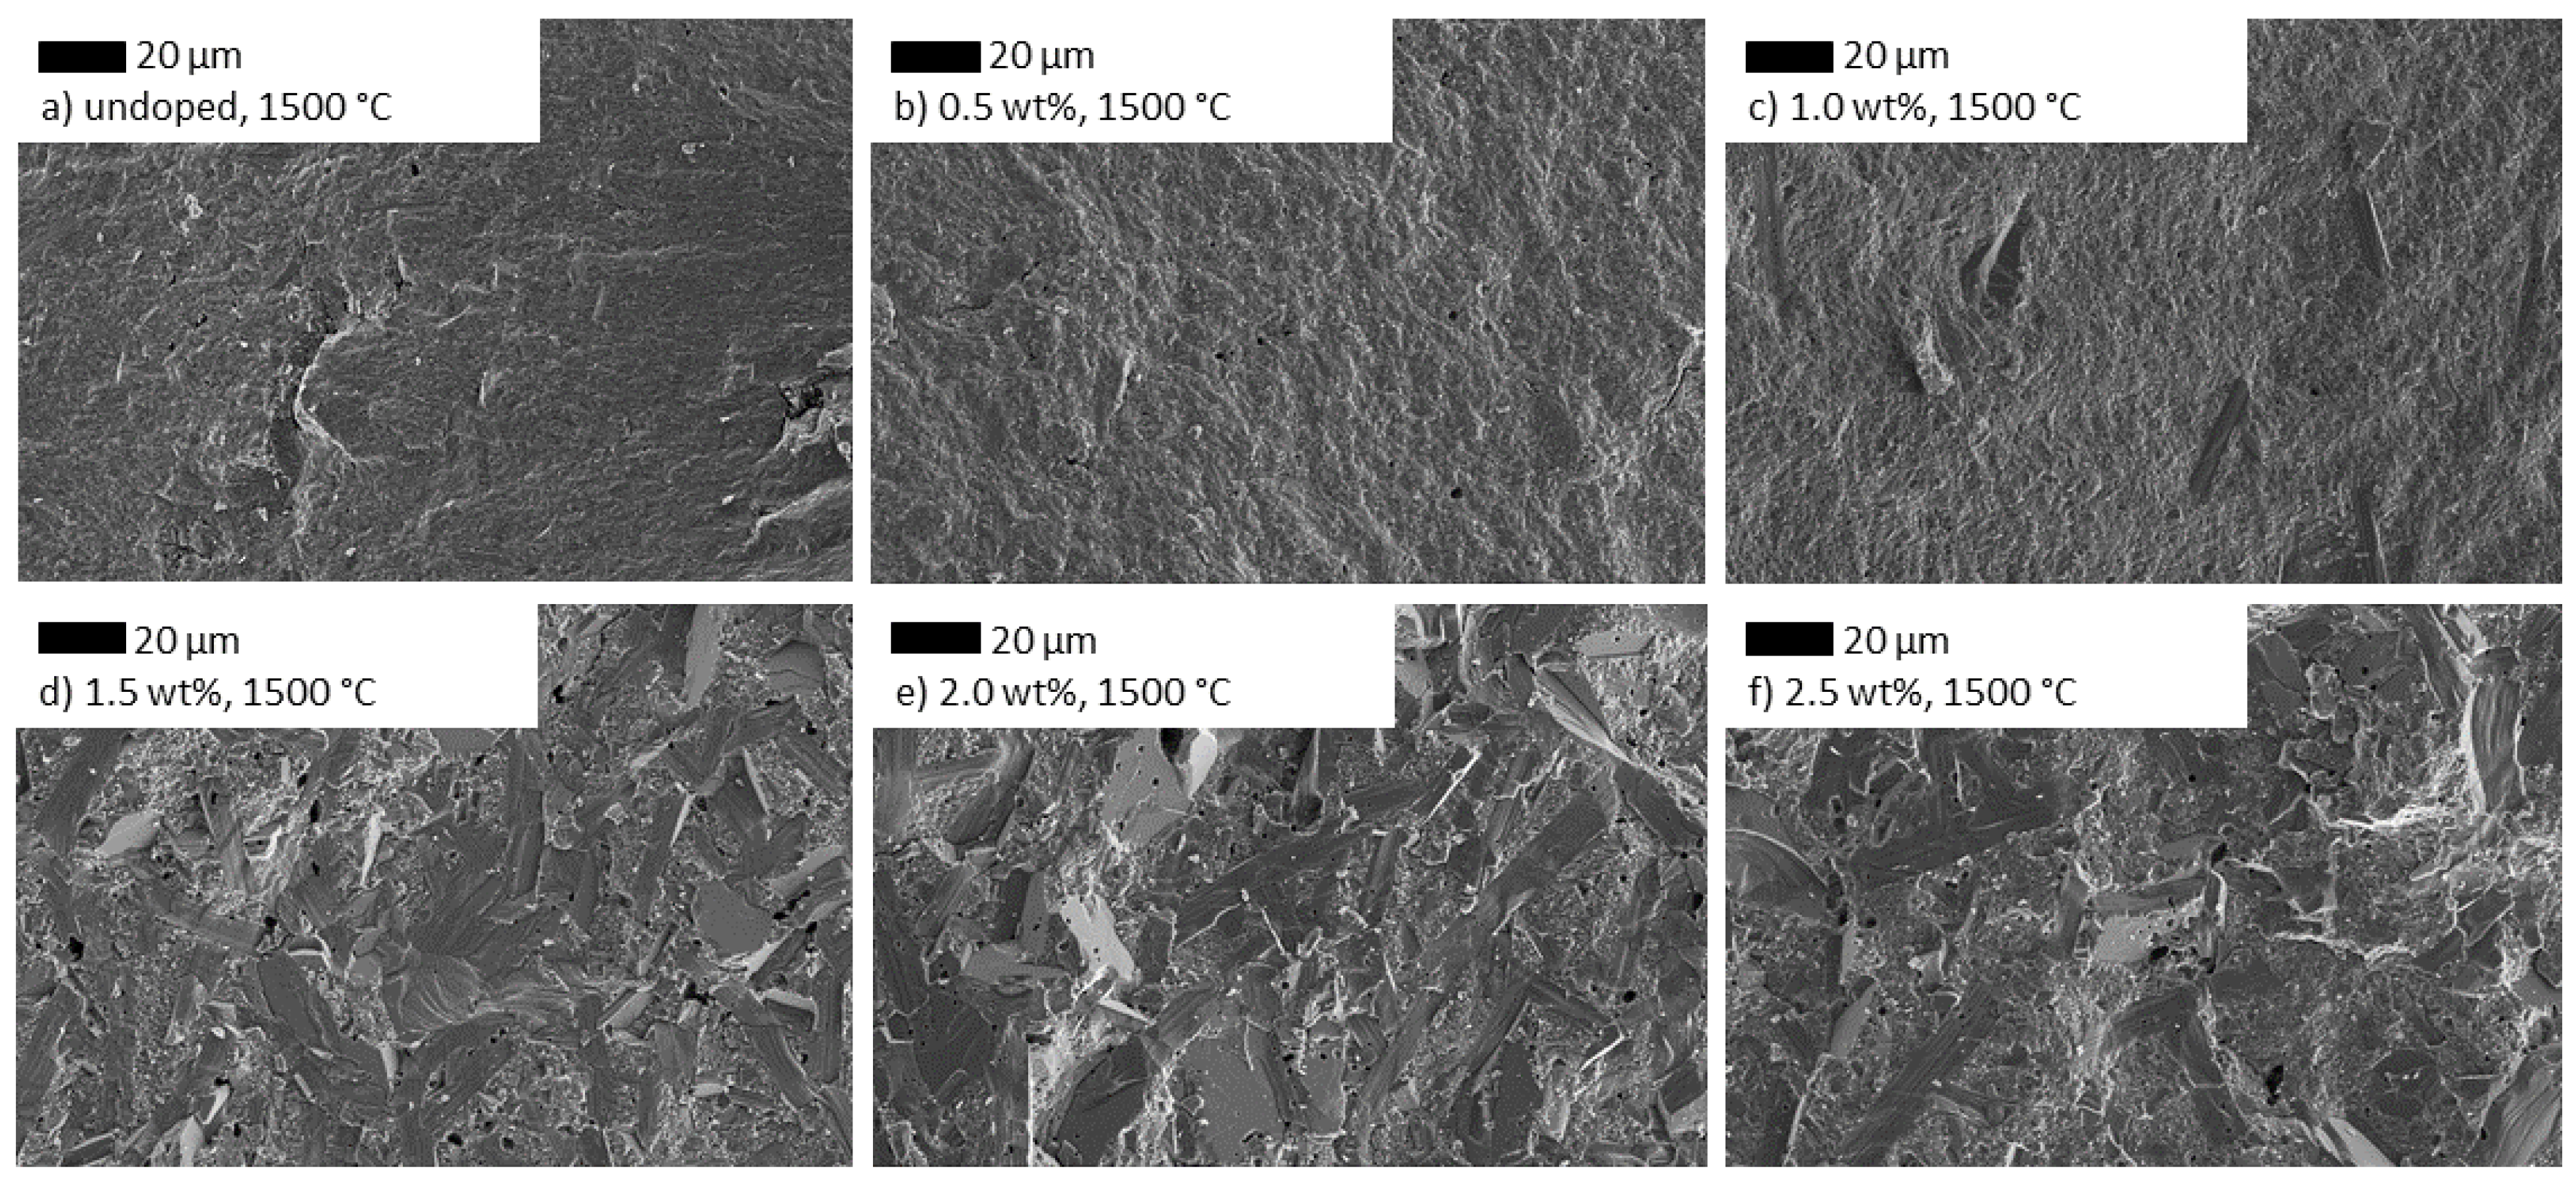
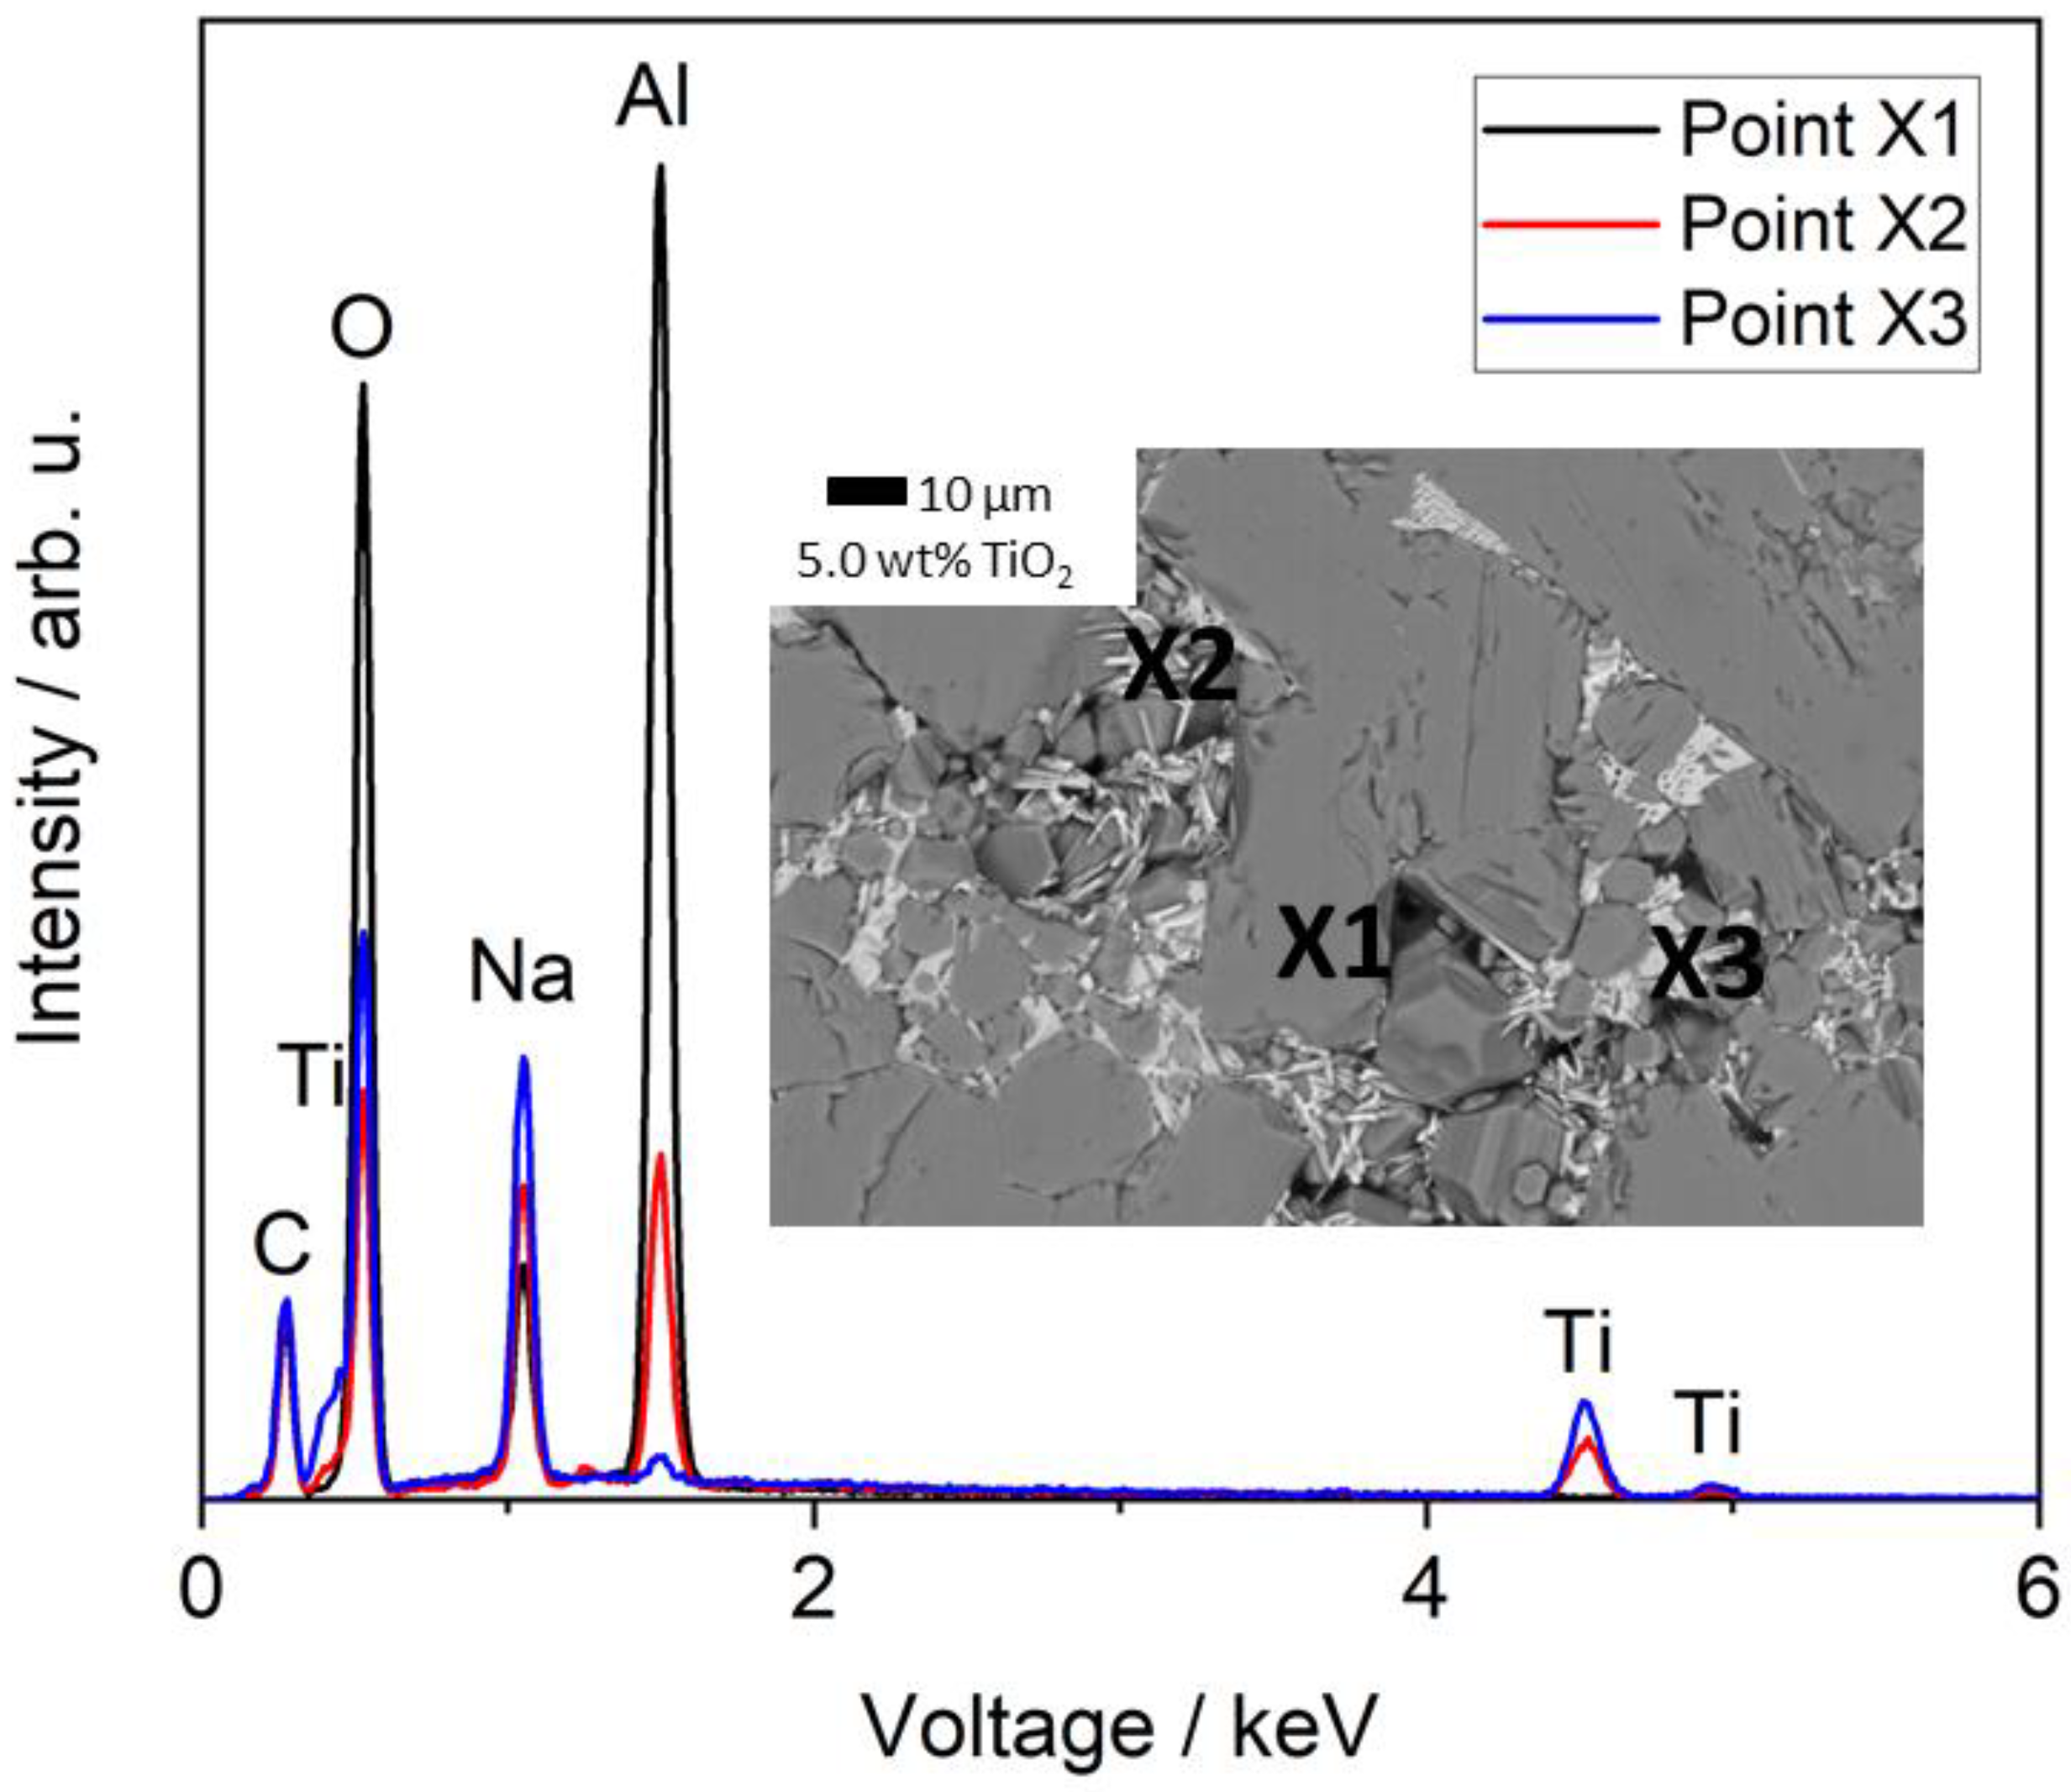
3.3.1. Influence of TiO2 Doping on the Microstructure
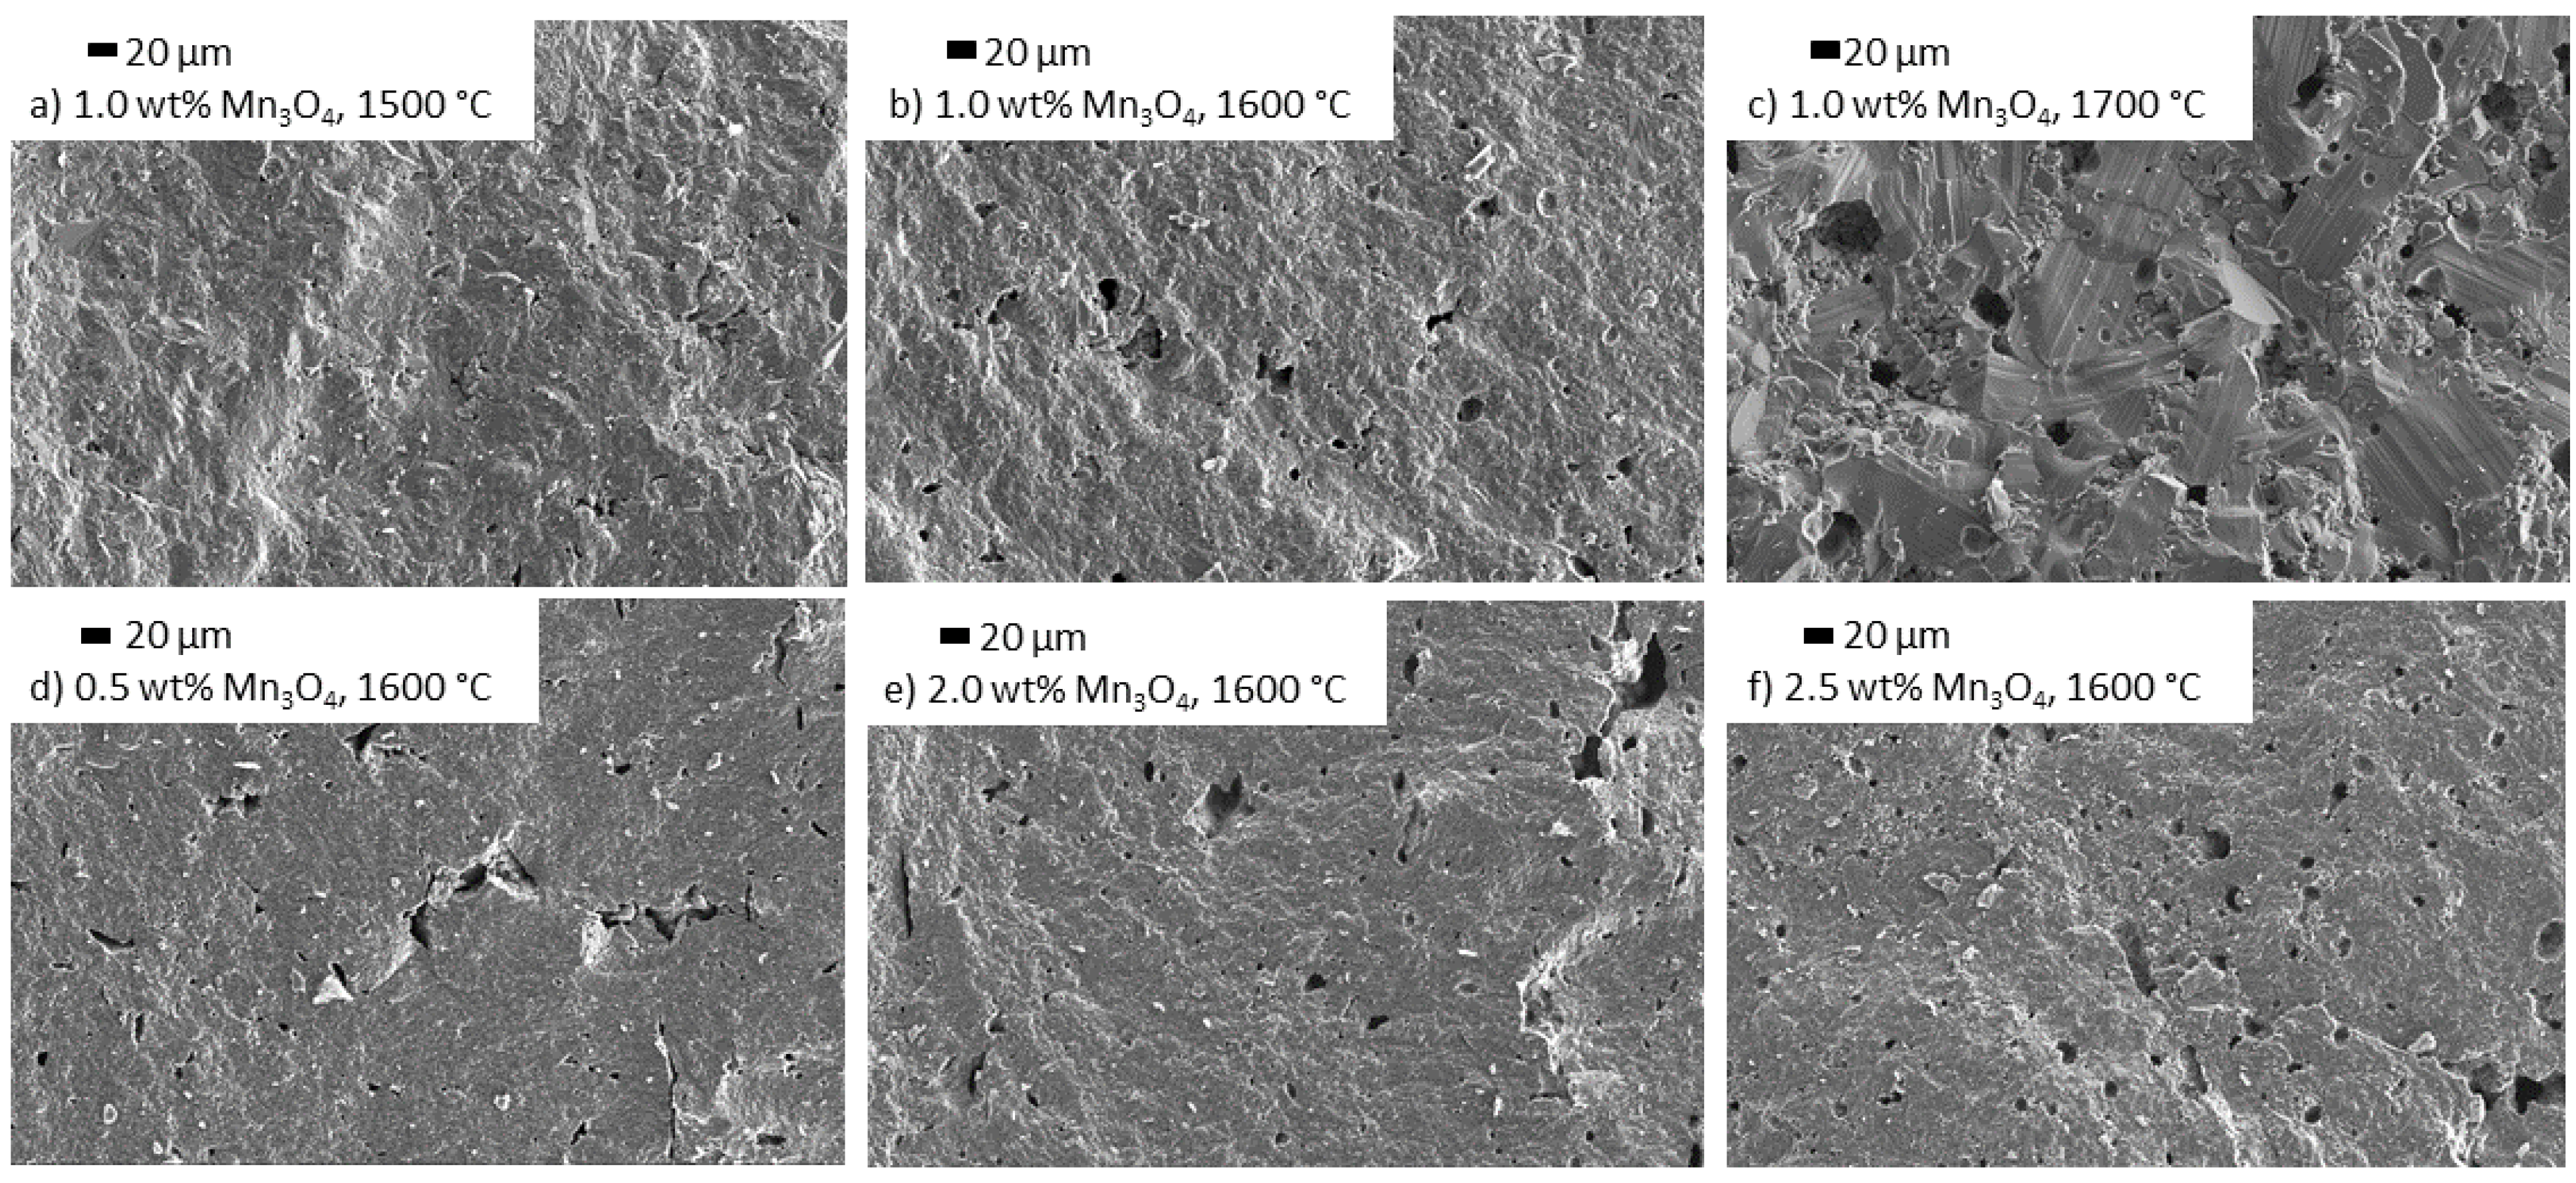
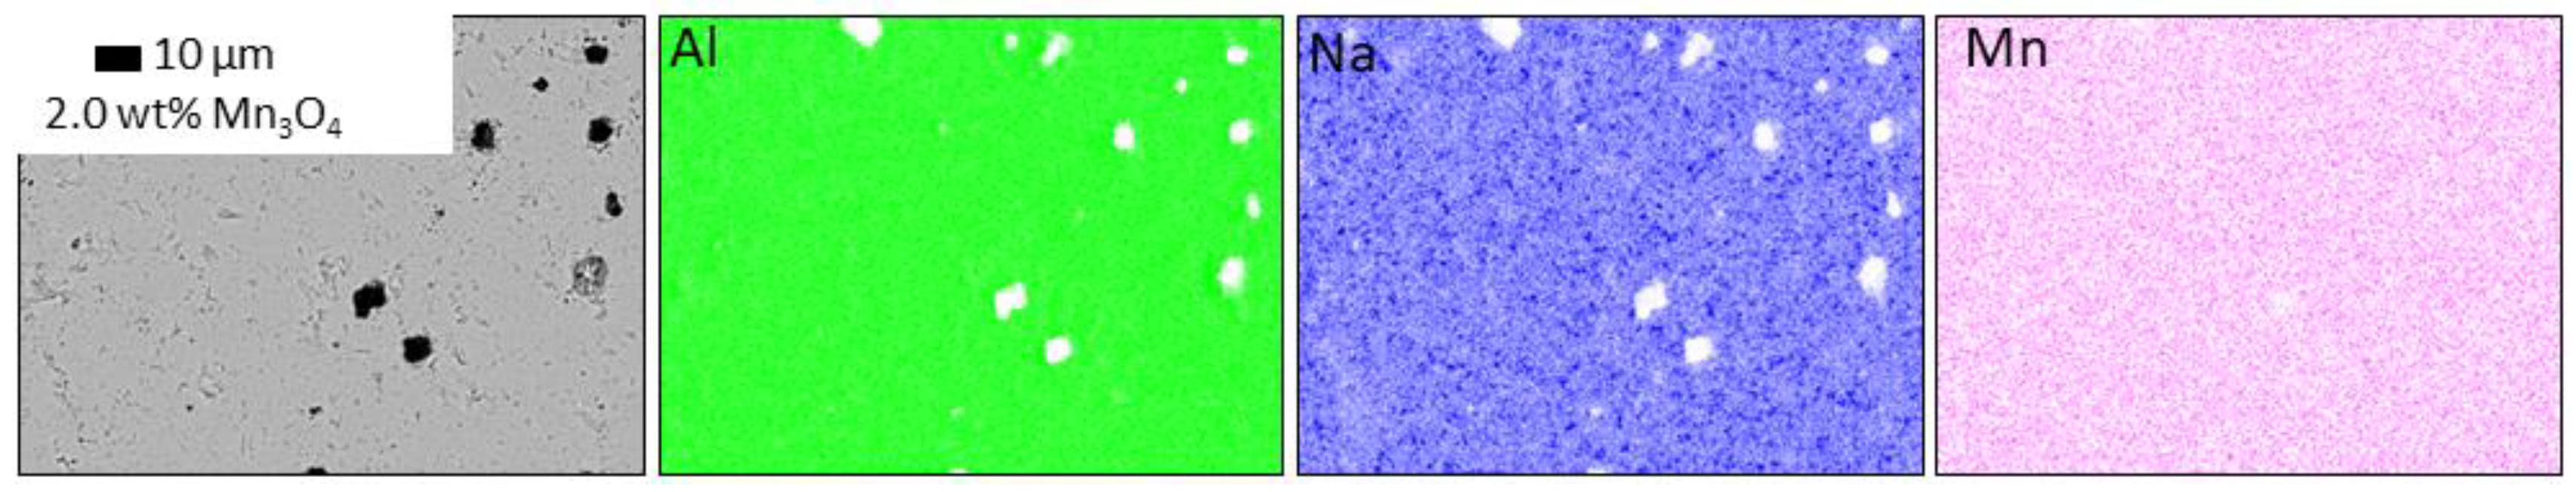
3.3.2. Influence of Mn3O4 Doping on the Microstructure
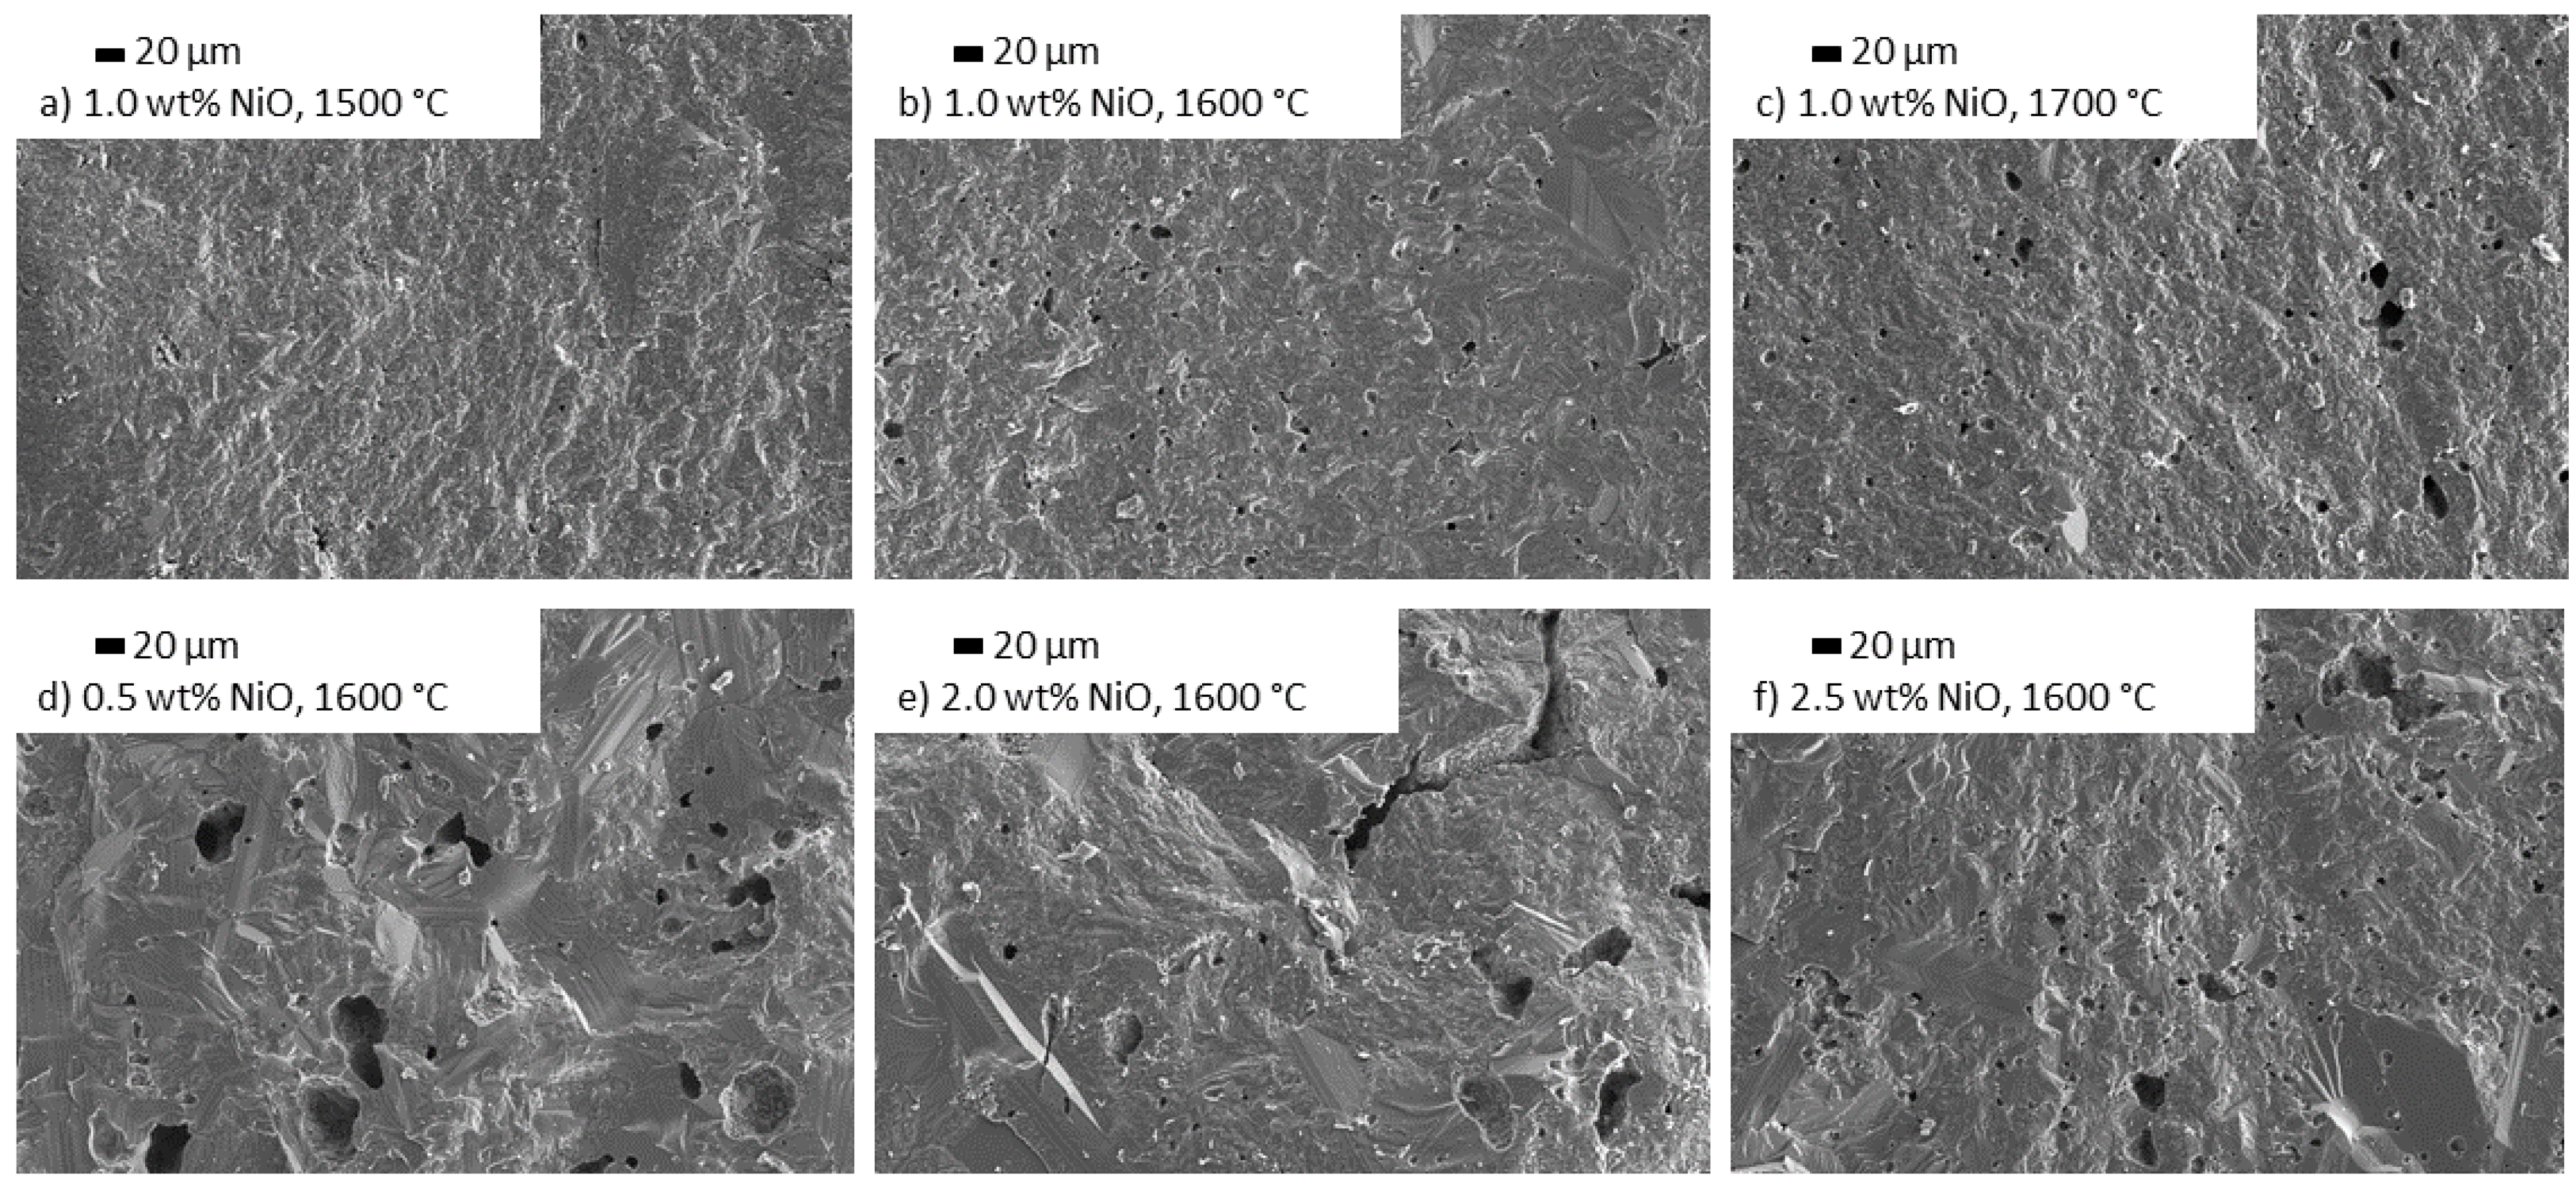
3.3.3. Influence of NiO Doping on the Microstructure
3.4. Fracture Strength Analysis
3.4.1. Influence of TiO2 Doping on the Fracture Strength
3.4.2. Influence of Mn3O4 Doping on the Fracture Strength
3.4.3. Influence of NiO Doping on the Fracture Strength
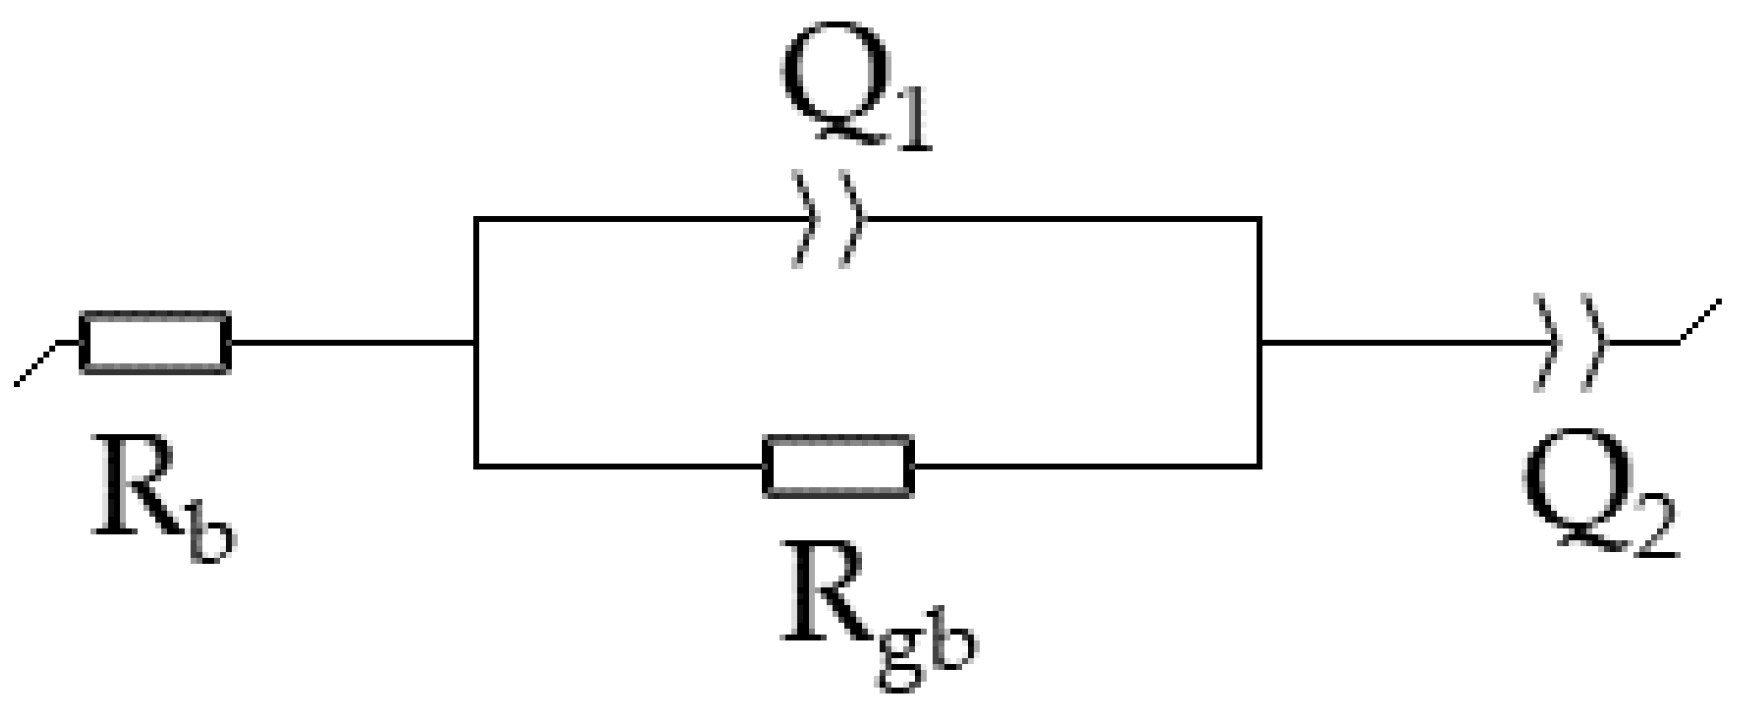
3.5. Ionic Conductivity Analysis
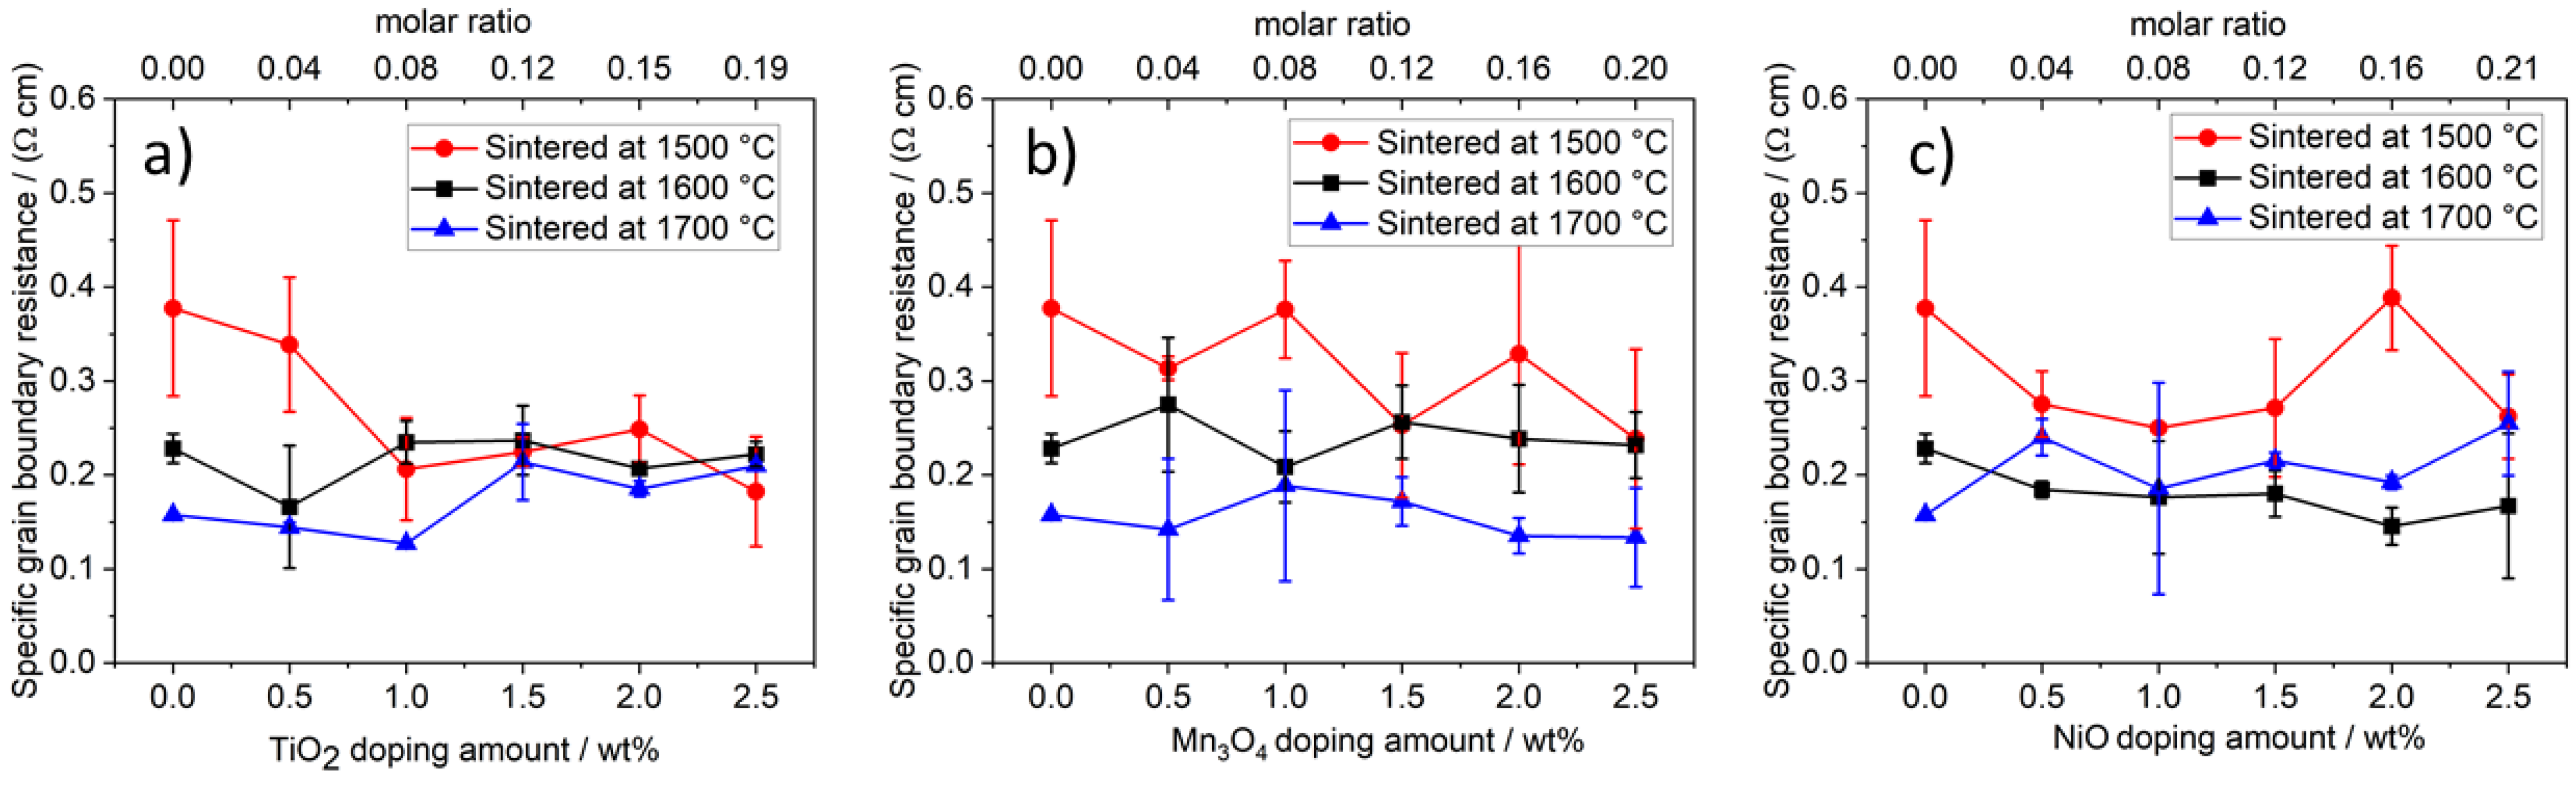
3.5.1. Influence of TiO2 Doping on the Ionic Conductivity
3.5.2. Influence of Mn3O4 and NiO Doping on the Ionic Conductivity
4. Conclusions
Supplementary Materials
Author Contributions
Funding
Institutional Review Board Statement
Informed Consent Statement
Data Availability Statement
Conflicts of Interest
References
- Wang, Y.; Song, S.; Xu, C.; Hu, N.; Molenda, J.; Lu, L. Development of solid-state electrolytes for sodium-ion battery–A short review. Nano Mater. Sci. 2019, 1, 91–100. [Google Scholar] [CrossRef]
- Sudworth, J. The sodium/nickel chloride (ZEBRA) battery. J. Power Sources 2001, 100, 149–163. [Google Scholar] [CrossRef]
- Ligon, S.C.; Blugan, G.; Bay, M.-C.; Battaglia, C.; Heinz, M.V.; Graule, T. Performance analysis of Na-β″-Al2O3/YSZ solid electrolytes produced by conventional sintering and by vapor conversion of α-Al2O3/YSZ. Solid State Ion. 2020, 345, 115169. [Google Scholar] [CrossRef]
- Agustina, A.I.; Skadell, K.; Dirksen, C.L.; Schulz, M.; Kusumocahyo, S.P. Sol-gel method for synthesis of Li+-stabilized Na-β″-alumina for solid electrolytes in sodium-based batteries. In AIP Conference Proceedings; AIP Publishing LLC.: Melville, NY, USA, 2019; p. 20070. [Google Scholar] [CrossRef]
- Butee, S.; Kambale, K.; Firodiya, M. Electrical properties of sodium beta-alumina ceramics synthesized by citrate sol-gel route using glycerine. PAC 2016, 10, 67–72. [Google Scholar] [CrossRef]
- Lin, J.; Wen, Z.; Wang, X.; Song, S.; Liu, Y. Mechanochemical synthesis of Na-β/β″-Al2O3. J. Solid State Electrochem. 2010, 14, 1821–1827. [Google Scholar] [CrossRef]
- Park, J.H.; Kim, K.H.; Cho, J.M.; Lim, S.K. Fabrication of beta- and beta’’-Al2O3 tubes by pressureless powder packing forming and salt infiltration. J. Mater. Sci. 1998, 33, 5695–5702. [Google Scholar] [CrossRef]
- Lu, X.; Xia, G.-G.; Lemmon, J.P.; Yang, Z. Advanced materials for sodium-beta alumina batteries: Status, challenges and perspectives. J. Power Sources 2010, 195, 2431–2442. [Google Scholar] [CrossRef]
- Hodge, J.D. Kinetics of the β″-to-β Transformation in the System Na2O-Al2O3. J. Am. Ceram. Soc. 1983, 66, 166–169. [Google Scholar] [CrossRef]
- Park, J.-H.; Kim, K.-H.; Lim, S.-K. Influence of stabilizers on Na-β′′-Al2O3 phase formation in Li2O(MgO)-Na2O-Al2O3 ternary systems. J. Mater. Sci. 1998, 33, 5671–5675. [Google Scholar] [CrossRef]
- De Jonghe, L.C. Grain boundaries and ionic conduction in sodium beta alumina. J. Mater. Sci. 1979, 14, 33–48. [Google Scholar] [CrossRef]
- Heinz, M.V.; Graeber, G.; Landmann, D.; Battaglia, C. Pressure management and cell design in solid-electrolyte batteries, at the example of a sodium-nickel chloride battery. J. Power Sources 2020, 465, 228268. [Google Scholar] [CrossRef]
- Dirksen, C.L.; Skadell, K.; Schulz, M.; Stelter, M. Effects of TiO2 doping on Li+-stabilized Na-β″-alumina for energy storage applications. Sep. Purif. Technol. 2019, 213, 88–92. [Google Scholar] [CrossRef]
- Sudworth, J.L. The sodium/sulphur battery. J. Power Sources 1984, 11, 143–154. [Google Scholar] [CrossRef]
- Sudworth, J.L.; Barrow, P.; Dong, W.; Dunn, B.; Farrington, G.C.; Thomas, J.O. Toward Commercialization of the Beta-Alumina Family of Ionic Conductors. MRS Bull. 2000, 25, 22–26. [Google Scholar] [CrossRef]
- Sudworth, J.L.; Tilley, A.R. The Sodium Sulfur Battery; Chapman and Hall: London, UK, 1985; ISBN 0-412-16490-6. [Google Scholar]
- Sheng, Y.; Nicholson, P.S. Microstructural development of a ZrO2-Naß’’-Al2O3 composite. J. Mater. Sci. 1988, 982–986. [Google Scholar] [CrossRef]
- Yi, E.; Temeche, E.; Laine, R.M. Superionically conducting β′′-Al2O3 thin films processed using flame synthesized nanopowders. J. Mater. Chem. A 2018, 6, 12411–12419. [Google Scholar] [CrossRef]
- Moghadam, H.A.; Paydar, M.H. The Effect of Nano CuO as Sintering Aid on Phase Formation, Microstructure and Properties of Li2O-Stabilized b″-Alumina Ceramics. J. Ceram. Sci. Tech. 2016, 441–446. [Google Scholar] [CrossRef]
- Zhu, C.; Hong, Y.; Huang, P. Synthesis and characterization of NiO doped beta-Al2O3 solid electrolyte. J. Alloy. Compd. 2016, 688, 746–751. [Google Scholar] [CrossRef] [Green Version]
- Wei, X.; Cao, Y.; Lu, L.; Yang, H.; Shen, X. Synthesis and characterization of titanium doped sodium beta″-alumina. J. Alloy. Compd. 2011, 509, 6222–6226. [Google Scholar] [CrossRef]
- Shi, J.; Hong, Y.; Zhu, C. Effect of Chromium on Electrochemical and Mechanical Properties of Beta-Al2O3 Solid Electrolyte Synthesized Via a Citrate-Nitrate Combustion Method. Crystals 2020, 10, 987. [Google Scholar] [CrossRef]
- Yang, L.-P.; Shan, S.; Wei, X.; Liu, X.; Yang, H.; Shen, X. The mechanical and electrical properties of ZrO2–TiO2–Na-β/β″-alumina composite electrolyte synthesized via a citrate sol–gel method. Ceram. Int. 2014, 40, 9055–9060. [Google Scholar] [CrossRef]
- Chen, G.; Lu, J.; Li, L.; Chen, L.; Jiang, X. Microstructure control and properties of β″-Al2O3 solid electrolyte. J. Alloy. Compd. 2016, 673, 295–301. [Google Scholar] [CrossRef]
- Kennedy, J.H.; Akridge, J.R.; Kleitz, M. Complex plane analysis of the impedance and admittance of polycrystalline sodium-β-alumina doped with transition metal ions. Electrochim. Acta 1979, 24, 781–787. [Google Scholar] [CrossRef]
- Wasiucionek, M. Electrical properties of CoO, NiO, CuO and ZnO doped beta″-alumina. Solid State Ion. 1982, 7, 283–286. [Google Scholar] [CrossRef]
- Lu, X.; Li, G.; Kim, J.Y.; Meinhardt, K.D.; Sprenkle, V.L. Enhanced sintering of β″-Al2O3/YSZ with the sintering aids of TiO2 and MnO2. J. Power Sources 2015, 295, 167–174. [Google Scholar] [CrossRef] [Green Version]
- Erkalfa, H.; Misirli, Z.; Baykara, T. The effect of TiO2 and MnO2 on densification and microstructural development of alumina. Ceram. Int. 1998, 24, 81–90. [Google Scholar] [CrossRef]
- BAGLEY, R.D.; CUTLER, I.B.; Johnson, D.L. Effect of TiO2 on Initial Sintering of Al2O3. J. Am. Ceram. Soc. 1970, 53, 136–141. [Google Scholar] [CrossRef]
- Bay, M.-C.; Heinz, M.V.F.; Figi, R.; Schreiner, C.; Basso, D.; Zanon, N.; Vogt, U.F.; Battaglia, C. Impact of Liquid Phase Formation on Microstructure and Conductivity of Li-Stabilized Na-β″-alumina Ceramics. ACS Appl. Energy Mater. 2019, 2, 687–693. [Google Scholar] [CrossRef]
- Li, H.; Fan, H.; Zhang, J.; Wen, Y.; Chen, G.; Zhu, Y.; Lu, J.; Jiang, X.; Hu, B.; Ning, L. Sintering behavior and properties of lithium stabilized sodium β’’-alumina ceramics with YSZ addition. Ceram. Int. 2019, 45, 6744–6752. [Google Scholar] [CrossRef]
- Lee, S.-T.; Lee, D.-H.; Kim, J.-S.; Lim, S.-K. Influence of Fe and Ti addition on properties of Na+-β/β″-alumina solid electrolytes. Met. Mater. Int. 2017, 23, 246–253. [Google Scholar] [CrossRef]
- Boilot, J.P.; Théry, J. Influence de l’addition d’ions etrangers sur la stabilite relative et la conductivite electrique des phases de type alumine β et β″. Mater. Res. Bull. 1976, 11, 407–413. [Google Scholar] [CrossRef]
- Hodge, J.D. Phase Relations in the System Na2O-Li2O-Al2O3. J. Am. Ceram. Soc. 1984, 67, 183–185. [Google Scholar] [CrossRef]
- Morgan, P.E.D.; Koutsoutis, M.S. Phase Studies Concerning Sintering in Aluminas Doped with Ti4+. J. Am. Ceram. Soc. 1985, 68, C-156. [Google Scholar] [CrossRef]
- Boilot, J.P.; Kahn, A.; Thery, J.; Collongues, R.; Antoine, J.; Vivien, D.; Chevrette, C.; Gourier, D. Influence of foreign ions addition on relative stability and electrical conductivity of β and β″ alumina type phases localization of impurities. Electrochim. Acta 1977, 22, 741–745. [Google Scholar] [CrossRef]
- van Zyl, A.; Thackeray, M.M.; Duncan, G.K.; Kingon, A.I.; Heckroodt, R.O. The synthesis of beta alumina from aluminium hydroxide and oxyhydroxide precursors. Mater. Res. Bull. 1993, 28, 145–157. [Google Scholar] [CrossRef]
- Heinz, M.V.; Bay, M.-C.; Vogt, U.F.; Battaglia, C. Grain size effects on activation energy and conductivity: Na- β ″-alumina ceramics and ion conductors with highly resistive grain boundary phases. Acta Mater. 2021, 213, 116940. [Google Scholar] [CrossRef]
- Cooper, S.J.; Bertei, A.; Finegan, D.P.; Brandon, N.P. Simulated impedance of diffusion in porous media. Electrochim. Acta 2017, 251, 681–689. [Google Scholar] [CrossRef] [PubMed]
- Zhang, Y.; Chen, Y.; Chen, F. In-situ quantification of solid oxide fuel cell electrode microstructure by electrochemical impedance spectroscopy. J. Power Sources 2015, 277, 277–285. [Google Scholar] [CrossRef]


| TiO2 Doped | Mn3O4 Doped | NiO Doped | |||||
|---|---|---|---|---|---|---|---|
| Doping Amount/wt% | 1500 °C | 1600 °C | 1700 °C | 1600 °C | 1700 °C | 1600 °C | 1700 °C |
| 0 | 96.4 ± 0.1 | 96.3 ± 0.5 | 95.5 ± 1.7 | 96.3 ± 0.5 | 95.5 ± 1.7 | 96.3 ± 0.5 | 95.5 ± 1.7 |
| 0.5 | 96.4 ± 0.4 | 96.6 ± 0.4 | 96.2 ± 0.3 | 94.9 ± 0.3 | 93.8 ± 3.6 | 97.0 ± 0.1 | 94.6 ± 0.5 |
| 1.0 | 96.8 ± 0.5 | 96.4 ± 0.4 | 98.0 ± 0.4 | 94.1 ± 4.1 | 94.4 ± 1.0 | 96.3 ± 0.4 | 95.2 ± 0.5 |
| 1.5 | 95.5 ± 0.5 | 94.0 ± 0.6 | 94.1 ± 1.0 | 95.7 ± 0.5 | 95.3 ± 1.0 | 96.7 ± 1.5 | 96.7 ± 0.2 |
| 2.0 | 96.3 ± 0.8 | 95.9 ± 0.5 | 90.8 ± 0.6 | 93.5 ± 0.3 | 95.6 ± 2.4 | 94.8 ± 0.2 | 97.1 ± 0.5 |
| 2.5 | 94.8 ± 0.5 | 95.3 ± 0.2 | 96.7 ± 0.8 | 95.2 ± 0.2 | 93.9 ± 2.1 | 94.4 ± 0.2 | 96.8 ± 0.9 |
| 5.0 | 96.6 ± 1.1 | 92.5 ± 0.3 | 94.2 ± 1.7 | 93.9 ± 1.6 | 93.2 ± 0.9 | 95.5 ± 0.3 | 95.6 ± 1.2 |
Publisher’s Note: MDPI stays neutral with regard to jurisdictional claims in published maps and institutional affiliations. |
© 2021 by the authors. Licensee MDPI, Basel, Switzerland. This article is an open access article distributed under the terms and conditions of the Creative Commons Attribution (CC BY) license (https://creativecommons.org/licenses/by/4.0/).
Share and Cite
Dirksen, C.L.; Skadell, K.; Schulz, M.; Fertig, M.P.; Stelter, M. Influence of 3d Transition Metal Doping on Lithium Stabilized Na-β″-Alumina Solid Electrolytes. Materials 2021, 14, 5389. https://doi.org/10.3390/ma14185389
Dirksen CL, Skadell K, Schulz M, Fertig MP, Stelter M. Influence of 3d Transition Metal Doping on Lithium Stabilized Na-β″-Alumina Solid Electrolytes. Materials. 2021; 14(18):5389. https://doi.org/10.3390/ma14185389
Chicago/Turabian StyleDirksen, Cornelius L., Karl Skadell, Matthias Schulz, Micha P. Fertig, and Michael Stelter. 2021. "Influence of 3d Transition Metal Doping on Lithium Stabilized Na-β″-Alumina Solid Electrolytes" Materials 14, no. 18: 5389. https://doi.org/10.3390/ma14185389