
Influence of Infill Pattern on the Elastic Mechanical Properties of Fused Filament Fabrication (FFF) Parts through Experimental Tests and Numerical Analyses


Abstract
:1. Introduction
2. Materials and Methods
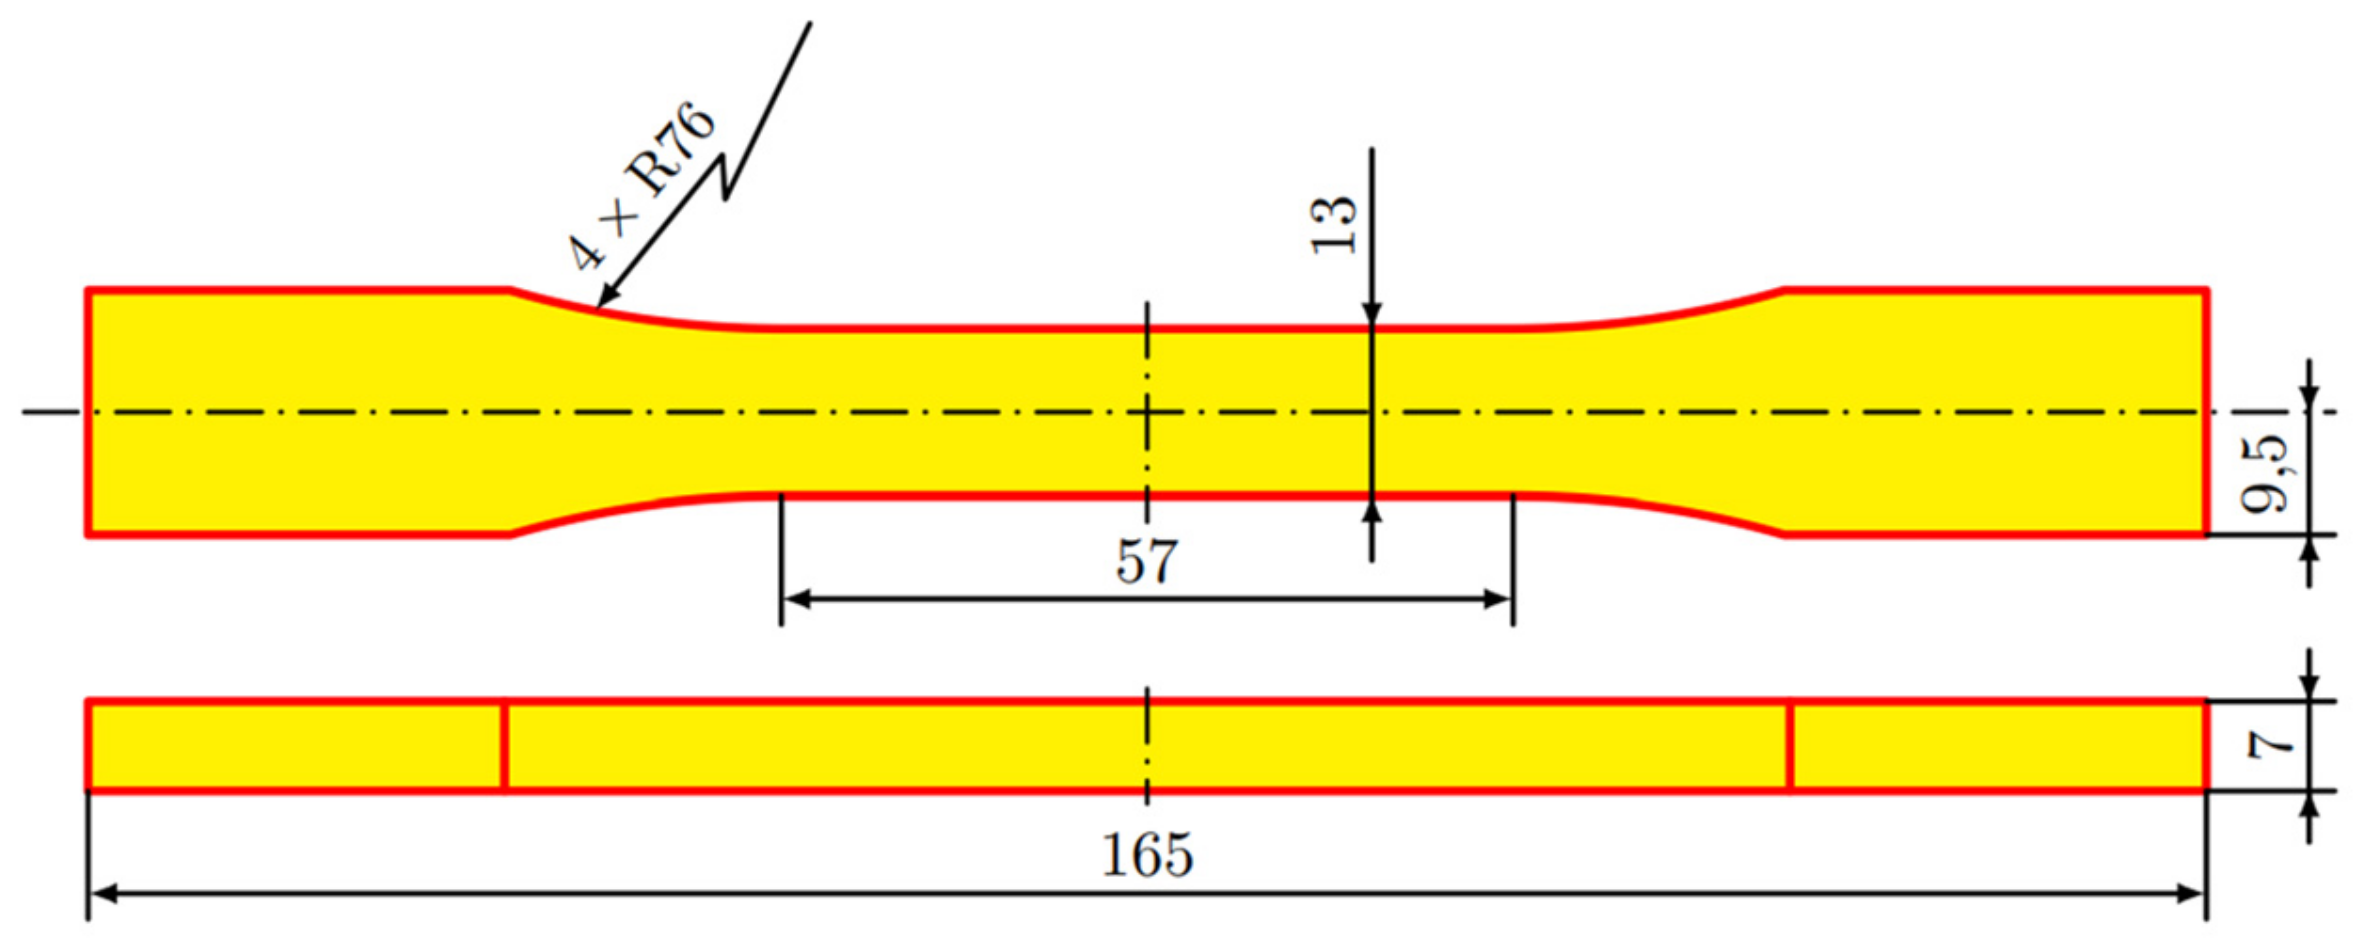
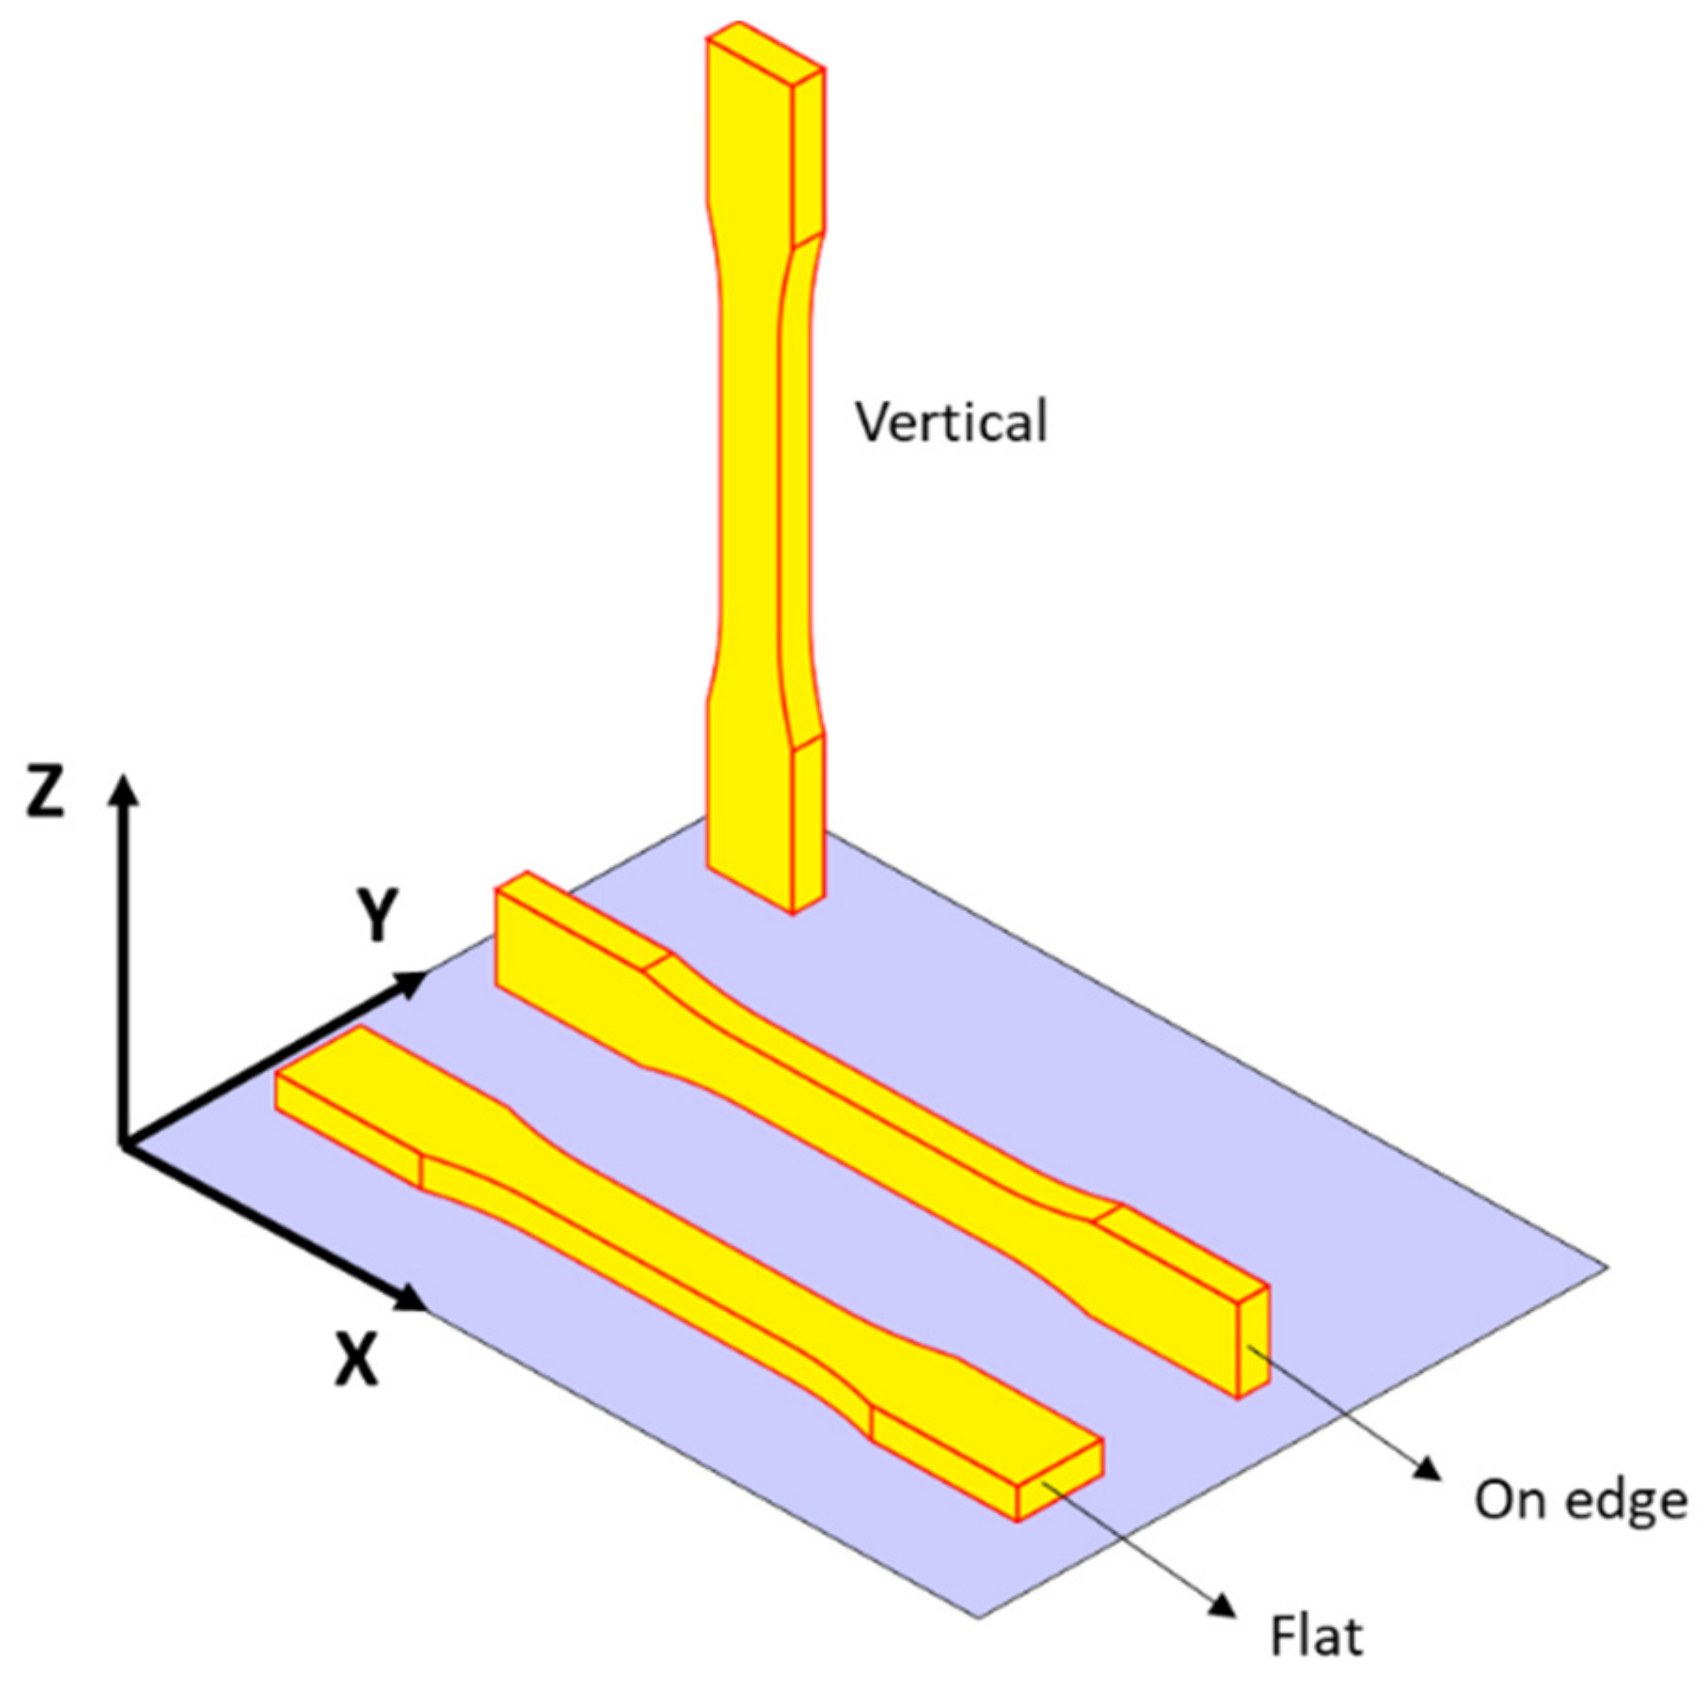
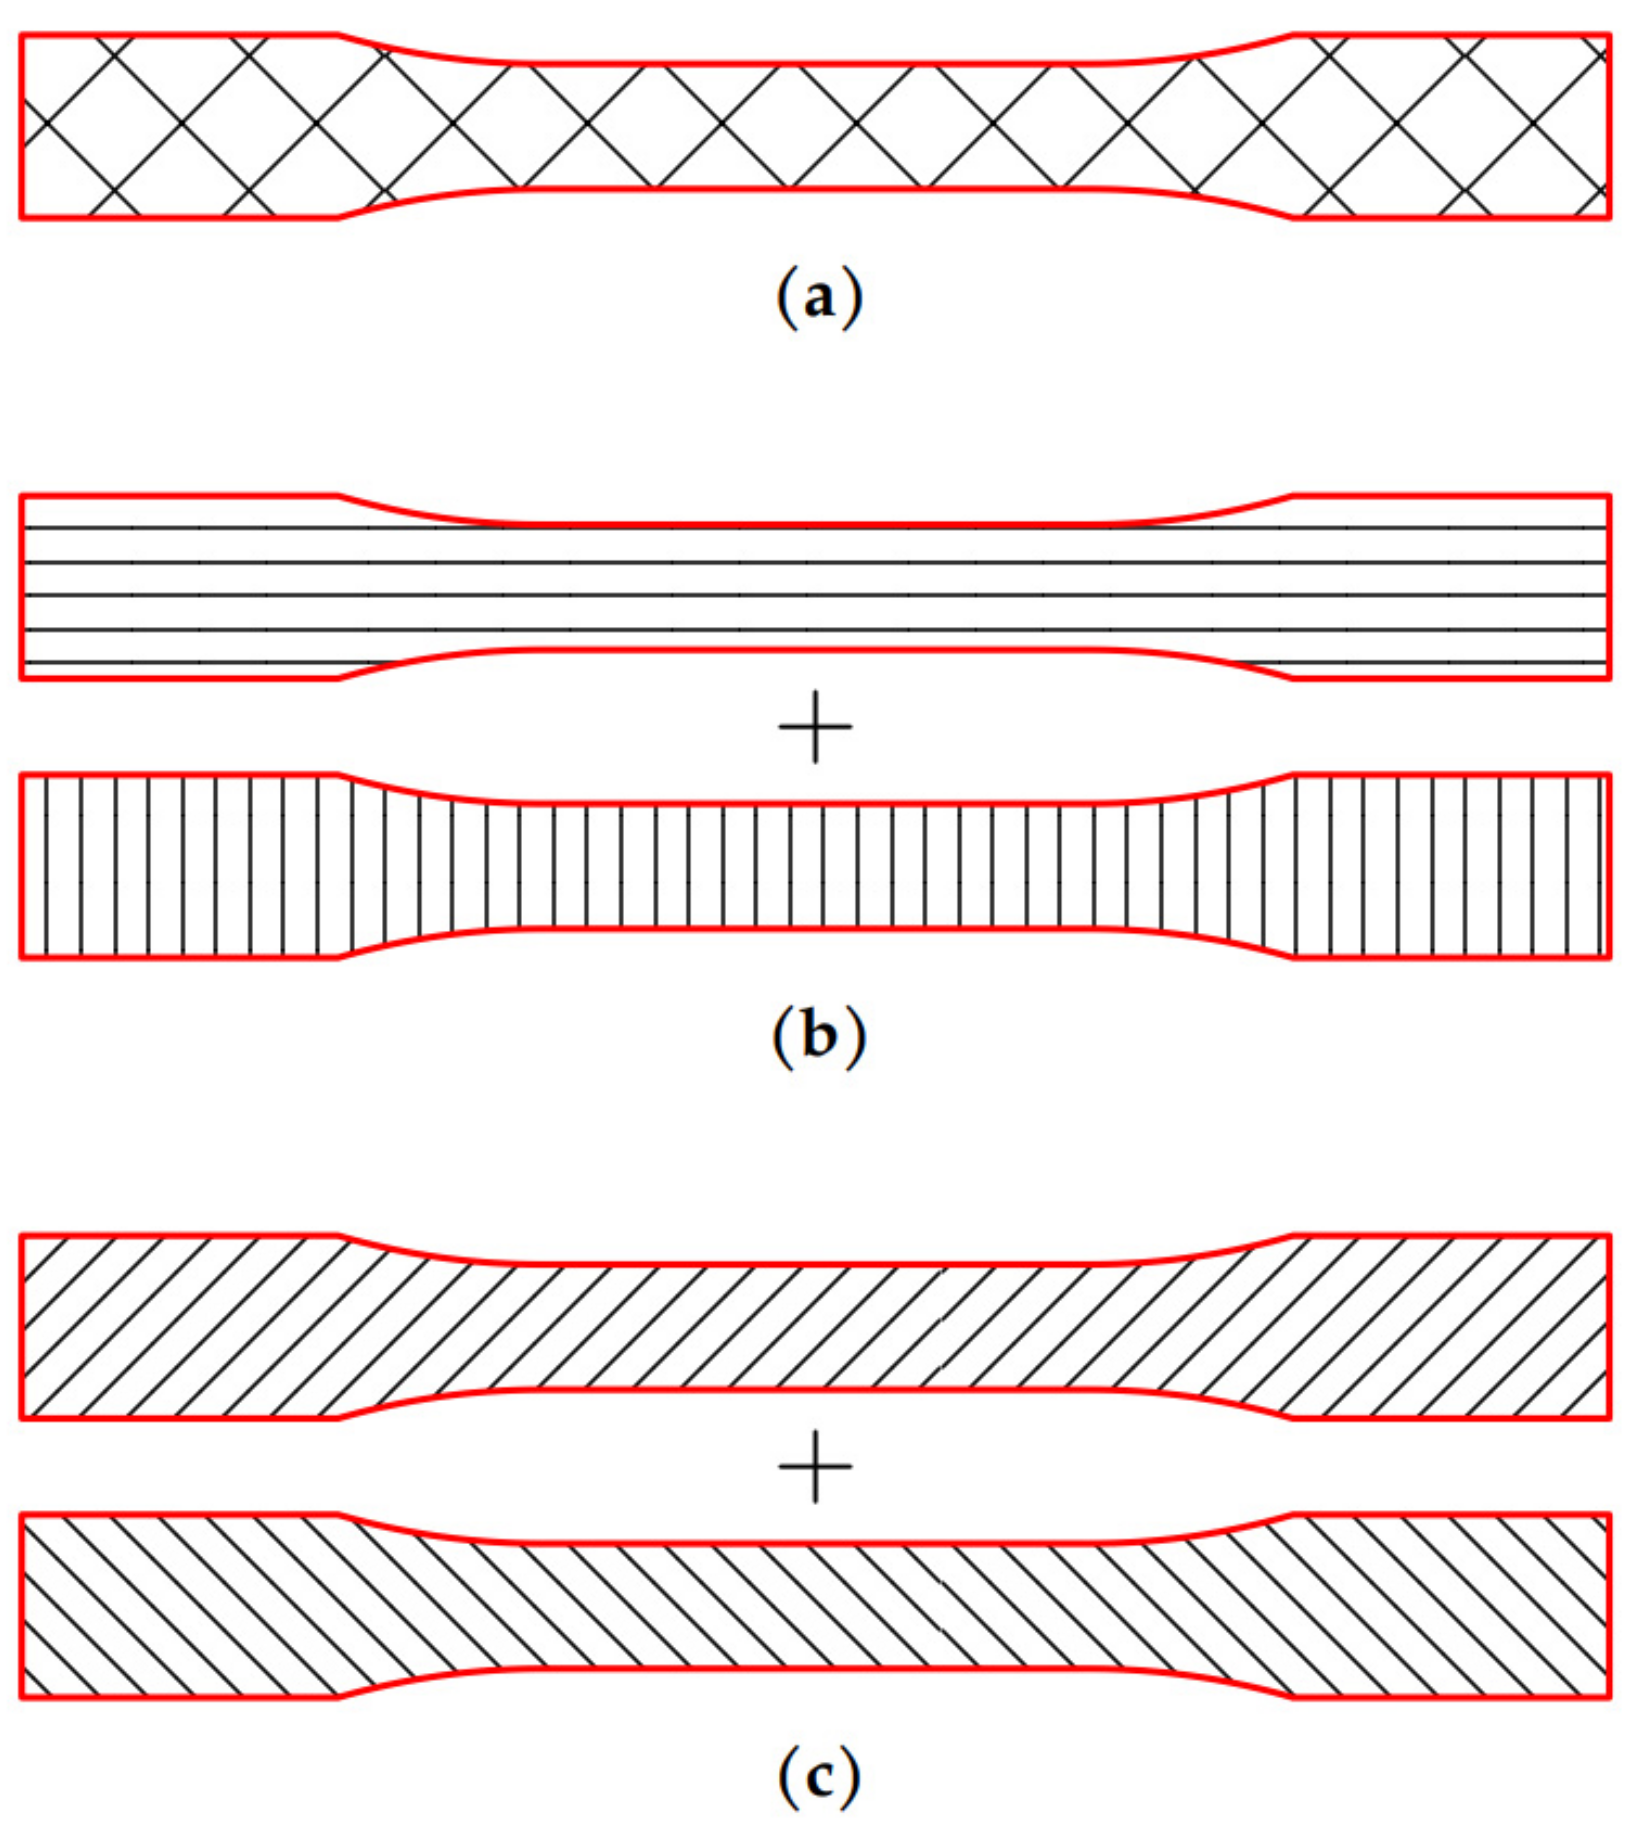
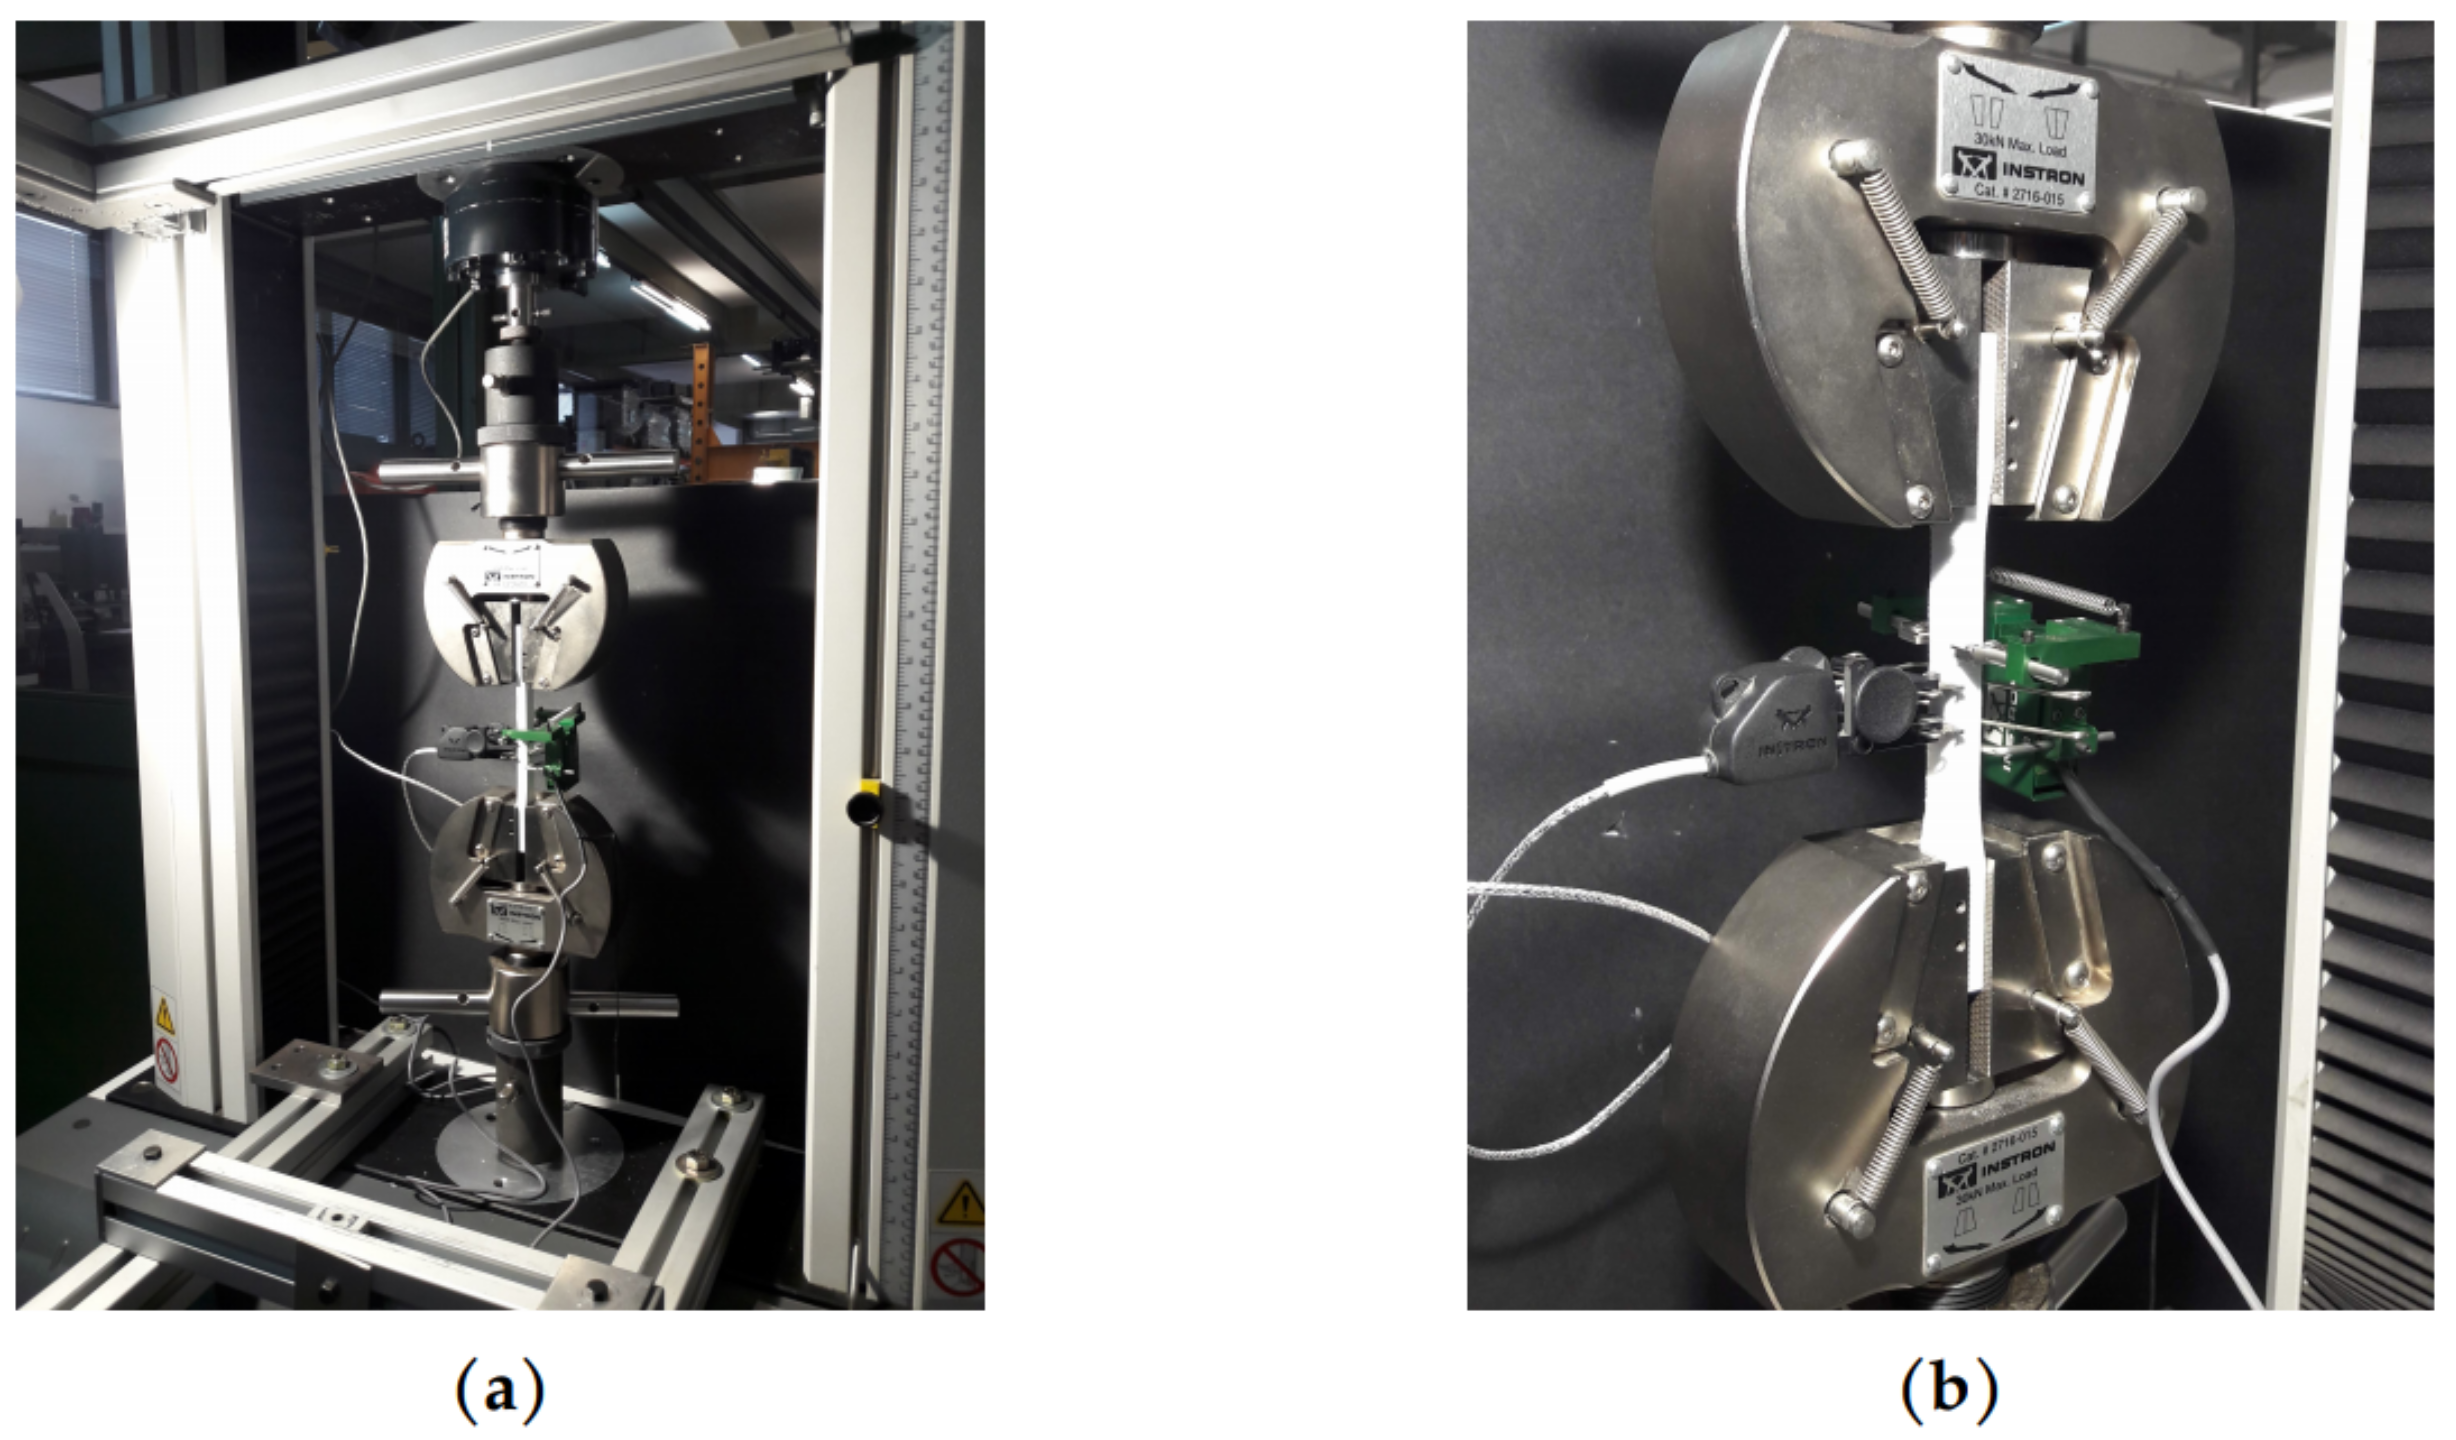
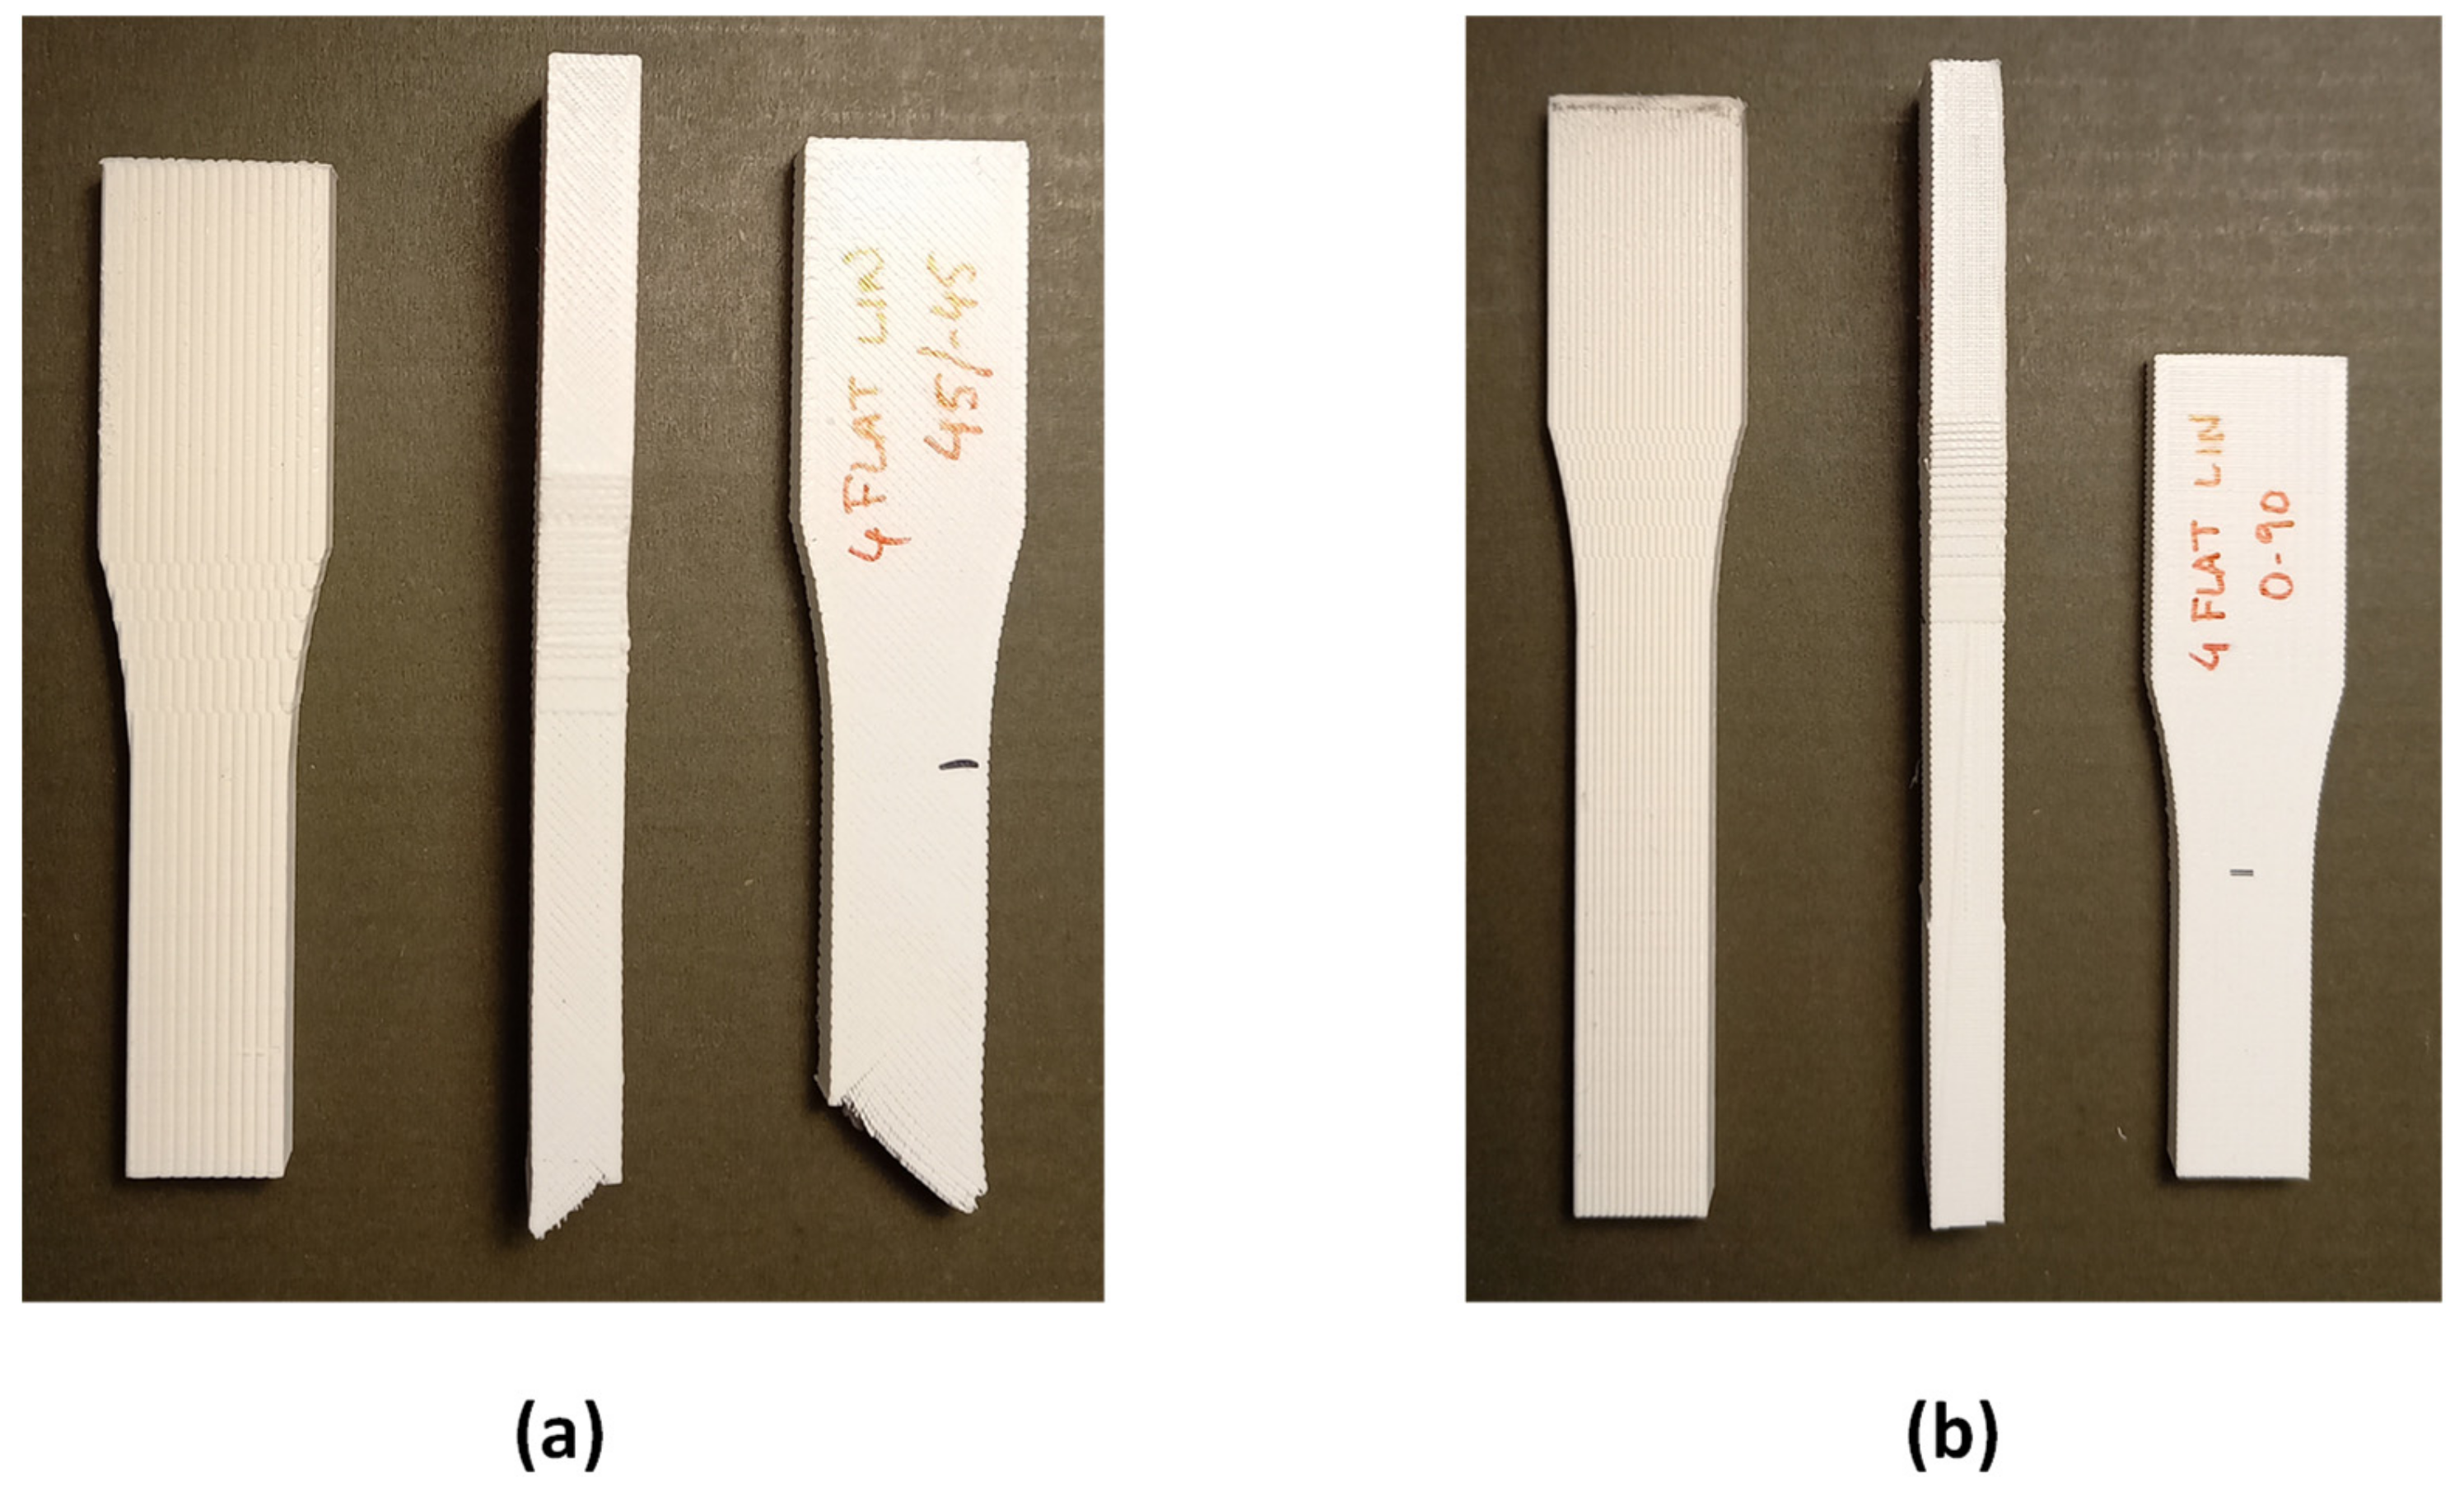
2.1. Manufacturing of Specimens and Experimental Tests
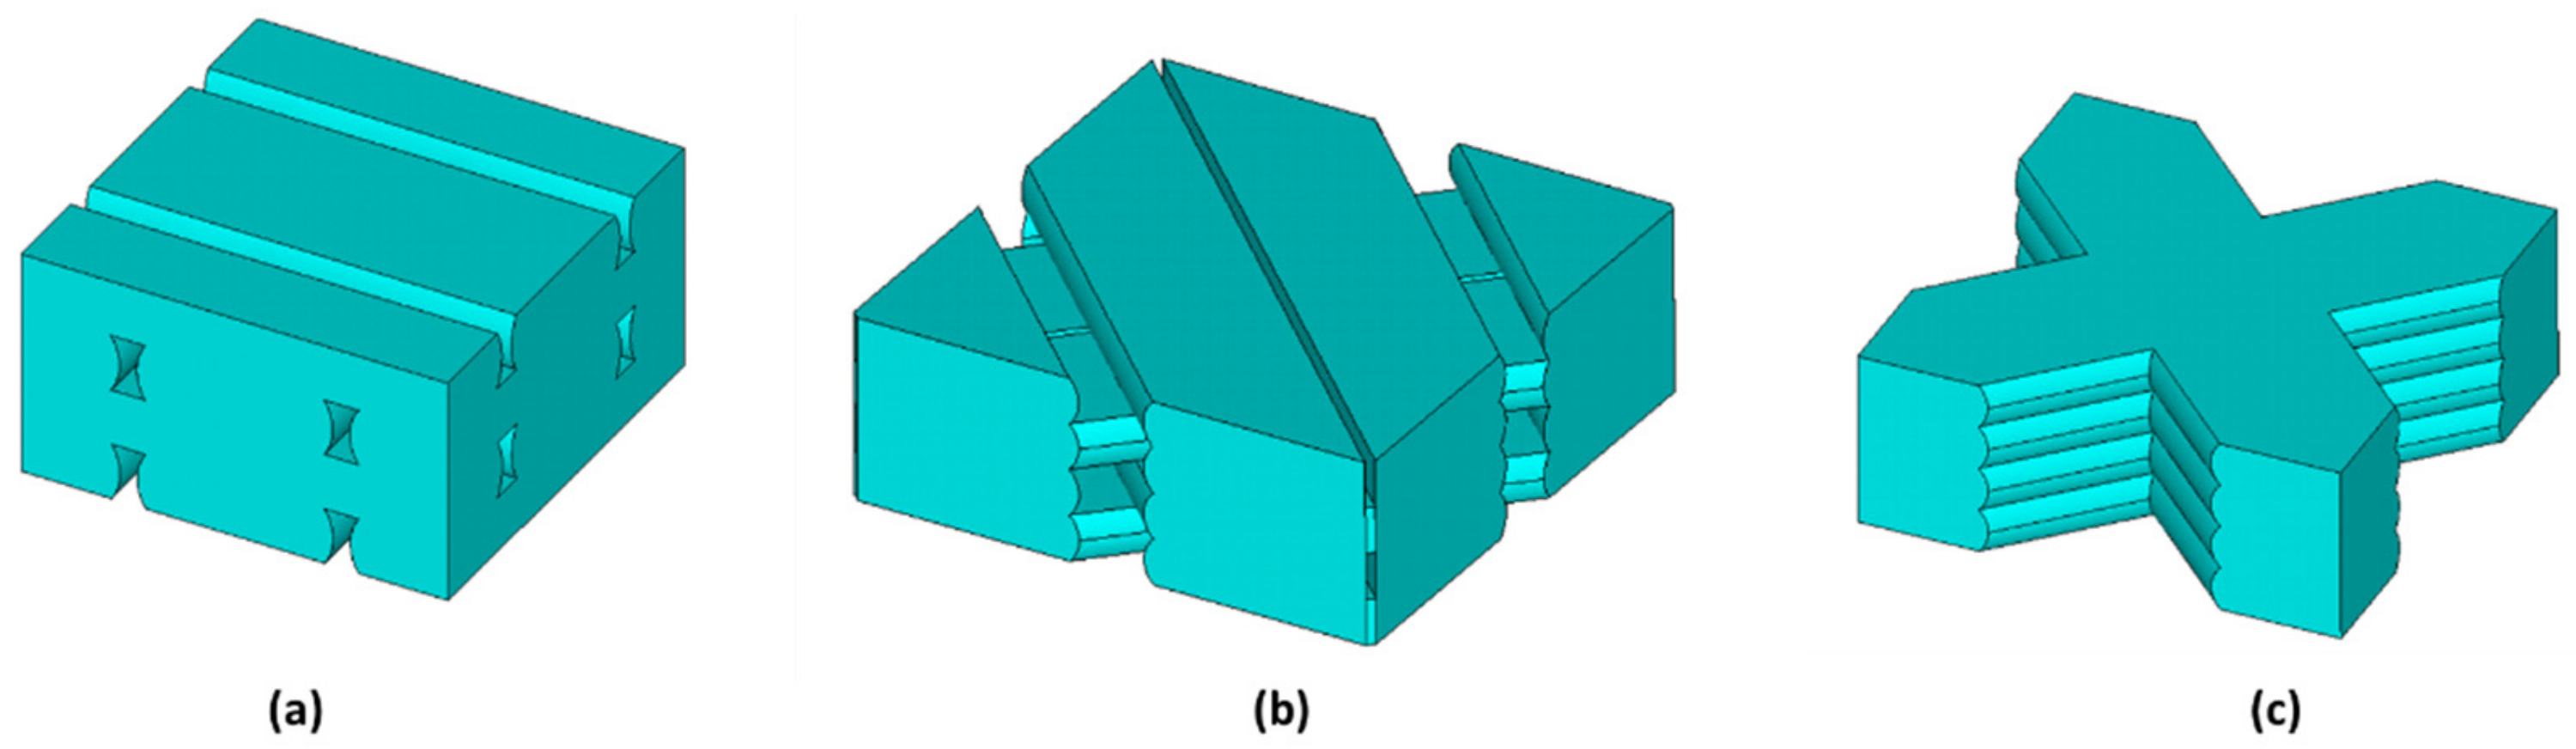
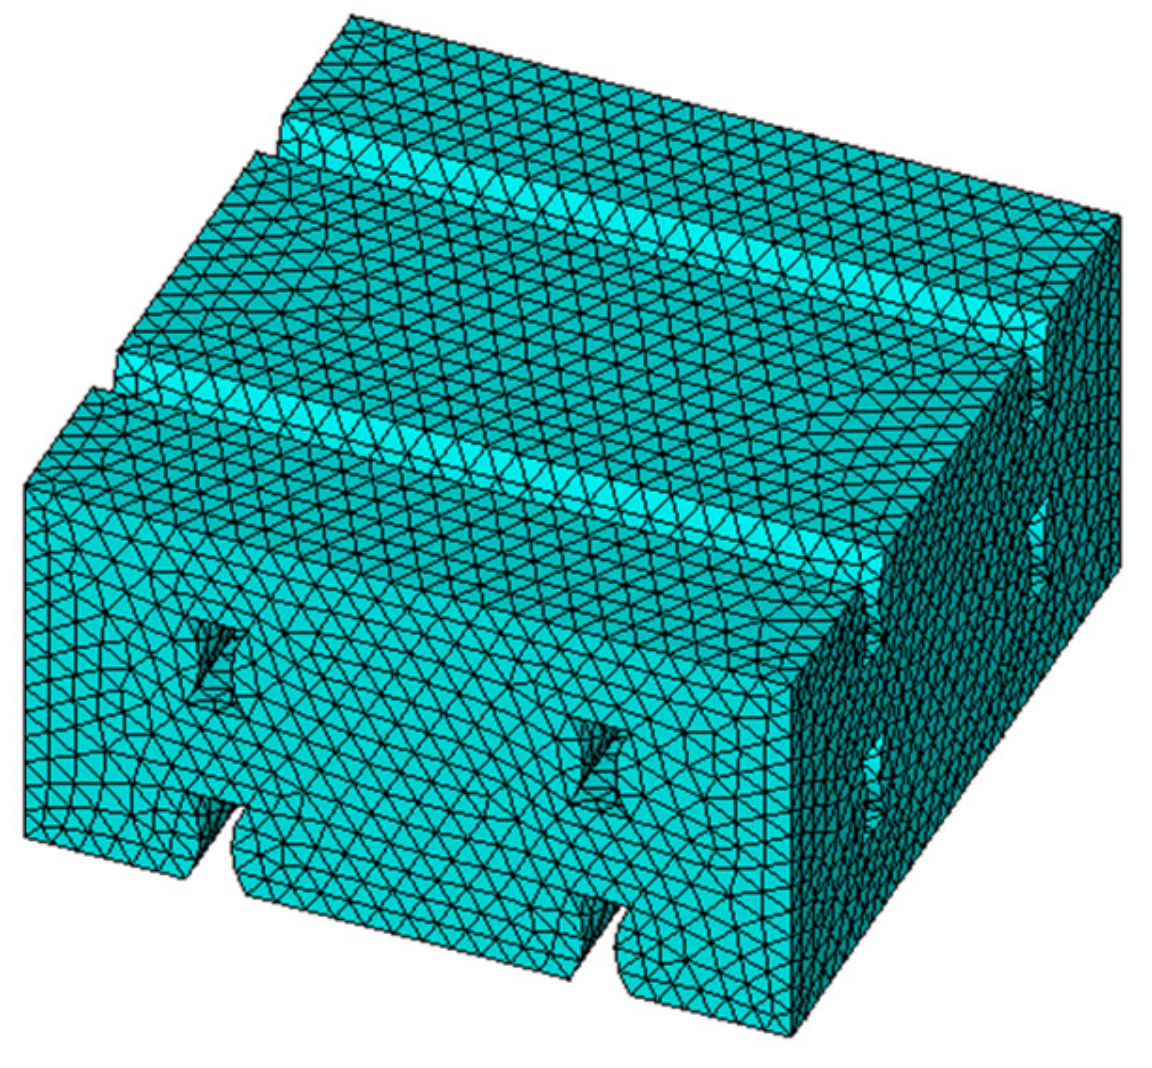
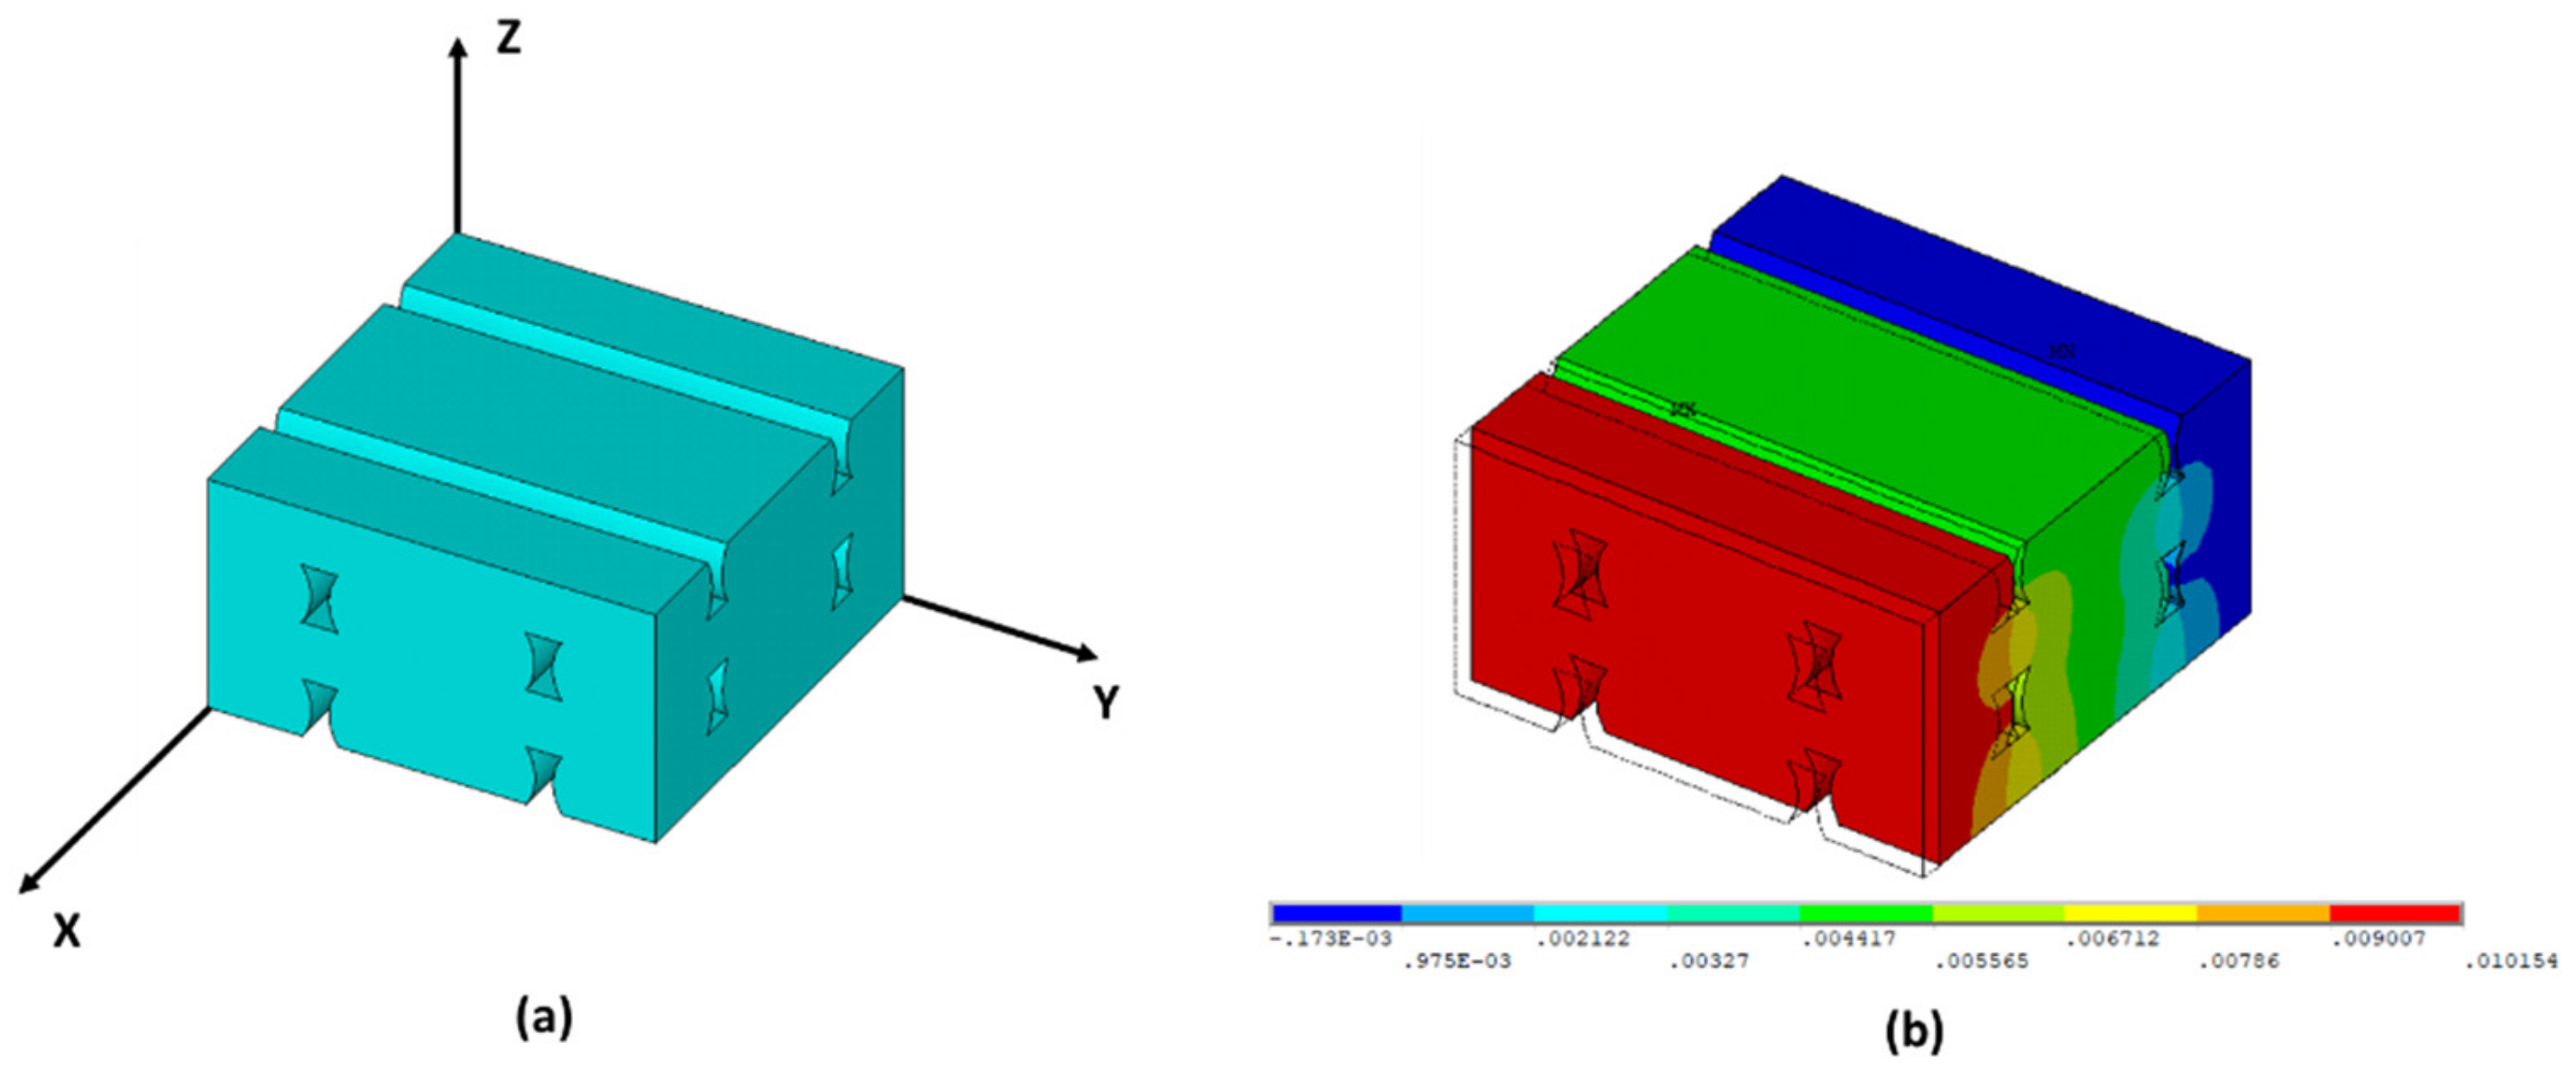
2.2. Representative Volume Element (RVE) Model. Computational Homogenization
3. Results and Discussion
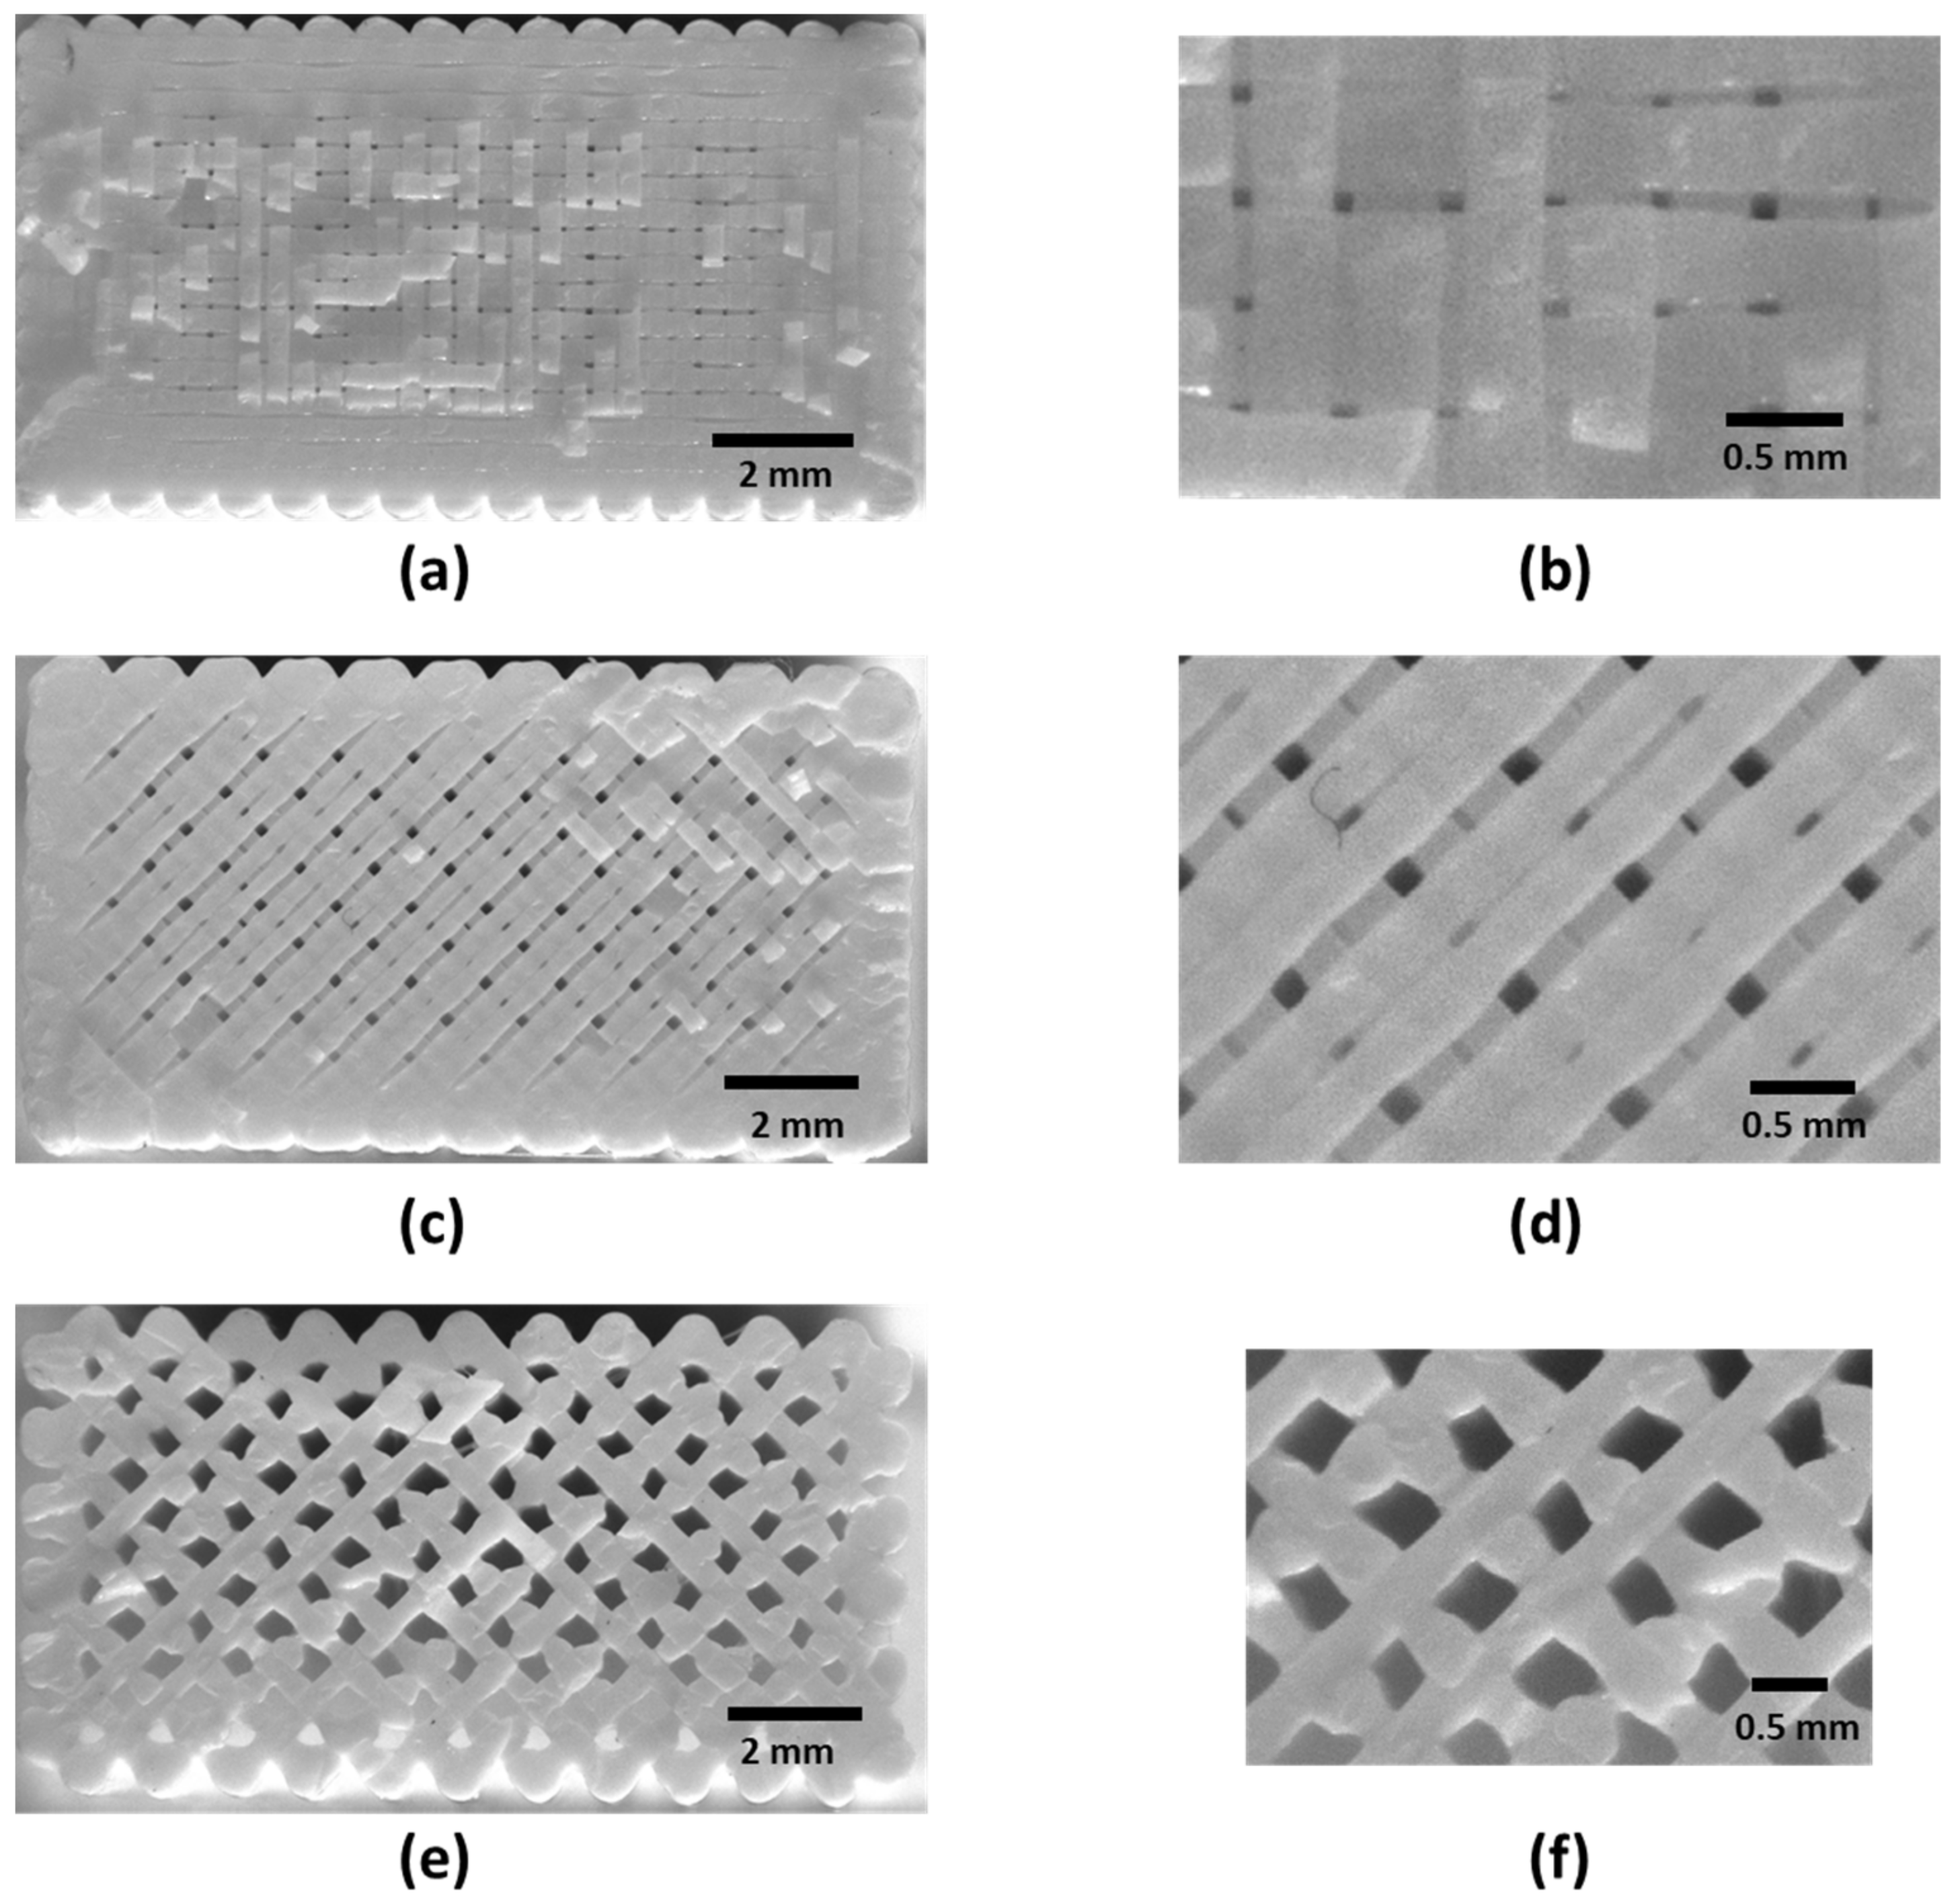
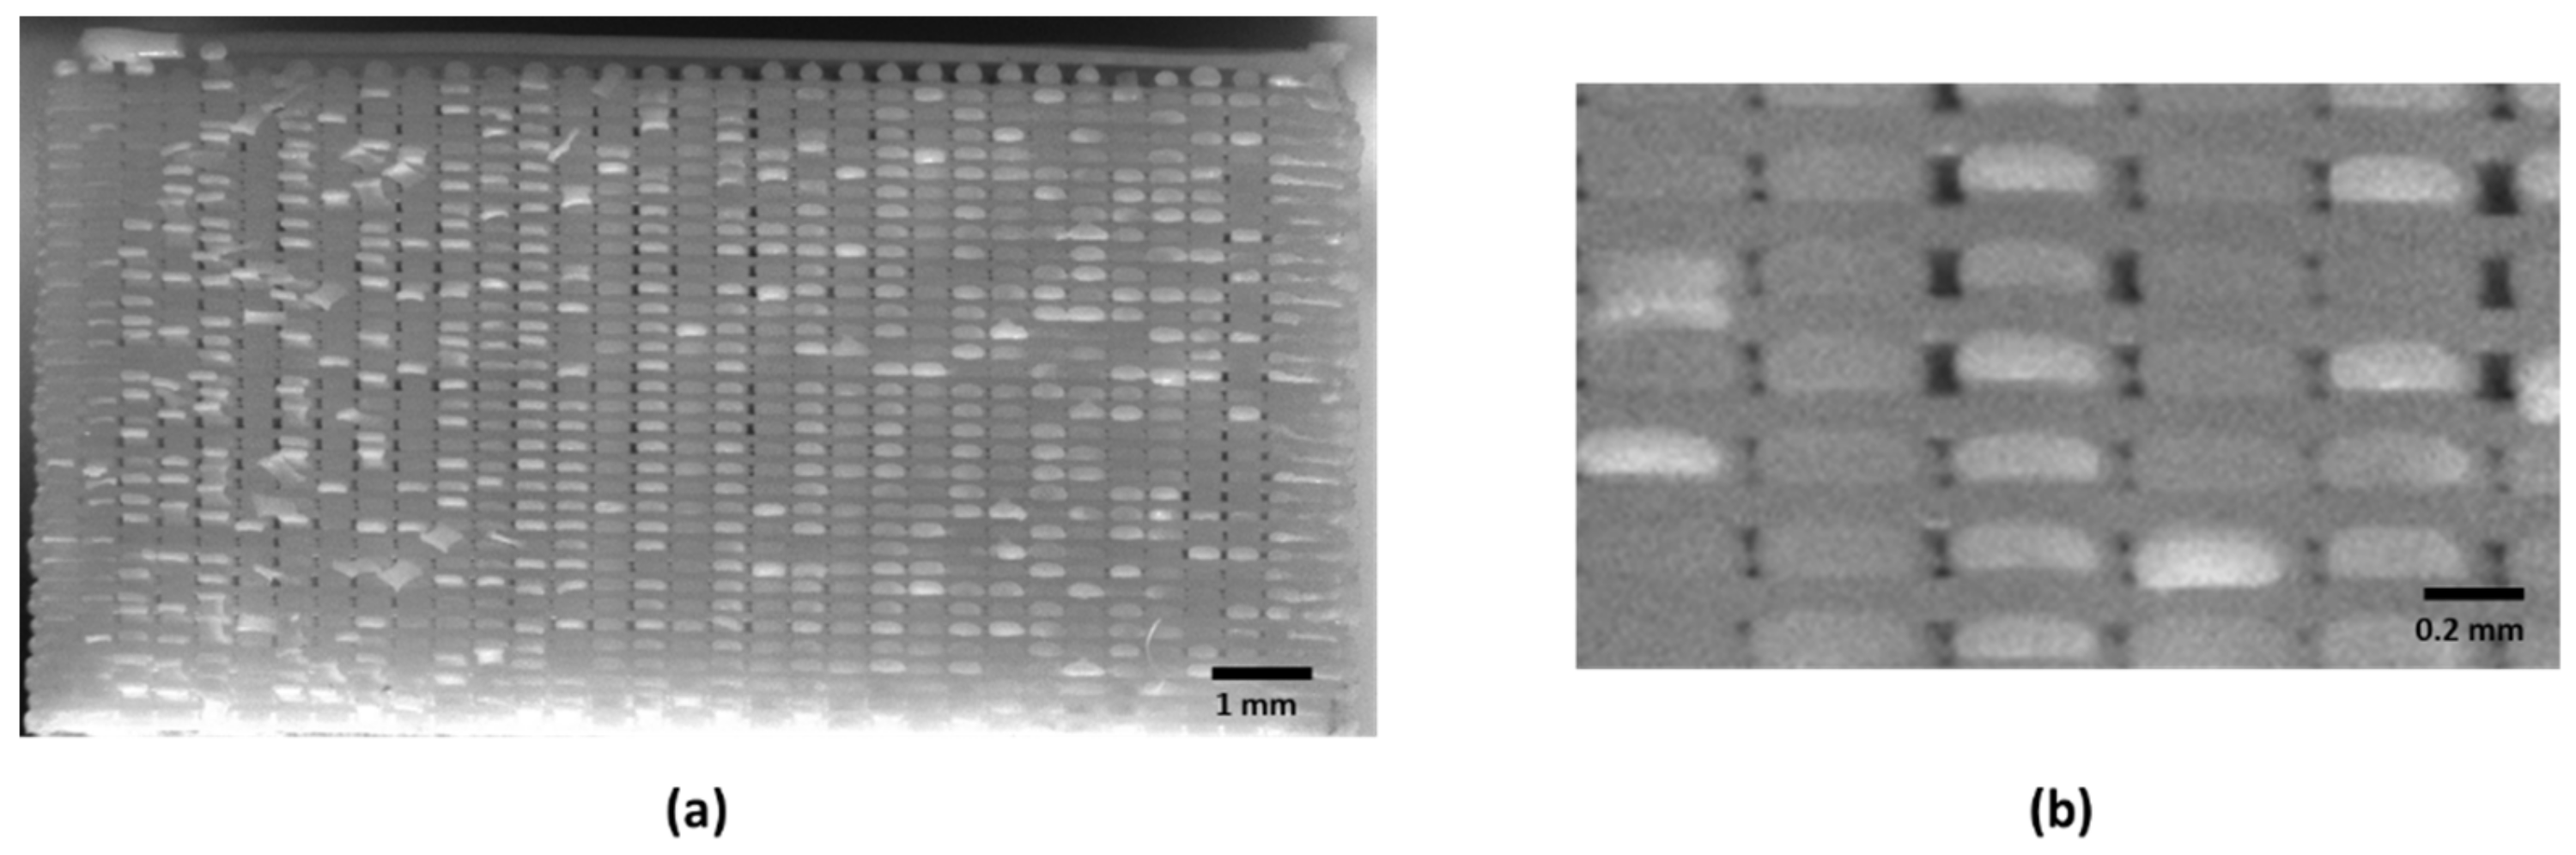
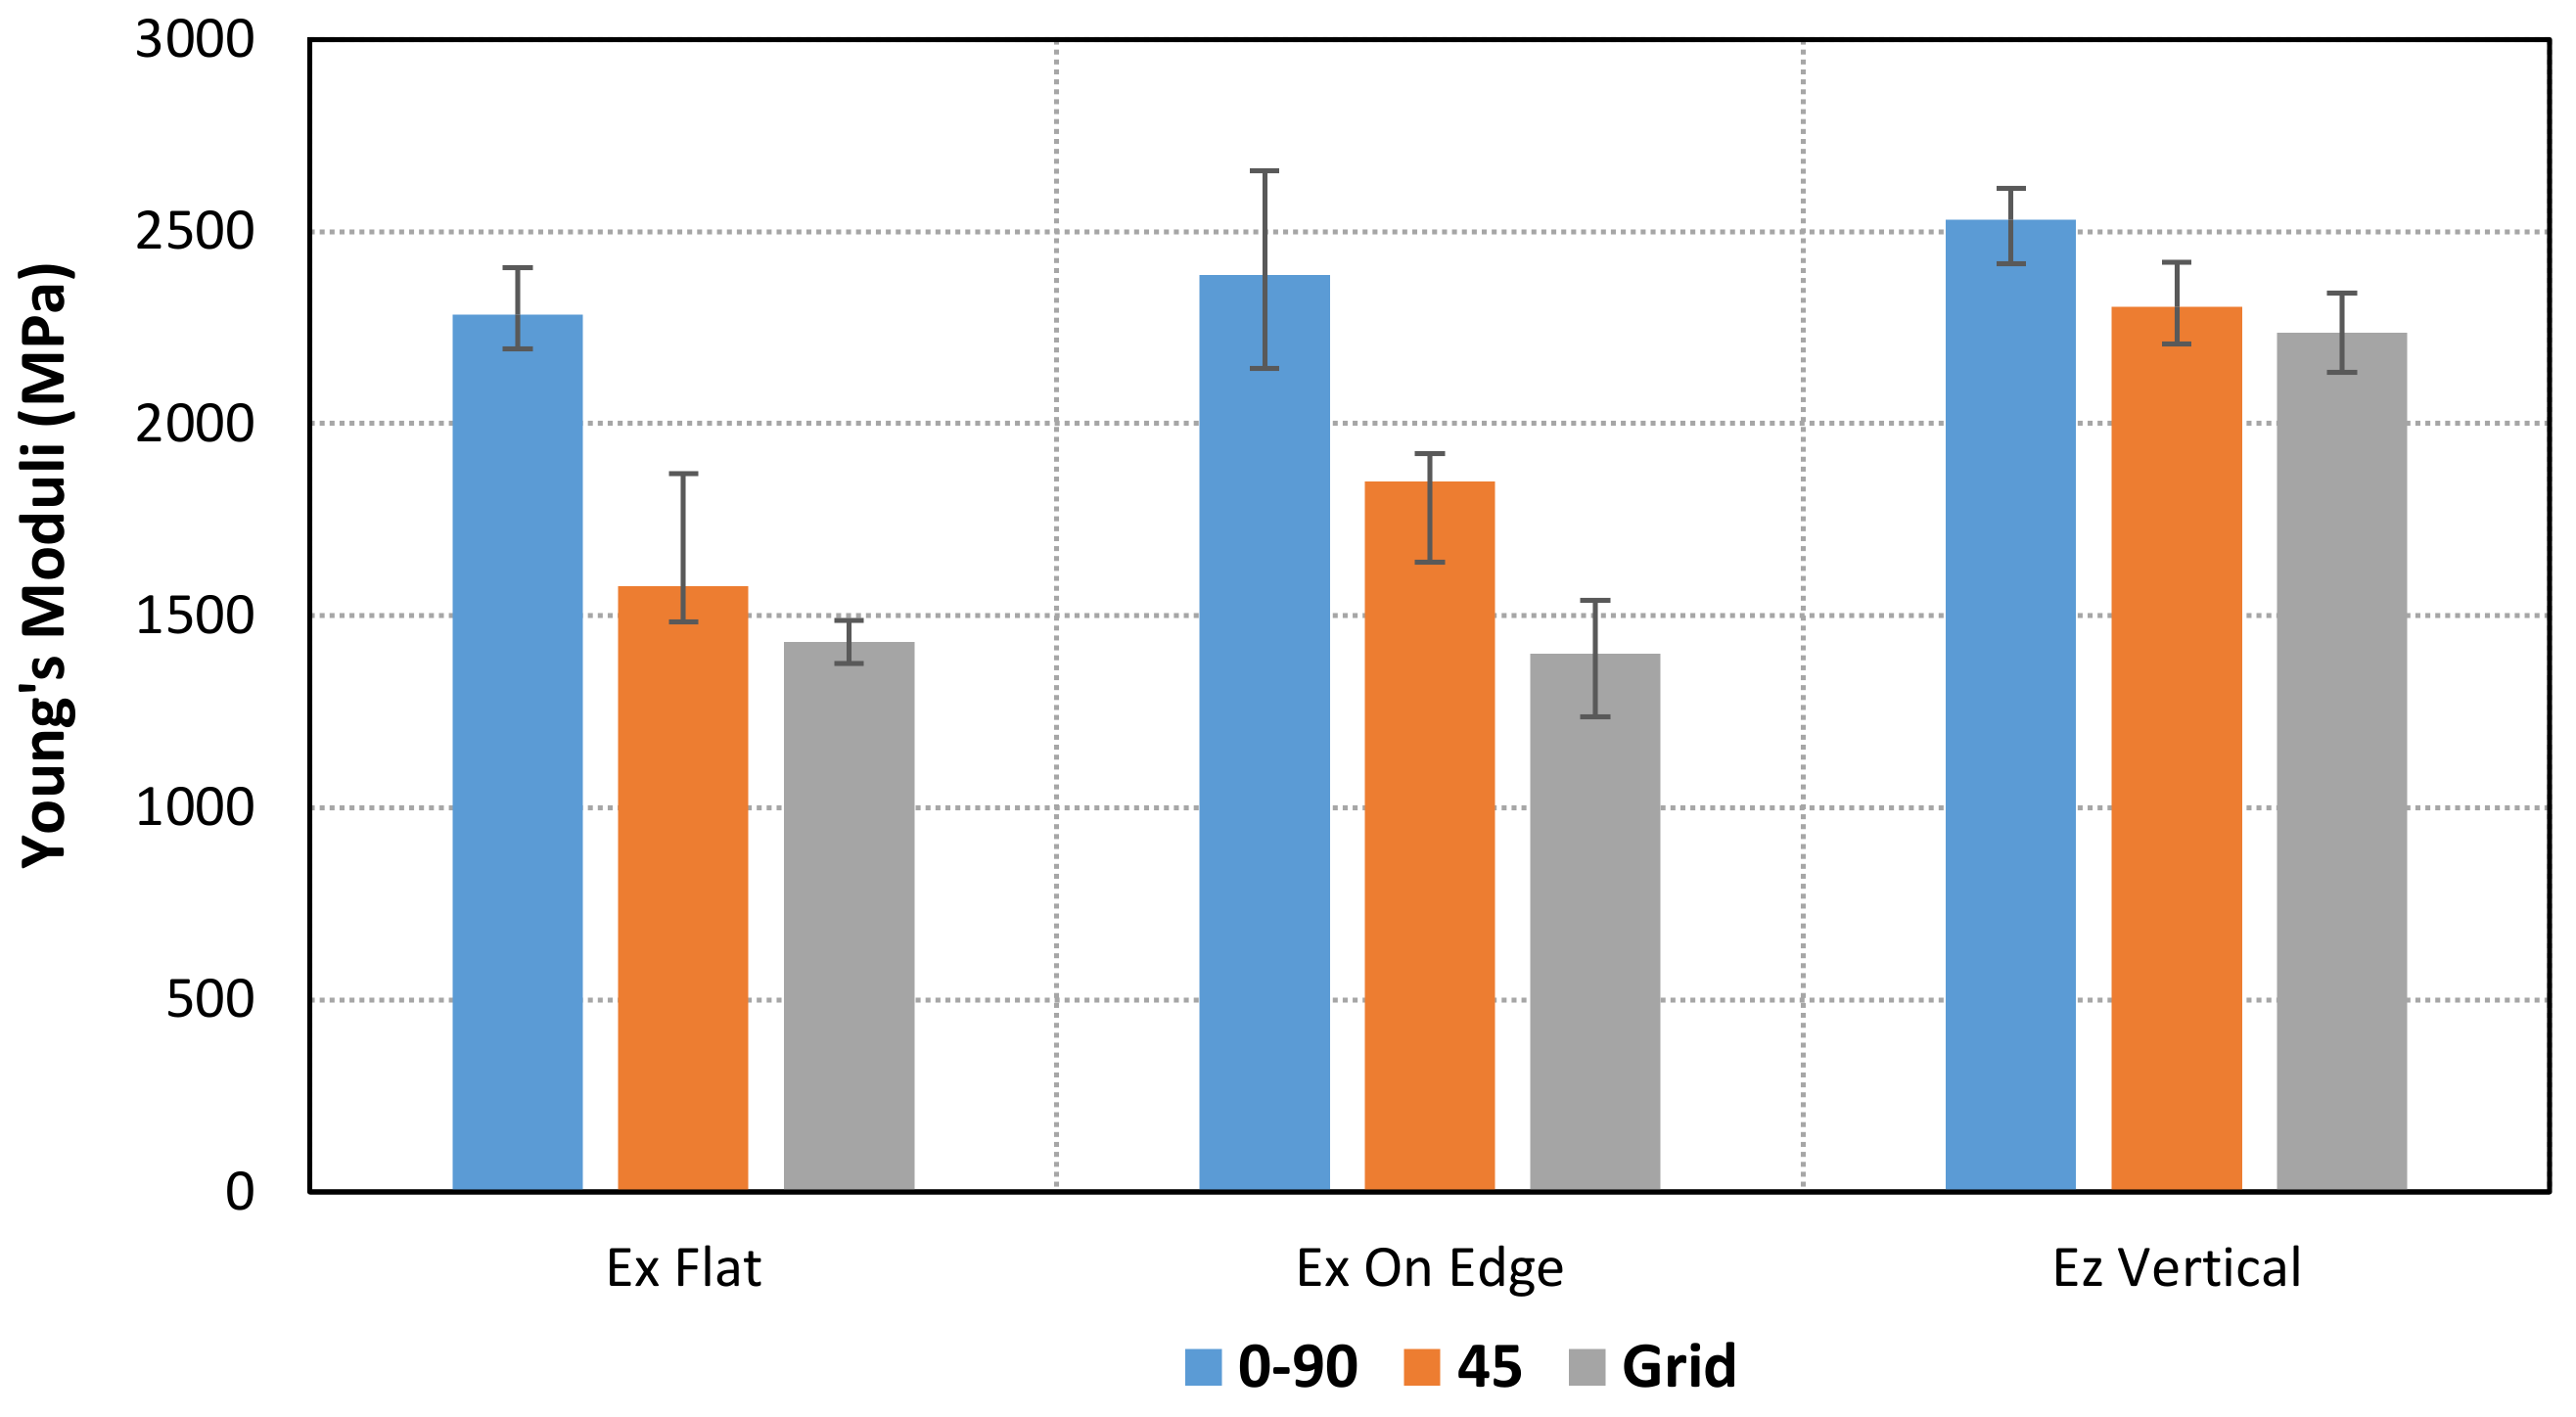
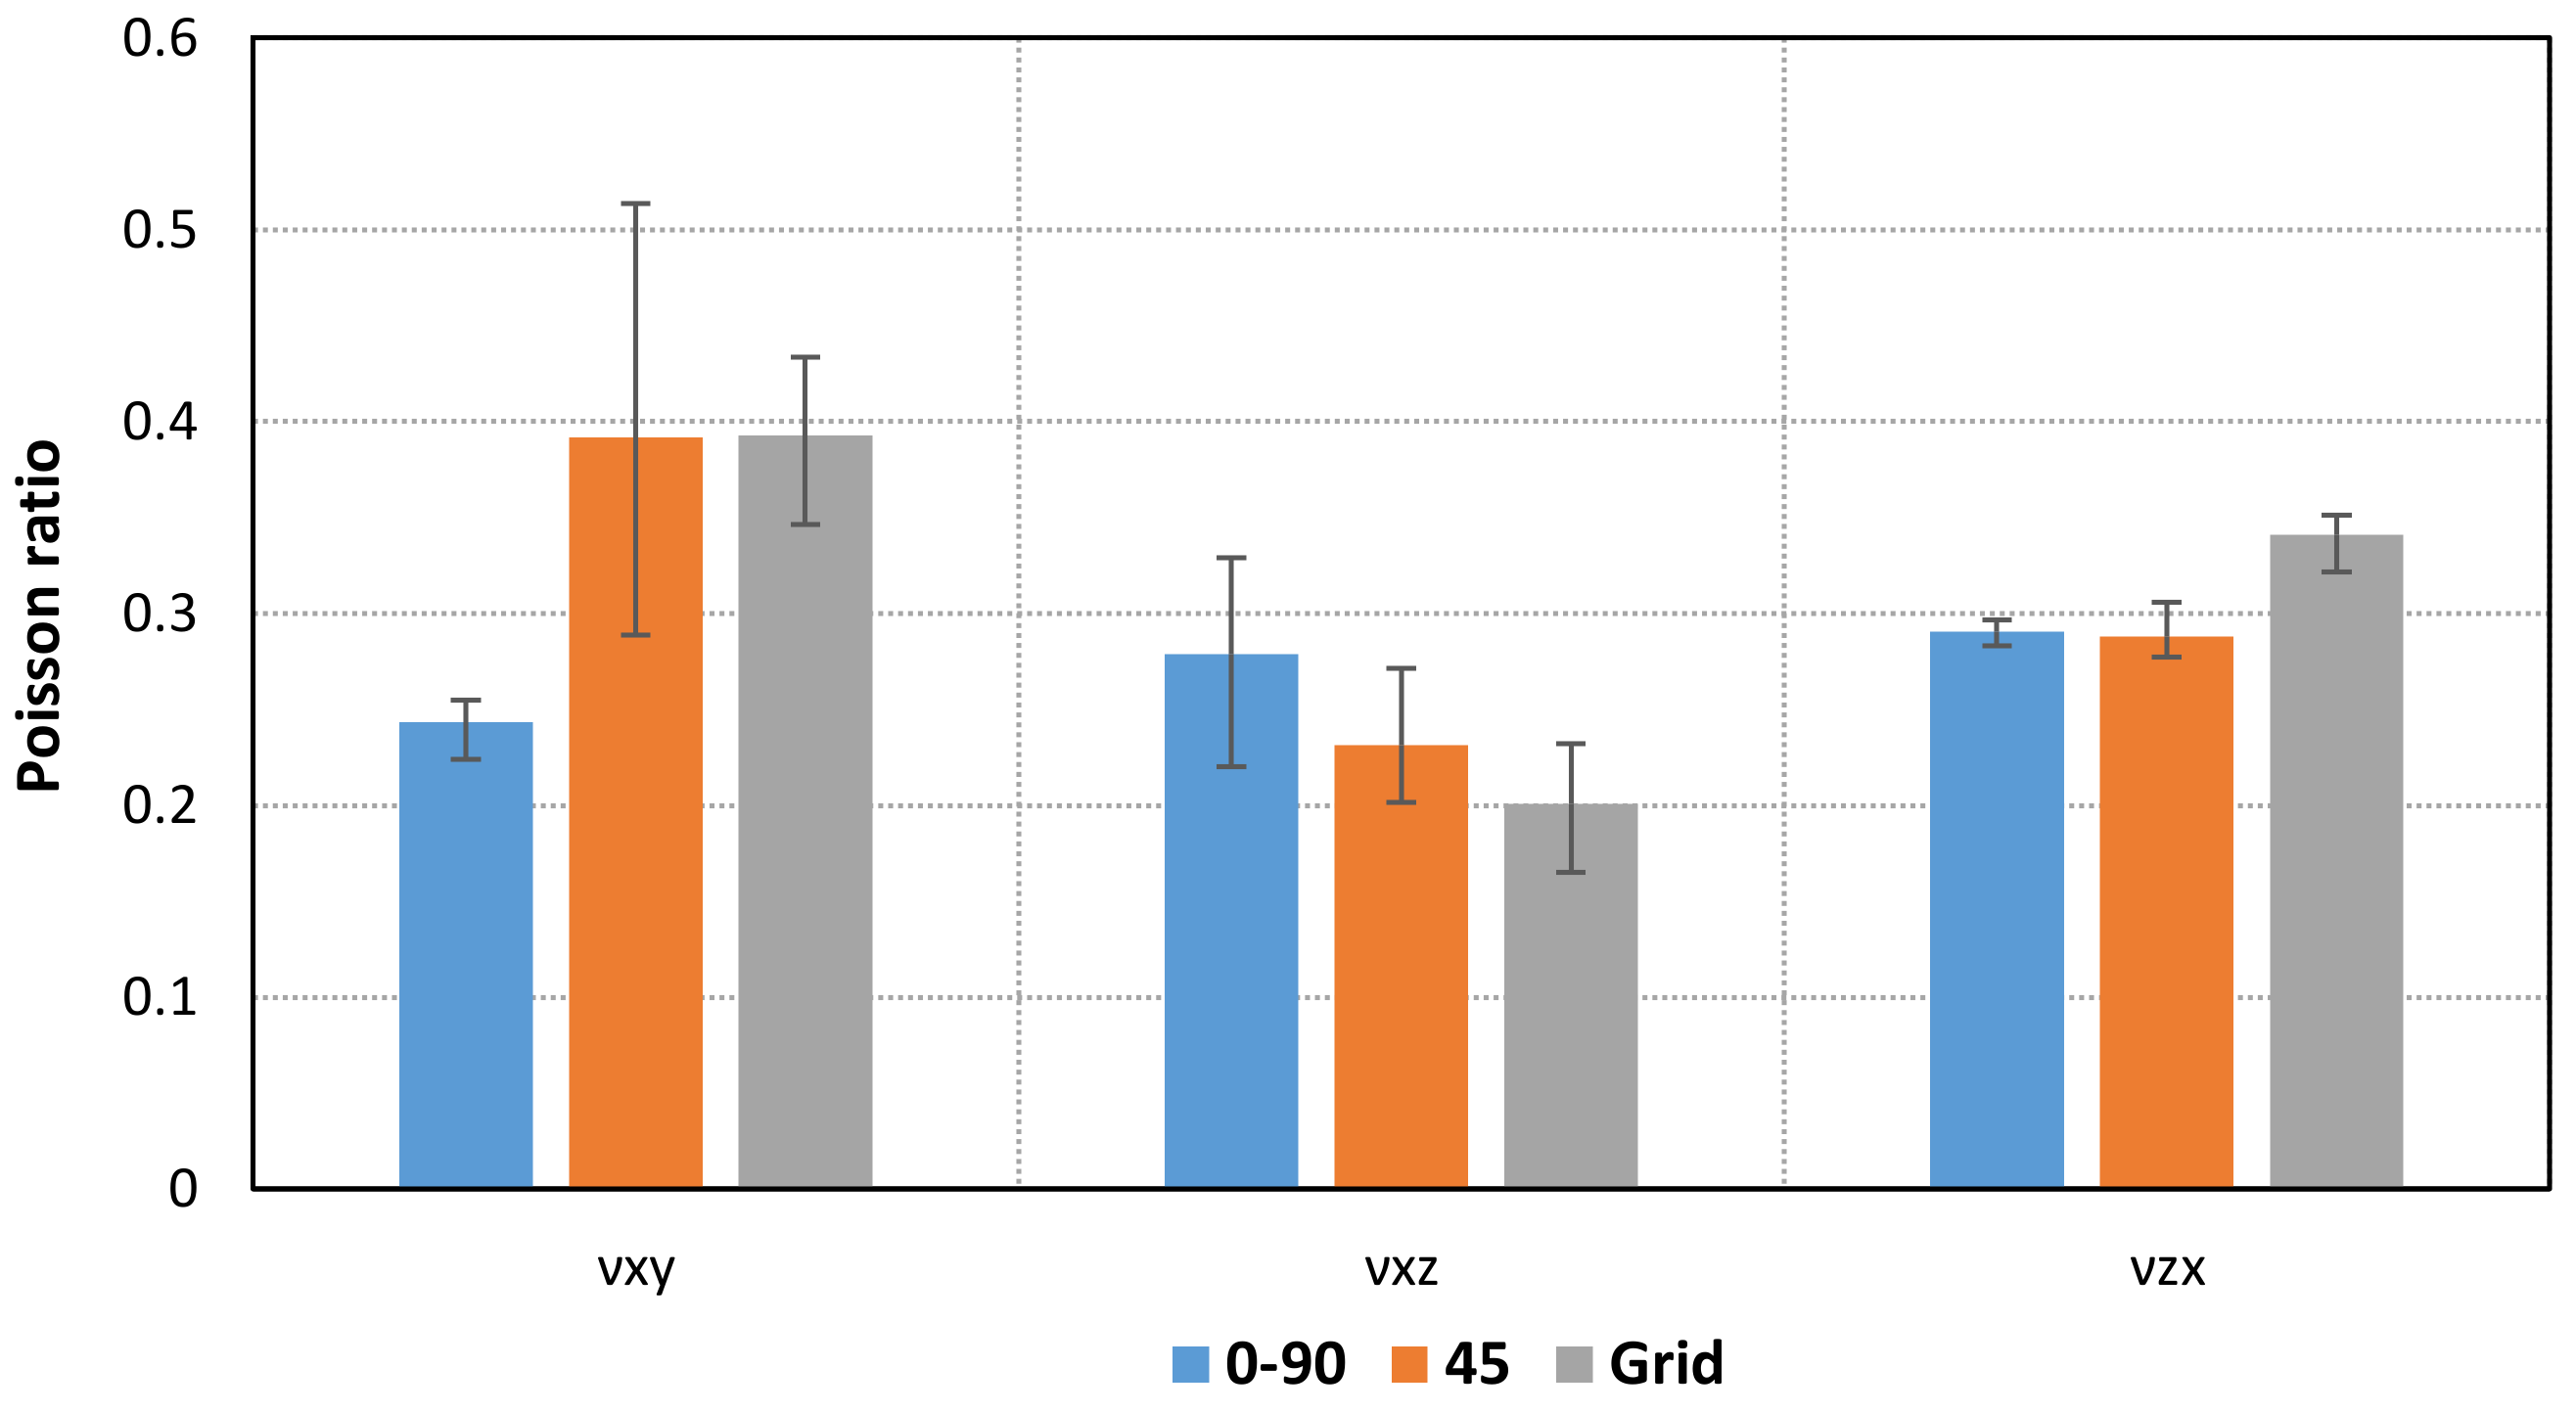
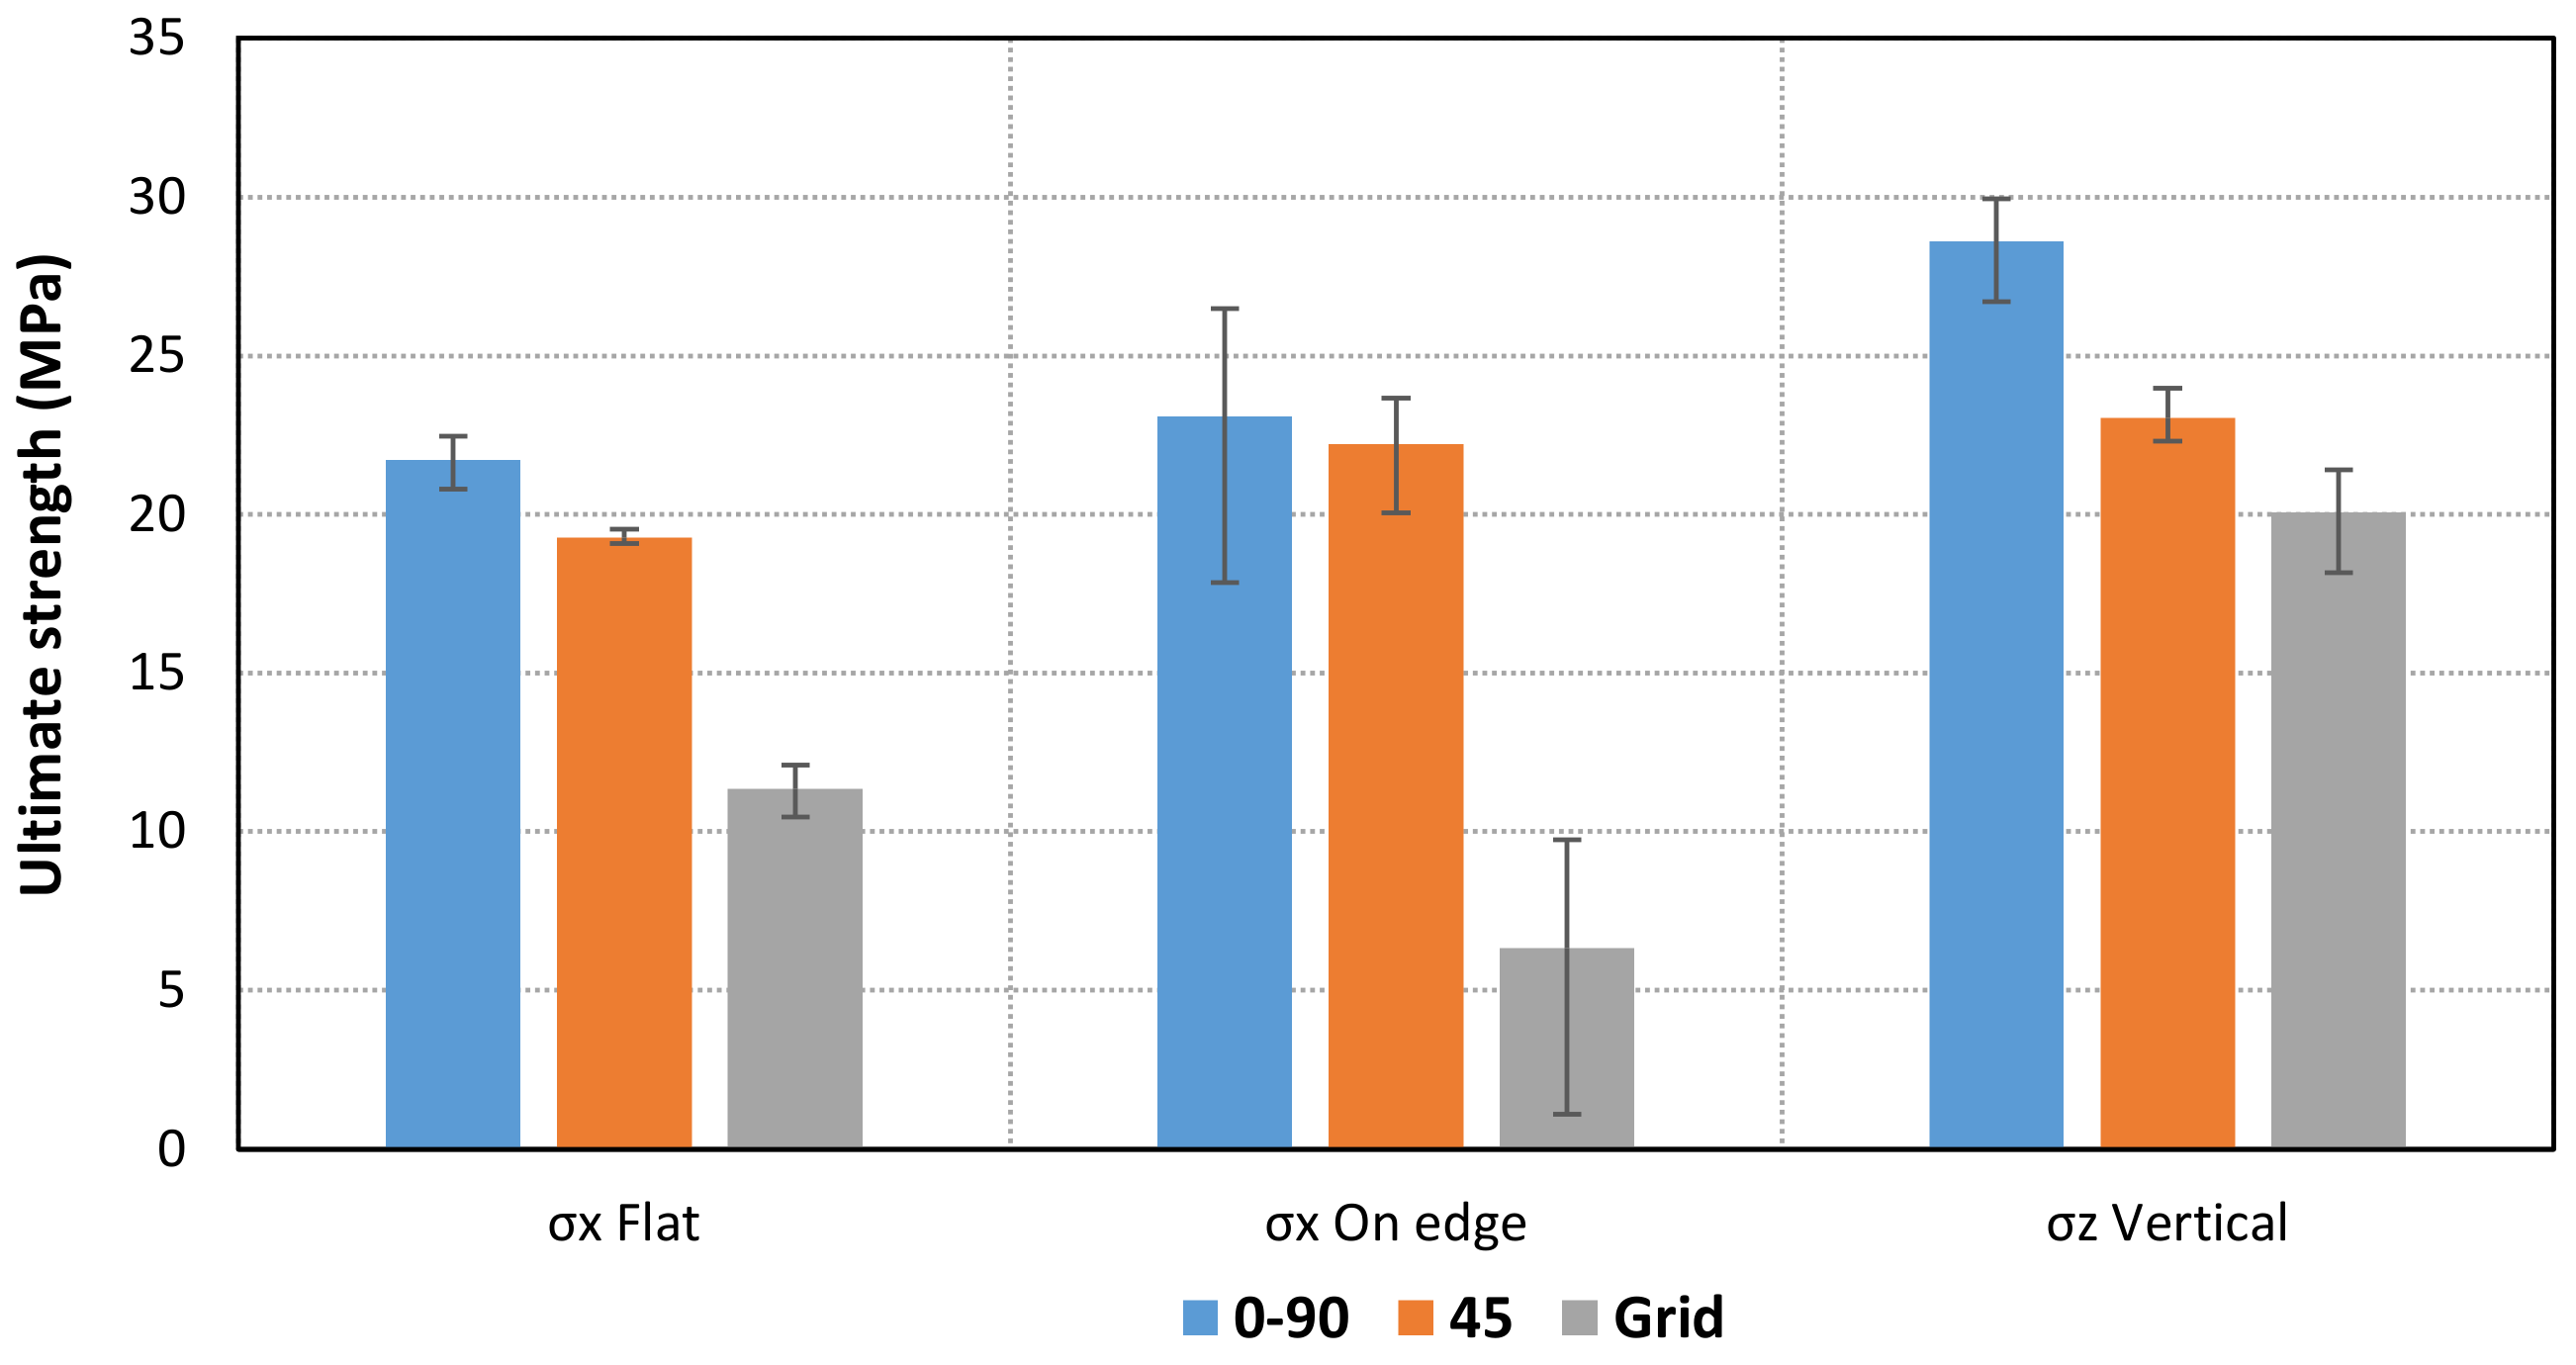
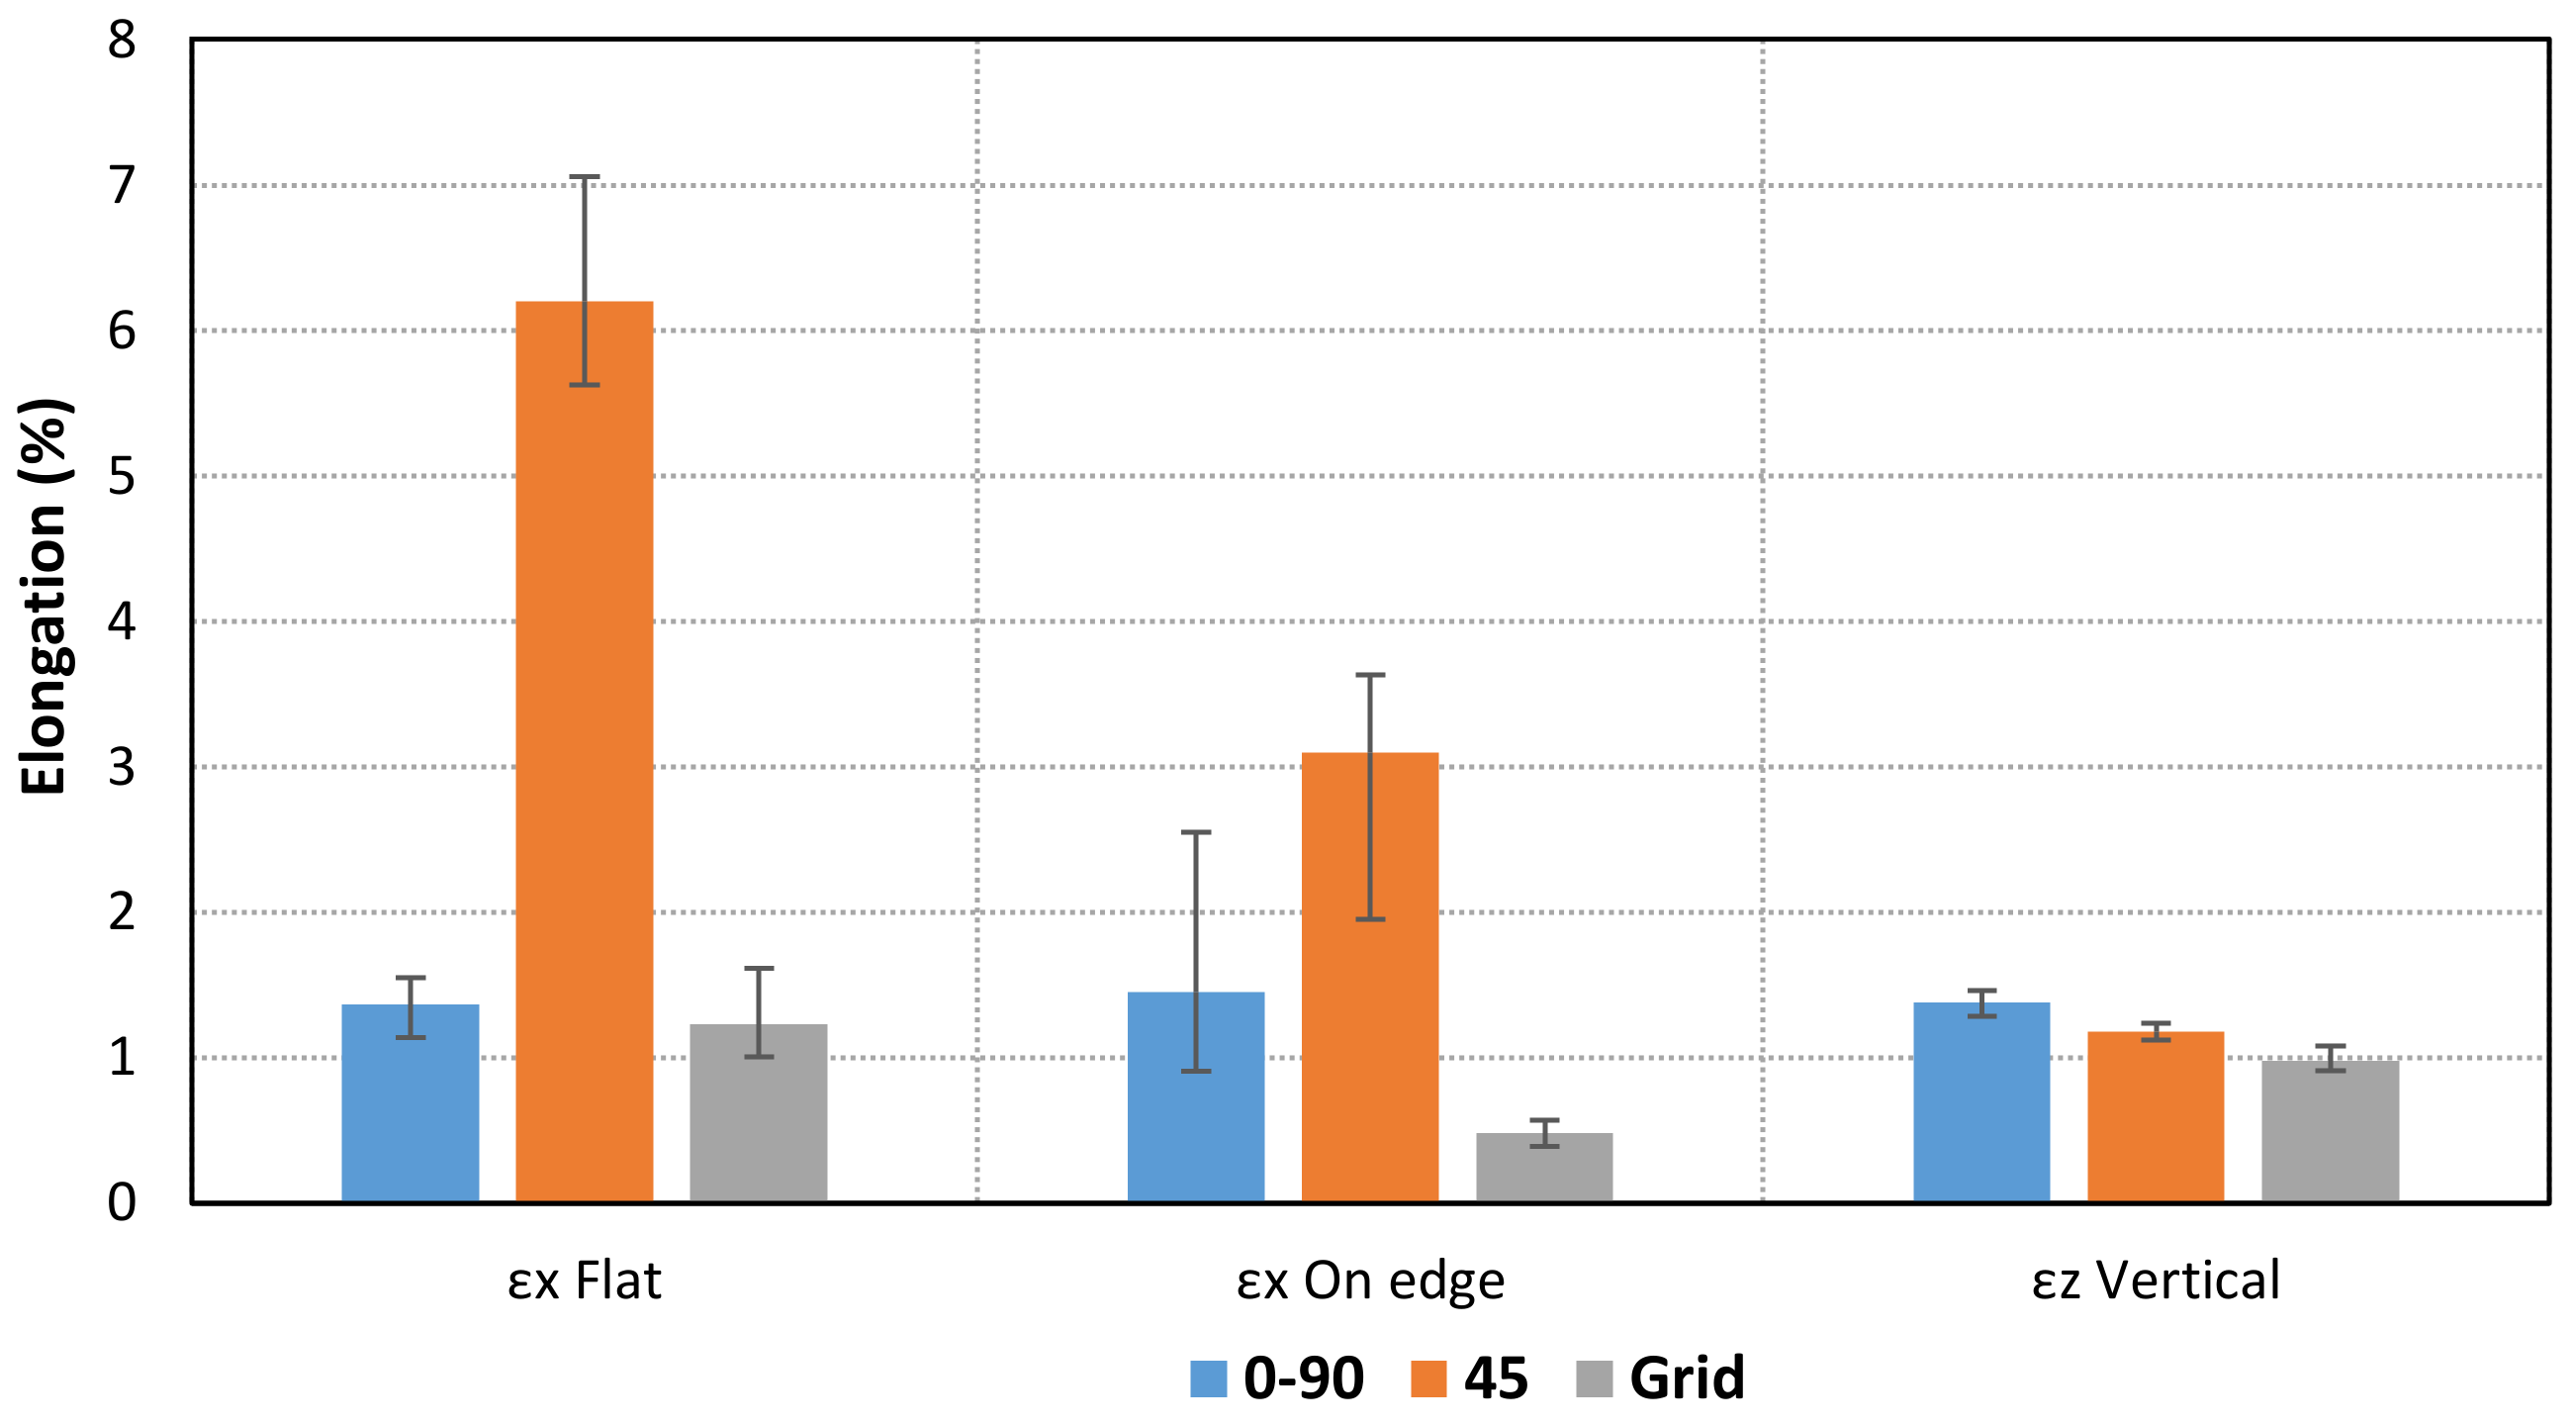
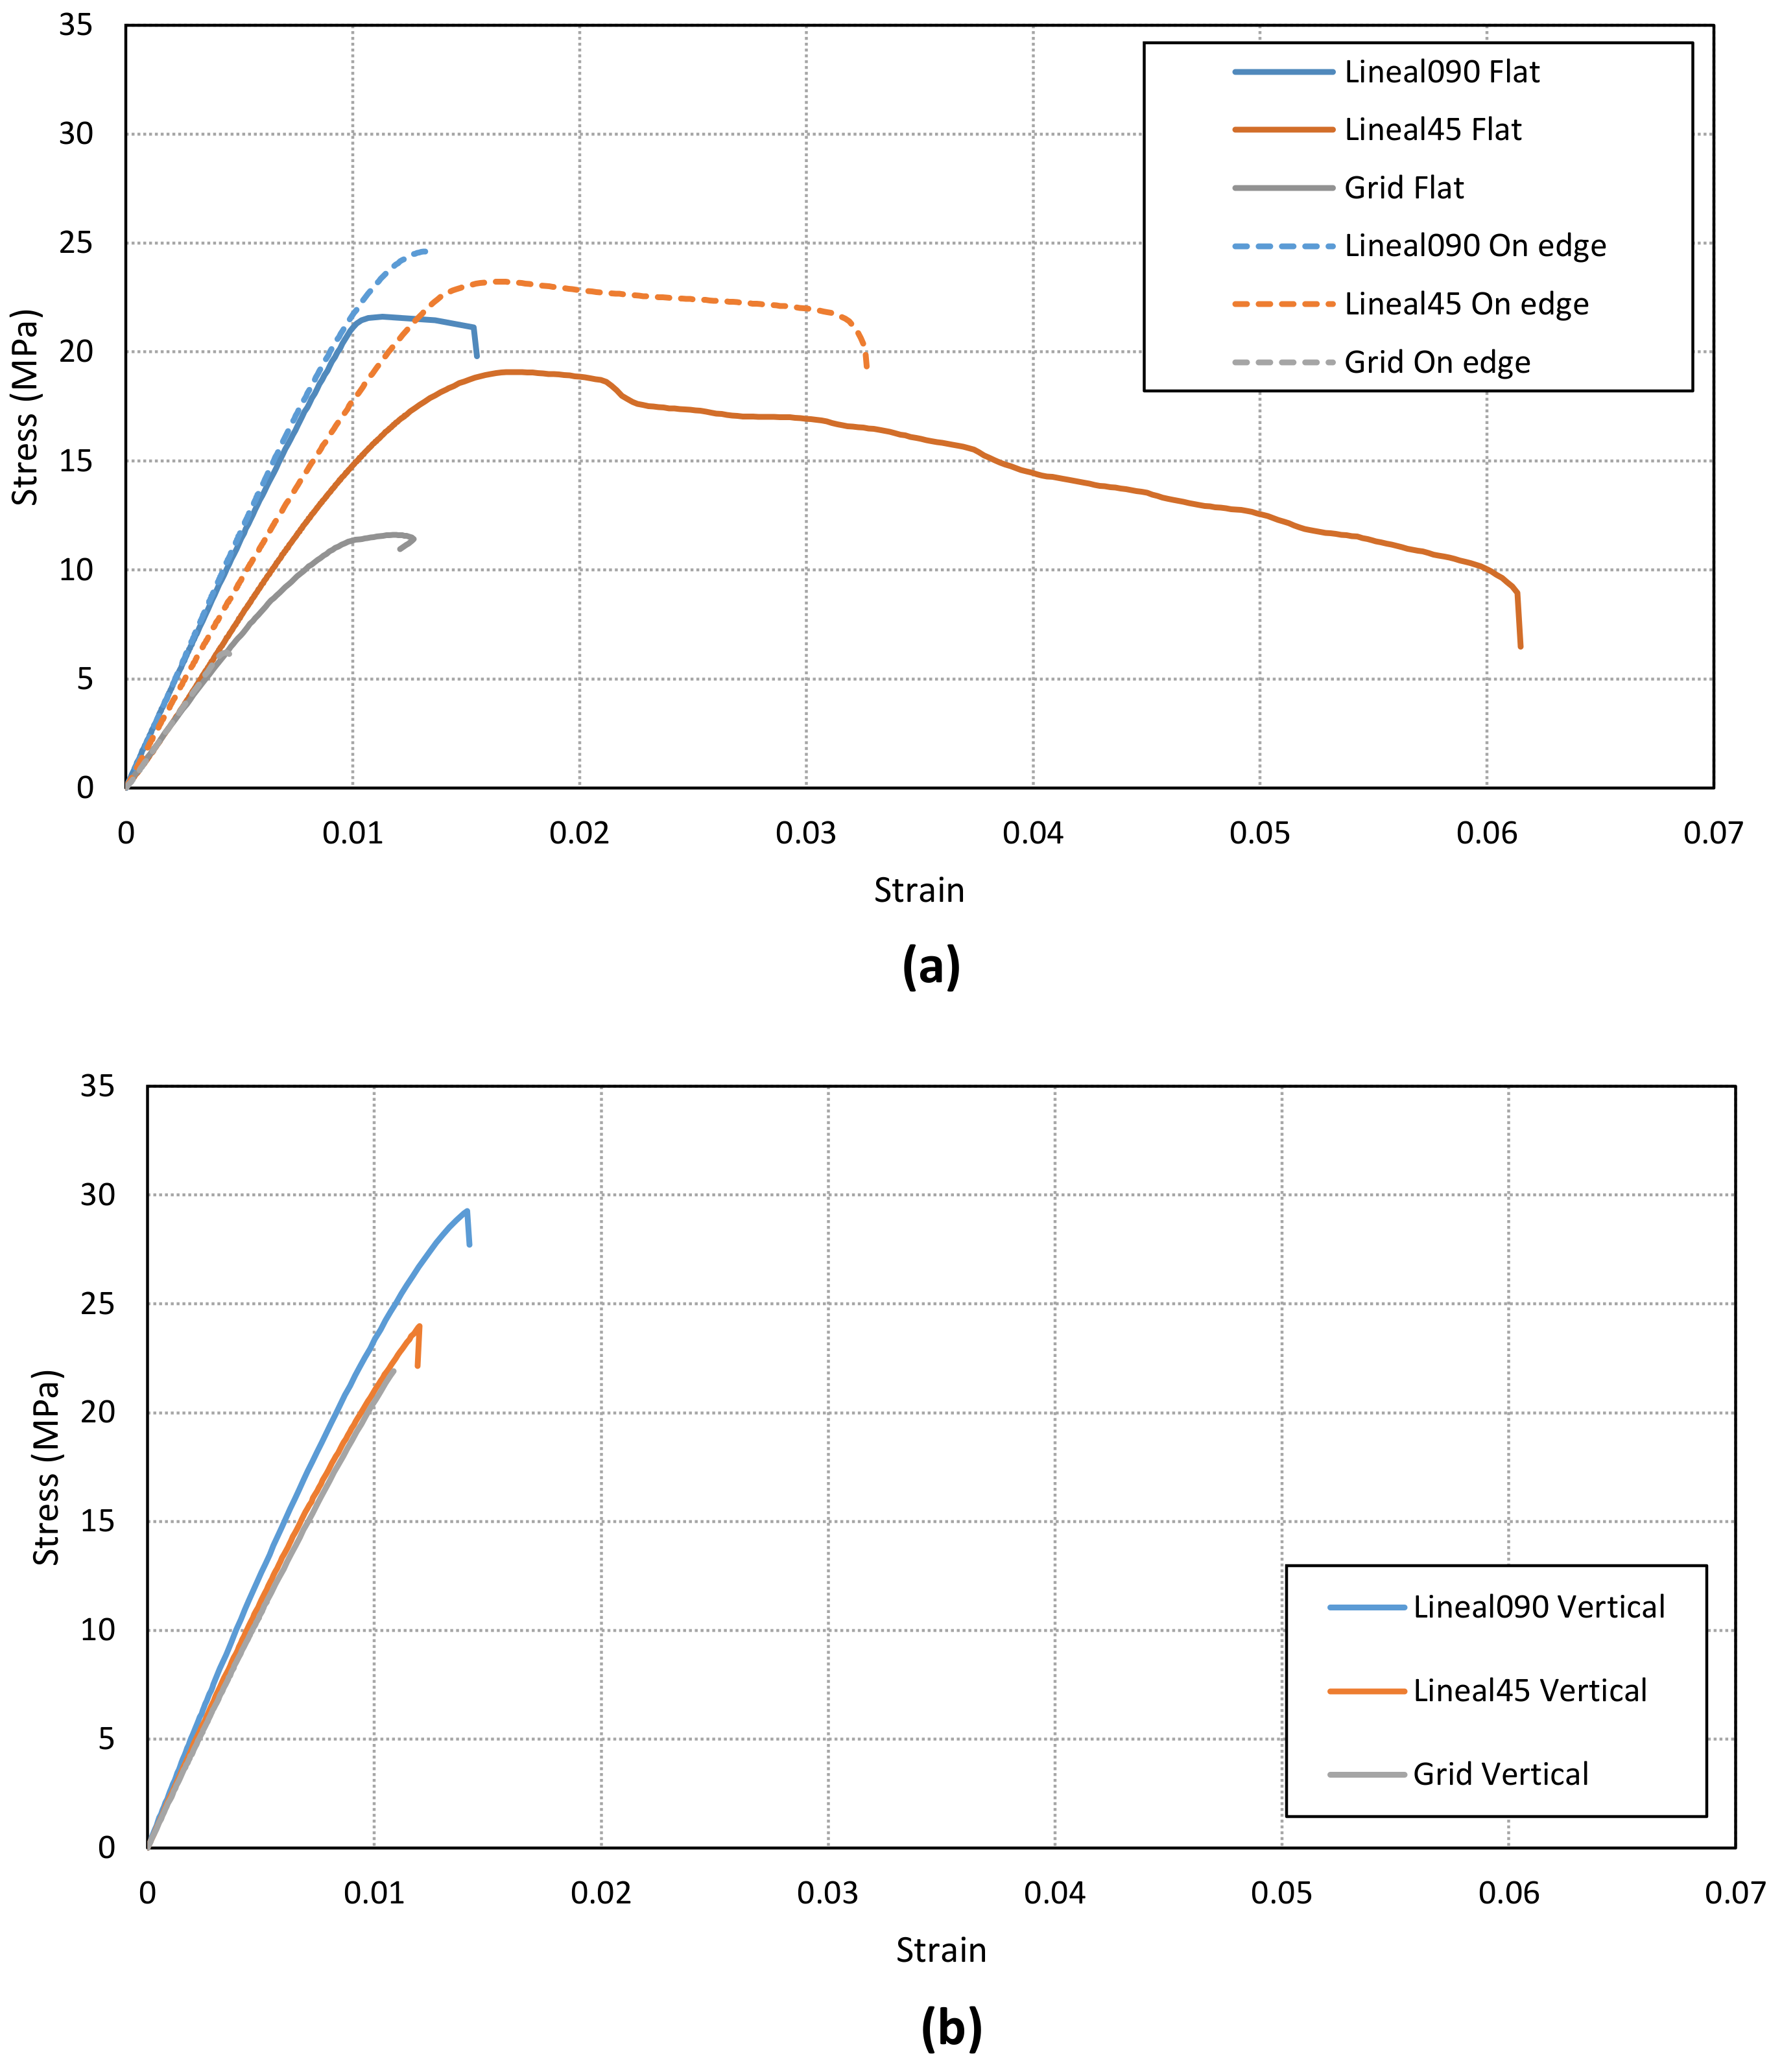
3.1. Experimental Characterization
3.2. Estimation of Young’s Moduli and Poisson’s Ratios by RVE Finite Element Analysis
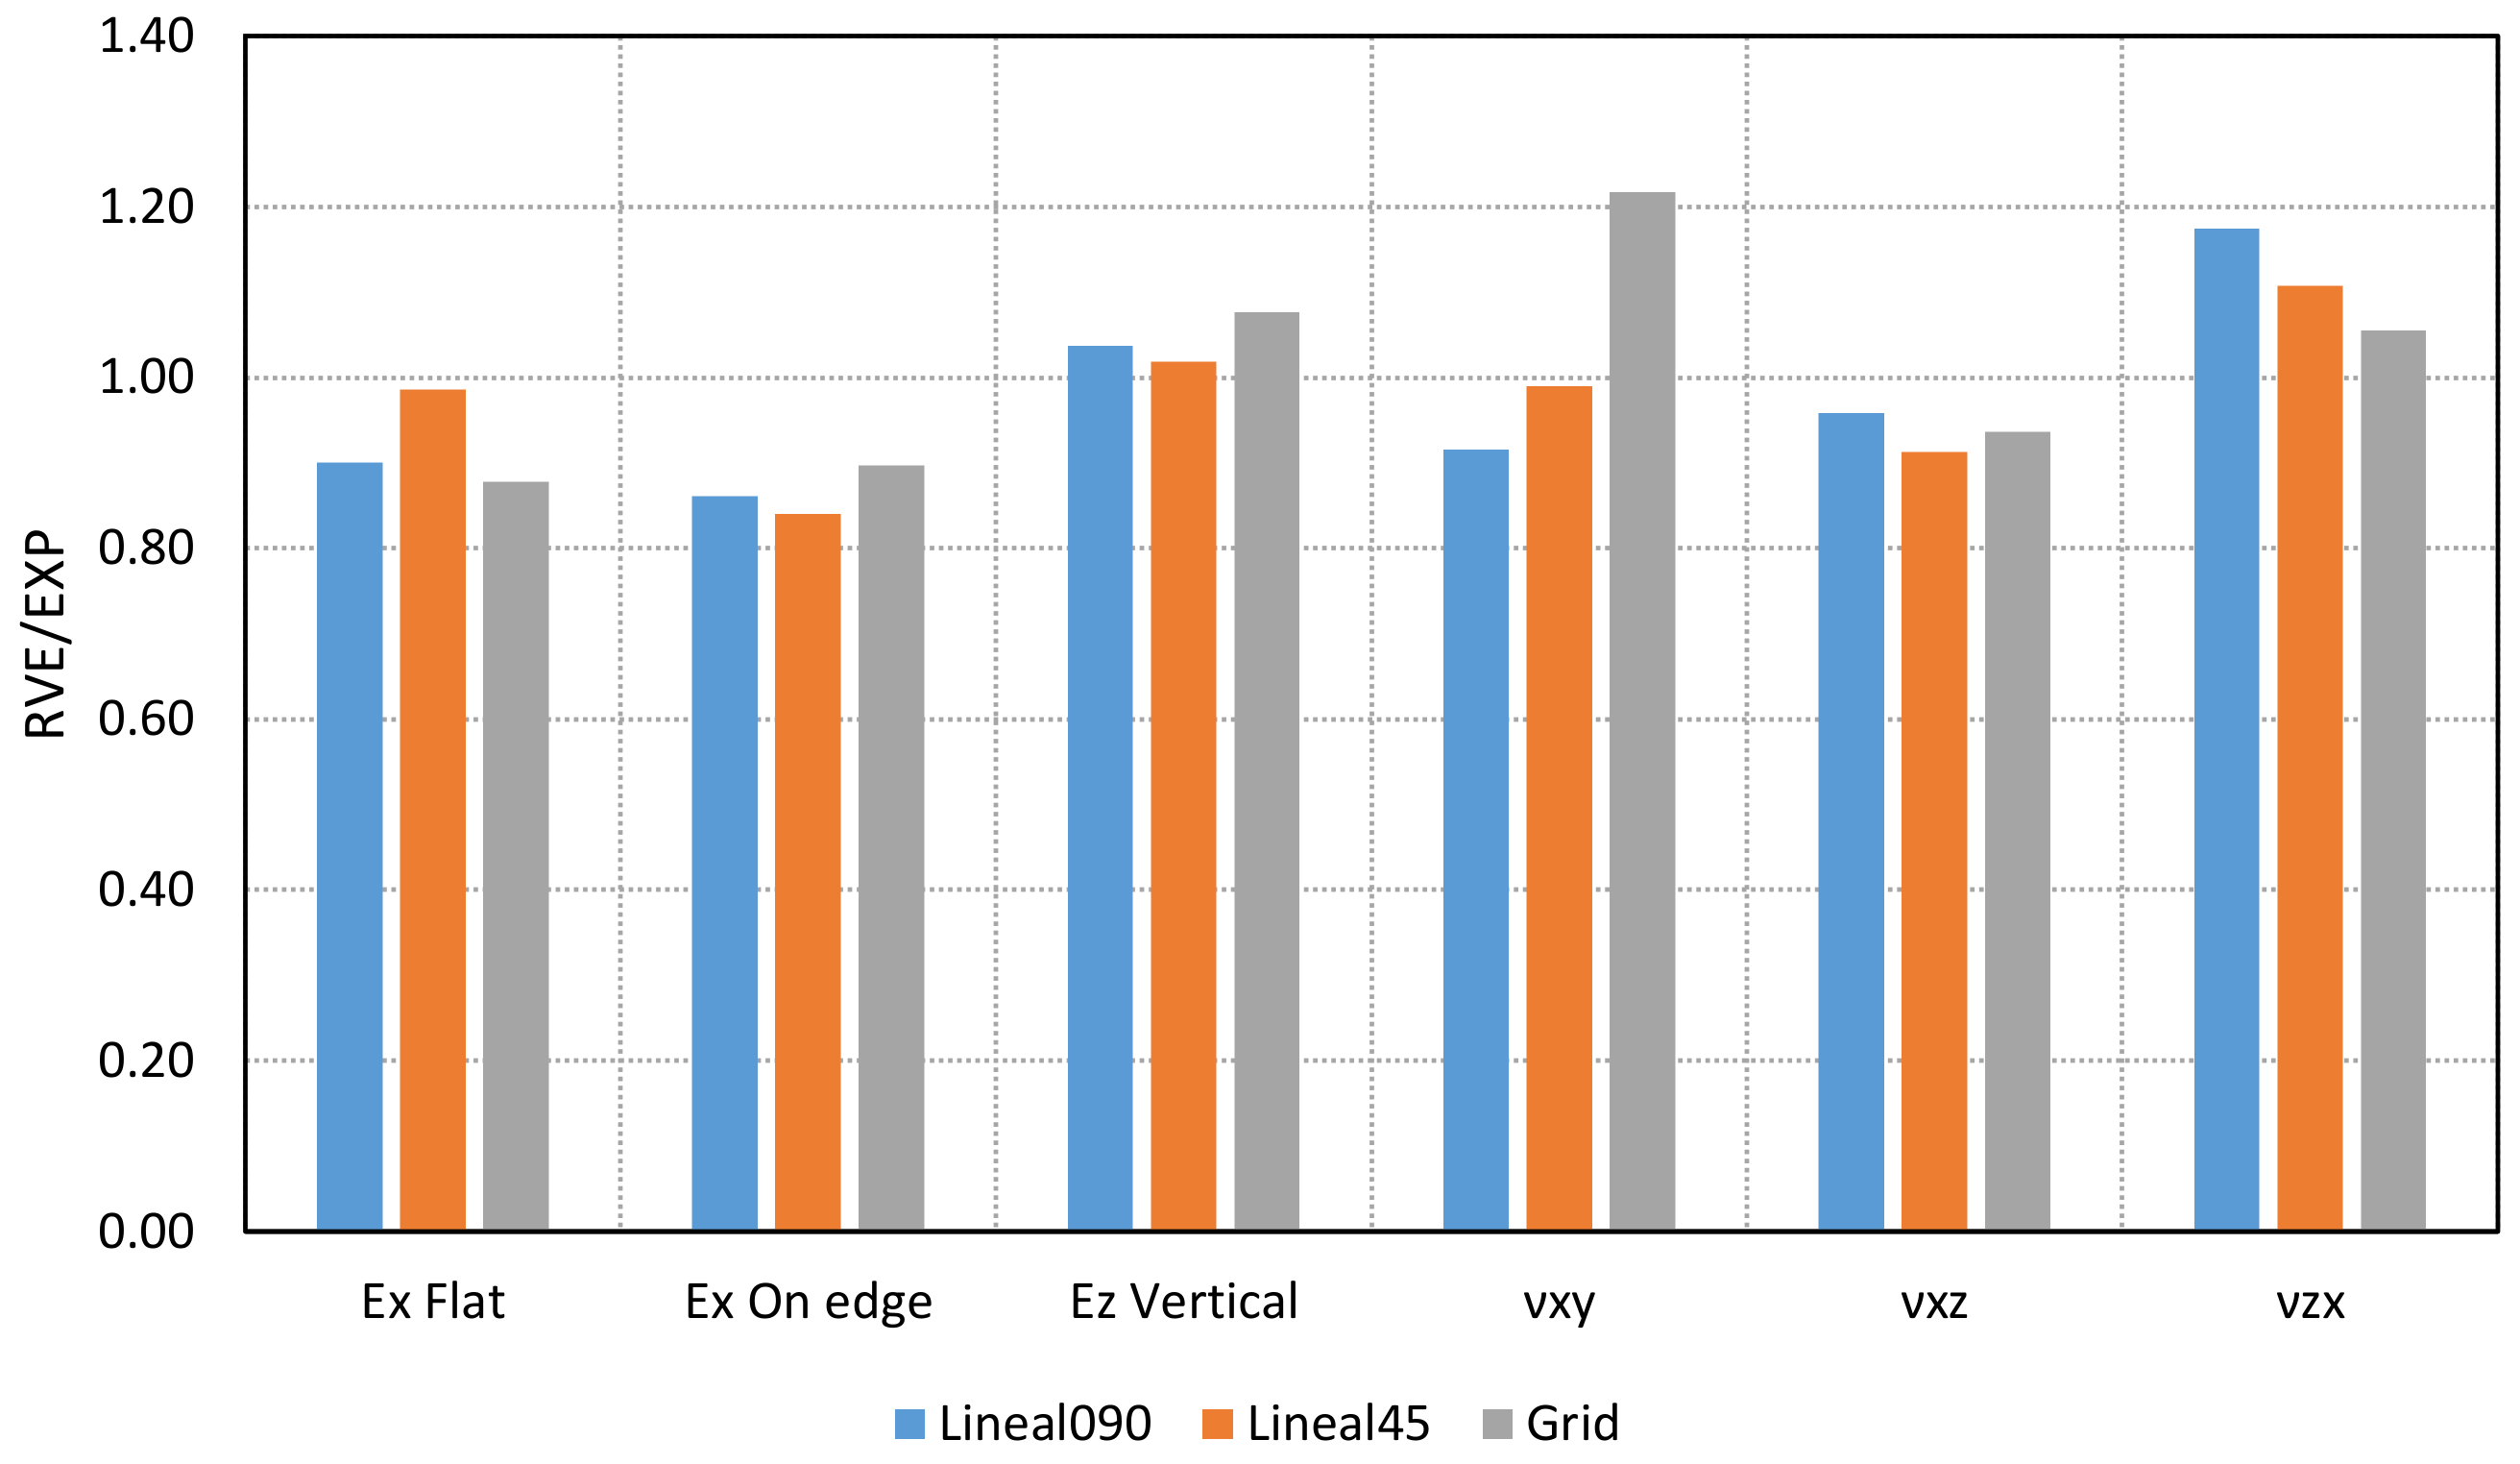
3.3. Comparison of Experimental and Numerical Results
4. Conclusions
Author Contributions
Funding
Institutional Review Board Statement
Informed Consent Statement
Data Availability Statement
Acknowledgments
Conflicts of Interest
References
- Boland, T.; Ovsianikov, A.; Chickov, B.N.; Doraiswamy, A.; Narayan, R.J.; Yeong, W.Y.; Leong, K.F.; Chua, C.K. Rapid prototyping of artificial tissues and medical devices. Adv. Mater. Process 2007, 165, 51–53. [Google Scholar]
- Cabreira, V.; Santana, R.M.C. Effect of infill pattern in Fused Filament Fabrication (FFF) 3D Printing on materials performance. Matéria 2020, 25, 3. [Google Scholar] [CrossRef]
- Lalegani, M.; Khairol, M. The Effects of Combined Infill Patterns on Mechanical Properties in FDM Process. Polymers 2020, 12, 2792. [Google Scholar] [CrossRef] [PubMed]
- Dudescu, C.; Racz, L. Effects of raster orientation, infill rate and infill pattern on the mechanical properties of 3d printed materials. Acta Univ. Cibiniensis—Tech. Ser. 2017, 69. [Google Scholar] [CrossRef] [Green Version]
- Hanon, M.M.; Zsidai, L.; Ma, Q. Accuracy investigation of 3D printed PLA with various process parameters and different colors. Mater. Today Proc. 2021, 42, 3089–3096. [Google Scholar] [CrossRef]
- Harpool, T.D.; Alarifi, I.M.; Alshammari, B.A.; Aabid, A.; Baig, M.; Malik, R.A.; Mohamed Sayed, A.; Asmatulu, R.; EL-Bagory, T.M.A.A. Evaluation of the Infill Design on the Tensile Response of 3D Printed Polylactic Acid Polymer. Materials 2021, 14, 2195. [Google Scholar] [CrossRef] [PubMed]
- Kannan, S.; Vezhavendhan, R.; Kishore, S.; Kanumuru, K.V. Investigating the effect of orientation, infill density with Triple raster pattern on the tensile properties for 3D Printed samples. IOP SciNotes 2020, 1, 024405. [Google Scholar] [CrossRef]
- Letcher, T.; Rankouhi, B.; Javadpour, S. Experimental study of mechanical properties of additively manufactured ABS plastic as a function of layer parameters. In Proceedings of the ASME 2015 International Mechanical Engineering Congress and Exposition, Houston, TX, USA, 13–19 November 2015. IMECE2015-52634. [Google Scholar]
- Naveed, N. Investigating the Material Properties and Microstructural Changes of Fused Filament Fabricated PLA and Tough-PLA Parts. Polymers 2021, 13, 1487. [Google Scholar] [CrossRef]
- Pandzic, A.; Hodzic, D.; Milovanovic, A. Effect of Infill Type and Density on Tensile Properties of PLA Material for FDM Process. In Proceedings of the 30th DAAAM International Symposium on Intelligent Manufacturing and Automation, Vienna, Austria, 23–26 October 2019. [Google Scholar] [CrossRef]
- Yunus, M.; Alsoufi, M.S. Effect of raster inclinations and part positions on mechanical properties, surface roughness and manufacturing price of printed parts produced by fused deposition method. J. Mech. Eng. Sci. 2020, 14, 7416–7423. [Google Scholar] [CrossRef]
- Cuan-Urquizo, E.; Barocio, E.; Tejada-Ortigoza, V.; Pipes, R.B.; Rodriguez, C.A.; Flores, A.R. Characterization of the Mechanical Properties of FFF Structures and Materials: A Review on the Experimental, Computational and Theoretical Approaches. Materials 2019, 12, 895. [Google Scholar] [CrossRef] [PubMed] [Green Version]
- Dizon, J.R.C.; Espera, A.H., Jr.; Chen, Q.; Advincula, R.C. Mechanical characterization of 3d-printed polymers (Review). Addit. Manuf. 2018, 20, 44–67. [Google Scholar] [CrossRef]
- Cantrell, J.T.; Rohde, S.; Damiani, D.; Guranani, R.; DiSandro, L.; Anton, J.; Young, A.; Jerez, A.; Steinbach, D.; Kroese, C.; et al. Experimental characterization of the mechanical properties of 3D-printed ABS and polycarbonate parts. Rapid Prototyp. J. 2017, 23, 811–824. [Google Scholar] [CrossRef]
- Pastor-Artigues, M.M.; Roure-Fernández, F.; Ayneto-Gubert, X.; Bonada-Bo, J.; Pérez-Guindal, E.; Buj-Corral, I. Elastic Asymmetry of PLA Material in FDM-Printed Parts: Considerations Concerning Experimental Characterisation for Use in Numerical Simulations. Materials 2020, 13, 15. [Google Scholar] [CrossRef] [Green Version]
- Huang, T.; Pan, Q.X.; Jin, J.; Zheng, J.L.; Wen, P.H. Continuous constitutive model for bimodulus materials with meshless approach. Appl. Math. Model. 2019, 66, 41–58. [Google Scholar] [CrossRef]
- Vgenopoulos, D.; Sweeney, J.; Grant, C.A.; Thompson, G.P.; Spencer, P.E.; Caton-Rose, P.; Coates, P.D. Nanoindentation analysis of oriented polypropylene: Influence of elastic properties in tension and compression. Polymer 2018, 151, 197–207. [Google Scholar] [CrossRef]
- Song, Y.; Li, Y.; Song, W.; Lee, K.; Lee, K.Y.; Tagarielli, V.L. Measurements of the mechanical response of unidirectional 3D-printed PLA. Mater. Des. 2017, 123, 154–164. [Google Scholar] [CrossRef]
- Chamis, C.C. Analysis of the three-point-bend test for materials with unequal tension and compression properties. In NASA Technical Note TN D-7572; National Aeronautics and Space Administration: Washington, DC, USA, 1974. [Google Scholar]
- Standard Test Method for Tensile Properties of Plastics; ASTM D638-02a; ASTM: West Conshohocken, PA, USA, 2003.
- Standard Test Method for Compressive Properties of Rigid Plastic; ASTM D695-02a; ASTM: West Conshohocken, PA, USA, 2002.
- Flexural Properties of Unreinforced and Reinforced Plastics and Electrical Insulating Materials; ASTM D790-02; ASTM: West Conshoho cken, PA, USA, 2002.
- Available online: https://sn.astm.org/?q=update/mechanical-properties-materials-made-additive-manufacturing-nd13.html (accessed on 14 July 2021).
- Available online: https://3faktur.com/en/3d-printing-materials-technologies/fdm-materials-pla-and-abs/#1454637772510-31c0ee2e-b01f (accessed on 14 July 2021).
- Available online: https://www.makerbot.com/stories/engineering/everything-you-need-to-know-about-pla-3d-printing/ (accessed on 14 July 2021).
- Available online: https://www.sd3d.com/wp-content/uploads/2017/06/MaterialTDS-PLA_01.pdf (accessed on 14 July 2021).
- Available online: https://support.ultimaker.com/hc/en-us/articles/360011962720-Ultimaker-PLA-TDS (accessed on 14 July 2021).
- Sheth, S.; Taylor, R.M.; Adluru, H. Numerical Investigation of Stiffness Properties of FDM Parts as a Function of Raster Orientation. In Proceedings of the 28th Annual International Solid Freeform Fabrication Symposium—An Additive Manufacturing Conference, Austin, TX, USA, 7–9 August 2017. [Google Scholar]
- Somireddy, M.; Czekanski, A. Mechanical Characterization of Additively Manufactured Parts by FE Modeling of Mesostructure. J. Manuf. Mater. Process. 2017, 1, 18. [Google Scholar] [CrossRef] [Green Version]
- Somireddy, M.; Czekanski, A.; Singh, C.V. Development of constitutive material model of 3D printed structure via FDM. Mater. Today Commun. 2018, 15, 143–152. [Google Scholar] [CrossRef]
- Nasirov, A.; Hasanov, S.; Fidan, I. Prediction of Mechanical Properties of Fused Deposition Modeling Made Parts using Multiscale Modeling and Classical Laminate Theory. In Proceedings of the 30th Annual International Solid Freeform Fabrication Symposium—An Additive Manufacturing Conference, Austin, TX, USA, 12–14 August 2019. [Google Scholar]
- Wang, X.; Zhao, L.; Fuh, J.Y.H.; Lee, H.P. Effect of Porosity on Mechanical Properties of 3D Printed Polymers: Experiments and Micromechanical Modeling Based on X-Ray Computed Tomography Analysis. Polymers 2019, 11, 1154. [Google Scholar] [CrossRef] [Green Version]
- Anoop, M.S.; Senthil, P. Homogenisation of elastic properties in FDM components using microscale RVE numerical analysis. J. Braz. Soc. Mech. Sci. Eng. 2019, 41, 540. [Google Scholar] [CrossRef]
- Garzon-Hernandez, S.; Arias, A.; Garcia-Gonzalez, D. A continuum constitutive model for FDM 3D printed thermoplastics. Compos. Part B 2020, 201. [Google Scholar] [CrossRef]
- Academic Research Mechanical; Release 2021 R1; ANSYS Inc.: Canonsburg, PA, USA, 2021.


| Parameter | Value |
|---|---|
| Infill (%) | 99 * |
| Nozzle diameter (mm) | 0.4 |
| Layer height (mm) | 0.1 |
| Shell thickness (mm) | 0 |
| Printing temperature (°C) | 205 |
| Print speed (mm/s) | 50 |
| Extrusion multiplier | 1 |
| Build plate temperature (°C) | 60 |
| Type of adherence to the printing bed | Raft |
| Orientation | Linear090 | Linear45 | Grid | |
|---|---|---|---|---|
| EX (MPa) | Flat | 2284 | 1577 | 1431 |
| EX (MPa) | On-edge | 2388 | 1849 | 1401 |
| EZ (MPa) | Vertical | 2530 | 2304 | 2237 |
| νXY | Flat | 0.243 | 0.392 | 0.393 |
| νXZ | On-edge | 0.279 | 0.231 | 0.201 |
| νZX | Vertical | 0.291 | 0.288 | 0.341 |
| Linear090 | Linear45 | Grid | |
|---|---|---|---|
| EX (MPa) | 2057 | 1555 | 1256 |
| EY (MPa) | 2057 | 1555 | 1256 |
| EZ (MPa) | 2625 | 2346 | 2408 |
| νXY | 0.223 | 0.388 | 0.478 |
| νYX | 0.223 | 0.388 | 0.478 |
| νXZ | 0.267 | 0.211 | 0.188 |
| νZX | 0.341 | 0.319 | 0.360 |
| νYZ | 0.267 | 0.211 | 0.188 |
| νZY | 0.341 | 0.319 | 0.360 |
| Linear090 | Linear45 | Grid | |
|---|---|---|---|
| Density ratio | 0.89 | 0.84 | 0.77 |
| Ratio (RVE/EXP) | ||||
|---|---|---|---|---|
| Orientation | Linear090 | Linear45 | Grid | |
| EX (MPa) | Flat | 0.90 | 0.99 | 0.88 |
| EX (MPa) | On-edge | 0.86 | 0.84 | 0.90 |
| EZ (MPa) | Vertical | 1.04 | 1.02 | 1.08 |
| νXY | Flat | 0.92 | 0.99 | 1.22 |
| νXZ | On-edge | 0.96 | 0.91 | 0.94 |
| νZX | Vertical | 1.17 | 1.11 | 1.06 |
| Density Ratio | Linear090 | Linear45 | Grid |
|---|---|---|---|
| Theoretical | 0.99 | 0.99 | 0.99 |
| RVE (morphological measurements) | 0.89 | 0.84 | 0.77 |
| Precision scale | 0.89 | 0.88 | 0.81 |
Publisher’s Note: MDPI stays neutral with regard to jurisdictional claims in published maps and institutional affiliations. |
© 2021 by the authors. Licensee MDPI, Basel, Switzerland. This article is an open access article distributed under the terms and conditions of the Creative Commons Attribution (CC BY) license (https://creativecommons.org/licenses/by/4.0/).
Share and Cite
Bonada, J.; Pastor, M.M.; Buj-Corral, I. Influence of Infill Pattern on the Elastic Mechanical Properties of Fused Filament Fabrication (FFF) Parts through Experimental Tests and Numerical Analyses. Materials 2021, 14, 5459. https://doi.org/10.3390/ma14185459
Bonada J, Pastor MM, Buj-Corral I. Influence of Infill Pattern on the Elastic Mechanical Properties of Fused Filament Fabrication (FFF) Parts through Experimental Tests and Numerical Analyses. Materials. 2021; 14(18):5459. https://doi.org/10.3390/ma14185459
Chicago/Turabian StyleBonada, Jordi, Mª Magdalena Pastor, and Irene Buj-Corral. 2021. "Influence of Infill Pattern on the Elastic Mechanical Properties of Fused Filament Fabrication (FFF) Parts through Experimental Tests and Numerical Analyses" Materials 14, no. 18: 5459. https://doi.org/10.3390/ma14185459
APA StyleBonada, J., Pastor, M. M., & Buj-Corral, I. (2021). Influence of Infill Pattern on the Elastic Mechanical Properties of Fused Filament Fabrication (FFF) Parts through Experimental Tests and Numerical Analyses. Materials, 14(18), 5459. https://doi.org/10.3390/ma14185459