Article

Preparation of Crystalline LaFeO3 Nanoparticles at Low Calcination Temperature: Precursor and Synthesis Parameter Effects

1
College of Mechanical and Power Engineering, Shenyang University of Chemical Technology, Shenyang 110142, China
2
Key Laboratory of Interfacial Physics and Technology, Shanghai Institute of Applied Physics, Chinese Academy of Sciences, Shanghai 201800, China
3
University of Chinese Academy of Sciences, No. 19(A) Yuquan Road, Shijingshan District, Beijing 100049, China
*
Authors to whom correspondence should be addressed.
Materials 2021, 14(19), 5534; https://doi.org/10.3390/ma14195534
Submission received: 3 September 2021 / Revised: 15 September 2021 / Accepted: 17 September 2021 / Published: 24 September 2021

Abstract

:
Substantial effort has been devoted to fabricating nanocrystalline lanthanum ferrite (LaFeO3), and calcination is the crucial process of crystallization in both high-temperature strategies and wet chemical methods. Lowering the calcination temperature gives the ability to resist the growth and agglomeration of nanoparticles, therefore contributing to preserve their unique nanostructures and properties. In this work, we prepared crystalline LaFeO3 nanoparticles with a calcination process at 500 °C, lower than the calcination temperature required in most wet chemistry methods. Correspondingly, the experimental conditions, including stoichiometric ratios, pH values, precipitants, complexant regent, and the calcination temperatures, were investigated. We found that the crystalline LaFeO3 was formed with crystalline NaFeO2 after calcination at 500 °C. Furthermore, the structure of FeO6 octahedra that formed in coprecipitation was associated with the process of crystallization, which was predominantly determined by calcination temperature. Moreover, an illusion of pure-phase LaFeO3 was observed when investigated by X-ray diffraction spectroscopy, which involves amorphous sodium ferrite or potassium ferrite, respectively. These findings can help prepare nanostructured perovskite oxides at low calcination temperatures.

1. Introduction

Lanthanum ferrite (LaFeO3, LFO) is a prominent ABO3-type perovskite oxide that has great potential applications in advanced technologies such as solid-oxide fuel cells and molten salt batteries owing to the unique electrochemical activities and thermal properties. Nowadays, a large number of synthetic methods to fabricate LFO-based perovskite oxides have been developed, including high-temperature strategies (i.e., solid-state reaction [1,2] and molten salt synthesis [3,4,5]) and wet chemical methods such as electrochemical deposition [6,7], electrospinning [8], microwave plasma [9], sol–gel [10,11,12,13,14,15,16], combustion [17], hydrothermal [18,19,20], and precipitation [21,22]. High-temperature strategies have been widely utilized for the fabrication of bulk LFO-based oxides that often require a calcination process at high temperatures (above 800 °C). Wet chemical methods are extensively utilized to fabricate LFO-based perovskite nanostructures that usually involve a sol–gel or coprecipitation process for precursor preparation and a calcination process for crystallization. Lowering the calcination temperature is vital for LFO-based perovskite nanostructures to avert morphology evolution and recrystallization [23,24,25].
On the other hand, calcination temperature is particularly associated with the crystallinity of LFO nanostructures. Lowering the calcination temperature is not only advantageous to avoid the particle growth and agglomeration during high-temperature processes, but also advantageous to decrease the energy consumption, as well as carbon dioxide emissions. For wet chemical methods, a calcination temperature above 600 °C is essential to prepare crystalline LFO nanostructures. In the sol–gel method, a precalcination process at 500 °C before calcination at 600 °C is capable of improving the crystallinity of nanoporous LFO powders; yet, it is difficult to form nanocrystalline LFO merely with a calcination process at 500 °C [26]. The coprecipitation method is normally used to prepare doped-LFO perovskite oxides with a requirement of high-temperature calcination. Even though it is hard to obtain pure-phase LFO without the use of complexant regents, the coprecipitation method is an ideal path to investigate the influence of experimental conditions and the mechanism of calcination.
In this work, we prepared crystalline LFO nanoparticles via a strictly controlled coprecipitation method with a calcination temperature of 500 °C. We investigated the effects of stoichiometric ratio, pH value, precipitants, complexant regent, and calcination temperature. We found that the precursors precipitated by aqueous NaOH or KOH at pH 10 successfully crystallized upon calcination at 500 °C, and the use of polyvinylpyrrolidone (PVP) had little influence on crystallization temperature. Moreover, an illusion of pure-phase crystalline LFO nanoparticles was observed in XRD patterns. We deduced that the structure of FeO6 octahedra formed in precursors is closely related to LFO’s crystallization temperature, which provides insight for the preparation of nanostructured perovskite oxides at low calcination temperatures.

2. Experimental Section

Materials: Crystalline LFO nanoparticles were prepared by a conventional coprecipitation method with calcination at different temperatures. In brief, as-received La(NO3)3·6H2O (99.9%, Macklin, Shanghai, China) and Fe(NO3)3·9H2O (99.9%, Macklin, Shanghai, China) with different La/Fe stoichiometric ratios were dissolved in Milli-Q water with stirring at 300 r·min−1 for 2 h using a magnetic stirrer. Aqueous alkali was then dropped into the obtained homogenized solution until pH 10 with stirring at 600 r·min−1 in an hour. The precipitates after centrifugation at 5000 rpm were thoroughly washed by Milli-Q water until pH 7 and subsequently dried at 60 °C for 24 h. Finally, the washed (pH 7) and unwashed (pH 10) precursors were both calcined at different temperatures for 6 h. NaOH (96%, Aladdin, Shanghai, China) and KOH (90%, Aladdin, Shanghai, China) were dissolved in Milli-Q water with the concentration of 6 M and then used to precipitate the precursors, and ammonia (25–28%, Aladdin, Shanghai, China) was used as a precipitant without dilution. Polyvinylpyrrolidone (PVP) with an average molecular weight of 40,000 (99%, ACMEC, Shanghai, China) was used as the complexant agent to regulate the processes of both precipitation and calcination.
Characterization: Morphologies of as-prepared LFO nanoparticles were investigated by a LEO 1530VP scanning electron microscope (SEM, Merlin Compact, Oberkochen, Germany) and Tecnai G2 F20 S-Twin high-resolution transmission electron microscope (HR-TEM, FEI, Hillsboro, OR, USA) with an energy-dispersive spectroscopy (EDS, Oberkochen, Germany) detector. The crystal structures of all samples were collected via a Bruker AXS D8 Advance X-ray diffractometer (XRD, Billerica, MA, USA) equipped with a Cu Kα radiation source (λ = 1.5406 Å), using a 2θ angle range from 20° to 80° in continuous scanning mode (step length 0.02) at scanning speeds of 0.11°/s and 0.012°/s, respectively. The Rietveld refinement was employed to study the lattice parameters using GSAS, and the Scherrer equation was adopted to evaluate the particle size. Raman spectra were collected by XploRA INV (HORIBA, Jobin Yvon, Palaiseau, France) with a laser wavelength of 473 nm. X-ray photoelectron spectroscopy (XPS, Shimadzu, Hongkong, China) analysis was performed by an Axis Supra with Al Kα radiation, and the binding energy was corrected using the C 1s level at 284.8 eV as an internal standard.

3. Results

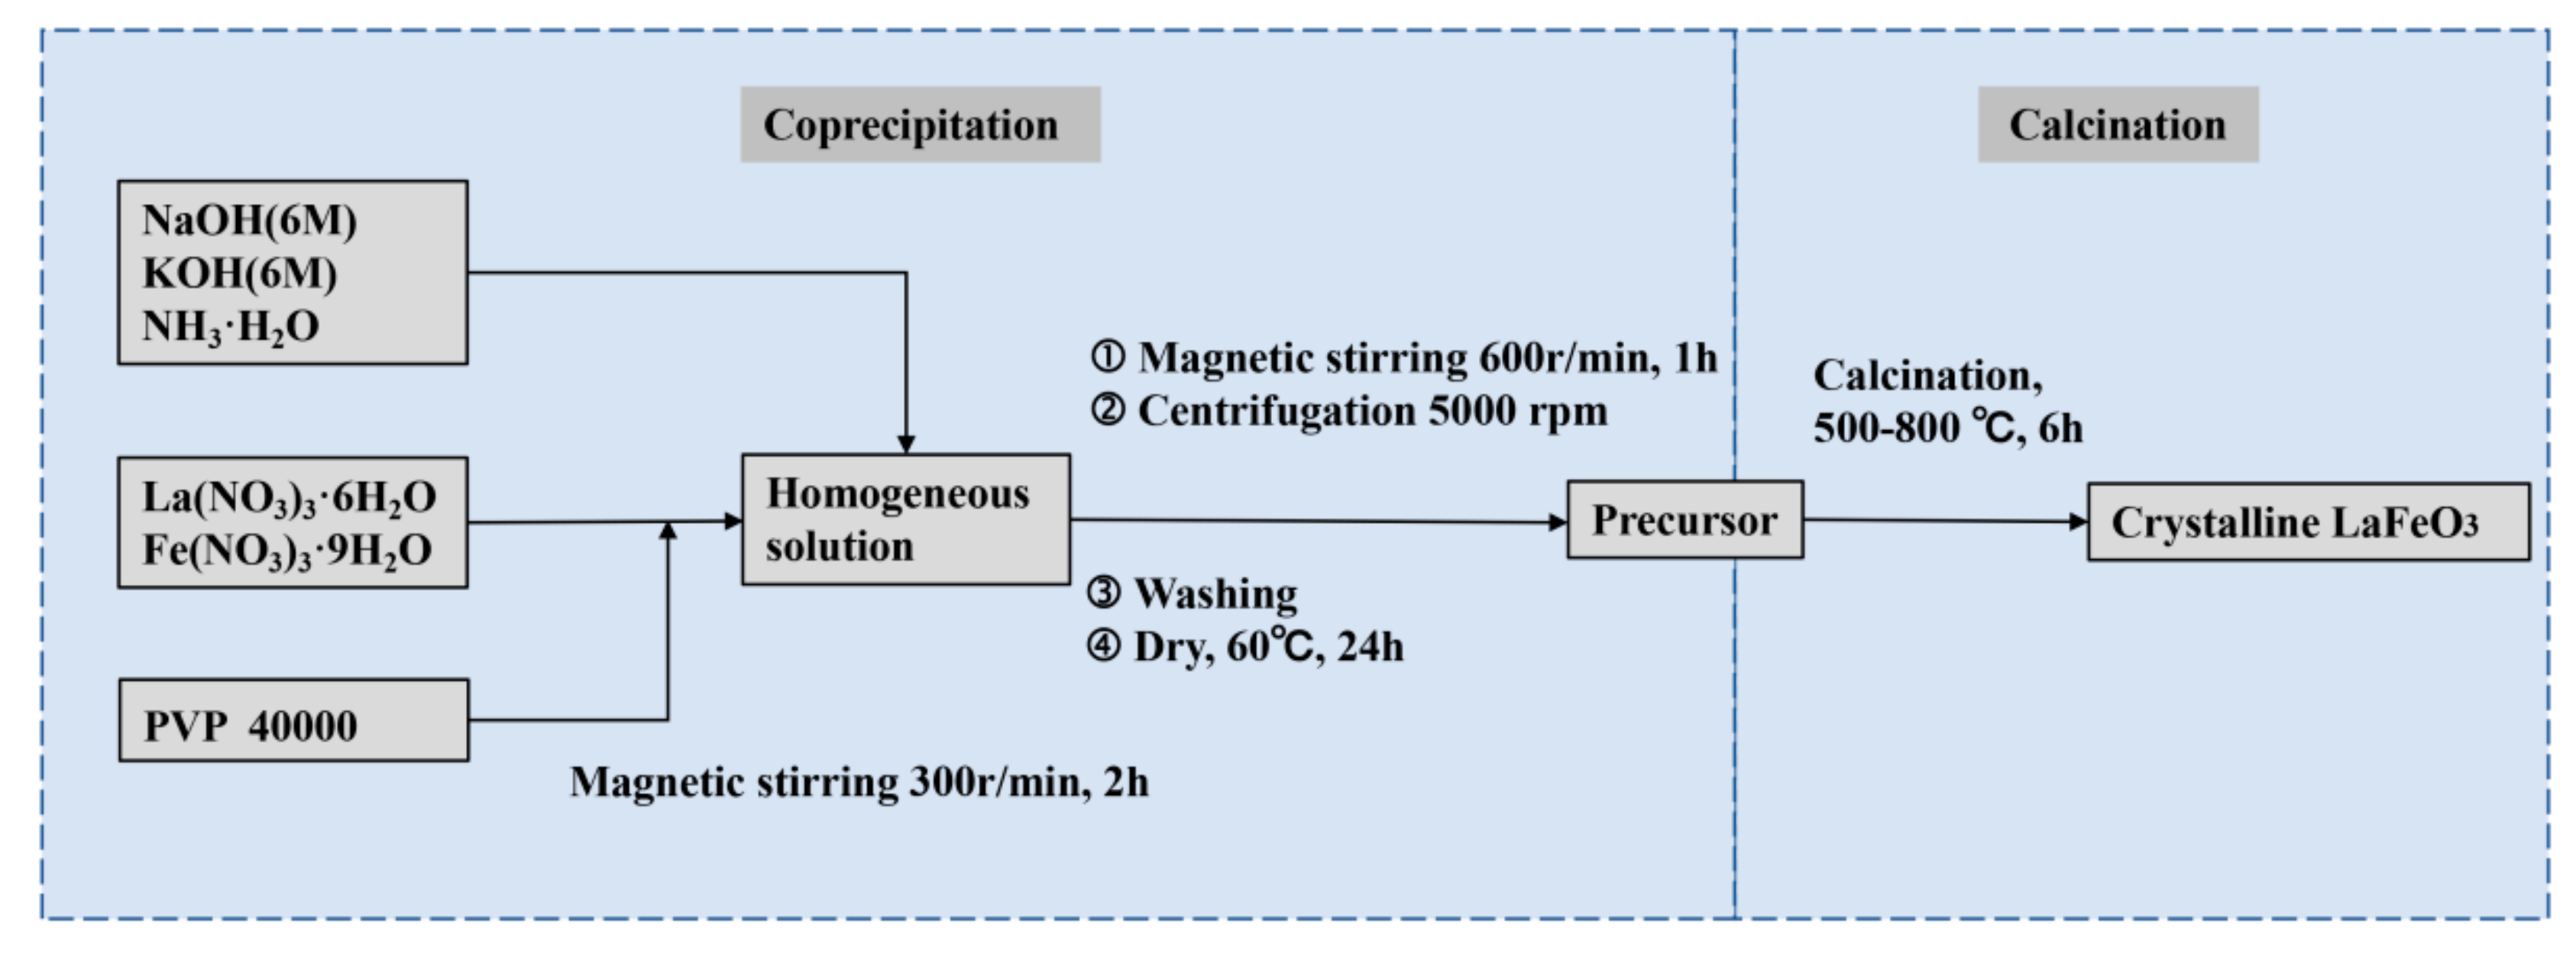
3.1. Preparation of Crystalline LFO Nanoparticles

As shown in the synthesis route in Figure 1, we prepared the precursors of crystalline LFO nanoparticles via a conventional coprecipitation method where aqueous sodium and potassium hydroxide, as well as ammonia, were used as precipitants, respectively. Subsequently, the as-prepared precursors were calcined at different temperatures to complete crystallization. Table 1 presents the phases of products identified by X-ray diffraction spectroscopy (XRD) under different conditions, including La/Fe stoichiometric ratios, pH values, and calcination temperatures, respectively. It unveils that the crystallized LFO phase was formed when the La/Fe stoichiometric ratio was higher than 3:7 and the calcination temperature was above 500 °C.

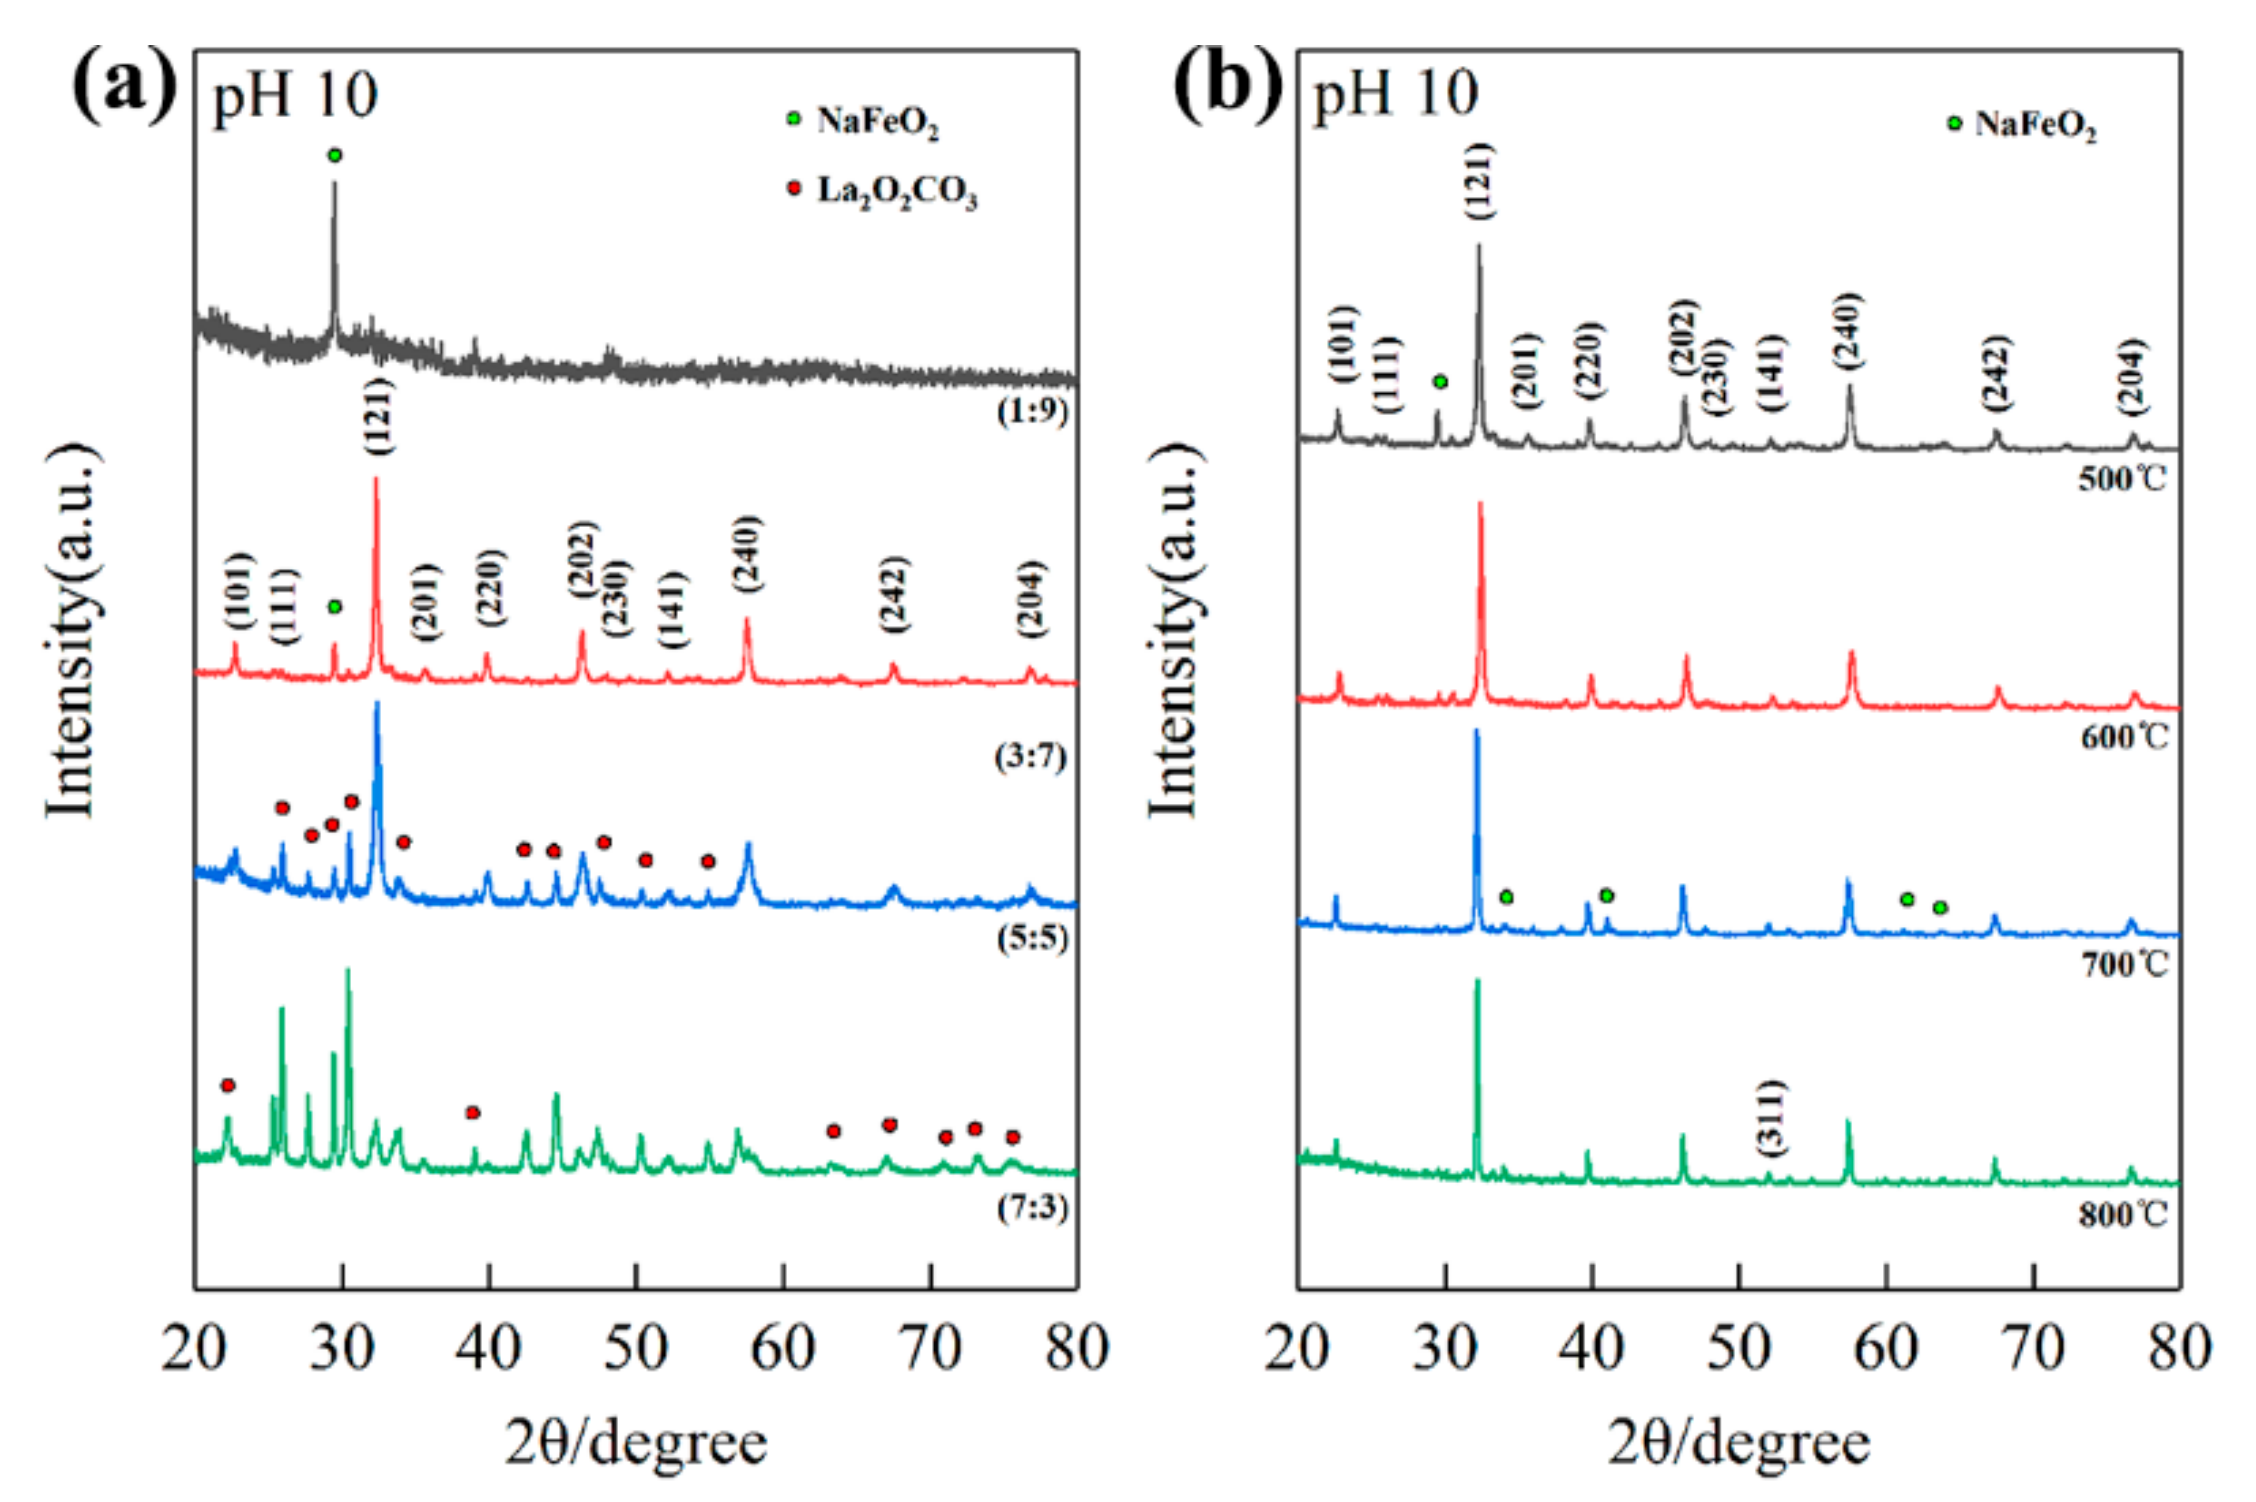
3.2. Influences of La/Fe Stoichiometric Ratios

Figure 2a shows the XRD patterns of different La/Fe stoichiometric ratios after precipitation at pH 10 and calcination at 500 °C. As the La/Fe ratio increased from 1:9 to 7:3, La-contained phases such as LaFeO3 and La2O2CO3 emerged gradually. The single diffraction peak at 29.6° in the XRD pattern of La/Fe 1:9 should be attributed to NaFeO2 according to JCPDS 13-0521, indicating that the La concentration is insufficient to form crystalline LaFeO3. The diffraction peaks at 22.6°, 25.3°, 32.2°, 36.1°, 39.7°, 46.1°, 47.6°, 51.9°, 57.4°, 67.3°, and 76.6° in the XRD pattern of La/Fe ratio 3:7 should be attributed to the crystal planes (101), (111), (121), (201), (220), (202), (230), (141), (240), (242), and (204) in orthogonal LaFeO3, respectively, in accordance with JCPDS 37-1493. It indicates the formation of crystalline LaFeO3. The other diffraction peaks at 29.5°should be attributed to the crystal plane (120) in NaFeO2, indicating that NaFeO2 was formed as well. It further implies that crystalline LaFeO3 and NaFeO2 were formed together during calcination at 500 °C. Except the characteristic diffraction peaks of LaFeO3 and NaFeO2, the presence of diffraction peaks at 22.2°, 25.1°, 27.6°, 30.3°, 33.6°, 42.5°, 44.4°, 47.4°, 50.2°, 52.1°, 54.7°, 56.9°, 57.8°, 63.2°, 66.9°, 70.8°, and 73.1° in the XRD pattern of La/Fe 7:3 should be attributed to the crystal planes (004), (100), (101), (102), (103), (006), (106), (110), (112), (107), (116), (201), (203), (1110), (206), (211), and (213) in hexagonal La2O2CO3, respectively, in accordance with JCPDS 37-0804. It indicates the formation of crystalline La2O2CO3 resulting from the excess La concentration. In addition, Figure S1b shows the XRD patterns of La/Fe 5:5 (pH = 7) after calcination at different temperatures. The characteristic diffraction peaks of La2O2CO3 first emerged after calcination at 500 °C, and then the characteristic diffraction peaks of LaFeO3 emerged after calcination at 600 °C. It indicates that La2O2CO3 and LaFeO3 crystallized during calcination at 500 °C and 600 °C, respectively. The single weak diffraction peak at about 40° in the XRD pattern of La/Fe 5:5 (pH = 7) after calcination at 500 °C is notable, which should be attributed to the crystal plane (220) in LaFeO3. It implies that the element of Fe might exist in amorphous LaFeO3.

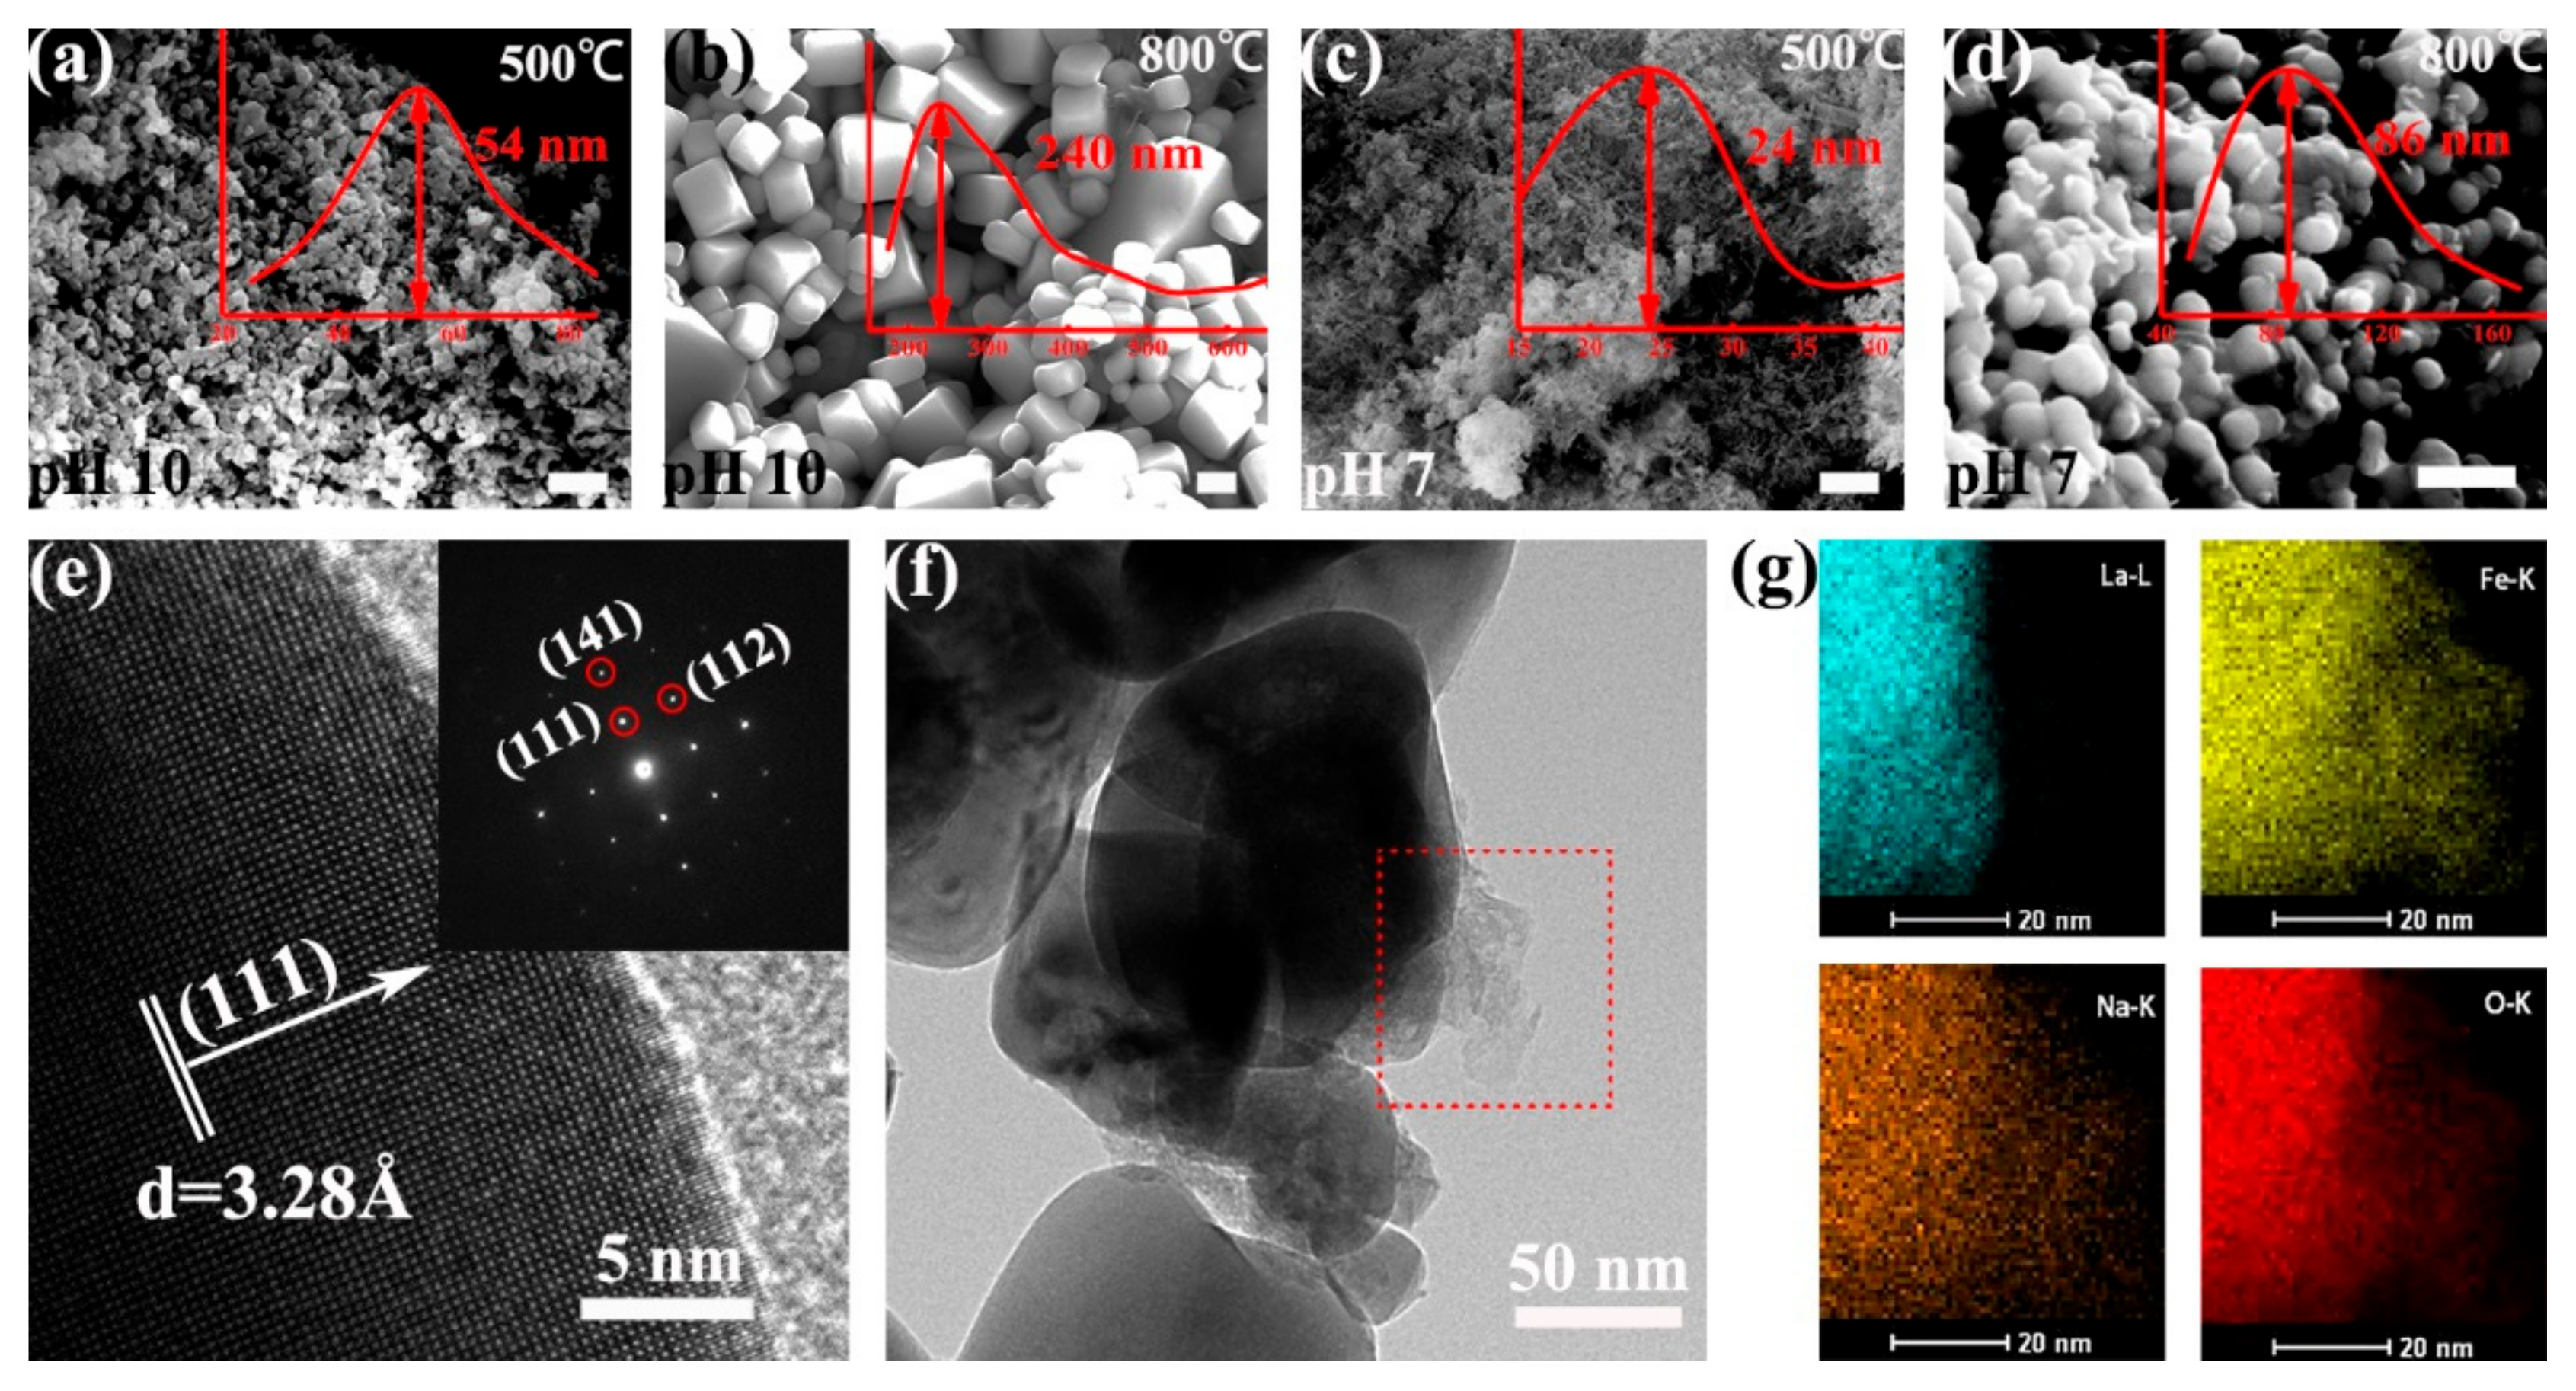
3.3. Influence of pH Values and Calcination Temperatures

Next, we analyzed the XRD patterns of different pH values and different calcination temperatures, respectively. The characteristic diffraction peaks of LaFeO3 emerged in the XRD patterns of La/Fe 1:9 (Figure S1a) after calcination at 600 °C (pH 10) and 700 °C (pH 7), respectively, and emerged in the XRD patterns of both La/Fe 3:7 (Figure 2a) and 5:5 (Figure S1b) after calcination at 500 °C (pH 10) and 600 °C (pH 7), respectively. It strongly indicates that high pH values benefitted crystallization at lower calcination temperatures. Figure S1a shows the presence of Fe2O3 and NaFeO2 at pH 7 and pH 10, respectively, in the XRD pattern of La/Fe 1:9 after calcination at 700 °C, further indicating the influence of pH value. Figure S1b,c show that the characteristic diffraction peaks of La2O2CO3 vanished and the characteristic diffraction peaks of La2O3 emerged after calcination (La/Fe 5:5 and 7:3) above 700 °C, indicating the conversion from La2O2CO3 to La2O3. As shown in Figure 2b, the two characteristic diffraction peaks of NaFeO2 at 22.9° vanished when the calcination temperature increased from 500 °C to 600 °C, and another four characteristic diffraction peaks of NaFeO2 at 34.7°, 36.1°, 41.1°, and 61.2° emerged when the calcination temperature further increased to 700 °C. It indicates the significant influence of calcination temperature on NaFeO2 crystallization. Particularly, a single orthogonal perovskite LaFeO3 was observed in the XRD patterns of La/Fe 3:7 (pH 7) after calcination at 600 °C (Figure S2), which is prone to induce the illusion of purely crystalline LaFeO3. To determine lattice parameters of LFO, we further collected the XRD pattern of both La/Fe 3:7 pH 10 and 7 at a lower scanning speed (0.012°/s) via Rietveld refinement (Figure S3). Table S1 presents the lattice parameters of LFO in the sample of La/Fe 3:7 pH 10 after calcination at 500 °C (Pnma, a = 5.5536, b = 7.8490, c = 5.5503, Rp = 5.72%, Rwp = 7.87%) and in the sample of La/Fe 3:7 pH 7 after calcination at 600 °C (Pbnm, a = 5.5536, b = 5.5503, c = 7.8490, Rp = 4.52%, Rwp = 5.73%), where both of them are similar to those reported in the literature [5,27]. Furthermore, the average length of the Fe–O bond in the sample La/Fe 3:7 (pH 7) after calcination at 600 °C (2.084 Å) was larger than that in the sample La/Fe 3:7 (pH 10) after calcination at 500 °C (2.015 Å), whereas the unit cell volume of LFO in the sample La/Fe 3:7 (pH 7) after calcination at 600 °C (241.741 Å3) was less than that in the sample La/Fe 3:7 (pH 10) after calcination at 500 °C (241.015 Å3). Moreover, Table S3 shows that the crystallinity of the sample La/Fe 3:7 (pH 7) after calcination at 600 °C was merely 28.35%, significantly less than that of the sample La/Fe 3:7 (pH 10) after calcination at 500 °C (75.32%). This indicates that the quality of the obtained LaFeO3 perovskite in the sample La/Fe 3:7 (pH 7) after calcination at 600 °C was lower than that in the sample La/Fe 3:7 (pH 10) after calcination at 500 °C; it also indicates more defects in the sample La/Fe 3:7 (pH 7) after calcination at 600 °C in comparison with the sample La/Fe 3:7 (pH 10) after calcination at 500 °C.
We then investigated the morphologies of the as-prepared LFO (La/Fe 3:7) after calcination at different temperatures using scanning electron microscopy (SEM) and high-resolution transmission electron microscopy (HR-TEM). We observed that calcination temperature and pH value had remarkable influences on the shape of the LFO nanoparticles. As shown in Figure 3a–d, the shape of as-prepared LFO (pH 10) resembled uniform nanoparticles (average diameter ~54 nm) and cubic-like nanoparticles (average diameter ~240 nm) after calcination at 500 °C and 800 °C, respectively. In contrast, the shape of as-prepared LFO (pH 7) resembled ultrasmall nanoparticles (average diameter ~24 nm) and spherical nanoparticles (average diameter ~86 nm) after calcination at 500 °C and 800 °C, respectively. We further calculated the average particle size of LFO in the sample La/Fe 3:7 and pH 10 after calcination at 500 °C from the XRD pattern in Figure S3 using the Scherrer formula. As shown in Table S2, the average particle size of LFO was ~29 nm, slightly smaller than the statistical diameter (~54 nm) from the SEM image in Figure 3a. The HR-TEM image shows that the as-prepared LFO (pH 10) contained an amorphous phase and crystalline phase, and the selected-area electron diffraction (SAED) pattern confirmed that the crystalline phase was LFO (Figure 3e,f). Energy-dispersive spectroscopy (EDS) analysis further revealed the distribution of Fe, La, Na, and O at the interface between crystalline LFO and the amorphous phase (Figure 3g). It is worth noting that the La distribution constrained inside the crystalline LFO, whereas Fe, Na, and O elements distributed in both crystalline LFO and the amorphous phase. It indicates the amorphous NaFeO2 located outside the crystalline LFO nanoparticles and the formation of NaFeO2/LFO heterostructures. In addition, Table S4 lists the atomic contents of Fe, La, and O in the precursors of La/Fe 3:7 (pH 10 and 7) before and after calcination, respectively. The O-content in the precursor (pH 7) was 63.3% and then increased to 68.6% after calcination at 600 °C, whereas the O-content in the precursor (pH 10) remained at 61.4% even after calcination at 500 °C.

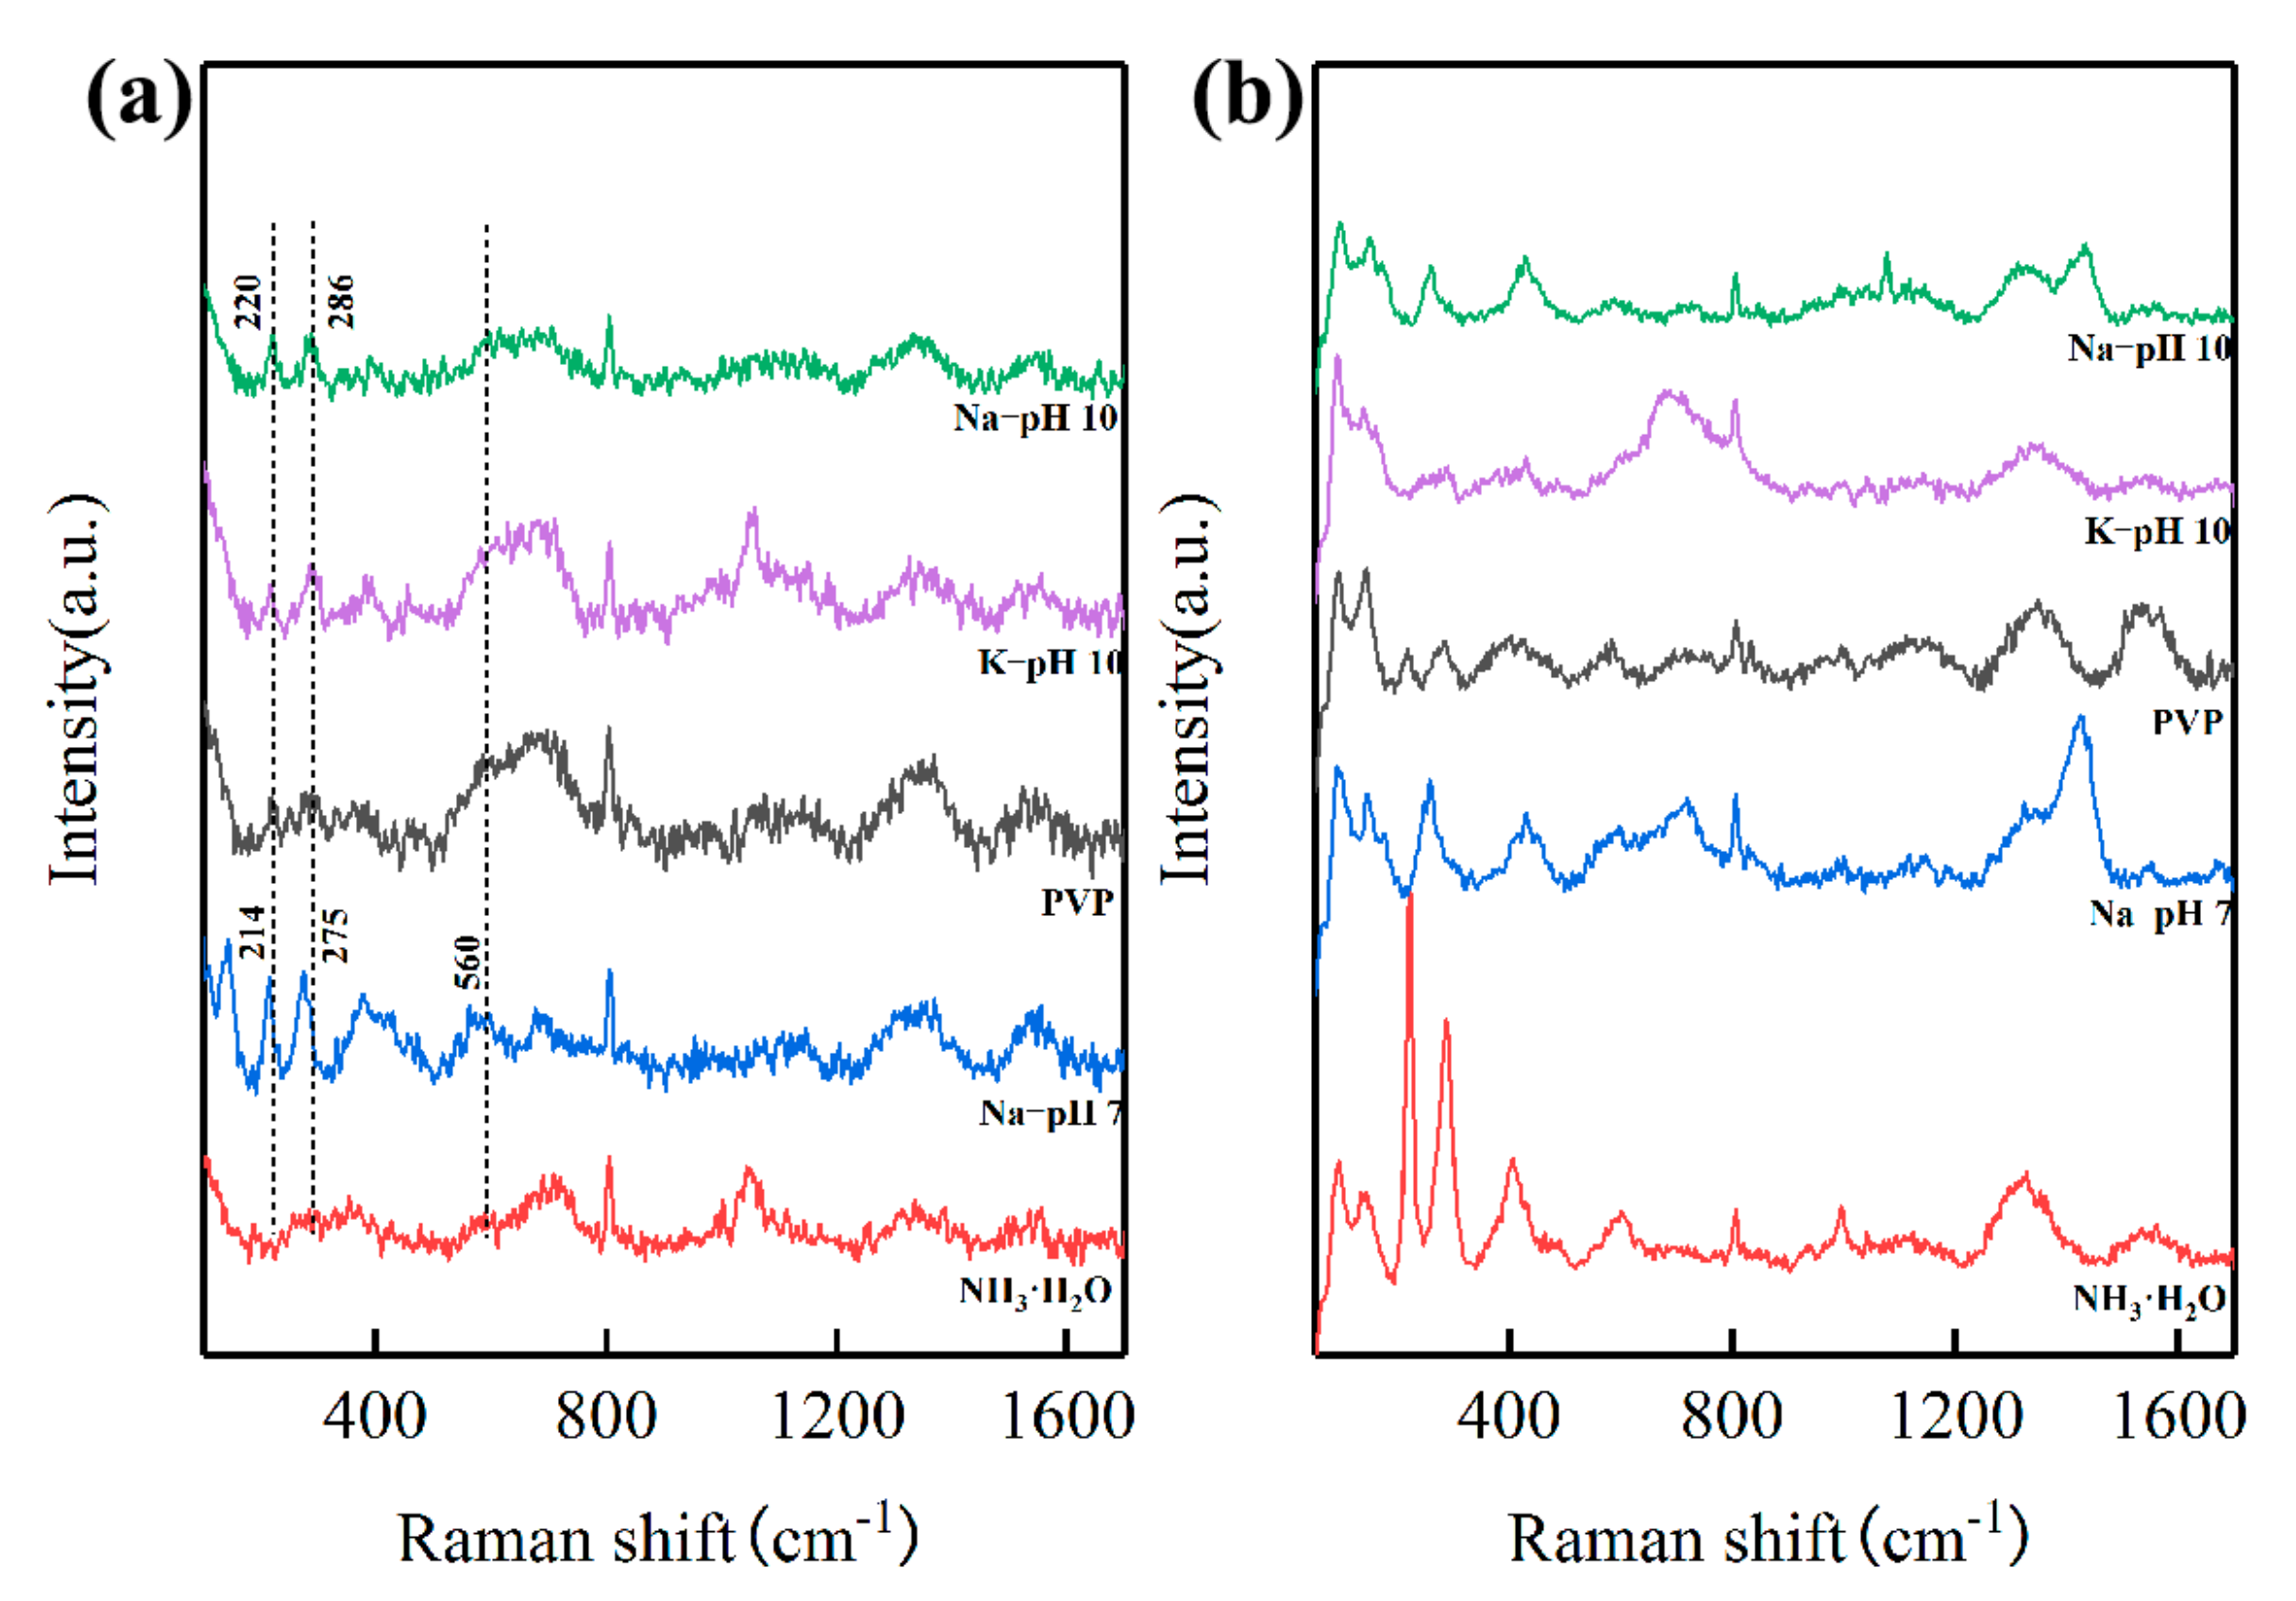
3.4. Influence of Precipitants

To investigate the influence of precipitants, we further prepared precursors (La/Fe 3:7) using aqueous potassium hydroxide and ammonia. When precipitated by ammonia, a single diffraction peak at 32.1° of the LFO phase was observed after calcination at 500 °C, and a series of characteristic diffraction peaks assigned to perovskite LFO emerged after calcination at 600 °C (Figure 4a). As the calcination temperature increased to 700 °C, the characteristic diffraction peaks of the LFO phase significantly strengthened, coupling with the presence of the Fe2O3 phase and La2O3 phase. SEM images in Figure S4 demonstrate that the size of as-prepared LFO nanoparticles after calcination at 800 °C was considerably larger than that after calcination at 500 °C.
As opposed to the precipitated ammonia and NaOH solution, the phases of LFO, Fe2O3, and La2O2CO3 emerged when precipitated by KOH solution (6 M) after calcination at 500 °C. Figure 4b shows that the phase of perovskite LFO strengthened, whereas the phases of Fe2O3 and La2O2CO3 vanished after calcination at 700 °C. Figure S5 reveals that the size of as-prepared LFO nanoparticles after calcination 800 °C was around 100 nm, far smaller than that of LFO nanoparticles prepared by ammonia or NaOH solution. HR-TEM images in Figure S6 show that the as-prepared LFO after calcination at 800 °C comprised the crystallized phase and amorphous phase, similar to those of the LFO prepared by NaOH solution after calcination at 800 °C. In detail, the lattice planes with a distance of d~3.57 Å were in good agreement with the (111) plane of the perovskite LFO, which is clear evidence of crystalline LFO nanoparticles. Fe, La, K, and O mapping images demonstrate that the amorphous phase contained iron and potassium, similar to those of as-prepared LFO heterostructures after calcination at 800 °C.

3.5. Influence of Polyvinylpyrrolidone

We also prepared precursors (La/Fe 3:7) precipitated by aqueous NaOH (pH 10) with the use of polyvinylpyrrolidone (PVP) to investigate the influence of complexant agents. As shown in Figure 4c, the phases of Fe2O3 and La2O2CO3 emerged with the phase of perovskite LFO with the use of PVP after calcination at 500 °C, whereas the phase of NaFeO2 emerged with the phase of perovskite LFO without the use of PVP. The XRD patterns of the samples with the use of PVP presented a single orthogonal perovskite LaFeO3 with strengthened diffraction peaks after calcination above 700 °C. Figure S7 shows morphologies of the as-prepared LFO nanoparticles with the use of PVP after calcination at 500 °C and 800 °C, respectively. It shows that crystalline LFO nanoparticles were formed after calcination at 800 °C, similar to the effects of using aqueous KOH as a precipitant.

3.6. Mechanism Investigation

In order to investigate the mechanism of lowering the calcination temperature, the precursors prepared under different conditions before and after calcination at 800 °C were probed using Raman spectroscopy, which is sensitive to the LFO-based perovskite structure [28,29,30]. The Raman spectra of the precursors prepared under different conditions after calcination at 800 °C are shown in Figure 5b. The Raman modes for orthorhombic LFO perovskite structures at 100~200 cm−1, 200~300 cm−1, 400~450 cm−1, 500~700 cm−1, and 1320~1350 cm−1 were observed in all samples, corresponding to La vibrations, oxygen octahedral tilt, oxygen octahedral bending vibrations, oxygen stretching vibrations, and the second-order scattering of oxygen vibrations, respectively.
Of note, Figure 5a shows the two important modes at 220 cm−1 and 286 cm−1 in the precursor prepared by NaOH solution (pH 10), indicating the formation of FeO6 octahedra. Identical peaks were observed in the precursor prepared by the KOH solution as well. However, these two peaks shifted to 214 cm−1 and 275 cm−1, respectively, when prepared by NaOH solution (pH 7), indicating that looser FeO6 octahedra were formed. Furthermore, another peak shift was also observed in the range from 500 cm−1 to 700 cm−1, indicating that the antisymmetric stretching motion of the oxygen octahedra in the precursor prepared at pH 10 was stronger than that in the precursor prepared at pH 7. The peak shifts in both ranges indicate that the atomic distance inside FeO6 octahedra in the precursor prepared at pH 10 was closer than that in the precursor prepared at pH 7, thus requiring less energy for the formation of perovskite LFO.
We further explored the X-ray photoelectron spectra (XPS) of as-prepared nanocrystalline LFO after calcination at 500 °C and the precursors prepared by NaOH solution at pH 10 and 7, respectively. As shown in Figure S8, two pairs of XPS peaks at ~855 eV (~851 eV) and ~838 eV (~835 eV) should be assigned to La 3d3/2 and 3d5/2, respectively. The XPS peaks at ~724 eV and ~711 eV should be assigned to Fe 2p1/2 and 2p3/2, respectively. In detail, the peaks of Fe 2p1/2 and Fe 2p3/2 in the precursor La/Fe 3:7 (pH 7) were 724.69 eV and 710.19 eV, respectively, slightly lower than those of 725.52 eV and 711.11 eV, respectively, in the precursor La/Fe 3:7 (pH 10). Considering that the values of Fe 2p1/2 and Fe 2p3/2 in the precursor La/Fe 3:7 (pH 10) is consistent with the values of Fe (III) in standard Fe2O3 [31], we speculate that the oxidation of Fe in precursor La/Fe 3:7 (pH 7) might be slightly less than 3+ Moreover, the peaks at 532.5 eV and 529.6 eV should be assigned to the absorbed O and lattice O, respectively, the characteristic peaks of O 1s in LFO [32,33]. In comparison with the precursor (pH 7), the shape of the O 1s spectrum in the precursor (pH 10) was closer to that in as-prepared LFO after calcination at 500 °C, indicating that the Fe–O structure in precursor (pH 10) was closer to that in LFO.

4. Discussion

Considering that coprecipitation is a facile and simple method for facilitating the mechanism investigation, we fabricated crystalline LFO nanoparticles using coprecipitation and calcination. Besides the calcination temperature, we investigated the major influence factors involving molar ratios of La and Fe, precipitators, and pH values of precursors in the process of coprecipitation. As shown in Table 1, the crystalline LFO emerged after calcination at 500 °C when the stoichiometric ratio of La:Fe was 3:7. In order to minimize the influence from unknown compounds that might be formed in the process of precipitation, we focused on the effects of other conditions when the stoichiometric ratio of La:Fe was 3:7. In particular, pH values of precursors had a significant effect on the sintering temperature in the ensuing process of calcination. The precursor precipitated at pH 10 was able to form crystalline LFO after calcination at 500 °C, whereas the precursor washed thoroughly to pH 7 remained amorphous under the same calcination conditions. The Raman study demonstrated that analogous FeO6 octahedra, a characteristic structure in perovskite LFO, were formed in both precursors prepared at pH 10 and 7. However, the observed blue shifts in the peaks of FeO6 octahedra in the precursor prepared at pH 10 were more compact than those in the precursor prepared at pH 7, indicating that the energy requirement of the precursor prepared at pH 10 to form crystalline LFO was less than that of the precursor prepared at pH 7. XPS spectra of the precursor prepared at pH 10, especially the O 1s spectrum, were more prone to those of LFO, further indicating the lower energy requirement for the formation of crystalline LFO. Therefore, the precursor prepared at pH 10 converted to crystalline LFO at a calcination temperature of 500 °C, lower than that of the precursor prepared at pH 10 (600 °C).
Lowering the calcination temperature is an avenue to effectively resist the growth and agglomeration of LFO nanostructures during the high-temperature process. Furthermore, lowering the calcination temperature would decrease the energy consumption and reduce carbon dioxide emissions as well. It should be noted that the presence of amorphous oxides was unable to be determined using XRD spectroscopy, which should be further confirmed by other auxiliary approaches (e.g., TEM and SEM). We prepared crystalline LFO nanoparticles with the stoichiometric ratio of La:Fe 3:7, and inevitably redundant iron compounds were formed as a corollary of the excessive Fe element (e.g., NaFeO2). Importantly, these redundant iron compounds were amorphous and hard to be detected by XRD spectroscopy, so an illusion of purely crystalline LaFeO3 was shown in XRD patterns with a variety of different experimental conditions. Based on the X-ray crystal structure analysis, we also observed that the calcination temperatures for the crystallization of La2O2CO3, LaFeO3, NaFeO2, and La2O3 were 400 °C, 500 °C, 500 °C, and 700 °C, respectively. Experimental conditions such as stoichiometric ratios, pH values, precipitants, and PVP would significantly influence the crystallization temperature, which could be utilized for crystallization in certain sequences.

5. Conclusions

We prepared crystalline LaFeO3 nanoparticles via coprecipitation and calcination at 500 °C. Through investigating the experimental conditions, including stoichiometric ratio, pH value, precipitants, complexant regents, and the calcination temperature, we concluded the following: (1) crystalline LaFeO3 nanoparticles could be formed after calcination at 500 °C when the stoichiometric ratio La/Fe was higher than 3:7, coupling with the formation of crystalline NaFeO2; (2) coprecipitation at a high pH value was conducive to the crystallization of LaFeO3 at low calcination temperatures; (3) crystalline LaFeO3 nanoparticles could be formed after calcination at 500 °C when using either NaOH or KOH solutions as a precipitant at pH 10; (4) the use of PVP could influence the morphology of crystalline LaFeO3 nanoparticles instead of calcination temperature. We inferred from Raman spectra that the structure of FeO6 octahedra formed in the process of precipitation was associated with the calcination temperature. We also observed an illusion of pure-phase LaFeO3, where LFO-based heterostructures involved a crystalline phase of LaFeO3 and an amorphous phase of NaFeO2 or KFeO2, respectively. We anticipate that these results could improve the preparation of nanostructured perovskite oxides at low calcination temperatures.

Supplementary Materials

The following are available online at https://www.mdpi.com/article/10.3390/ma14195534/s1, Figure S1: The XRD patterns of samples La/Fe 1:9 (a), 5:5 (b), and 7:3 (c) prepared at different pH values and different calcination temperatures; Figure S2: The XRD patterns of sample La/Fe 3:7 at pH 7 and different calcination temperatures; Figure S3: Combined XRD pattern and Rietveld refinement of the sample La/Fe 3:7 pH 10 after calcination at 500 °C (a) and pH 7 after calcination at 600 °C (b); Figure S4: SEM images of as-prepared LFO nanoparticles prepared by ammonia, after calcination at 500 °C (a) and 800 °C (b); Figure S5: SEM images of as-prepared LFO nanoparticles prepared by KOH solution, after calcination at 500 °C (a) and 800 °C (b); Figure S6: HR-TEM images (a, b) of the LFO (La/Fe 3:7) calcined at 800 °C, and element mapping of La, Fe, K, and O on the surface of crystalline LFO nanoparticles after calcination at 800 °C; Figure S7: SEM images of as-prepared LFO nanoparticles prepared by NaOH solution with the use of PVP, after calcination at 500 °C (a) and 800 °C (b); Figure S8: The XPS spectra of La, Fe, and O in the as-prepared LFO after calcination at 500 °C and the precursors prepared by NaOH solution at pH 10 and 7; Table S1: Rietveld refinement results of LFO in the sample La/Fe 3:7 pH 10 after calcination at 500 °C and pH 7 after calcination at 600 °C; Table S2: Calculated particle size of LFO in the sample La/Fe 3:7 pH 10 after calcination at 500 °C; Table S3: The crystallinity of the sample La/Fe 3:7 pH 7 after calcination at 600 °C and pH 10 after calcination at 500 °C; Table S4: The atomic contents of O, Fe, and La in the precursors of La/Fe 3:7 pH 10 and 7, before and after calcination at 600 °C and 500 °C.

Author Contributions

C.P. charged the project; W.J. completed the experiments, L.C., J.G., S.Z., H.W., Z.J. and Z.T. discussed the results; C.P. and W.J. wrote the manuscript. All authors have read and agreed to the published version of the manuscript.

Funding

This research received no external funding.

Institutional Review Board Statement

Not applicable.

Informed Consent Statement

Not applicable.

Data Availability Statement

Not applicable.

Conflicts of Interest

The authors declare no conflict of interest.

References

  1. Smith, J.; Norby, T. Cation self-diffusion in LaFeO3 measured by the solid state reaction method. Solid State Ionics 2006, 177, 639–646. [Google Scholar] [CrossRef]
  2. Yan, B.; Feng, Q.; Liu, J.; Chou, K.C. A Kinetic Study on LaFeO3-δ Preparation with Solid-state Reaction Technique. High Temp. Mater. Process. 2009, 28, 101–108. [Google Scholar] [CrossRef]
  3. Chen, J.; Yu, R.; Li, L.; Sun, C.; Zhang, T.; Chen, H.; Xing, X. Structure and Shape Evolution of Bi1-xLaxFeO3Perovskite Microcrystals by Molten Salt Synthesis. Eur. J. Inorg. Chem. 2008, 2008, 3655–3660. [Google Scholar] [CrossRef]
  4. Wang, D.; Chu, X.; Gong, M. Single-crystalline LaFeO3 nanotubes with rough tube walls: Synthesis and gas-sensing properties. Nanotechnology 2006, 17, 5501–5505. [Google Scholar] [CrossRef]
  5. Romero, M.; Gómez, R.; Marquina, V.; Pérez-Mazariego, J.L.; Escamilla, R. Synthesis by molten salt method of the AFeO3 system (A = La, Gd) and its structural, vibrational and internal hyperfine magnetic field characterization. Phys. B Condens. Matter 2014, 443, 90–94. [Google Scholar] [CrossRef] [Green Version]
  6. Wheeler, G.; Baltazar, V.U.; Smart, T.J.; Radmilovic, A.; Ping, Y.; Choi, K.-S. Combined Theoretical and Experimental Investigations of Atomic Doping to Enhance Photon Absorption and Carrier Transport of LaFeO3 Photocathodes. Chem. Mater. 2019, 31, 5890–5899. [Google Scholar] [CrossRef]
  7. Wheeler, G.; Choi, K.-S. Photoelectrochemical Properties and Stability of Nanoporous p-Type LaFeO3 Photoelectrodes Prepared by Electrodeposition. ACS Energy Lett. 2017, 2, 2378–2382. [Google Scholar] [CrossRef]
  8. Zhang, G.; Chen, Q.; Deng, X.; Jiao, H.; Wang, P.; Gengzang, D. Synthesis and characterization of In-doped LaFeO3 hollow nanofibers with enhanced formaldehyde sensing properties. Mater. Lett. 2019, 236, 229–232. [Google Scholar] [CrossRef]
  9. Wiranwetchayan, O.; Promnopas, S.; Phadungdhitidhada, S.; Phuruangrat, A.; Thongtem, T.; Singjai, P.; Thongtem, S. Characterization of perovskite LaFeO3 synthesized by microwave plasma method for photocatalytic applications. Ceram. Int. 2019, 45, 4802–4809. [Google Scholar] [CrossRef]
  10. Cao, E.; Wu, A.; Wang, H.-H.; Zhang, Y.; Hao, W.; Sun, L. Enhanced Ethanol Sensing Performance of Au and Cl Comodified LaFeO3 Nanoparticles. ACS Appl. Nano Mater. 2019, 2, 1541–1551. [Google Scholar] [CrossRef]
  11. Cui, X.; Yi, D.; Li, N.; Zhang, L.; Zhang, X.; Yang, D. Novel LaFeO3 Coating Modification for a LiFePO4 Cathode. Energy Fuels 2020, 34, 7600–7606. [Google Scholar] [CrossRef]
  12. Garcia-Muñoz, P.; Lefevre, C.; Robert, D.; Keller, N. Ti-substituted LaFeO3 perovskite as photoassisted CWPO catalyst for water treatment. Appl. Catal. B Environ. 2019, 248, 120–128. [Google Scholar] [CrossRef]
  13. Li, W.; Yang, F.; Xiong, P.; Jia, Y.; Liu, J.; Yan, X.; Chen, X. Effect of Bi-doping on the electrocatalytic properties of LaFeO3 powders prepared by sol–gel method. J. Mater. Sci. 2019, 54, 7460–7468. [Google Scholar] [CrossRef]
  14. Ma, Z.; Yang, K.; Xiao, C.; Jia, L. C-doped LaFeO3 Porous Nanostructures for Highly Selective Detection of Formaldehyde. Sens. Actuators B Chem. 2021, 347, 130550. [Google Scholar] [CrossRef]
  15. Zhang, C.; Wang, Y.; Chen, X.; Chen, H.; Wu, Y.; Wang, Y.; Tang, L.; Cui, G.; Chen, D. Catalytic behavior of LaFeO3 perovskite oxide during low-pressure gas nitriding. Appl. Surf. Sci. 2020, 506, 145045. [Google Scholar] [CrossRef]
  16. Parida, K.; Reddy, K.; Martha, S.; Das, D.; Biswal, N. Fabrication of nanocrystalline LaFeO3: An efficient sol–gel auto-combustion assisted visible light responsive photocatalyst for water decomposition. Int. J. Hydrog. Energy 2010, 35, 12161–12168. [Google Scholar] [CrossRef]
  17. Wang, Y.; Zhu, J.; Zhang, L.; Yang, X.; Lu, L.; Wang, X. Preparation and characterization of perovskite LaFeO3 nanocrystals. Mater. Lett. 2006, 60, 1767–1770. [Google Scholar] [CrossRef]
  18. Liu, Y.; Cao, Y.; Wu, J.; Yang, J.; Chen, Y.; Liu, G.; Niu, T. Hydrothermal synthesis of graphene-LaFeO3 composite supported with Cu-Co nanocatalyst for higher alcohol synthesis from syngas. Appl. Surf. Sci. 2016, 364, 388–399. [Google Scholar]
  19. Kostyukhin, E.; Kustov, A.L.; Kustov, L. One-step hydrothermal microwave-assisted synthesis of LaFeO3 nanoparticles. Ceram. Int. 2019, 45, 14384–14388. [Google Scholar] [CrossRef]
  20. Sharma, N.; Sharma, S.; Sachdev, K. Effect of precursors on the morphology and surface area of LaFeO3. Ceram. Int. 2019, 45, 7217–7225. [Google Scholar] [CrossRef]
  21. Nakayama, S. LaFeO3 perovskite-type oxide prepared by oxide-mixing, co-precipitation and complex synthesis methods. J. Mater. Sci. 2001, 36, 5643–5648. [Google Scholar] [CrossRef]
  22. Kucharczyk, B.; Winiarski, J.; Szczygiel, I.; Adamska, K. The physicochemical properties of LaFeO3 perovskite prepared by various methods and its activity in the oxidation of hydrocarbons. Ind. Eng. Chem. Res. 2020, 59, 16603–16613. [Google Scholar] [CrossRef]
  23. Nishikawa, H.; Itani, F.; Kawaguchi, T.; Tanaka, H.; Iwata, N. Metallic conductivity of the heterointerface between LaFeO3 and SrTiO3. Solid State Commun. 2021, 323, 114105. [Google Scholar] [CrossRef]
  24. Sun, Y.; Wu, X.; Yuan, L.; Wang, M.; Han, M.; Luo, L.; Zheng, B.; Huang, K.; Feng, S. Insight into the enhanced photoelectrocatalytic activity in reduced LaFeO3 films. Chem. Commun. 2017, 53, 2499–2502. [Google Scholar] [CrossRef] [PubMed] [Green Version]
  25. Sukee, A.; Alharbi, A.; Staerz, A.; Wisitsoraat, A.; Liewhiran, C.; Weimar, U.; Barsan, N. Effect of AgO loading on flame-made LaFeO3 p-type semiconductor nanoparticles to acetylene sensing. Sens. Actuators B Chem. 2020, 312, 127990. [Google Scholar] [CrossRef]
  26. Azouzi, W.; Sigle, W.; Labrim, H.; Benaissa, M. Sol-gel synthesis of nanoporous LaFeO3 powders for solar applications. Mater. Sci. Semicond. Process. 2019, 104, 104682. [Google Scholar] [CrossRef]
  27. Dumitru, R.; Negrea, S.; Ianculescu, A.; Păcurariu, C.; Vasile, B.; Surdu, A.; Manea, F. Lanthanum Ferrite Ceramic Powders: Synthesis, Characterization and Electrochemical Detection Application. Materials 2020, 13, 2061. [Google Scholar] [CrossRef]
  28. Bielecki, J.; Svedlindh, P.; Tibebu, D.; Eriksson, T.; Cai, S. Structural and magnetic properties of isovalently substituted multiferroic BiFe03: Insights from Raman spectroscopy. Phys. Rev. B. 2012, 86, 184422. [Google Scholar] [CrossRef] [Green Version]
  29. Thirumalairajan, S.; Girija, K.; Ganesh, V.; Mangalaraj, D.; Viswanathan, C.; Ponpandian, N. Novel Synthesis of LaFeO3 Nanostructure Dendrites: A Systematic Investigation of Growth Mechanism, Properties, and Biosensing for Highly Selective Determination of Neurotransmitter Compounds. Cryst. Growth Des. 2012, 13, 291–302. [Google Scholar] [CrossRef]
  30. Triyono, D.; Purnamasari, I.; Rafsanjani, R.A. Effect of the Zr-Substitution on the Structural and Electrical Properties of LaFeO3: XRD, Raman Scattering, SEM, and Impedance Spectroscopy Study. Crystals 2020, 10, 399. [Google Scholar] [CrossRef]
  31. Li, X.; Zhang, H.; Liu, X.; Li, S.; Zhao, M. XPS study on O(1s) and Fe(2p) for nanocrystalline composite oxide LaFeO3 with the perovskite structure. Mater. Chem. Phys. 1994, 38, 355–362. [Google Scholar] [CrossRef]
  32. Özkan, D.C.; Türk, A.; Çelik, E. Synthesis and characterizations of sol–gel derived LaFeO3 perovskite powders. J. Mater. Sci. Mater. Electron. 2020, 31, 22789–22809. [Google Scholar] [CrossRef]
  33. Peng, Q.; Wang, J.; Feng, Z.; Du, C.; Wen, Y.; Shan, B.; Chen, R. Enhanced Photoelectrochemical Water Oxidation by Fabrication of p-LaFeO3/n-Fe2O3 Heterojunction on Hematite Nanorods. J. Phys. Chem. C 2017, 121, 12991–12998. [Google Scholar] [CrossRef]
Figure 1. Scheme of the synthesis route.
Materials 14 05534 g001
Figure 2. The XRD patterns of different La/Fe ratios after calcination at 500 °C (a) and the XRD patterns of La/Fe 3:7 after calcination at different temperatures (b).
Materials 14 05534 g002
Figure 3. SEM images (ad), HR-TEM and SAED images (e,f) of the LFO (La/Fe 3:7) calcined at 500 °C and 800 °C, respectively, and element mapping (g) of Fe, La, Na, and O on the surface of crystalline LFO nanoparticles after calcination at 800 °C. The inset red curves are the size distribution of the LFO nanoparticles. The scale bar is 300 nm in both SEM images.
Materials 14 05534 g003
Figure 4. The XRD patterns of samples (La/Fe 3:7) precipitated by ammonia (a) and KOH solution (b), and NaOH solution with the use of PVP (c), after calcination at different temperatures.
Materials 14 05534 g004
Figure 5. Raman spectra of the precursors before (a) and after (b) calcination at 800 °C, respetively.
Materials 14 05534 g005
Table 1. Phases of products prepared by NaOH precipitation; NFO and LCO represent NaFeO2 and La2O2CO3, respectively.
La:FepH500 °C600 °C700 °C800 °C
1:97 LFO/Fe2O3LFO/Fe2O3
10NFOLFO/NFOLFO/NFOLFO/NFO
3:77 LFOLFO/NFOLFO/NFO
10LFO/NFOLFO/NFOLFO/NFOLFO/NFO
5:57LCOLFO/LCOLFO/La2O3LFO/La2O3
10LFO/LCOLFO/LCOLFO/La2O3LFO/La2O3
7:37LFO/LCOLFO/LCOLFO/La2O3LFO/La2O3
10LFO/LCOLFO/LCOLFO/La2O3LFO/La2O3
3:7/PVP10LFO/Fe2O3/LCOLFO/Fe2O3/LCOLFO/Fe2O3/LCOLFO/Fe2O3/La2O3
Publisher’s Note: MDPI stays neutral with regard to jurisdictional claims in published maps and institutional affiliations.

