
Evaluation of the Pullout Behavior of Pre-Bored Piles Embedded in Rock


Abstract
:1. Introduction
1.1. Research Background and Purpose
1.2. Research Trends
2. Design-Bearing Capacity of Piles
2.1. Estimation of The Bearing Capacity of Piles
2.2. Skin Friction of Pile
2.3. C.T Cofferdam Method
3. Review of Design Data
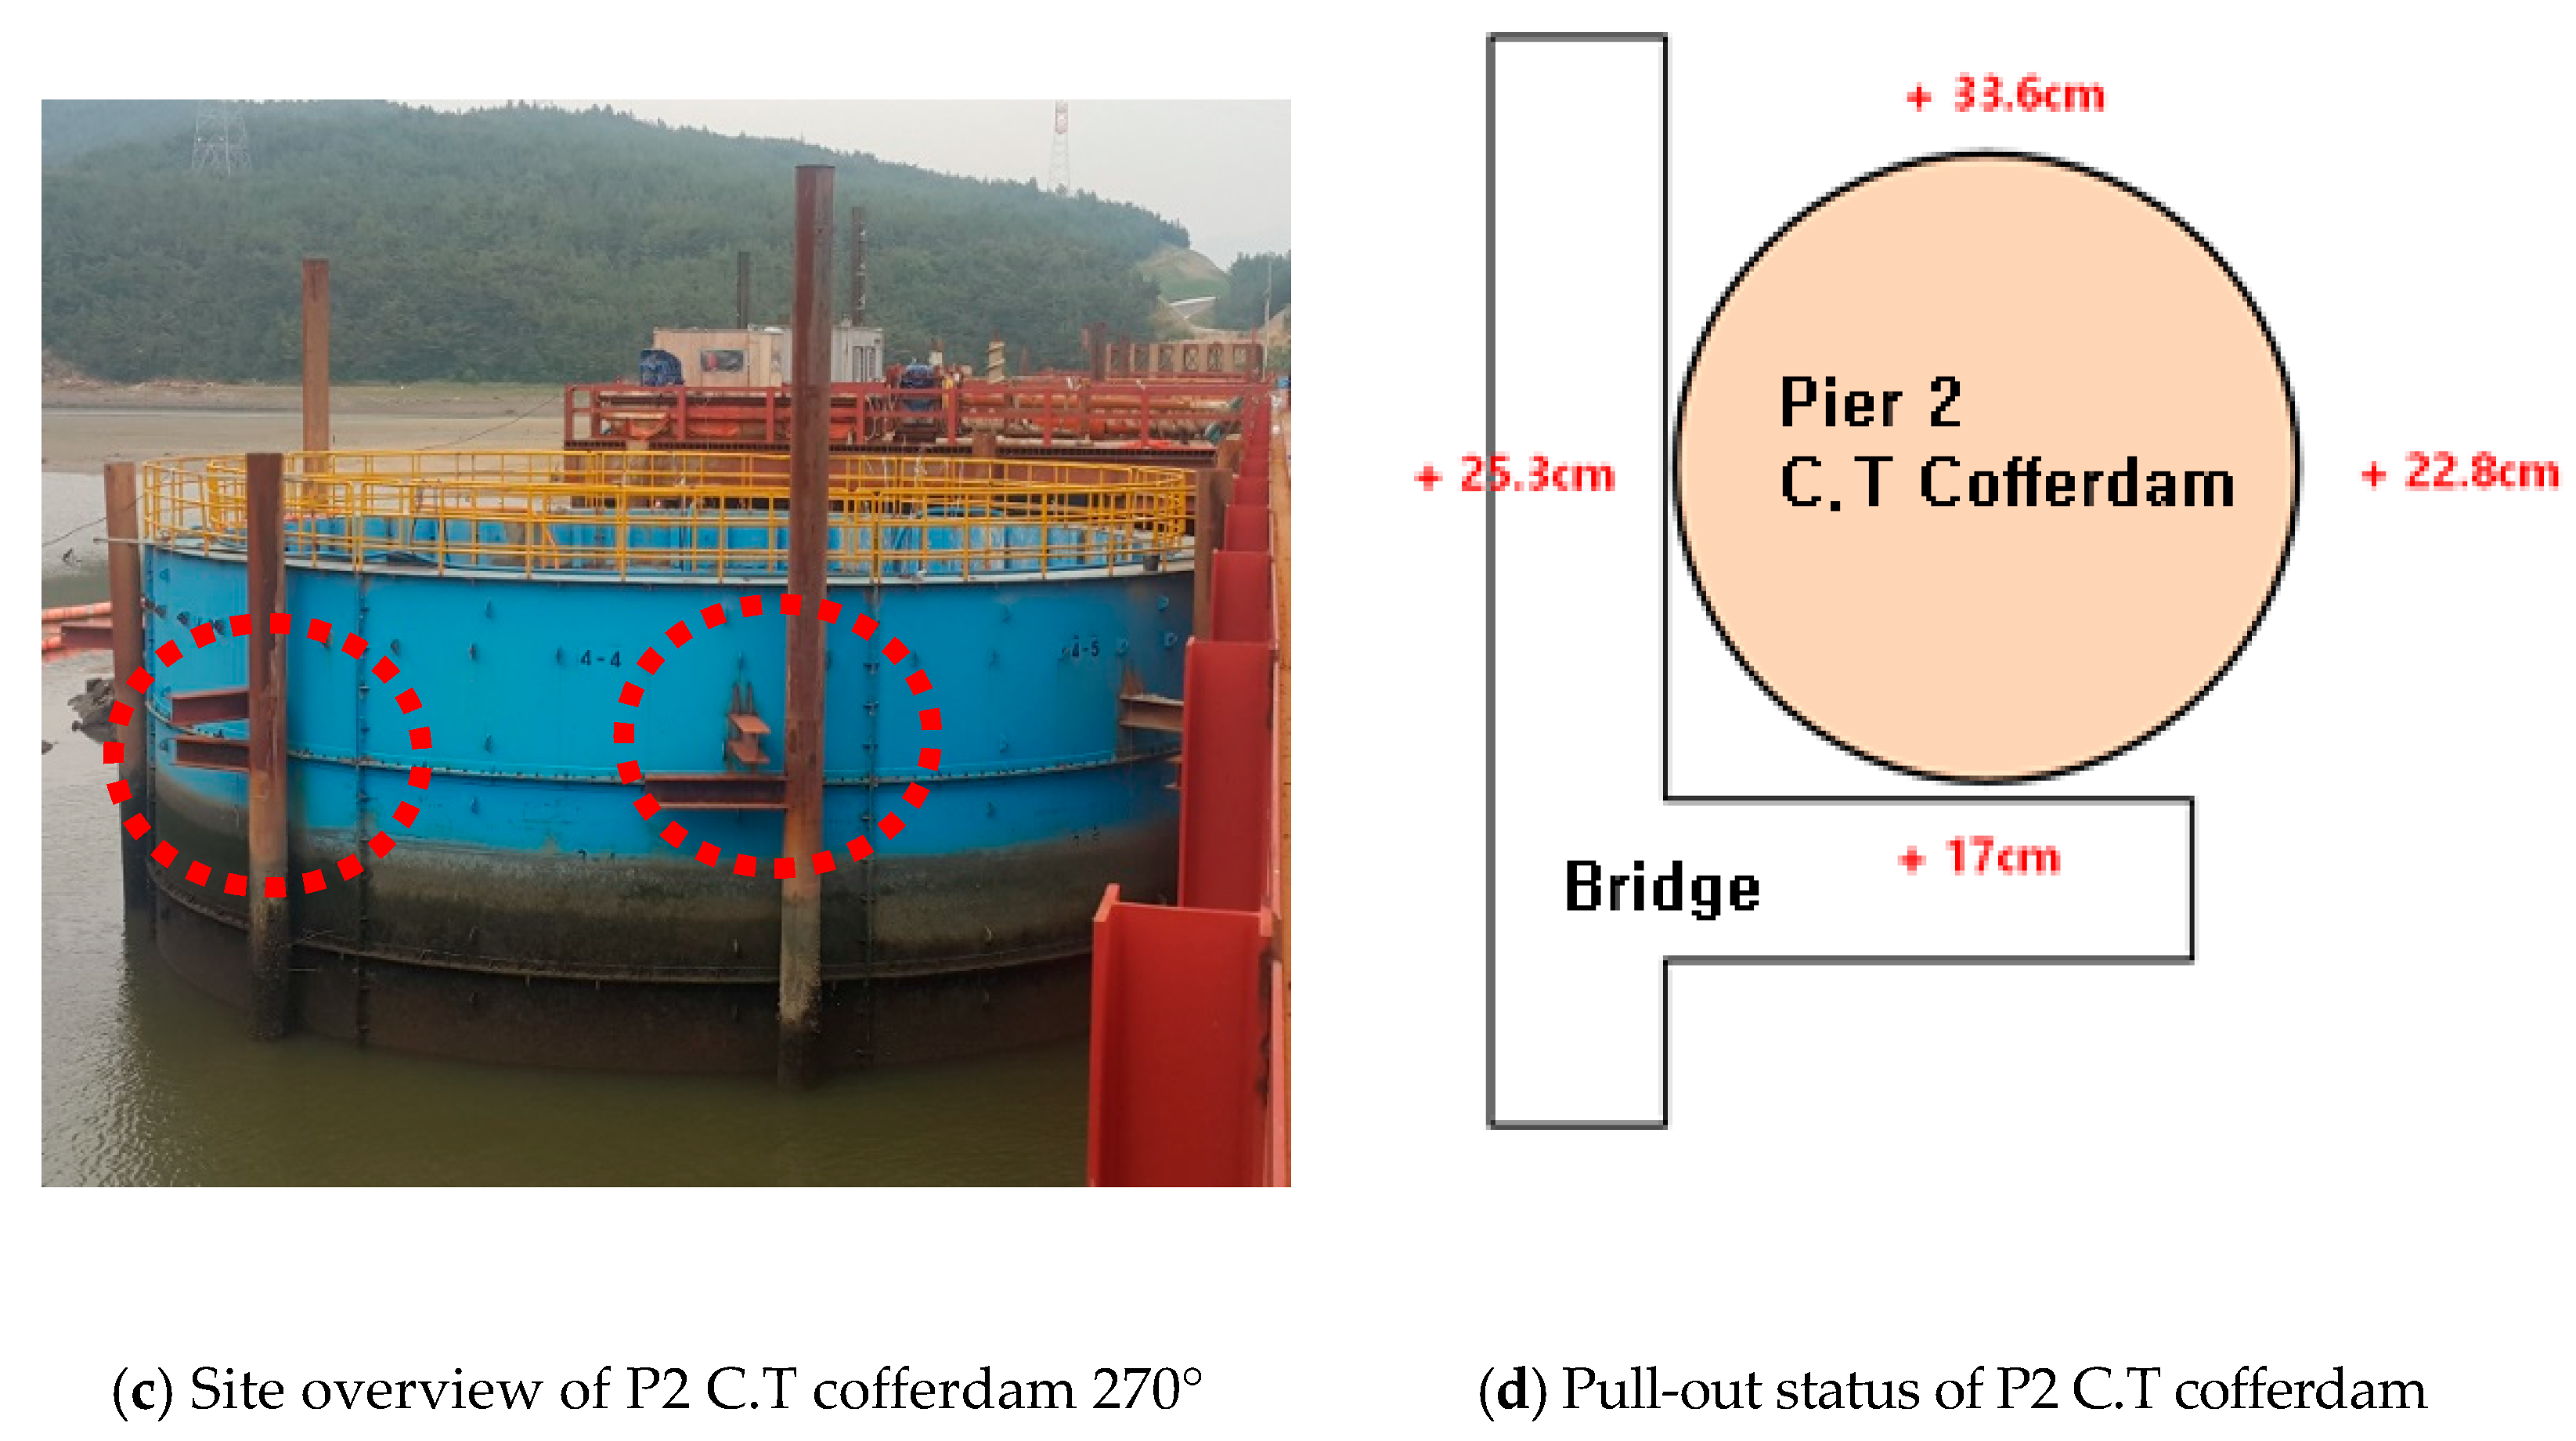
3.1. Site Overview
3.2. Analysis of Pull-Out Force of Pre-Bored Piles According to Design Criteria
- (1)
- C.T Cofferdam Design Structural Calculation Results
- (2)
- Review of the theoretical equation for calculating the pull-out force of a pre-bored pile according to the design criteria
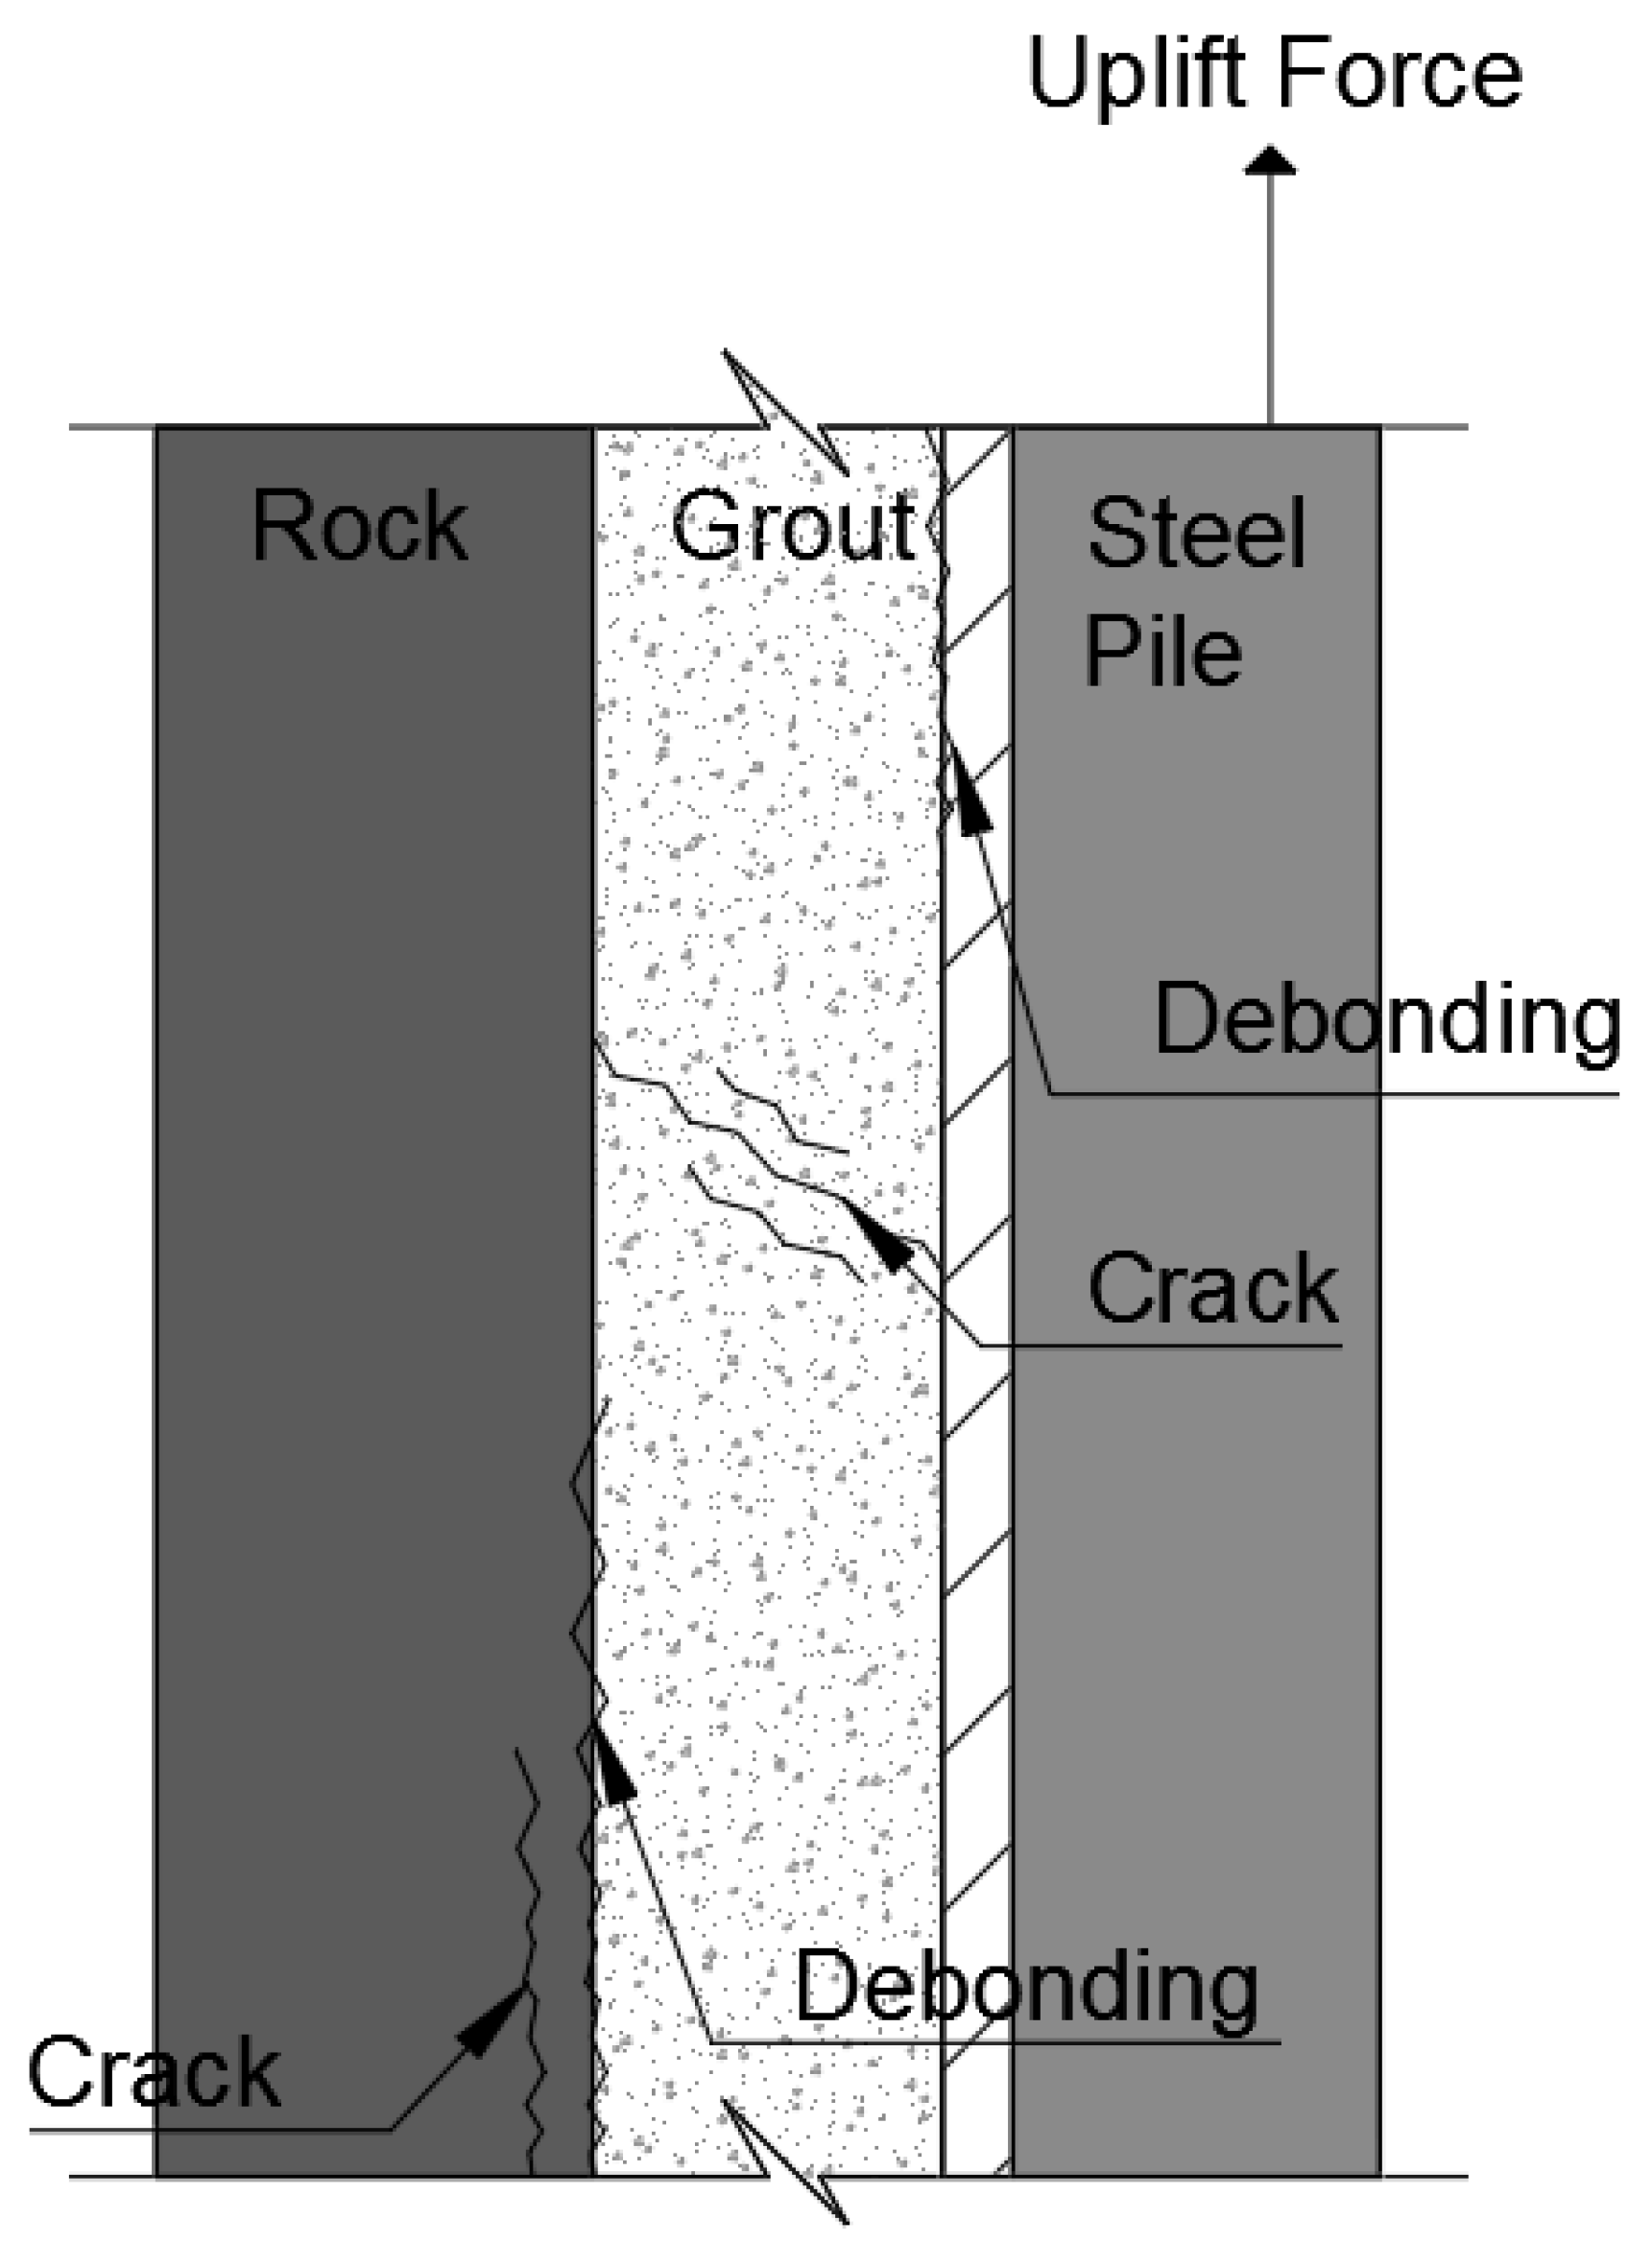
3.3. Adhesive Force Analysis of Pile and Grout
3.3.1. Adhesive Force Concept of Pile and Grout
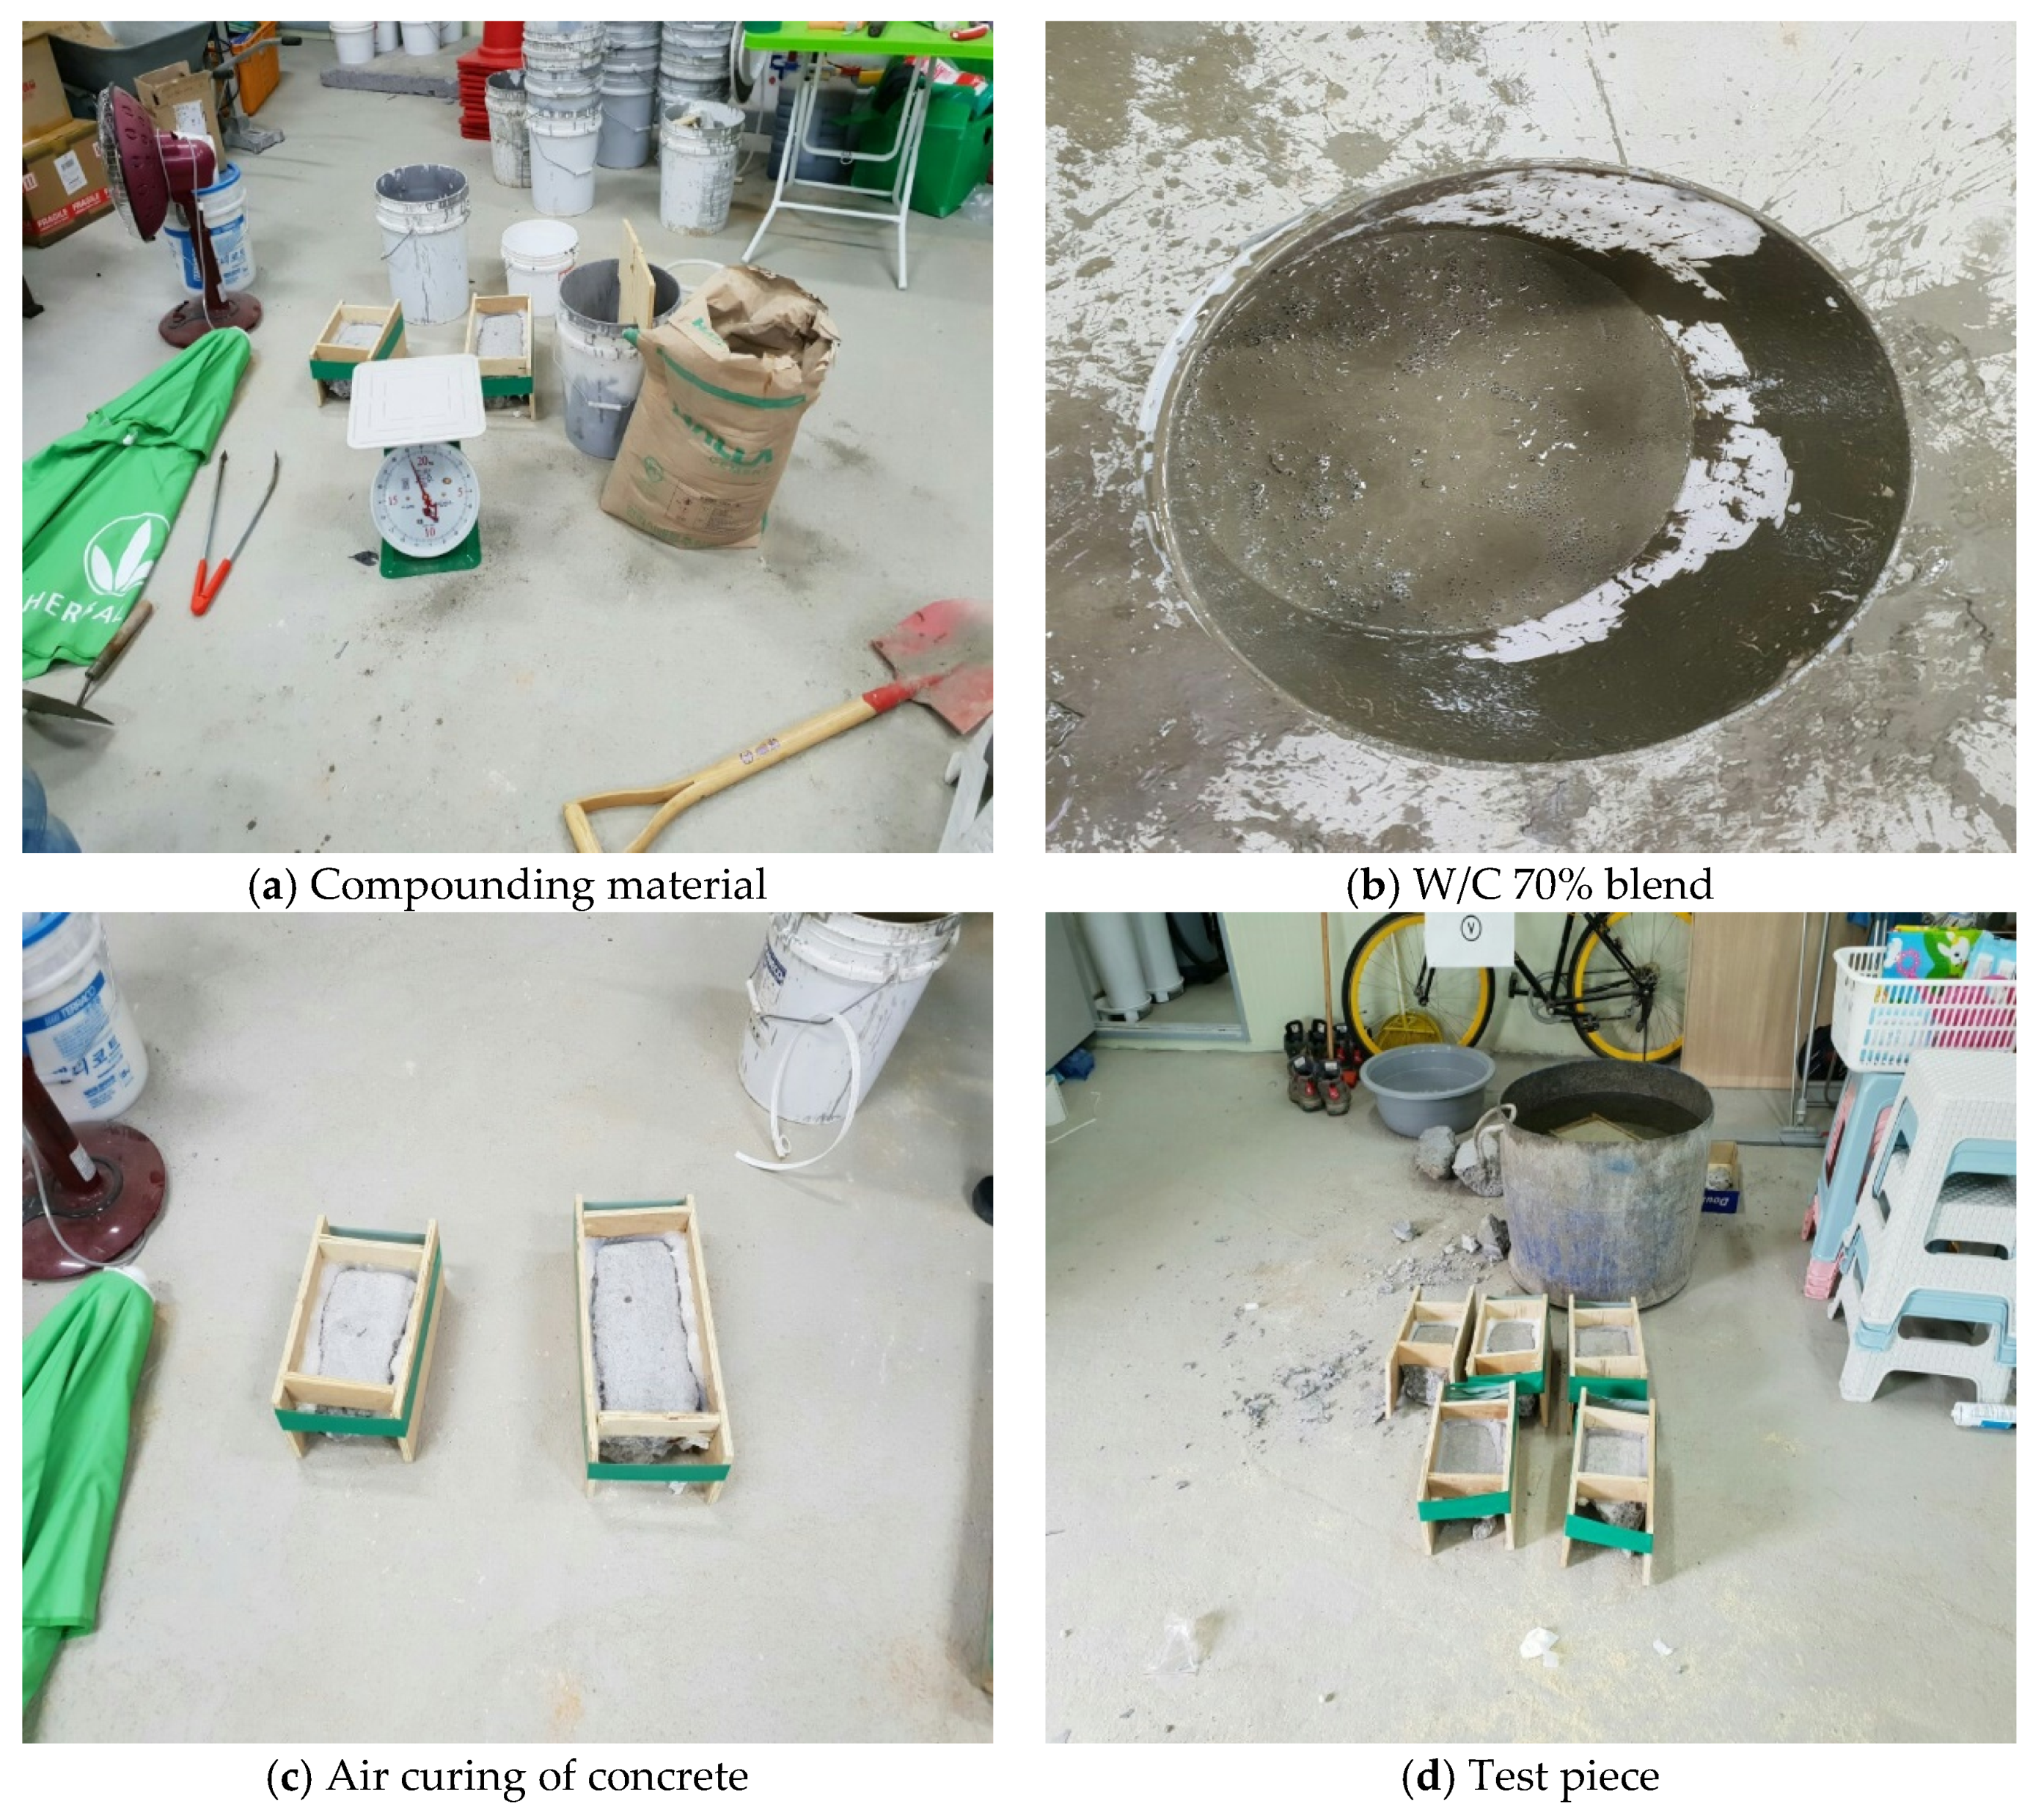
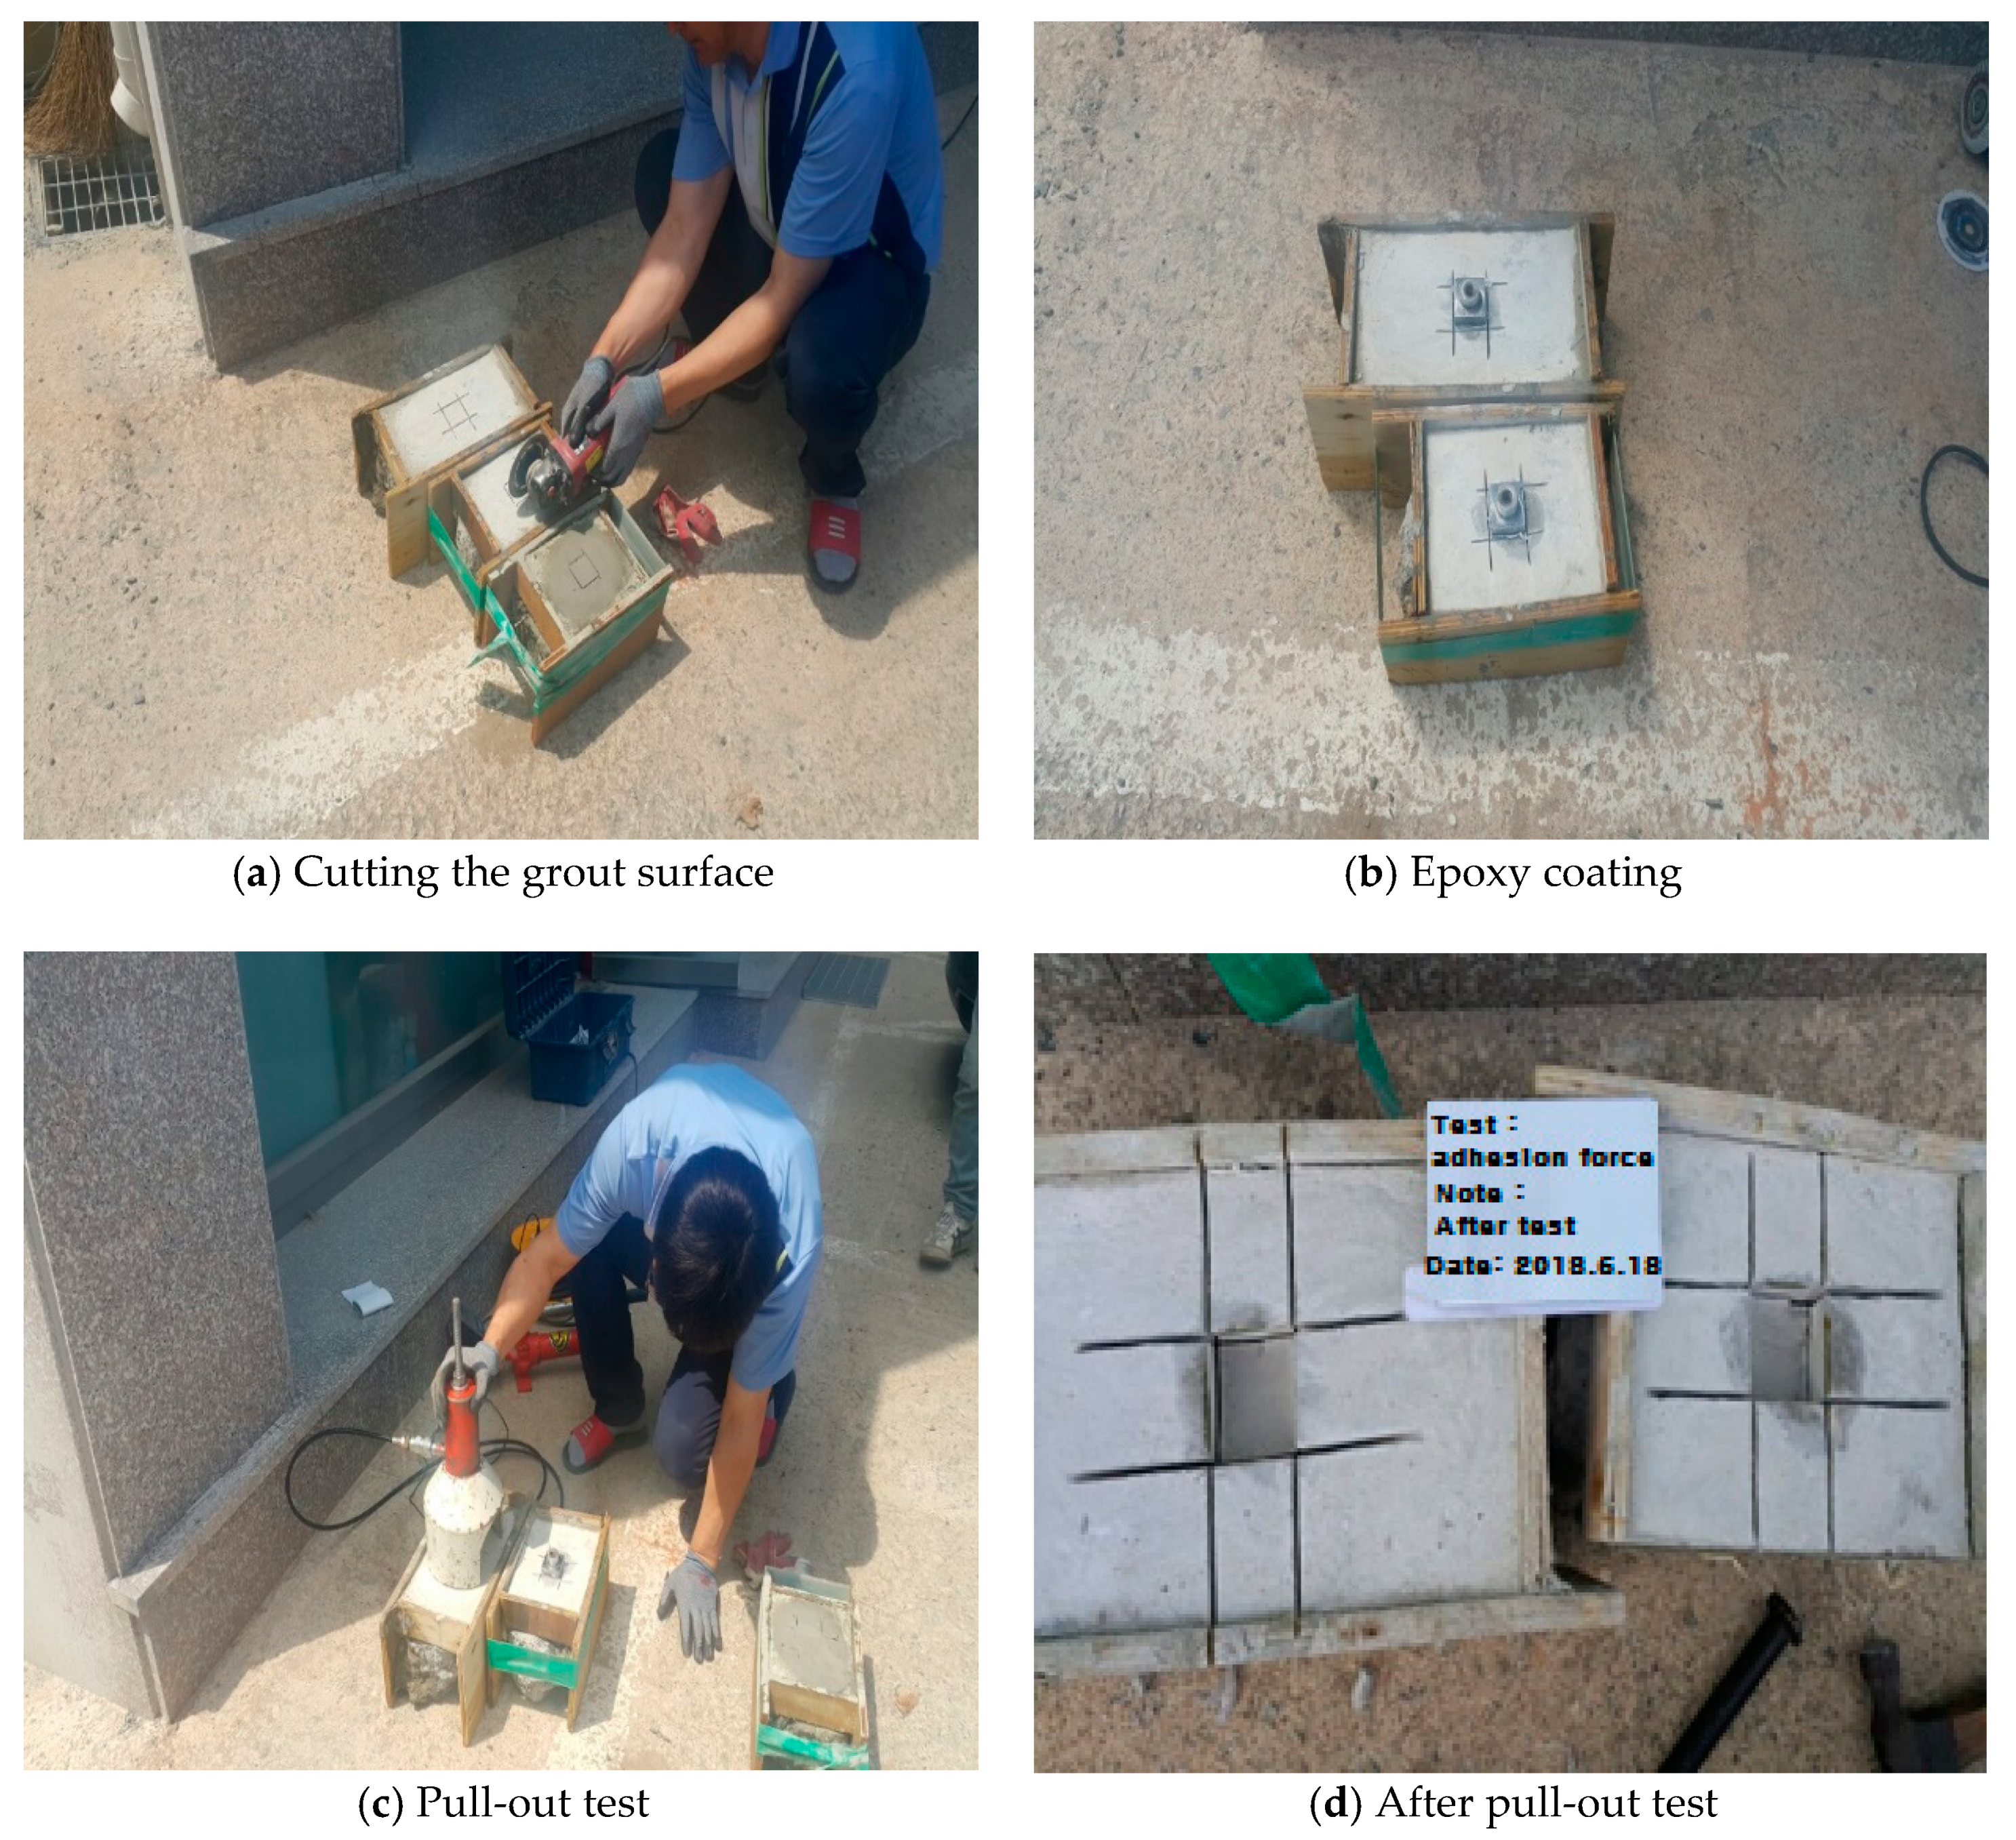
3.3.2. Lab Test for Measuring Adhesion Strength
- (1)
- Blending process
- (2)
- Test process
- (3)
- Test results
3.4. Results of Pull-Out Load Test
3.5. C.T Cofferdam Stability Review
4. Reviewing the Amount of Pull-Out of Pre-Bored Piles through Numerical Analysis
4.1. Analysis Conditions
4.1.1. Analysis Program
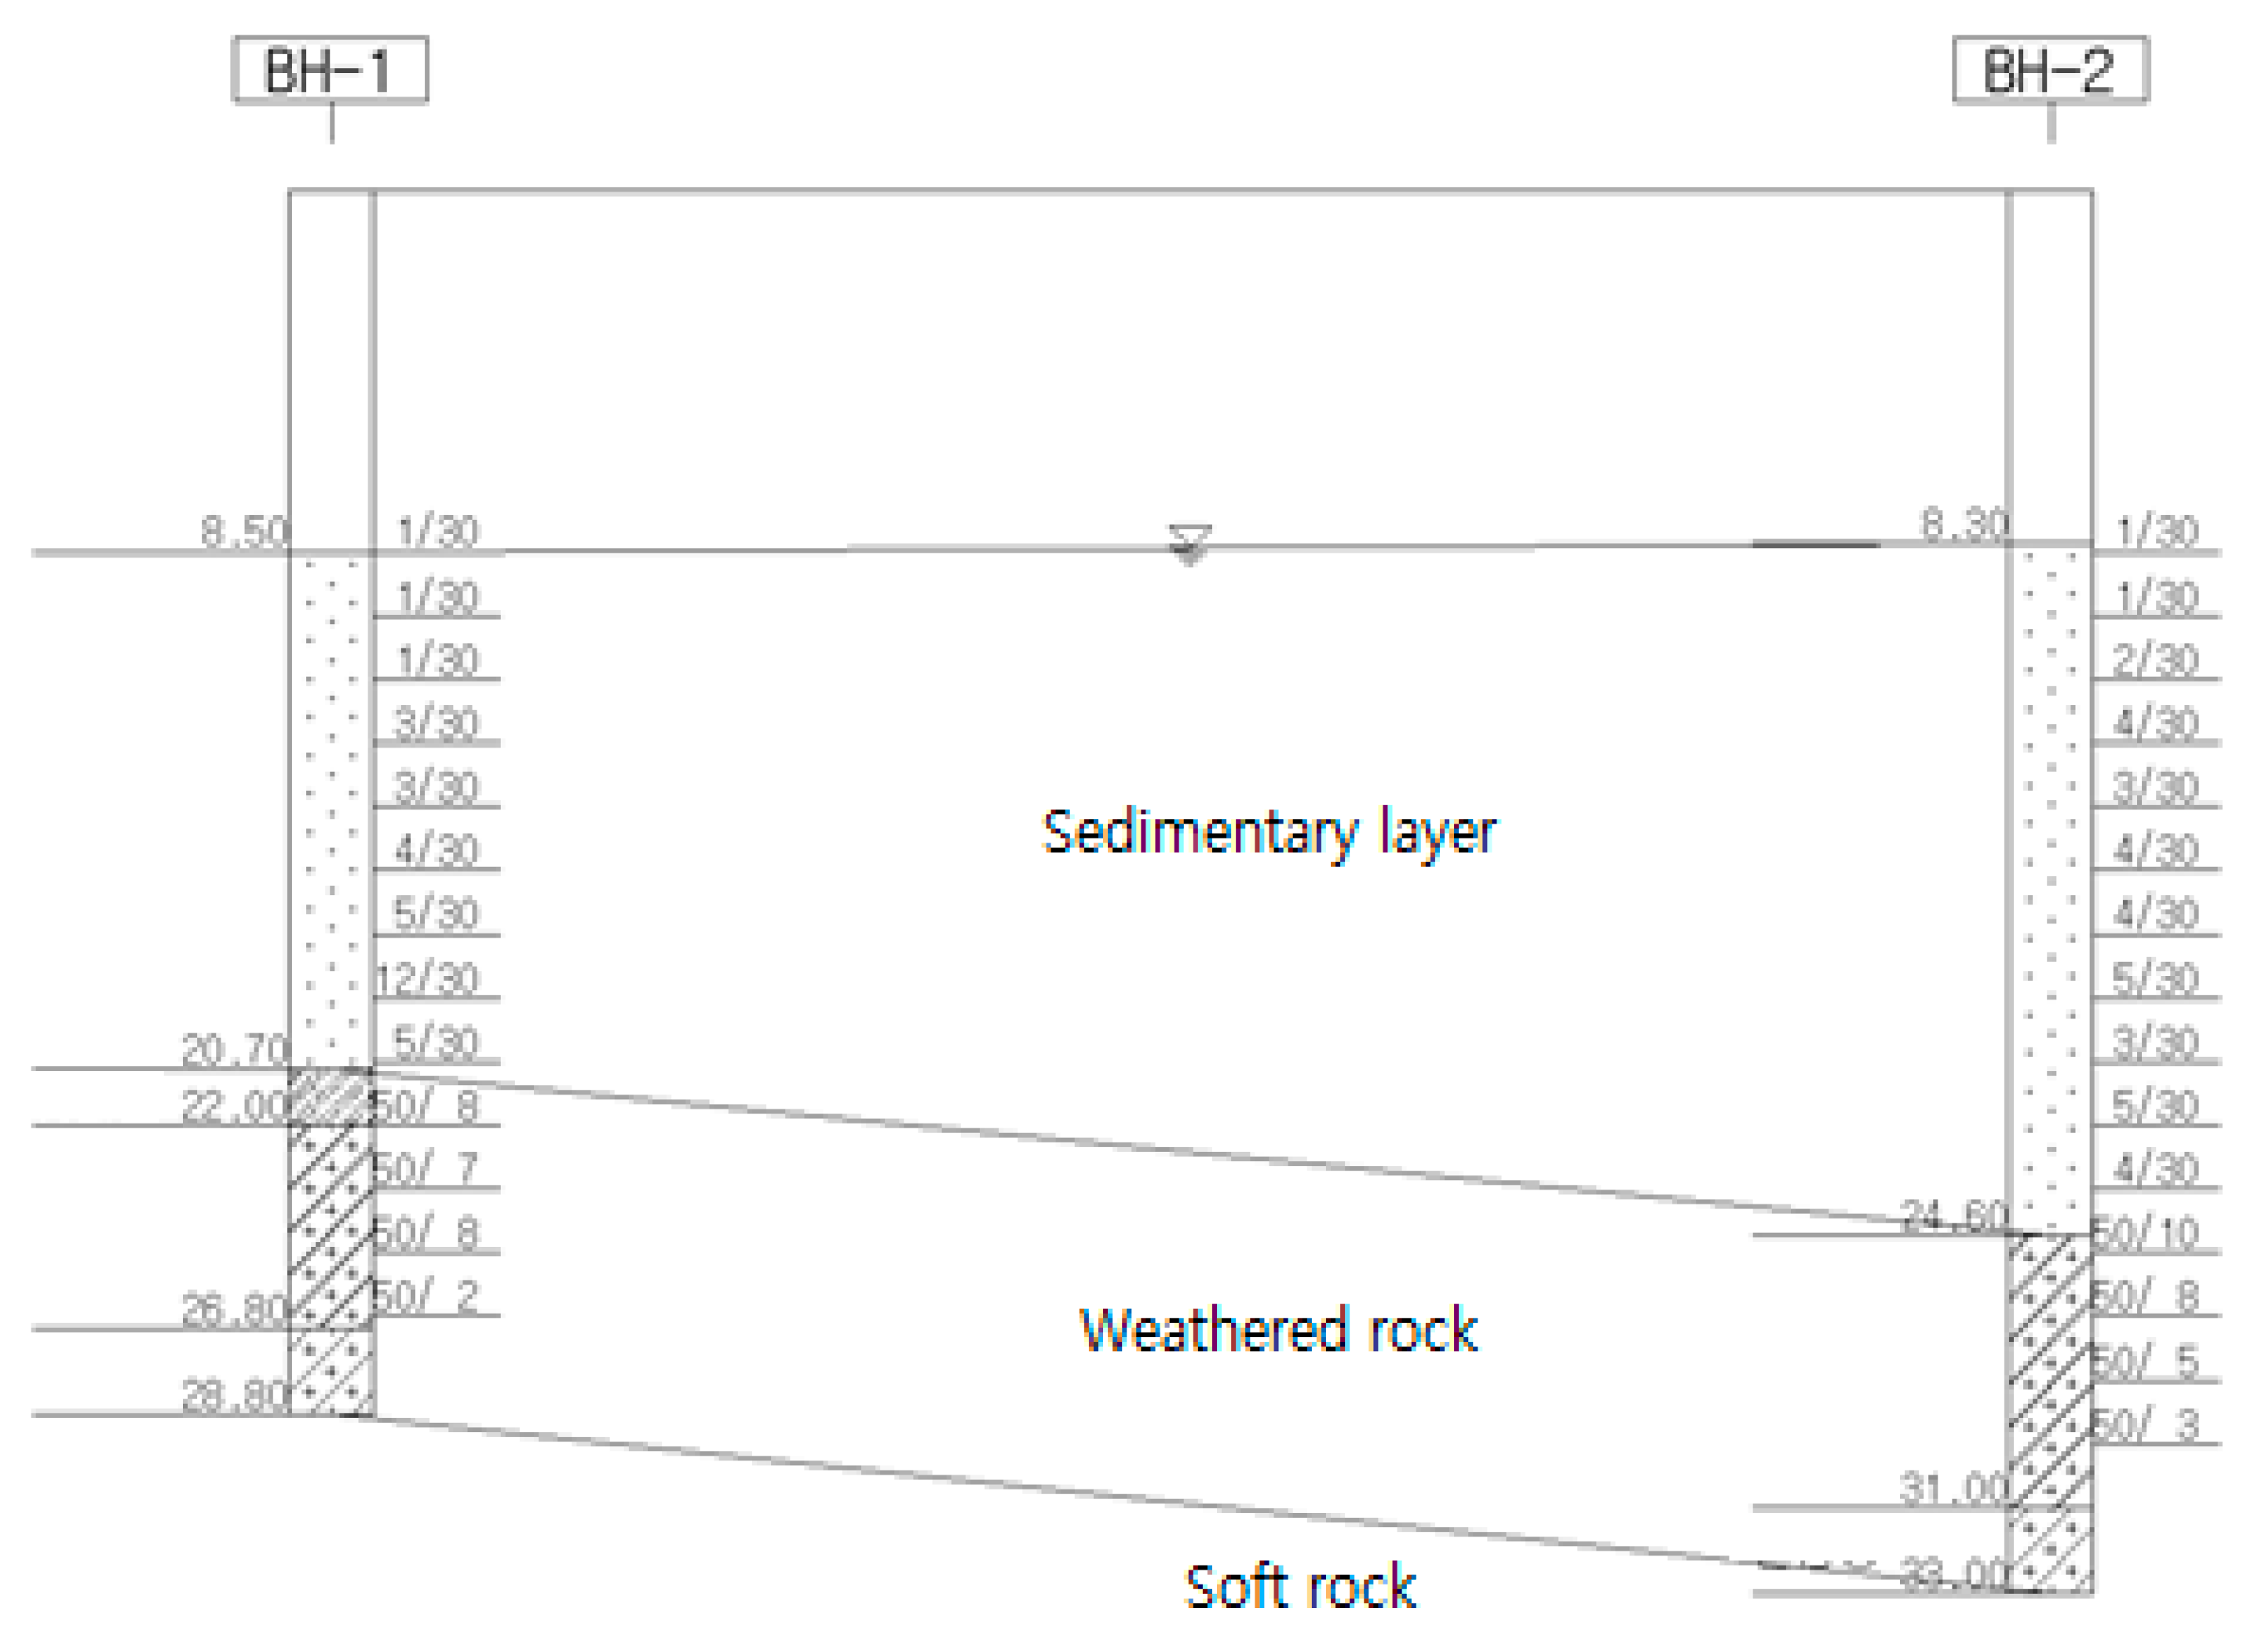
4.1.2. Drilling Section
4.1.3. Calculation of the Material Properties of the Ground
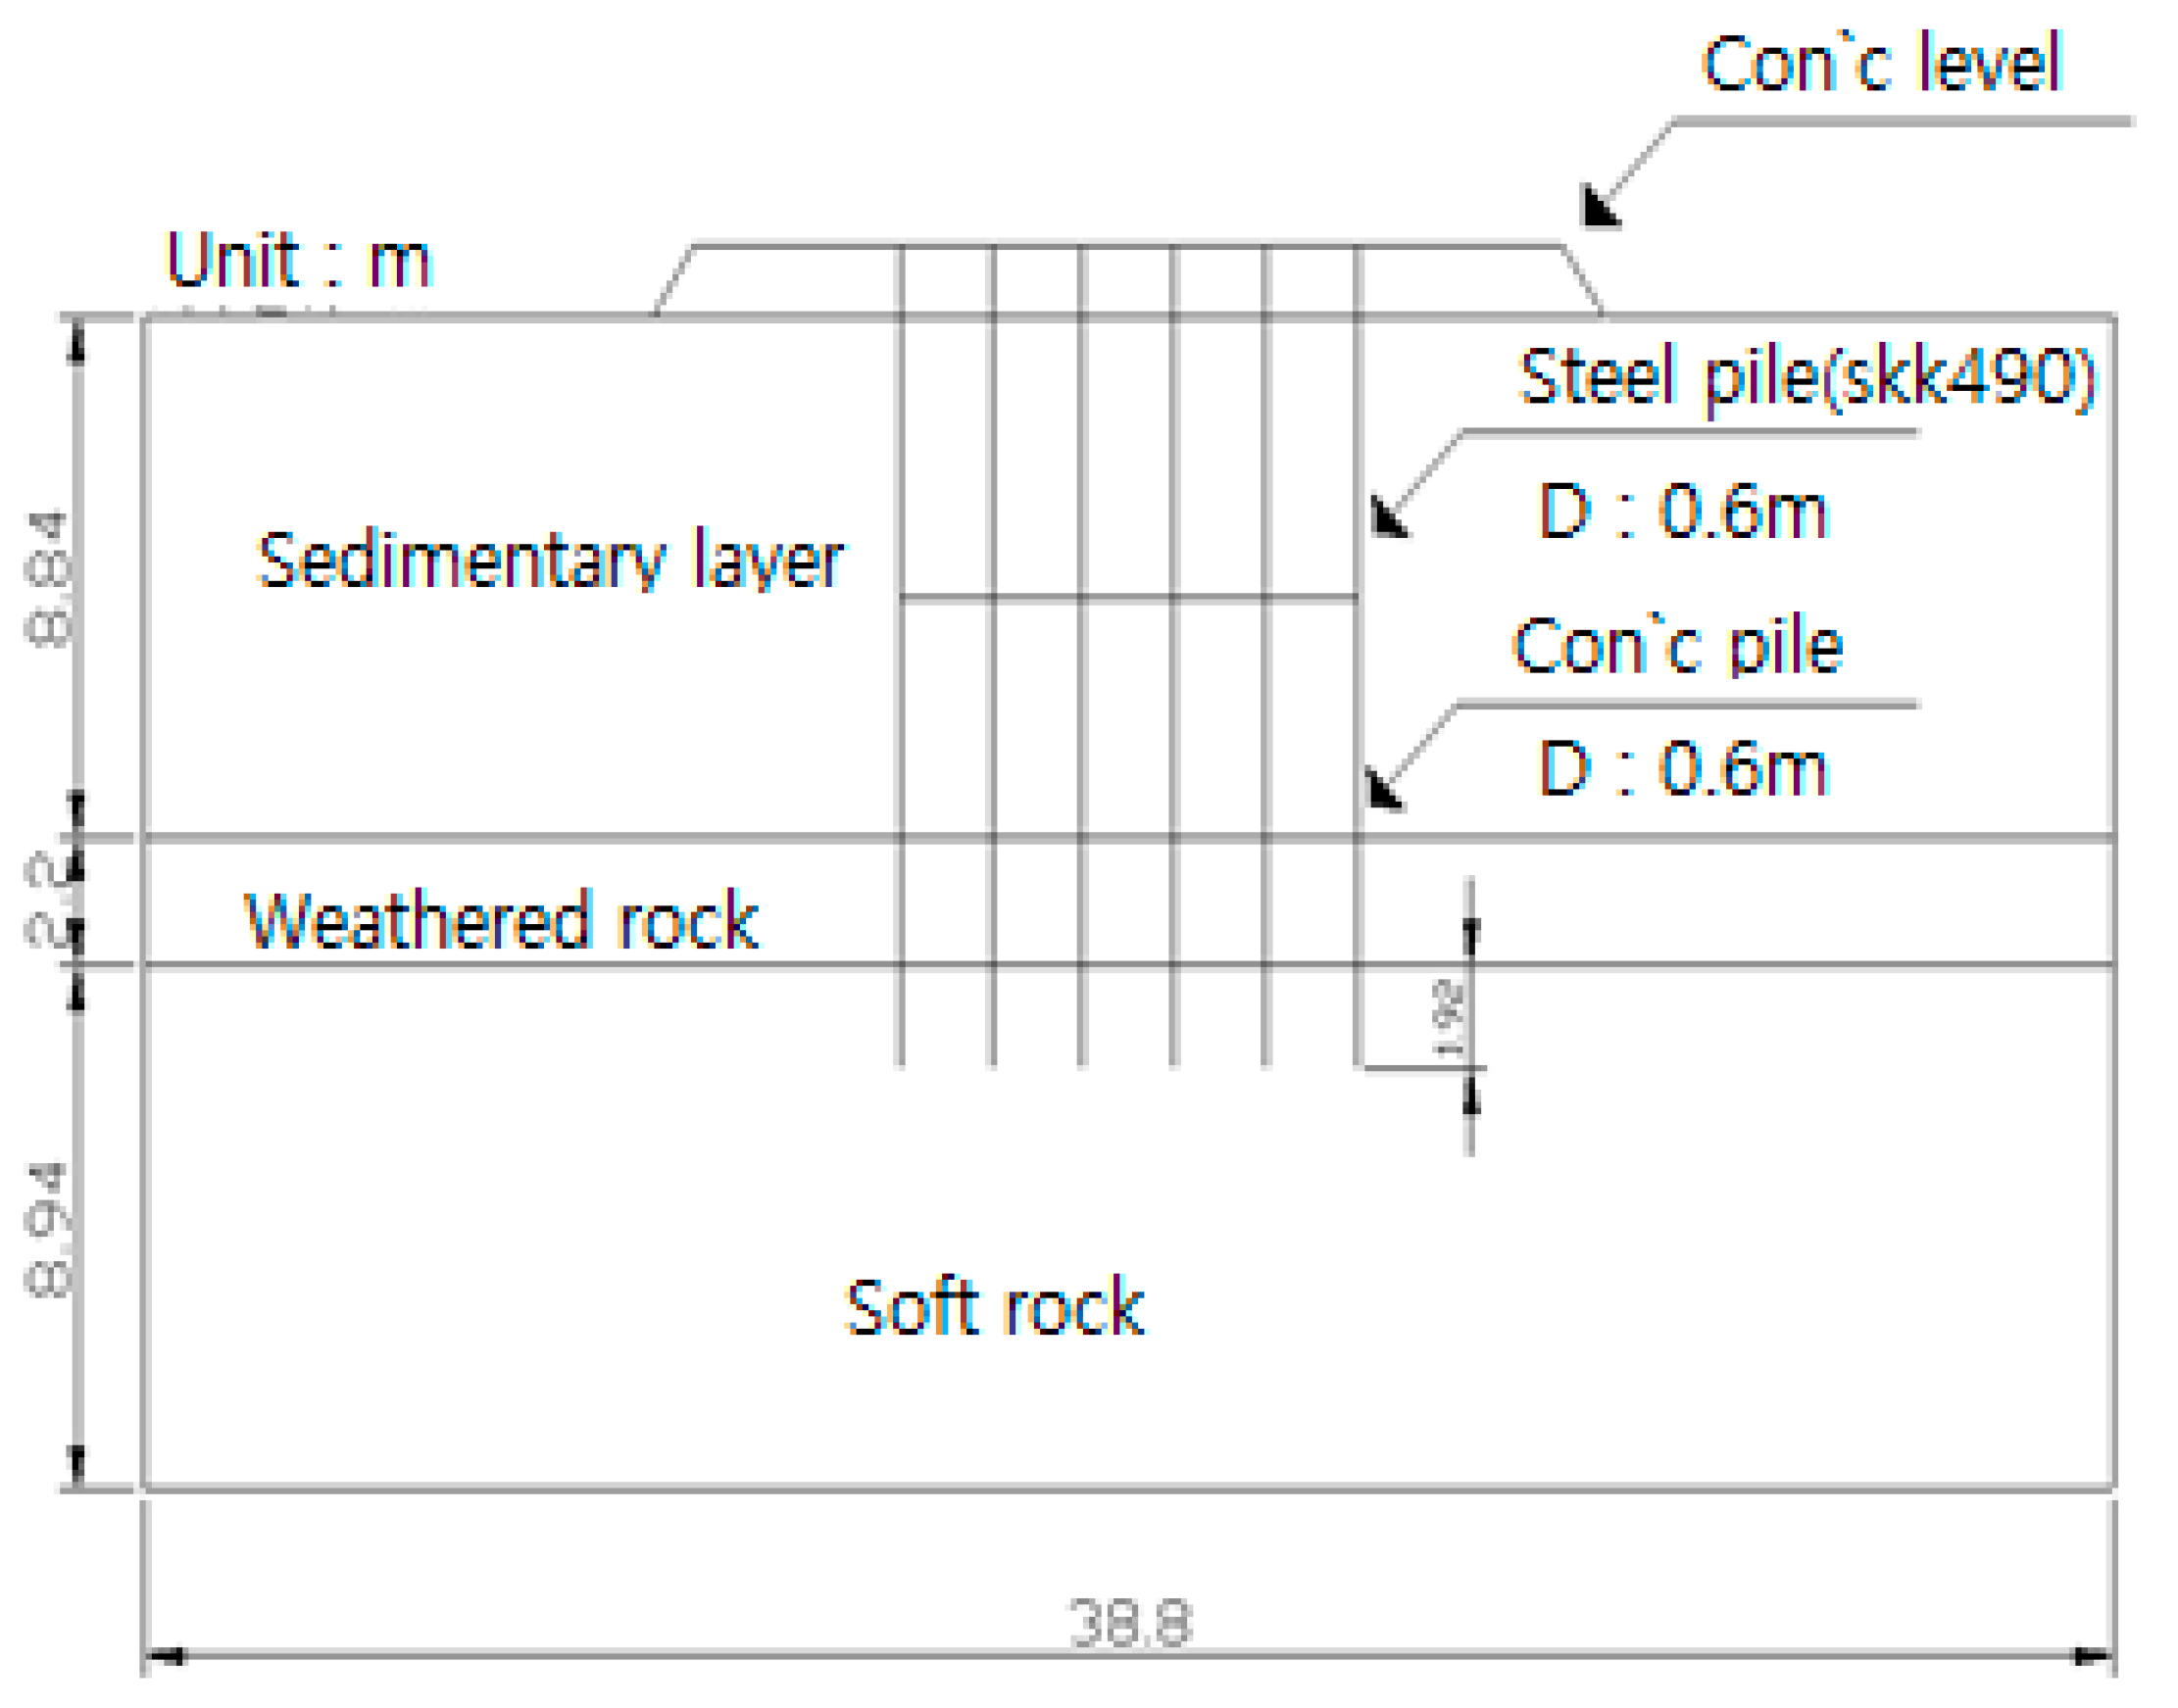
4.1.4. Modeling
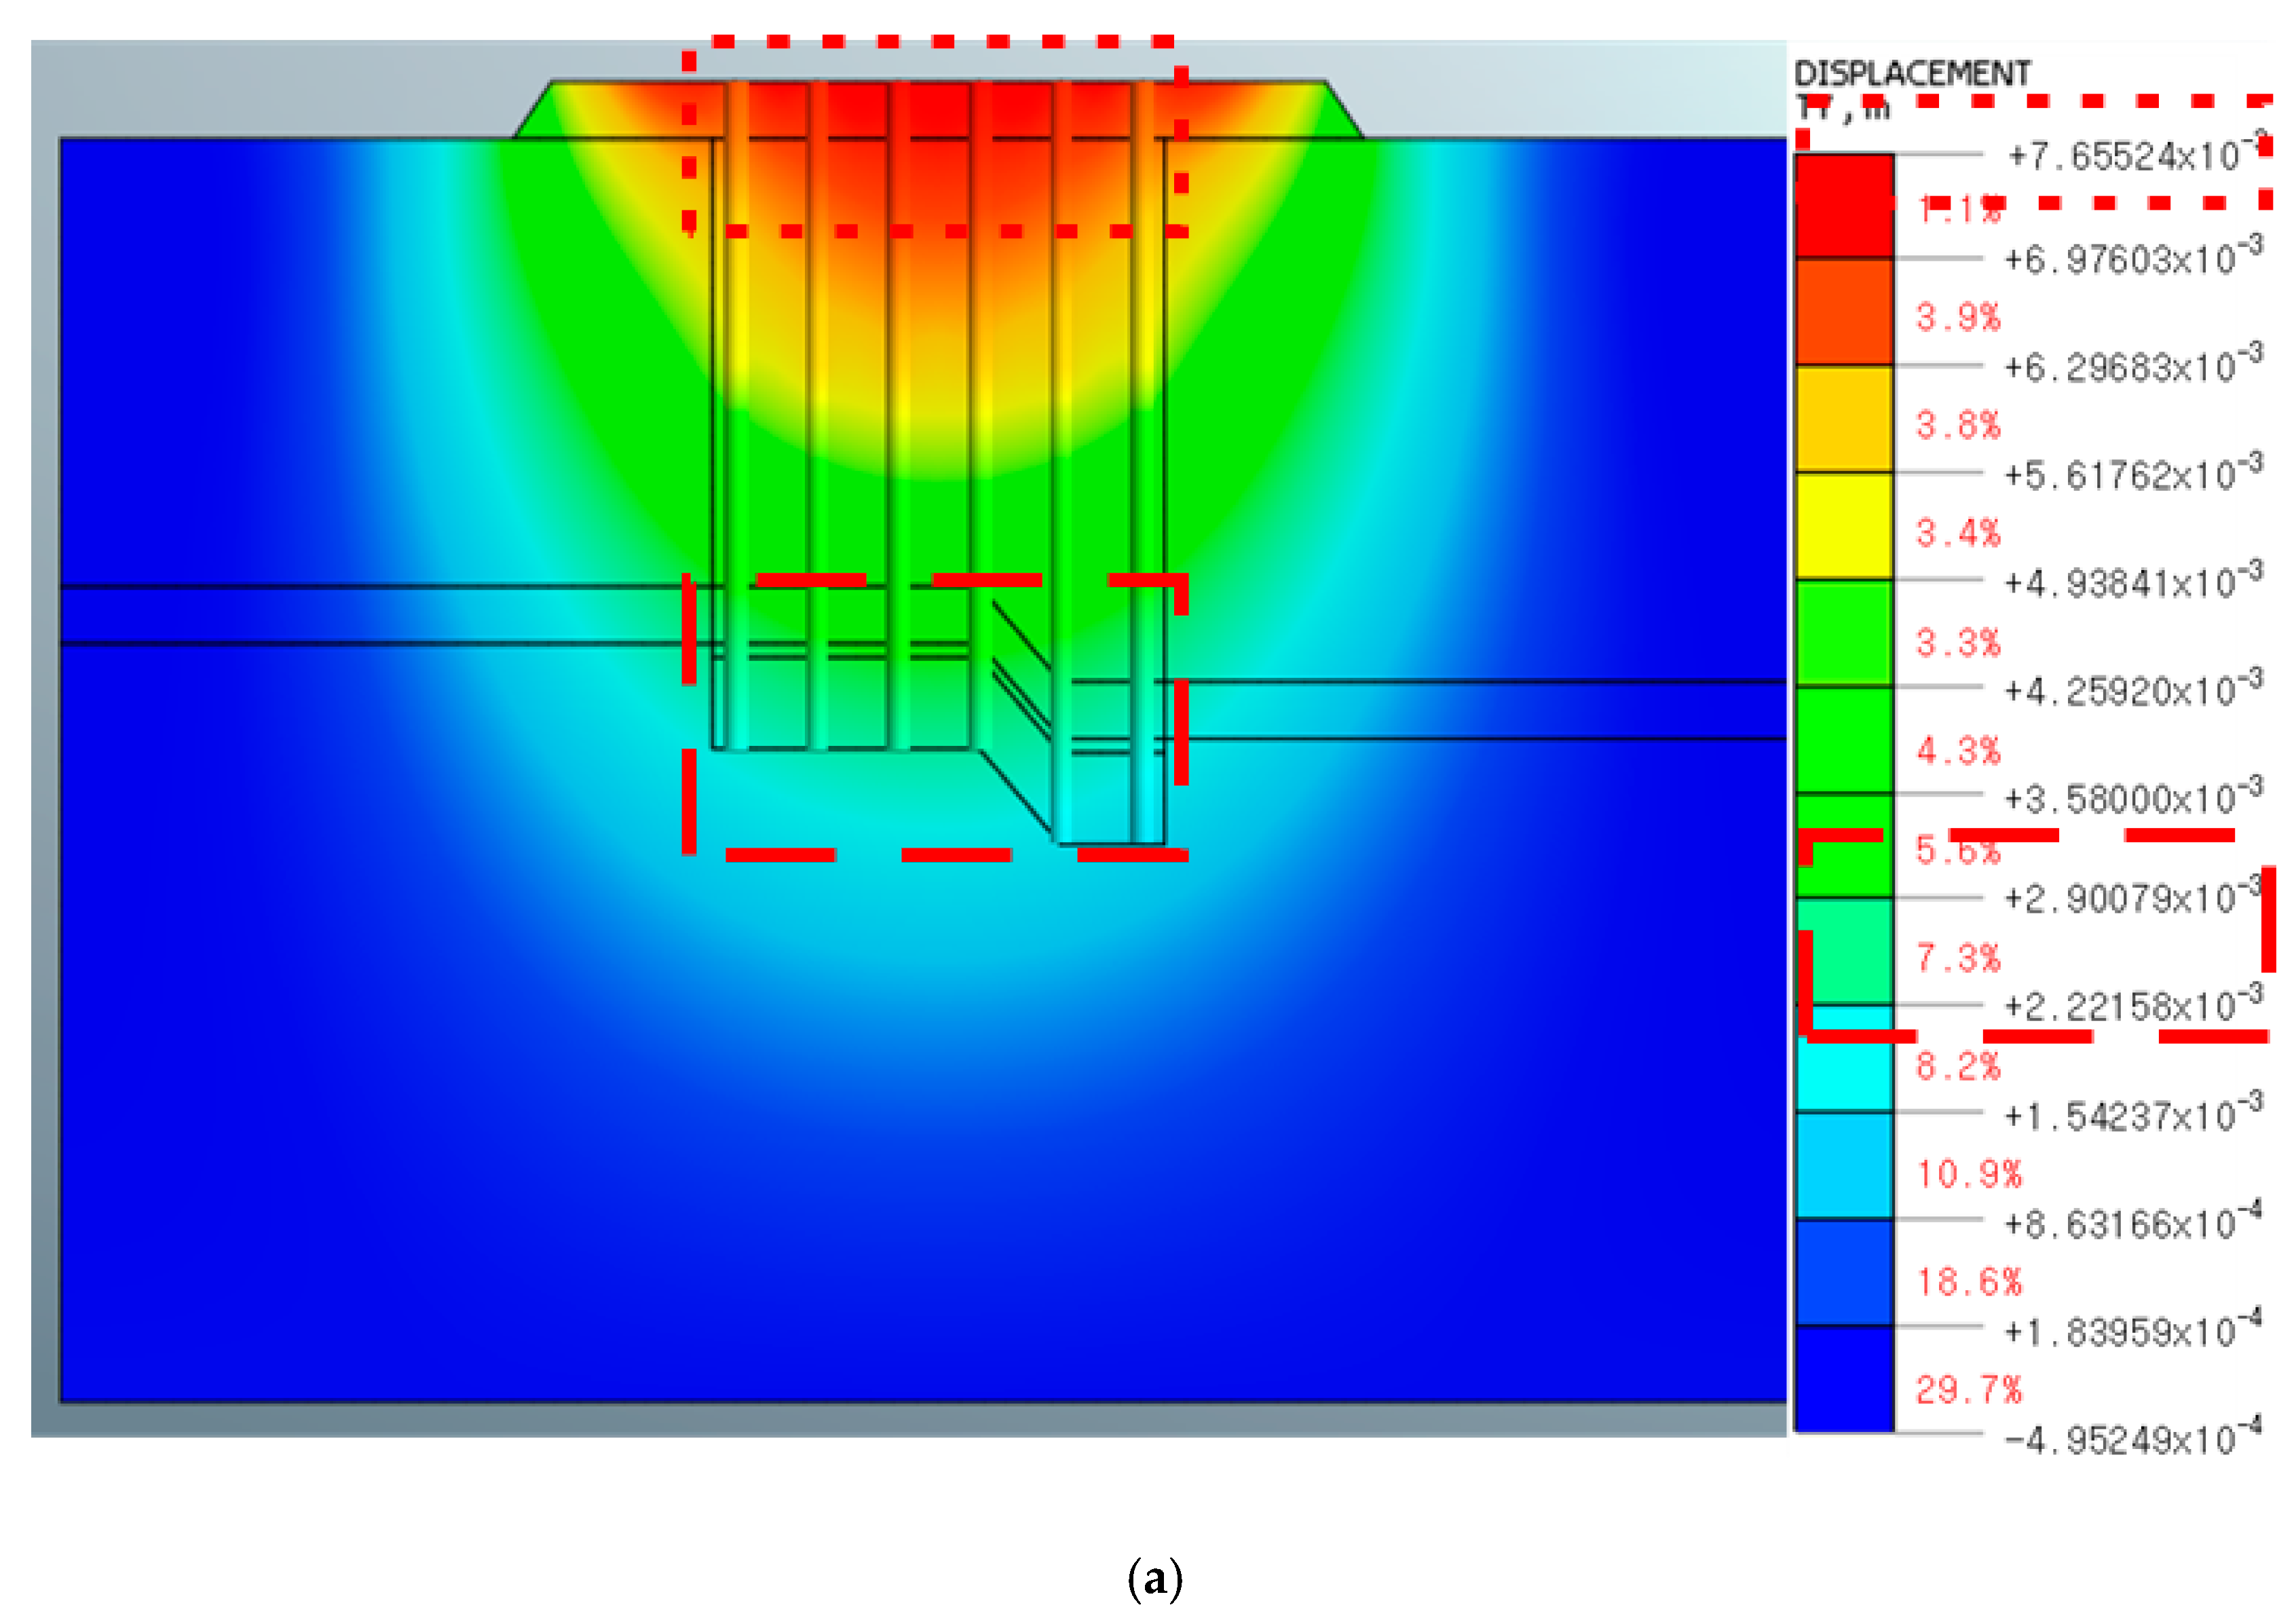
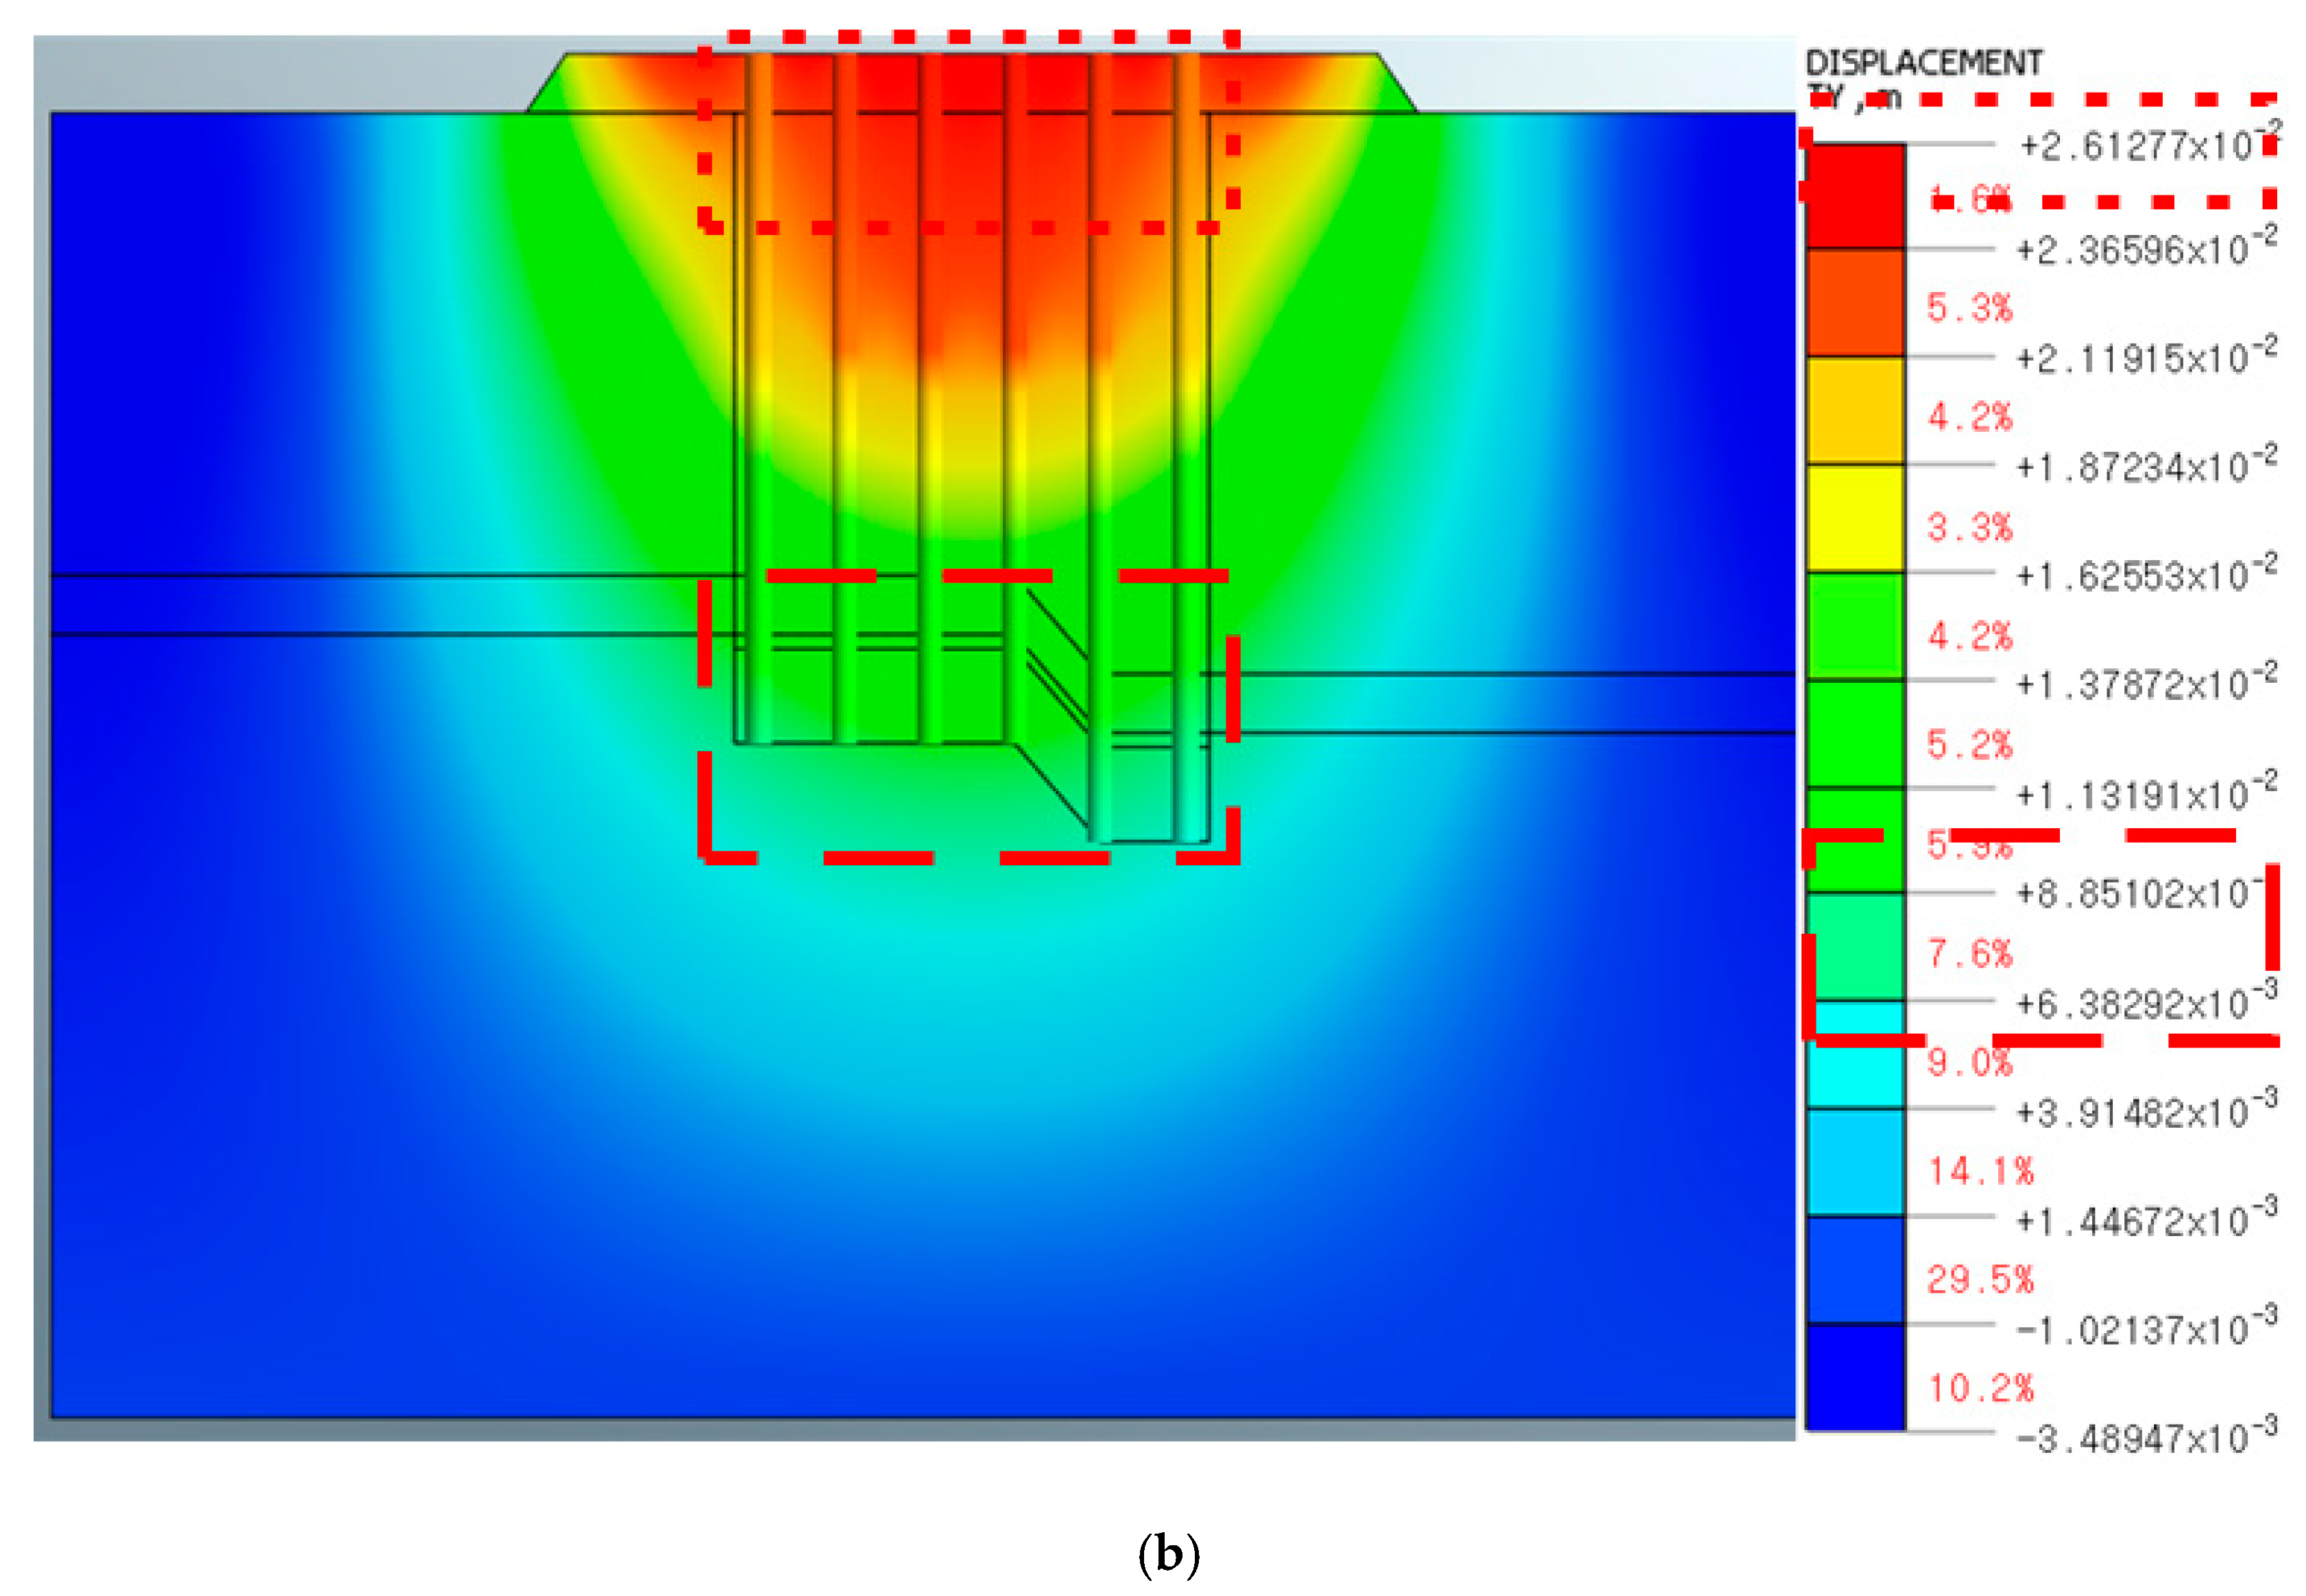
4.2. Numerical Analysis Review
5. Conclusions
Author Contributions
Funding
Institutional Review Board Statement
Informed Consent Statement
Conflicts of Interest
References
- International Standard. Petroleum and Natural Gas Industries–Fixed Steel Offshore Structures; ISO: Geneva, Switzerland, 2020; pp. 1–8. [Google Scholar]
- Structure Foundation Design Criteria; Ministry of Land, Infrastructure and Transport: Sejong, Korea, 2018.
- Standard Test Methods for Deep Foundations under Static Axial Tensile Load; Designation: D3689-07; American Society for Testing and Materials: West Conshohocken, PA, USA, 2007.
- Federal Highway Administration. Design and Construction of Driven Pile Foundations; No. FHWA-HI-96-033; Publisher: Washington, DC, USA, 1996; Available online: https://vulcanhammerinfo.files.wordpress.com/2017/08/fhwa-nhi-05-042-043.pdf (accessed on 26 September 2021).
- Drilled Shaft: Construction Procedures and Design Methods; No. FHWA-IF-99-025; Federal Highway Administration: Washington, DC, USA, 1999; Available online: http://danbrownandassociates.com/wp-content/uploads/2020/02/GEC10-Drilled-Shaft-Final-10-5-18.pdf (accessed on 26 September 2021).
- Canadian Geotechnical Society. Canadian Foundation Engineering Manual, 3nd ed.; Canadian Geotechnical Society Technical Committee on Foundation: Ottwa, ON, Canada, 1992. [Google Scholar]
- Maertens, L. Design and Installation of Steel Open End Piles in Weathered Basalt; International Deep Foundations Congress: Orlando, FL, USA, 2002; pp. 1–16. [Google Scholar]
- Shakir-Khalil, H. Push-Out Strength of Concrete-Filled Steel Hollow Sections; The Structural Engineers: Charity, UK, 1993; Volume 71, pp. 230–233. [Google Scholar]
- Shakir-Khalil, H. Resistance of Concrete-Filled Steel Tubes to Pushout Forces; The Structural Engineers: Charity, UK, 1993; Volume 71, pp. 234–243. [Google Scholar]
- Nezamian, A.; Al-Mahaidi, R.; Grundy, P.; O’Loughlin, B. Push-Out Strength of Concrete Plugs in Tubular Steel Piles; Intl. Offshore and Polar Engineering Conf.: Kitakyushu, Japan, 2002; pp. 60–64. [Google Scholar]
- Moon, K.T.; Park, S.R.; Shin, M.G. A Study on the Skin Friction of Steel Pile Embedded in Rock; Korean Society of Civil Engineering Conf.: Seoul, Korea, 2014; pp. 1647–1648. [Google Scholar]
- Moon, K.T.; Park, S.R.; Shin, M.G. Mechanical properties of filling materials for bored pile in rock. J. Korean Soc. Civ. Eng. 2017, 37, 637–645. [Google Scholar]
- Moon, K.T.; Park, S.R. Evaluation of the Shaft Resistance of Drilled-in Steel Tubular Pile in Rock Depending on the Proportion of Annulus Grouting Material. J. Korean Soc. Civ. Eng. 2018, 38, 51–61. [Google Scholar]
- Kim, D.H.; Park, J.J.; Chang, Y.C.; Jeong, S.S. Proposed shear load-transfer curves for prebored and precast steel piles. J. Korean Geotech. Soc. 2018, 34, 43–58. [Google Scholar]
- Kim, R.H.; Kim, D.W. Analysis of bearing capacity of rock socketed pre-bored super strength piles based on dynamic load test results. J. Korean Geotech. Soc. 2019, 18, 89–100. [Google Scholar] [CrossRef]
- Chae, S.G.; Park, J.H.; Ryu, K.R.; Kim, K.J.; Kim, J.H.; Ha, H.M. Formal introduction and suggestion of the vertical bearing capacity of SDA-buried piles constructed on bedrock. J. Korean Geotech. Soc. 2020, 36, 8–27. [Google Scholar]
- Vesic, A.S. Bearing capacity of deep foundations in sand. Highw. Res. Rec. 1943, 39, 112–153. [Google Scholar]
- Meyerhof, G.G. The ultimate bearing capacity of foundation. Geotechnique 1951, 2, 301–332. [Google Scholar] [CrossRef]
- Meyerhof, G.G. Penetration tests and bearing capacity of cohesionless soils. ASCE J. Geotech. Eng. 1956, 82, 1–19. [Google Scholar]
- Poulos, H.G.; Davis, E.H. Pile Foundation Analysis and Design; John Wiley and Sons: New York, NY, USA, 1980; Available online: https://priodeep.weebly.com/uploads/6/5/4/9/65495087/_series_in_geotechnical_engineering__harry_g._poulos_edward_h._davis-pile_foundation_analysis_and_design-john_wiley___sons_inc__1980_.pdf (accessed on 26 September 2021).
- Vesic, A.S. Design of Pile Foundation; NCHRP Synthesis of Highway Practice No.42, Transportation Research Record; National Research Council: Washington, DC, USA, 1977. [Google Scholar]
- Berezantzev, V.G. Load bearing capacity and deformation of piled foundations. In Proceedings of the Fifth International Conference on Soil Mechanics and Foundation Engineering, Paris, France, 17–22 July 1961; Dunod: Paris, France, 1961; Volume 2, pp. 11–15. [Google Scholar]
- Korean Geotechnical Engineering, 4th ed.; Seoul, Korea, 2002.
- Road Bridge Design Criteria; Ministry of Land, Infrastructure and Transport: Sejong, Korea, 2016.
- Cho, C.W. Pre-Bored Pile Method; Seoul, Korea, 2006. [Google Scholar]
- Cho, C.W. Piling Engineering Practice; ENG Book: Seoul, Korea, 2010. [Google Scholar]
- Kim, J.H.; Jung, H.S. Ground Anchor Method for Practitioners; Cialis (CIR): Seoul, Korea, 2016. [Google Scholar]


| Classification | Equations | Proposers | Applicability |
|---|---|---|---|
| Skin Friction | Tomlinson (1972) | Pre-stress and clay soil | |
| Jennings and Burland (1973) | Effective stress amnd clay soil | ||
| McClelland and Focht (1967) | Mixing method and clay soil | ||
| Meyerhof (1976) | Clay soil | ||
| Meyerhof, Colye-Castello, Vesic, API etc | Sandy soil | ||
| End-bearing capacity | Meyerhof (1976) | Sandy soil | |
| Meyerhof (1976) | Clay soil | ||
| Vesic (1977) | Cavity expansion theory | ||
| Berezantzev (1961) |
| Classification | Selected Load (kN) | |
|---|---|---|
| Resistance Load | C.T cofferdam weight | 3665.250 |
| Water load inside the tank | 5078.340 | |
| Water load inside watertight part | 548.311 | |
| Leveling concrete weight | 7591.710 | |
| Resistance of piles (600 kN per pile) | 21,600.000 | |
| Pile weight (45.2 kN per pile) | 1630.000 | |
| Buoyancy | Leveling concrete bottom buoyancy | 29,929.973 |
| Fs (Satety rate) | ||
| Classification | Allowable Skin Friction of Pile (pull-out, kN) | Remark | |
|---|---|---|---|
| Existing design data | C.T cofferdam design structure calculation sheet (1.0 m embedded in the rock) | 600 | Depth embedded in the rock 1.92 m Diameter of the pile 0.6 m |
| Pull-out force considering the thread-embedded depth of the pile (2.197 m embedded in the rock) | 1209 | ||
| Design standard | AASHTO (1996) | 200.5 | |
| Canadian Geotechnical Society (1985) | 356.9 | ||
| NAVFAC (1982) | 931.8 | ||
| FHWA (1988) Horvath and Kenny (1979) | 648.8 | ||
| FHWA (1999) Horvath and Kenny (1979) | 770.4 | ||
| FHWA (1999) Rowe and Armitage (1984) | 746.8 | ||
| Structural Foundation Design Standard (2008) | Wiliams et al. (1980) | 659.6 | |
| Rowe and Armitage (1987) | 1774,3 | ||
| Horvath and Kenney (1979) | 819.9 | ||
| Carter and Kulhawy (1988) | 770.9 | ||
| Reynolds and Kaderabek (1987) | 3460.5 | ||
| Gupton and Logan (1984) | 2307.8 | ||
| Reese and O‘Neil (1987) | 1730.8 | ||
| Rosengerg and Journaeaux (1976) | 1489.7 | ||
| Anchor method | Putout resistance of anchor | 292.8 | |
| Friction of ground and grout | 566.7 | ||
| Maximum adhesive force of tensile material and grout | 791.1 | ||
| Classification | Allowable Skin Friction | Test Methods |
|---|---|---|
| Moon et al. [11] | Test conditions: W/C: 50% | 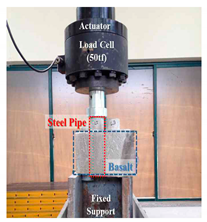 |
| Moon and Park [13] | Test conditions: W/C: 60~120% | 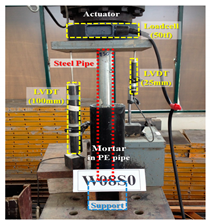 |
| Classification | Water (mL) | Cement (g) | Grout Material (g) |
|---|---|---|---|
| Water curing of concrete: 28 days, 2 EA | 490 | 700 | 70 |
| Air curing of concrete: 28 days, 3 EA | 490 | 700 | 70 |
| Classification | Allowable Skin Friction | Avgerage Allowable Skin Friction | |
|---|---|---|---|
| Water curing | WT-1 | 542.55 kN | |
| WT-2 | |||
| Air Curing | AT-1 | 881.03 kN | |
| AT-2 | |||
| AT-3 | |||
| Classification | Re-examination of Allowable Pull-Out Force | Allowable Pull-Out Force | |
|---|---|---|---|
| On-site pull-out test | P2 | ① (at Offset Point) ② (at 0.25 in) | 399.7 kN |
| Classification | Pile Pull-Out Force (kN) | Safety Factor (Standard 1.2) | Remark | |||
|---|---|---|---|---|---|---|
| P2 | Existing design | Original design (1.0 m rock-bottom embedded) | 600 | 1.4 | stable | Estimated value |
| Lab experiment | Grout air curing of concrete (1.92 m rock depth) | 881 | 1.7 | stable | Site conditions lacking | |
| Grout placed in water (1.92 m rock depth) | 542 | 1.3 | stable | Only the conditions for placing it in water were taken into account | ||
| On-site experiment | On-site pull-out test (1.92 m rock depth) | 399 | 1.1 | instable | Test methods have high reliability | |
| Design data | Designer review (2.197 m rock depth) | 1210 | 2.0 | stable | Cast-in-place pile standards | |
| Previous research | Various research standards (1.92 m rock depth) | 680~1160 | 1.4~2.0 | stable | Air curing of concrete | |
| Various design standards (1.92 m rock depth) | 220~1700 | 0.8~2.6 | stable~ instable | Cast-in-place pile standards | ||
| Classification | Sedimentary Soil | Weathered Rock | Soft Rock | Leveling Concrete | Rebar Concrete | Steel Pipe Pile | |
|---|---|---|---|---|---|---|---|
| Wetting unit weight | (kN/m3) | 17 | 23 | 25 | 25 | 25 | 78 |
| Saturation unit weight | (kN/m3) | 18 | 23.5 | 25.5 | 25.5 | 25.5 | 79 |
| Cohesion | c (kN/m2) | 13 | 30 | 50 | - | - | - |
| Internal friction angle | (°) | 0 | 33 | 35 | - | - | - |
| Elastic modulus coefficient | E (kN/m2) | 4000 | 167,500 | 2,180,000 | 2,320,000 | 2,320,000 | 2.1 × 10⁸ |
| Poisson’s ratio | 0.38 | 0.3 | 0.26 | 0.2 | 0.19 | 0.3 | |
| Classification | Weathered Rock (Injection Material) | Soft Rock (Injection Material) | |
|---|---|---|---|
| Wetting unit weight | (kN/m3) | 23 | 25 |
| Saturation unit weight | (kN/m3) | 23.5 | 25.5 |
| Cohesion | c (kN/m2) | 30 | 50 |
| Internal friction angle | (°) | 33 | 35 |
| Elastic modulus coefficient | E (kN/m2) | 928,000 | 928,000 |
| Poisson’s ratio | 0.3 | 0.3 | |
| Classification | Displacement (cm) | Stability (Based on 1 inch) | |
|---|---|---|---|
| P2 lateral direction Soft rock at 1.92 m | Pile tip | 0.22 to 0.29 | 0.29 ≤ 2.54_stable |
| Total displacement | 0.70 to 0.77 | 0.77 ≤ 2.54_stable | |
| P2 lateral direction Underwater grout Consider material properties | Pile tip | 0.64 to 0.89 | 0.89 ≤ 2.54_stable |
| Total displacement | 2.37~2.61 | 2.61 ≥ 2.54_unstable | |
| P2 bridge direction Soft rock at 2.21 m | Pile tip | 0.22 to 0.29 | 0.29 ≤ 2.54_stable |
| Total displacement | 0.70 to 0.77 | 0.77 ≤ 2.54_stable | |
| P2 bridge direction Underwater grout Consider material properties | Pile tip | 0.64 to 0.89 | 0.89 ≤ 2.54_stable |
| Total displacement | 2.37~2.61 | 2.61 ≥ 2.54_unstable | |
Publisher’s Note: MDPI stays neutral with regard to jurisdictional claims in published maps and institutional affiliations. |
© 2021 by the authors. Licensee MDPI, Basel, Switzerland. This article is an open access article distributed under the terms and conditions of the Creative Commons Attribution (CC BY) license (https://creativecommons.org/licenses/by/4.0/).
Share and Cite
Park, K.; Kim, D.; Kim, G.; Lee, W. Evaluation of the Pullout Behavior of Pre-Bored Piles Embedded in Rock. Materials 2021, 14, 5593. https://doi.org/10.3390/ma14195593
Park K, Kim D, Kim G, Lee W. Evaluation of the Pullout Behavior of Pre-Bored Piles Embedded in Rock. Materials. 2021; 14(19):5593. https://doi.org/10.3390/ma14195593
Chicago/Turabian StylePark, Kyungho, Daehyeon Kim, Gyudeok Kim, and Wooyoul Lee. 2021. "Evaluation of the Pullout Behavior of Pre-Bored Piles Embedded in Rock" Materials 14, no. 19: 5593. https://doi.org/10.3390/ma14195593
APA StylePark, K., Kim, D., Kim, G., & Lee, W. (2021). Evaluation of the Pullout Behavior of Pre-Bored Piles Embedded in Rock. Materials, 14(19), 5593. https://doi.org/10.3390/ma14195593