Article

Effects of Hydrothermal Time on Structure and Photocatalytic Property of Titanium Dioxide for Degradation of Rhodamine B and Tetracycline Hydrochloride

1
School of Mechanical Engineering, Chengdu University, Chengdu 610106, China
2
School of Food and Biological Engineering, Chengdu University, Chengdu 610106, China
*
Authors to whom correspondence should be addressed.
Materials 2021, 14(19), 5674; https://doi.org/10.3390/ma14195674
Submission received: 7 August 2021 / Revised: 20 September 2021 / Accepted: 26 September 2021 / Published: 29 September 2021

Abstract

:
Using butyl titanate and absolute ethanol as raw materials, TiO2 was prepared by a hydrothermal method with different hydrothermal times, and the influences of hydrothermal time on the structure and photocatalytic performance of TiO2 were investigated. The obtained samples were characterized by XRD, SEM, TEM, BET, PL and DRS, separately. The results show that TiO2 forms anatase when the hydrothermal time is 12 h, forms a mixed crystal composed of anatase and rutile when the hydrothermal time is 24 h, and forms rutile when the hydrothermal time is 36 h. With the extension of hydrothermal time, anatase gradually transforms into rutile and the surface area decreases. Although TiO2-24 h and TiO2-36 h show lower photoinduced charge recombination and higher light source utilization, TiO2-12 h exhibits the highest photocatalytic activity owing to its largest surface area (145.3 m2/g). The degradation degree of rhodamine B and tetracycline hydrochloride reach 99.6% and 90.0% after 45 min.

1. Introduction

Employing photocatalytic technology to degrade pollutants is an effective route for environmental governance. TiO2 has received extensive attention due to its advantages such as chemical stability, low cost, mild reaction conditions and high photocatalytic activity [1,2,3,4,5]. The crystal structure, crystallinity, surface morphology, specific surface area and optical property of TiO2 are closely related to the preparation method. The most commonly used methods are mainly sol–gel [6,7,8] and hydrothermal methods [9,10,11,12]. Zhu et al. [6] used sol–gel methods to synthesize TiO2 under calcination at 540 °C. The particles are spherical with a certain extent agglomeration and the surface area is 40 m2/g. It is convenient to control the morphology of photocatalyst by a hydrothermal method, which does not require high-temperature calcination and is conducive to obtaining a large surface area and high photocatalytic activity [13,14,15,16,17,18]. Esparza et al. [16] prepared nanostructured TiO2 by a hydrothermal method. The crystal grain size was 13 nm, and the particles were composed of nanotubes and nanosheets with a large surface area (269 m2/g). Methylene blue (MB) was completely degraded under UV light after 120 min. Zhu et al. [13] prepared Cu-doped TiO2 under the conditions of 200 °C for 12 h by hydrothermal method. It was found that the photocatalyst was anatase/rutile mixed crystal structure and the surface area was 73.9 m2/g. The decolorization degree of rhodamine (RhB) was 99.4% after 60 min. Nesic et al. [18]. prepared lanthanum and vanadium co-doped titanium dioxide by a microwave-assisted hydrothermal method. The samples showed high crystallinity and were all anatase structures. The specific surface area of 0.02V-2La/TiO2 was 125 m2/g, and the decolorization degree of RhB was more than 90% after 90 min.
Hydrothermal conditions will affect the crystal structure, surface morphology and specific surface area, thereby affecting the photocatalytic performance [19,20]. Lee et al. [19] studied the effects of hydrothermal temperature from 120 to 210 °C on the morphology and photocatalytic performance of TiO2. The results show that the particles gradually change from granular to nanotube with the increasing temperature and TiO2 prepared at 180 °C displays the best photocatalytic performance. Changing the ratio of reactants can also affect the structure and photocatalytic performance of the products [21,22]. Li et al. [21] prepared TiO2 by using different molar ratios of tartaric acid to TiCl3. When the tartaric acid: TiCl3 is 0.1, the photocatalytic activity is the highest.
In the present study, at the fixed hydrothermal temperature 200 °C, TiO2 photocatalysts were prepared with a hydrothermal time of 12, 24 and 36 h, respectively. The obtained samples were characterized by XRD, SEM, TEM, BET, PL, DRS and the degradation of RhB and tetracycline hydrochloride (TC) to study the effects of hydrothermal time on the crystal structure, morphology, specific surface area, optical property and photocatalytic performance of TiO2.

2. Experimental Section

2.1. Material Preparation

10 mL butyl titanate and 20 mL absolute ethanol were mixed to prepare solution A. Solution B was made of 30 mL deionized water, 2 mL hydrochloric acid and 2 mL polyethylene glycol, which was added to solution A dropwise. After stirring for 1 h, the mixture was transfer into a 100 mL hydrothermal reactor and kept at 200 °C for 12 h, 24 h and 36 h. After washing and drying, TiO2 photocatalysts were obtained. No further calcination process was performed. The samples obtained with different hydrothermal times were labeled as TiO2-12 h, TiO2-24 h and TiO2-36 h.

2.2. Characterization

The crystal structure was characterized by DX-2700 X-ray diffractometer (XRD). Morphology was observed using Hitachi SU8220 scanning electron microscope (SEM) and FEI-Tecnai G2 F20 transmission electron microscope (TEM). Surface area was measured by an ASAP2460 surface area analyzer (BET). The optical property was studied using UV-3600 ultraviolet-visible spectrophotometer (DRS) and F-4600 fluorescence spectrometer (PL).

2.3. Photocatalysis Experiment

To achieve adsorption and desorption equilibrium, 0.1 g TiO2 powder and 100 mL (10 mg/L) RhB solution or 100 mL (30 mg/L) TC solution were mixed and then stirred 30 min in the dark. Using a 250 W xenon lamp as the light source, the mixture was taken every 15 min to measure the absorbance and the degradation degree was calculated by the formula (A0 − At)/A0 × 100%.

3. Results and Discussion

3.1. Crystal Structure

Figure 1 exhibits the XRD patterns of samples. All peaks in TiO2-12 h correspond to anatase structure, indicating TiO2 forms anatase when the hydrothermal time is 12 h. The peak intensity of anatase (101) plane in TiO2-24 h drops sharply, and the peaks of anatase (004), (200), (105), (204) planes disappear. Only the peaks around 25.3 and 48.1° ascribing to the (101) and (200) crystal planes of anatase structure can be detected. Meanwhile, the rutile diffraction peaks appear and the intensity is much higher than anatase, implying that TiO2-24 h forms anatase/rutile mixed crystal structure. The mass fraction of anatase (XA) can be calculated by the following formula [2,21]:
XA = (1 + 1.26(IR/IA))−1
where IA and IR represent the intensities of anatase (101) plane and rutile (110) plane, respectively. The mass fraction of anatase phase is 7.1% and the mass fraction of rutile phase is 92.9% in TiO2-24 sample. The anatase diffraction peaks in TiO2-36 h disappear wholly and all the peaks can be attributed to rutile, which indicates that the transformation from anatase to rutile has been completed when hydrothermal time is 36 h [23,24]. The grain sizes (D) of samples were calculated by the Scherrer formula [2]:
D = 0.89λ/βcosθ
where λ represents the wavelength of Cu Ka, β represents the full width at half maximum of the XRD peak ((101) plane for anatase and (110) plane for rutile), and 2θ represents the Bragg diffraction angle. The grain sizes (D) of TiO2-12, TiO2-24 and TiO2-36 are 9.9 nm, 13.2 nm (anatase)/35.0 nm (rutile) and 27.5 nm.

3.2. Morphology and Surface Area

Figure 2 depicts the SEM images of TiO2-12 h, TiO2-24 h and TiO2-36 h. It is observed in Figure 2a that TiO2-12 h is composed of fine particles which further constitute agglomerates. The agglomerate size ranges from tens to hundreds of nanometers. The agglomeration of TiO2-24 h in Figure 2b is more obvious. In Figure 2c, the particles of TiO2-36 h are flaky and massive.
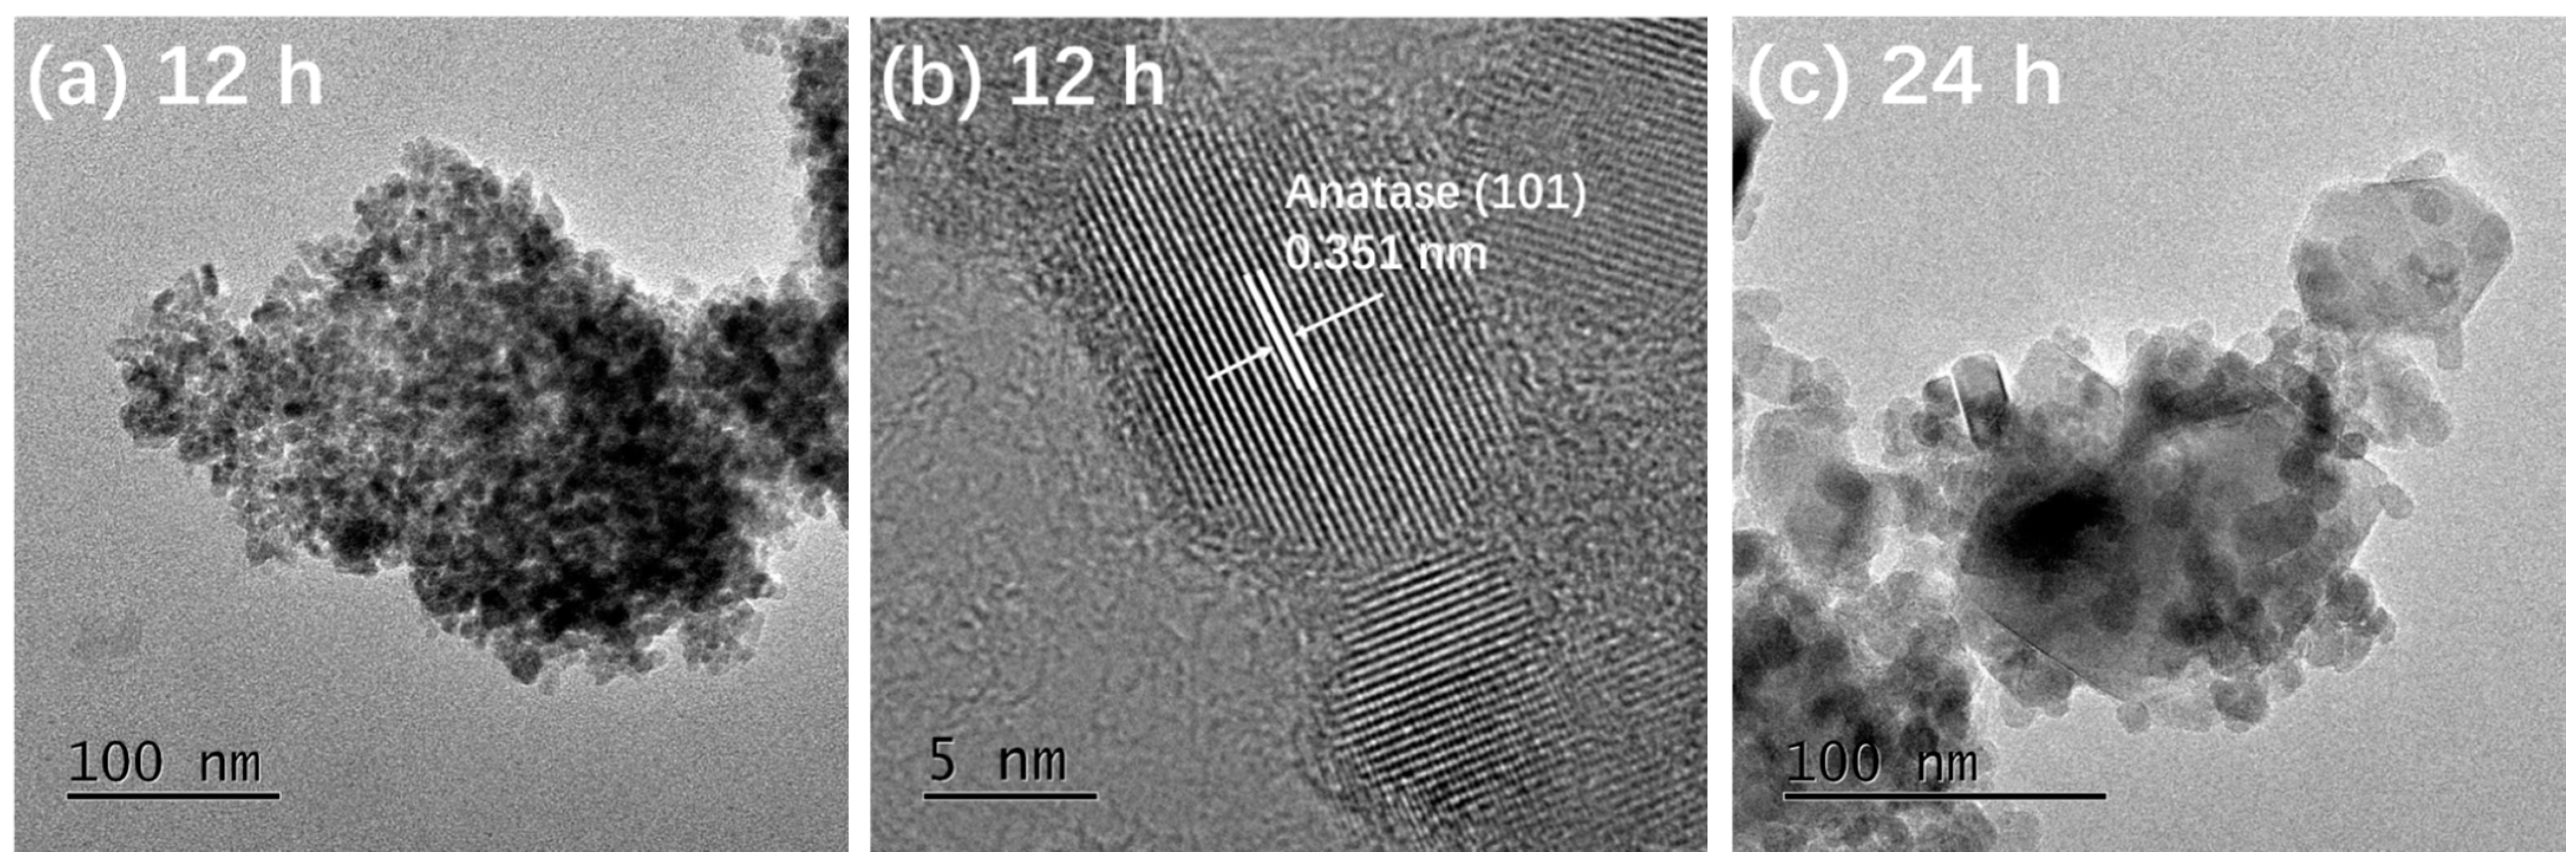
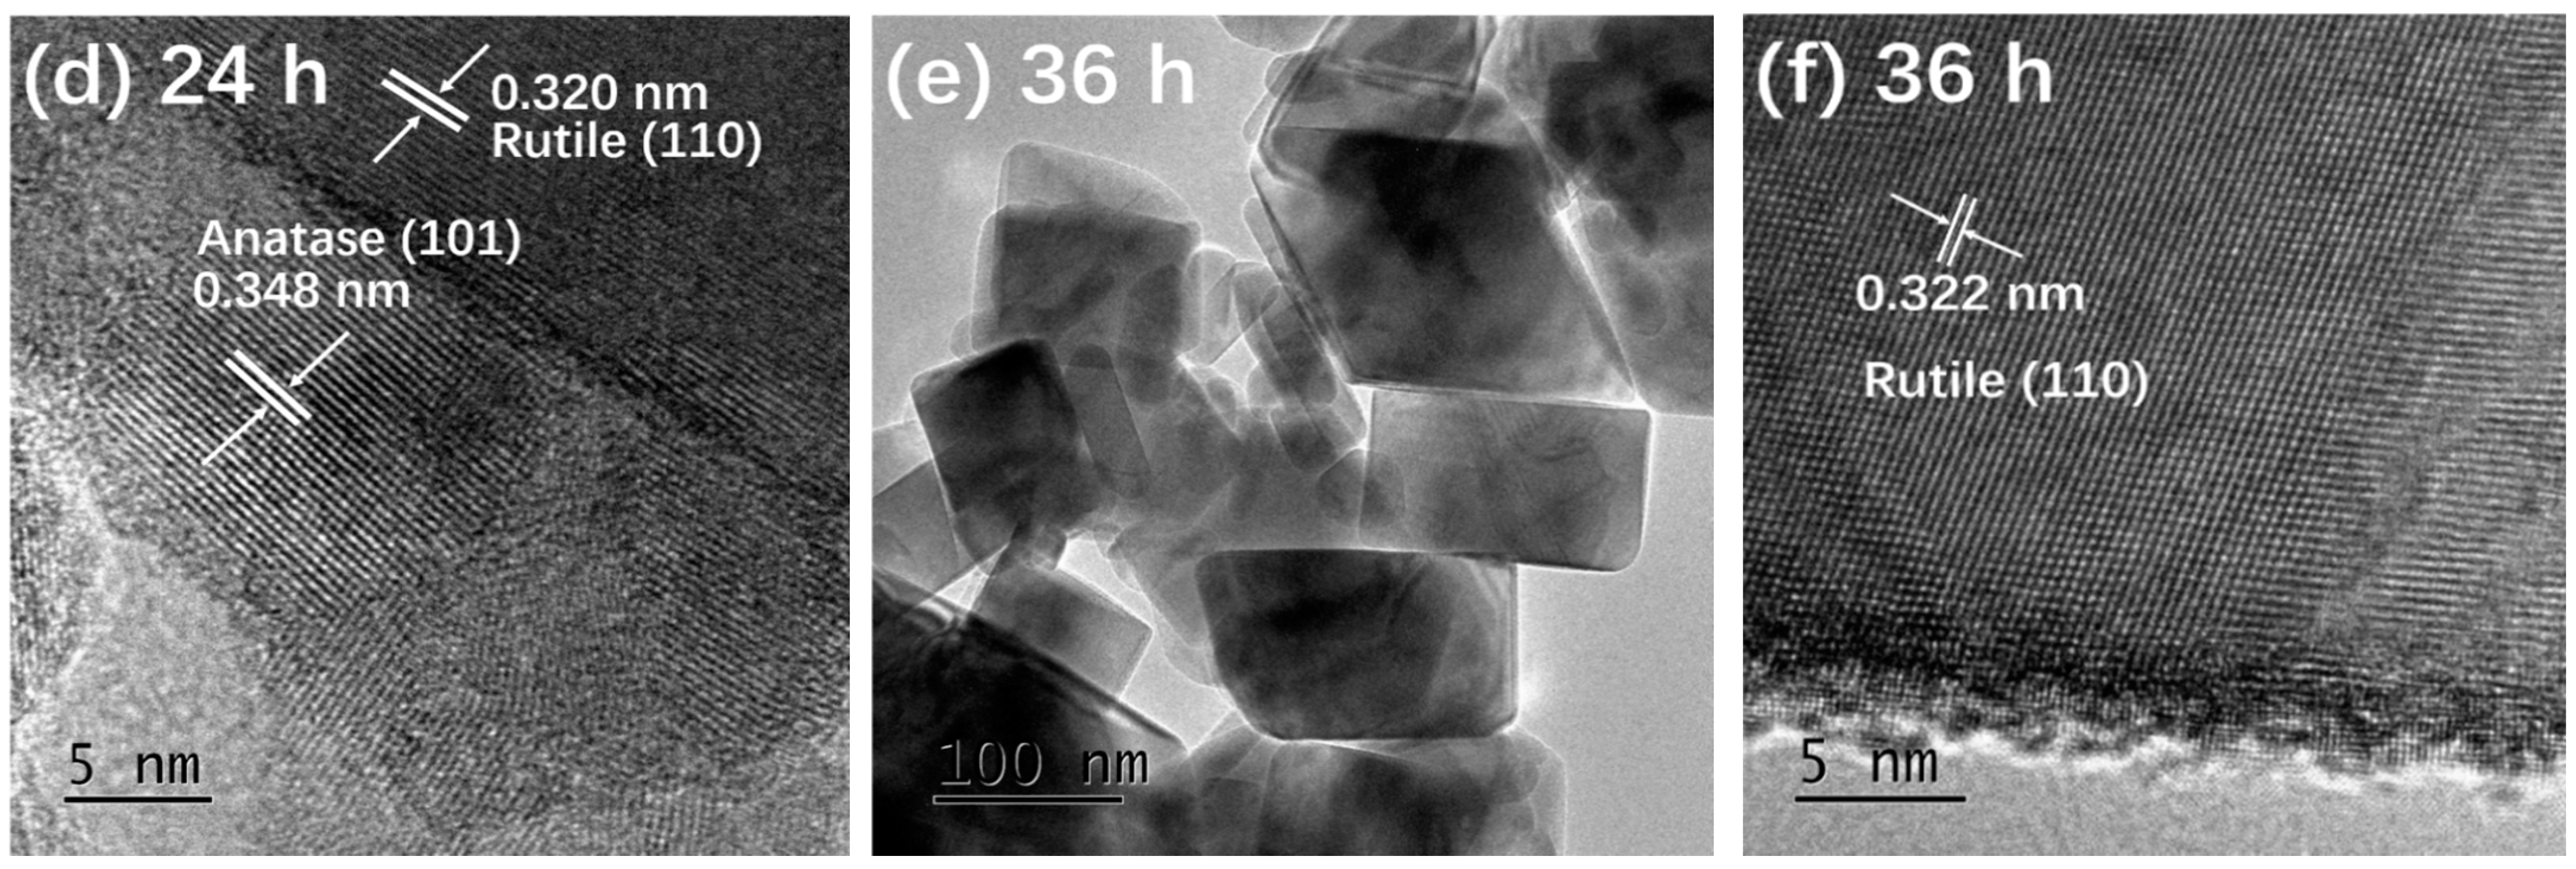
Figure 3 presents the TEM and HRTEM images of TiO2-12 h Figure 3a,b, TiO2-24 h Figure 3c,d and TiO2-36 h Figure 3e,f. In Figure 3a, the particles are relatively dispersed and the size of a single particle is around 10 nm. The interplanar spacing in Figure 3b is 0.351 nm, corresponding to the (101) crystal plane of anatase [5]. It is observed from Figure 3c that the size of a single particle is 15–30 nm, which is larger than that of TiO2-12 h. In addition to the granular shape, several particles exhibit rod and block shapes. The length of the nanorods is about 50 nm and the width is 15 nm. The size of the blocks is 50–100 nm. In Figure 3d, the marked interplanar spacing 0.348 nm corresponds to the (101) crystal plane of anatase and 0.320 nm corresponds to the (110) crystal plane of rutile [13,20], indicating that TiO2-24 h is a mixed crystal composed of anatase and rutile, which is in line with XRD results. Nanoparticle almost disappears in Figure 3e and the particles are completely made of rods and blocks. The length of rods is 100 nm and the width is approximately 20 nm. The size of the blocks is around 120 nm. The interplanar spacing marked in Figure 3f is 0.322 nm, corresponding to the (110) crystal plane of rutile.
The morphology of TiO2 has a great impact on surface area and adsorption performance. It is found in Figure 3 that with the extension of hydrothermal time, the single particle size increases and the morphology changes significantly, which may lead to the surface area difference. To clarify the influences of hydrothermal time on surface area and the porosity of samples, the textural properties of samples have been implemented and the results are shown in Figure 4 and Table 1. Both TiO2-12 h and TiO2-24 h are mesoporous materials. The pore size distribution curve of TiO2-12 h shows a narrow peak, and its pore size distribution is uniform, and the pore size is between 5–15 nm. The pore size distribution curve of TiO2-24 h shows a broad peak shape, and the pore size distribution is uneven with a size of 5–50 nm. There is no peak in the pore size distribution curve of TiO2-36 h, indicating that no obvious mesopores can be detected in TiO2-36 h. The BET surface area, pore volume and average pore size of samples are summarized in Table 1. As the hydrothermal time increases, the BET surface area decreases from 145.3 m2/g to 43.0 m2/g and 13.3 m2/g, and the pore volume is reduced from 0.264 cm3/g to 0.107 cm3/g and 0.029 cm3/g. TEM images show that as hydrothermal time increases from 12 to 24 h, part of fine nanoparticles aggregate to form nanorods and nanoblocks. When the reaction time is 36 h, all the nanoparticles aggregate to form nanorods and nanoblocks. The agglomeration phenomenon is further intensified, and the BET surface area and pore volume are reduced.
Controlling the morphology of TiO2 and increasing its specific surface area is a research hotspot [25,26,27]. Du et al. [25] prepared porous Sn-doped TiO2 using polystyrene microspheres as a template. After calcination to remove the template, the porous structure was fabricated and the surface area reached 71.1 m2/g. Huang et al. [26] used a sol–gel method combined with a hydrothermal method to prepare TiO2 microspheres by a two-step reaction. The diameter of the microspheres was about 200–500 nm and the surface area was 91.1 m2/g. TiO2 nanospheres with diameter of 50–100 nm and surface area of 70.0 m2/g were fabricated by hydrothermal method in Mohamed et al.’s work [27]. In the present study, TiO2-12 h exhibits a relatively large surface area (145.3 m2/g), which may result in high photocatalytic activity.

3.3. Optical Property

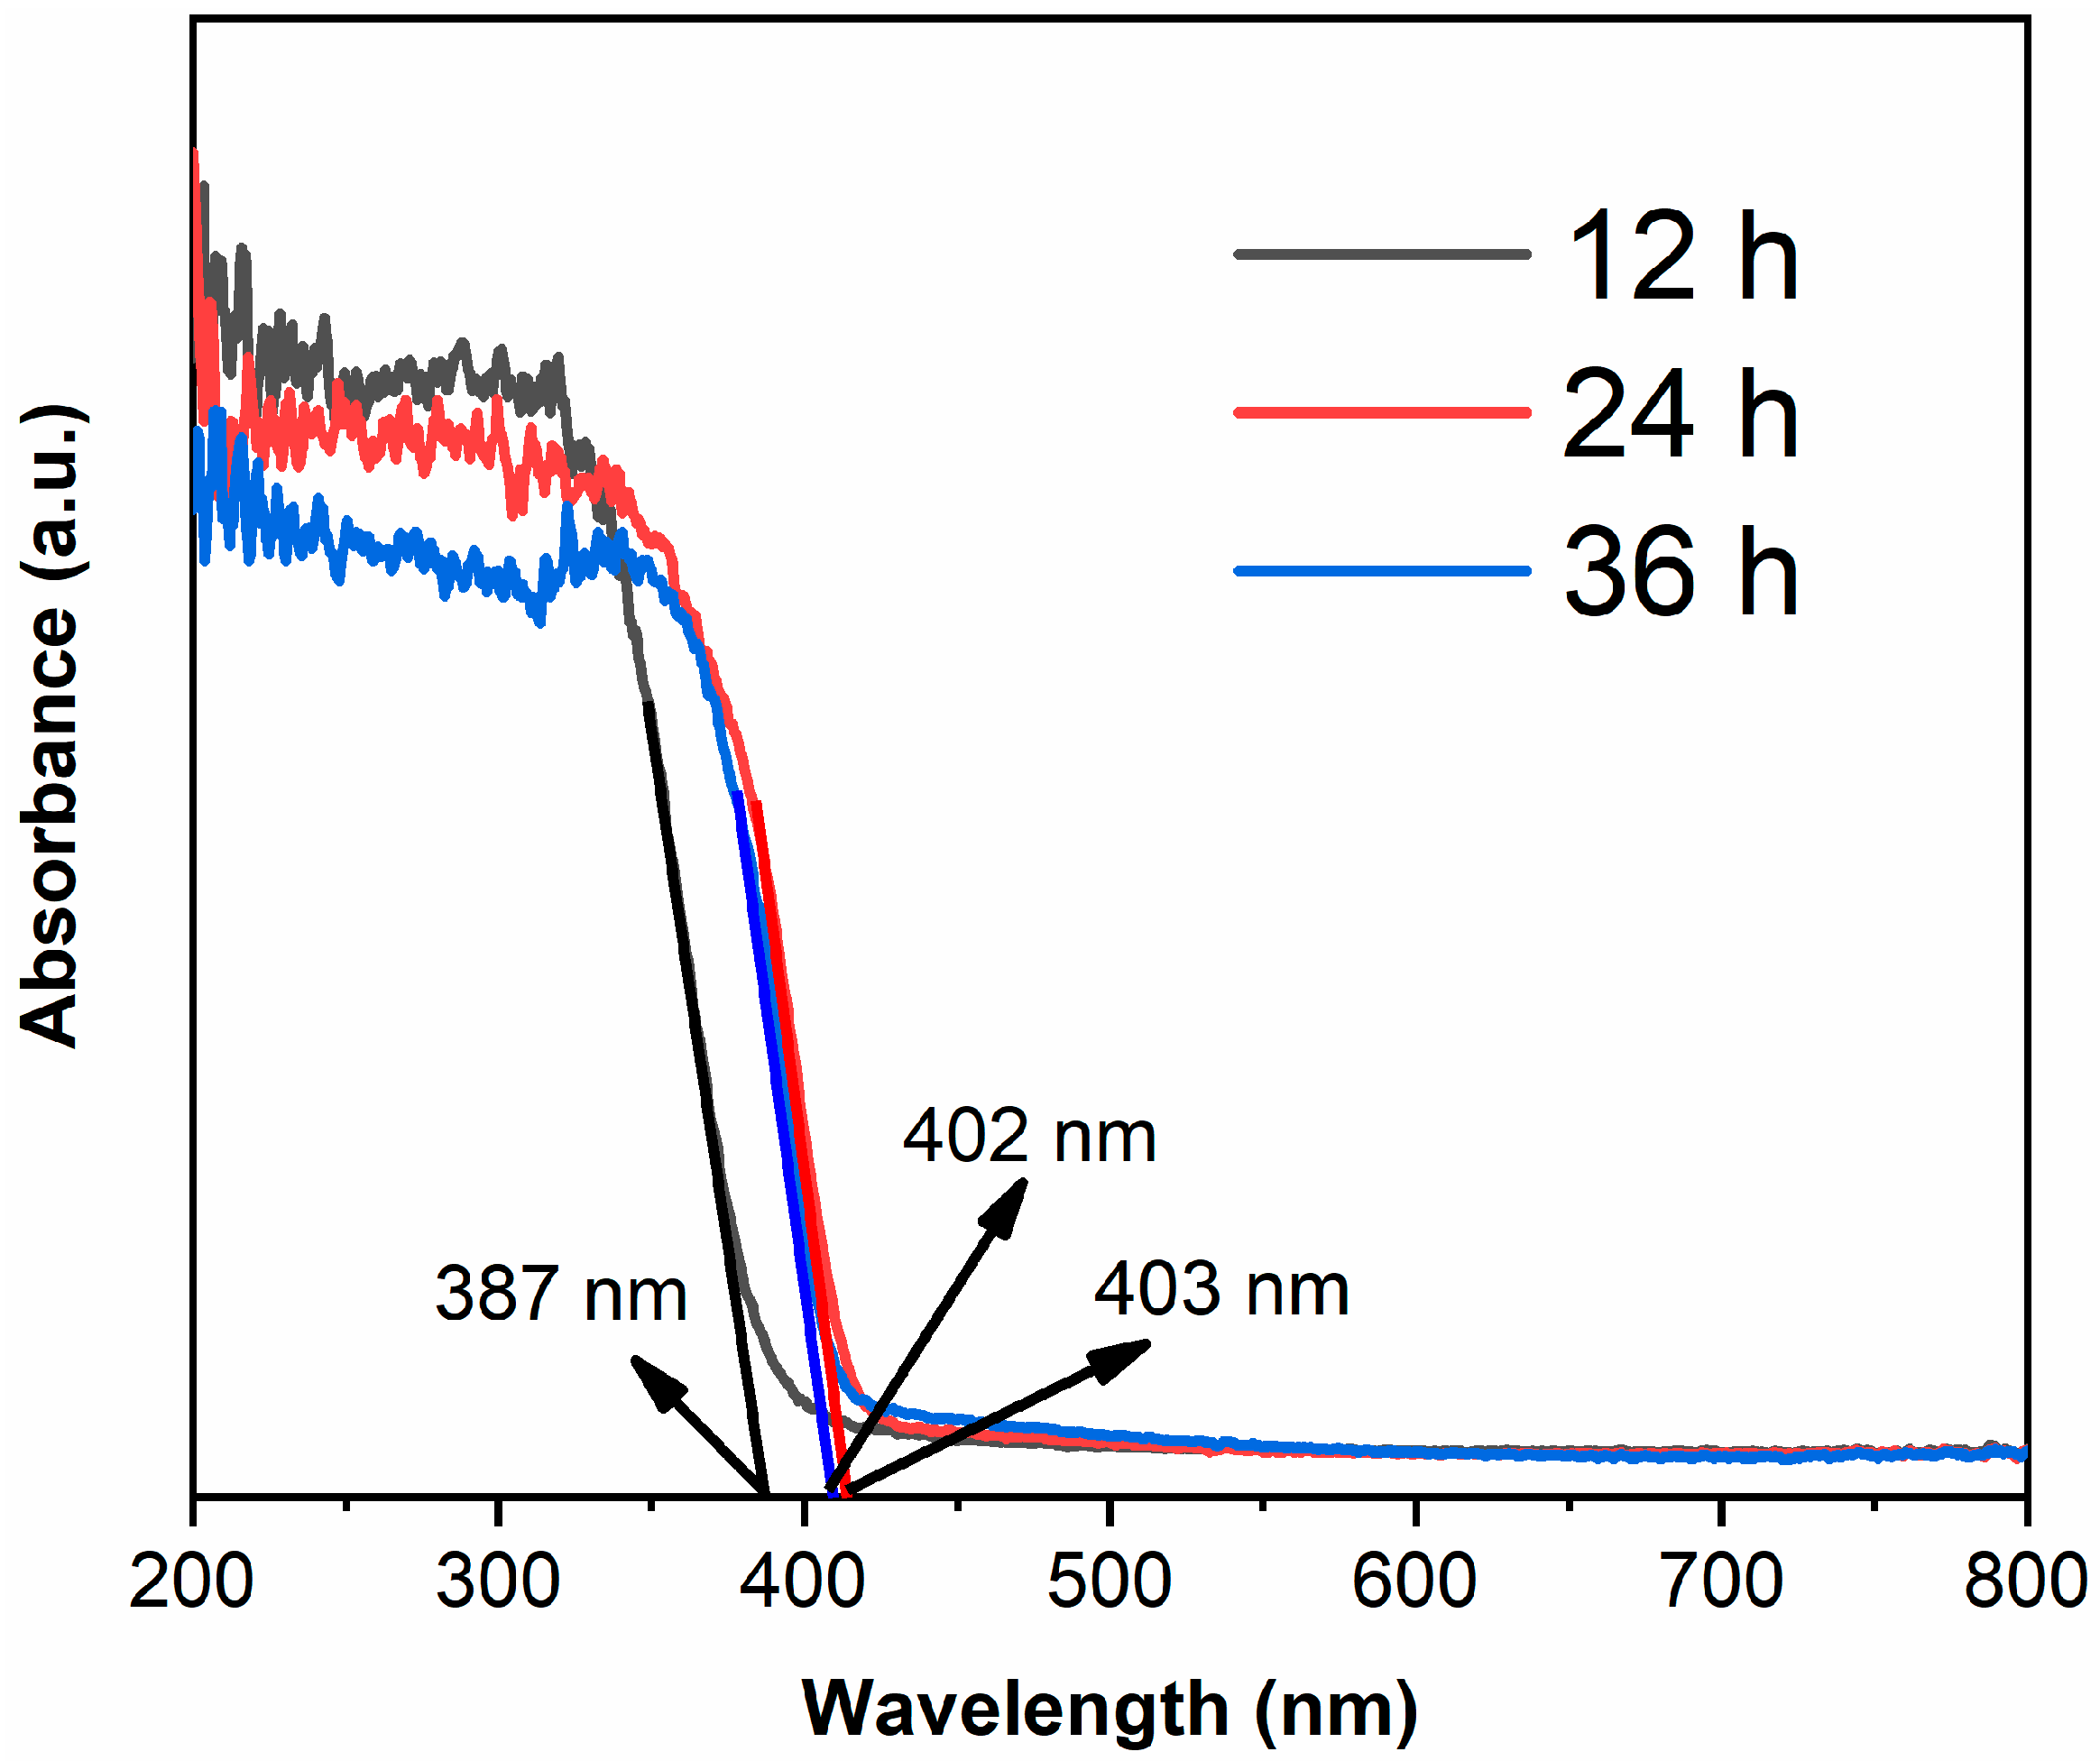
Figure 5 shows the UV-visible absorption spectra of samples. The absorption edge of TiO2-12 h is 387 nm [28,29], which corresponds to anatase structure. The absorption edges are 403 and 402 nm for TiO2-24 h and TiO2-36 h, respectively. The band gap of rutile is smaller than anatase, thus TiO2-24 h and TiO2-36 h, which mainly consist of rutile, show red shift compared to TiO2-12 h.
The PL peaks are derived from the recombination of photogenerated electrons and holes, thus the lower peak intensity and the lower recombination rate [30,31]. The PL spectra of samples are shown in Figure 6. It is generally believed that the recombination rate of anatase is lower than rutile [32,33], however, the PL peak intensity of TiO2-12 h is the highest in the present work. XRD results show that the peak intensity of TiO2-12 h is low and the half-height width of peak is large, indicating that TiO2-12 h displays poor crystallinity with plentiful defects and oxygen vacancies. Photoinduced charges will be captured by defects and oxygen vacancies, which is in favor of retarding the recombination. However, excess defects or oxygen vacancies will introduce new recombination centers, enhancing the PL peak intensity [34]. With the increase in hydrothermal time, the crystallinity of the sample improves and the defects and oxygen vacancies reduce. Moderate defects and oxygen vacancies are beneficial to the separation of photogenerated electrons and holes [35,36]. Therefore, the PL peak intensity of TiO2-24 h and TiO2-36 h is lower than TiO2-12 h.
The PL main peak originates from photogenerated electrons in the conduction band returning directly to the valence band and recombining with holes, therefore, the wavelength corresponding to main peak in PL spectra is related to the band gap [37,38]. The main peak wavelengths of TiO2-12 h, TiO2-24 h and TiO2-36 h are 400, 415 and 415 nm, which are right shifted about 13 nm compared to their absorption edges due to the Stokes shift [39,40].

3.4. Photocatalytic Activity

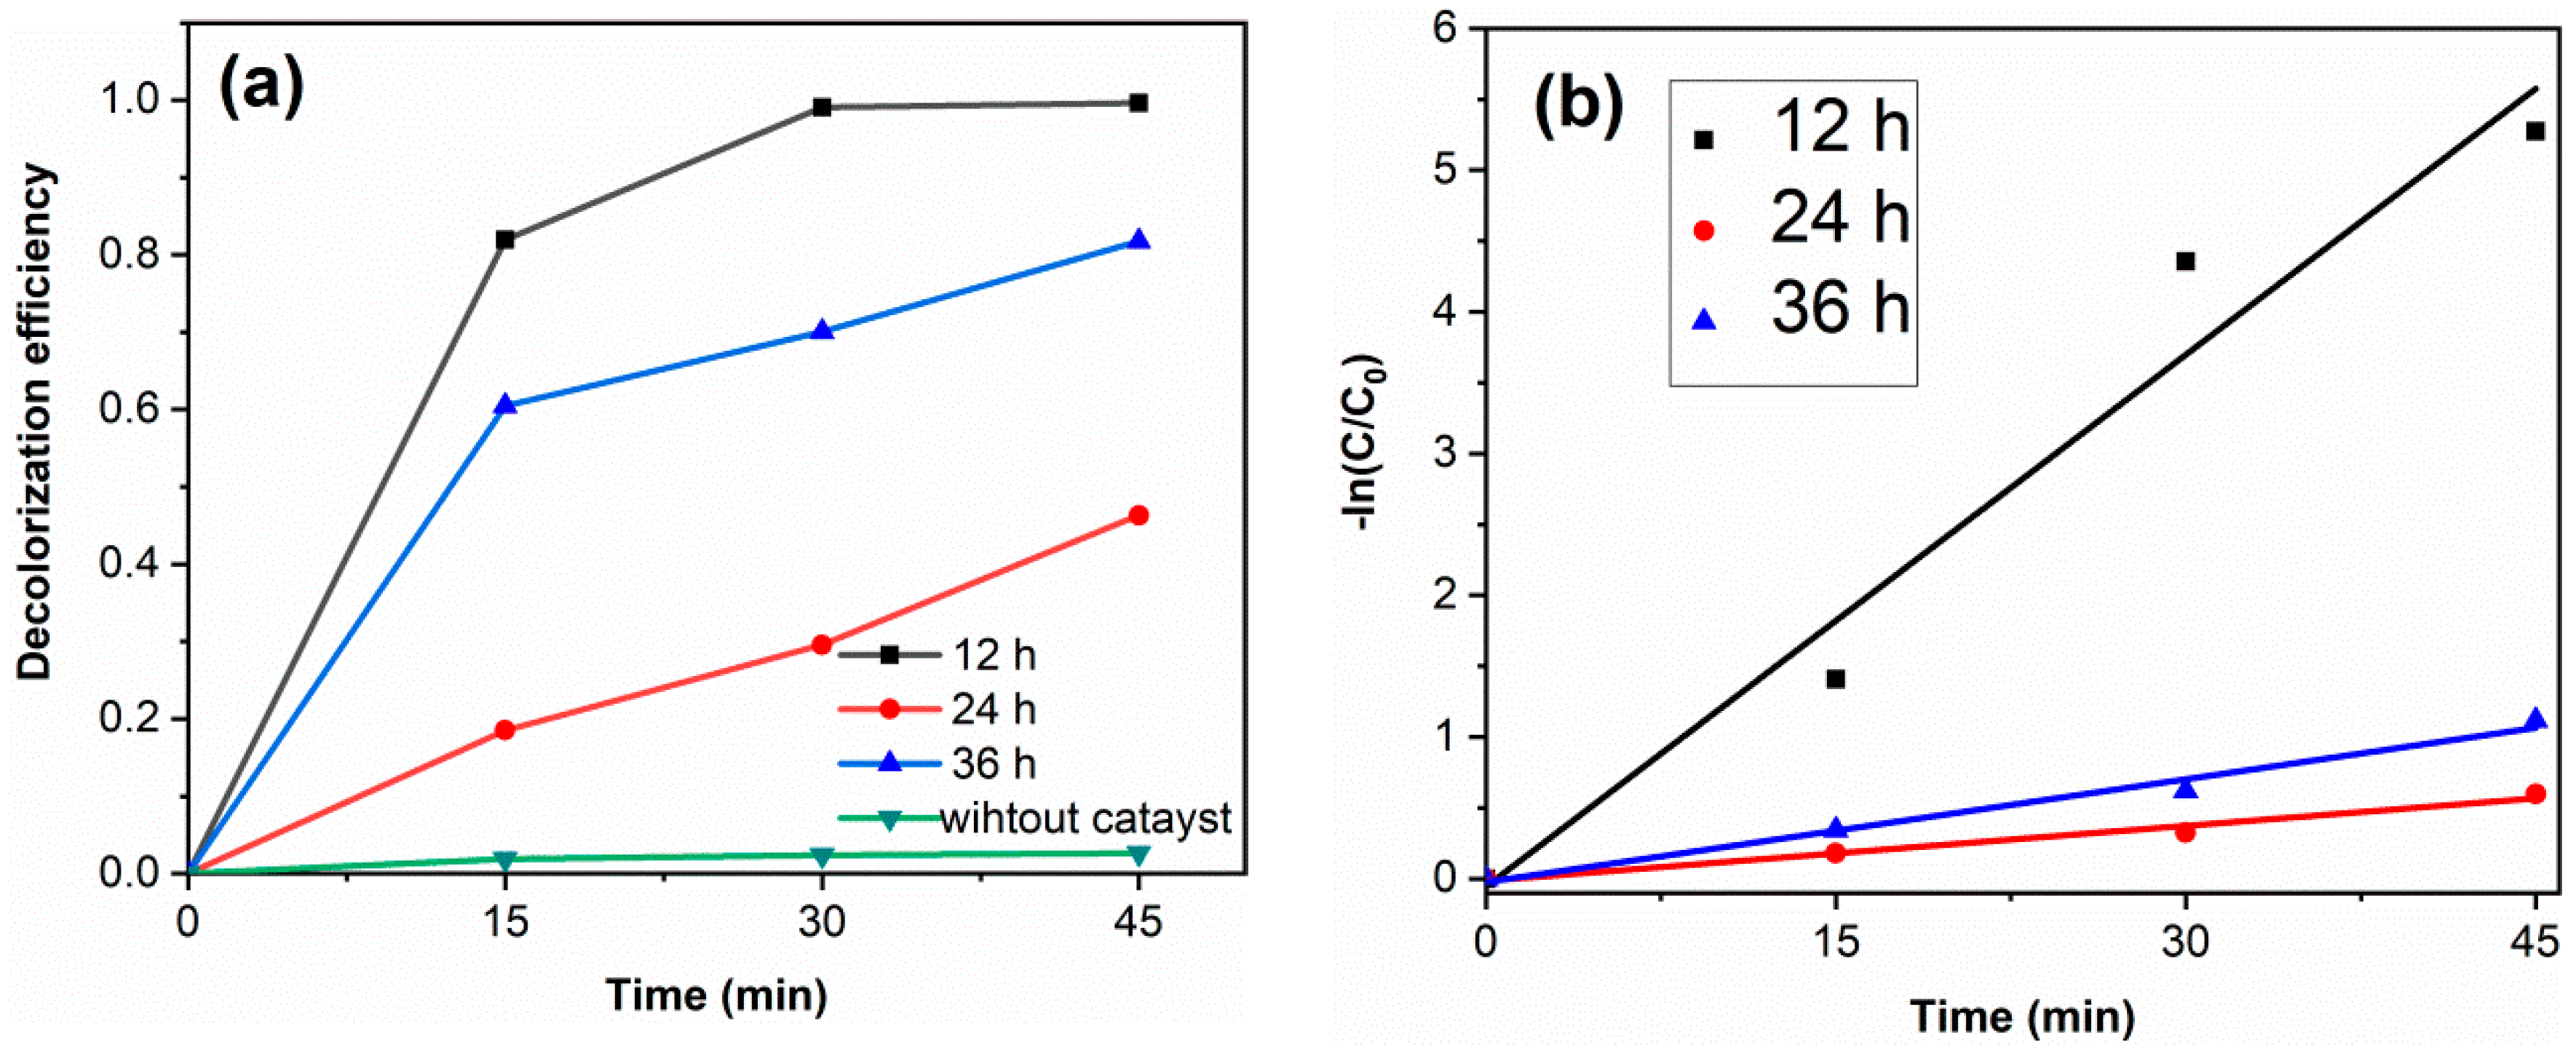
Figure 7a shows the RhB decolorization curves of samples. Without catalyst, the decolorization degree of RhB is 2.6%, which indicates that the decolorization of RhB is mainly due to the degradation of photocatalysts. The decolorization degrees of TiO2-12 h, TiO2-24 h and TiO2-36 h are 99.6, 46.3 and 81.8% after 45 min. Figure 7b displays the kinetics fitting curves of samples. The apparent first-order rate constants k of TiO2-12 h, TiO2-24 h and TiO2-36 h are 0.125, 0.013 and 0.024 min−1, respectively. TiO2-12 h shows the highest photocatalytic activity. Although PL spectra and DRS spectra show that TiO2-24 h and TiO2-36 h exhibit a lower photogenerated charge recombination rate and higher visible light absorption, their photocatalytic activity is lower than that of TiO2-12 h yet. Morphology and BET results show that TiO2-12 h is composed of fine particles and possesses a relatively high surface area (145.3 m2/g), which is much higher than TiO2-24 h (43.0 m2/g) and TiO2-36 h (13.3 m2/g). A high surface area provides more reactive sites, thus TiO2-12 h shows the highest photocatalytic activity. Several RhB decolorization data reported by literatures via hydrothermal method are summarized in Table 2.
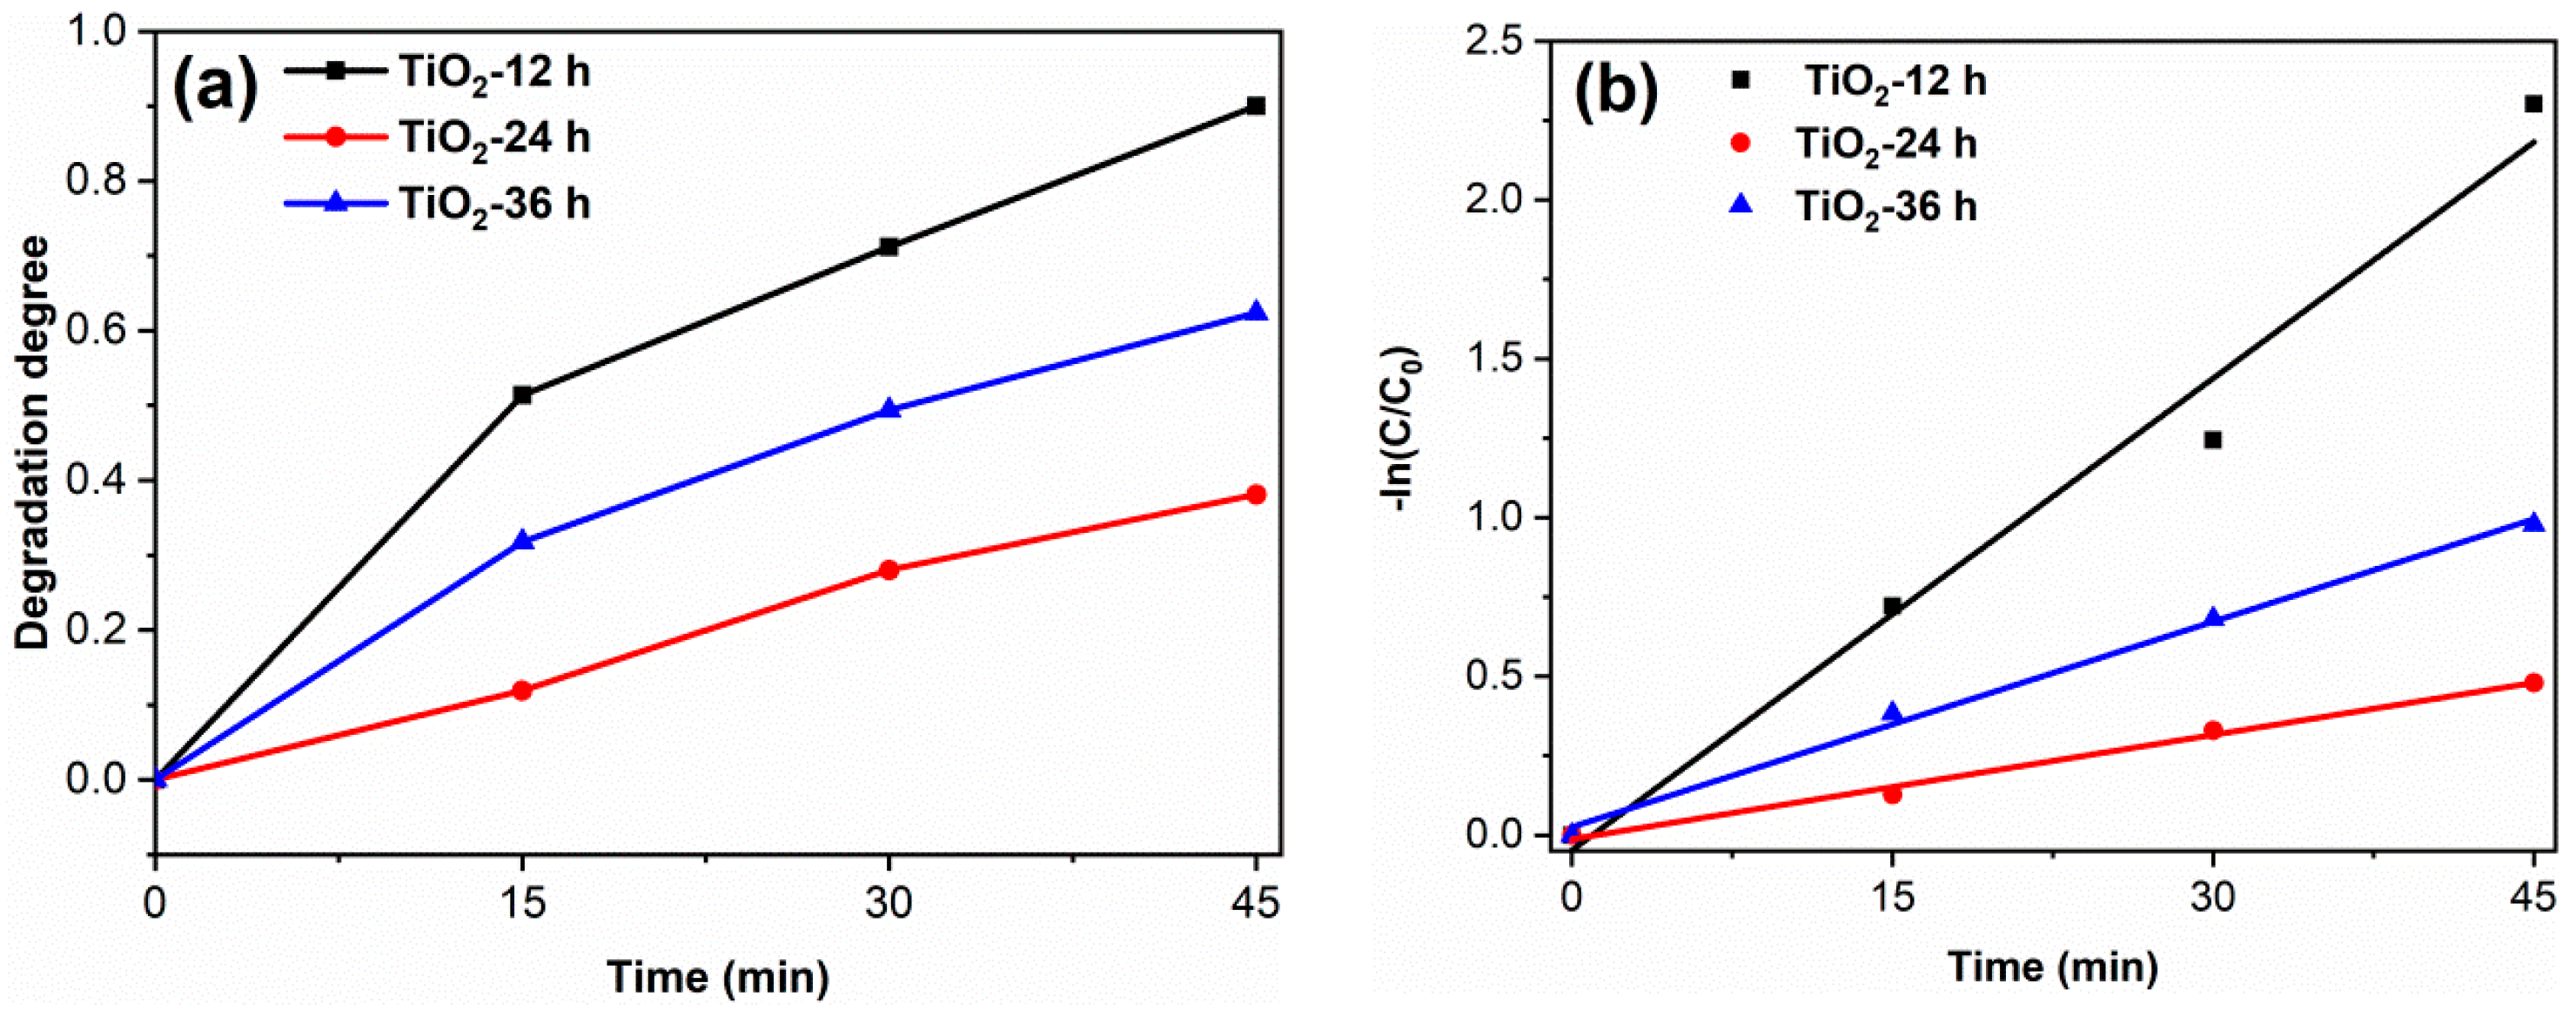
To study the degradation effect of the prepared photocatalyst on pharmaceutical waste, tetracycline hydrochloride (TC) was selected as the target pollutant. The results are shown in Figure 8. The degradation degree of TiO2-12 h, TiO2-24 h and TiO2-36 h are 90.0, 39.1 and 62.4%. The apparent first-order rate constants k of TiO2-12 h, TiO2-24 h and TiO2-36 h are 0.050, 0.011 and 0.022 min−1, respectively. The photodegradation results of RhB and TC confirm that TiO2-12 h is an efficient photocatalyst, which shows potential application prospects in the field of dye wastewater and pharmaceutical wastewater.

3.5. Photocatalytic Mechanism

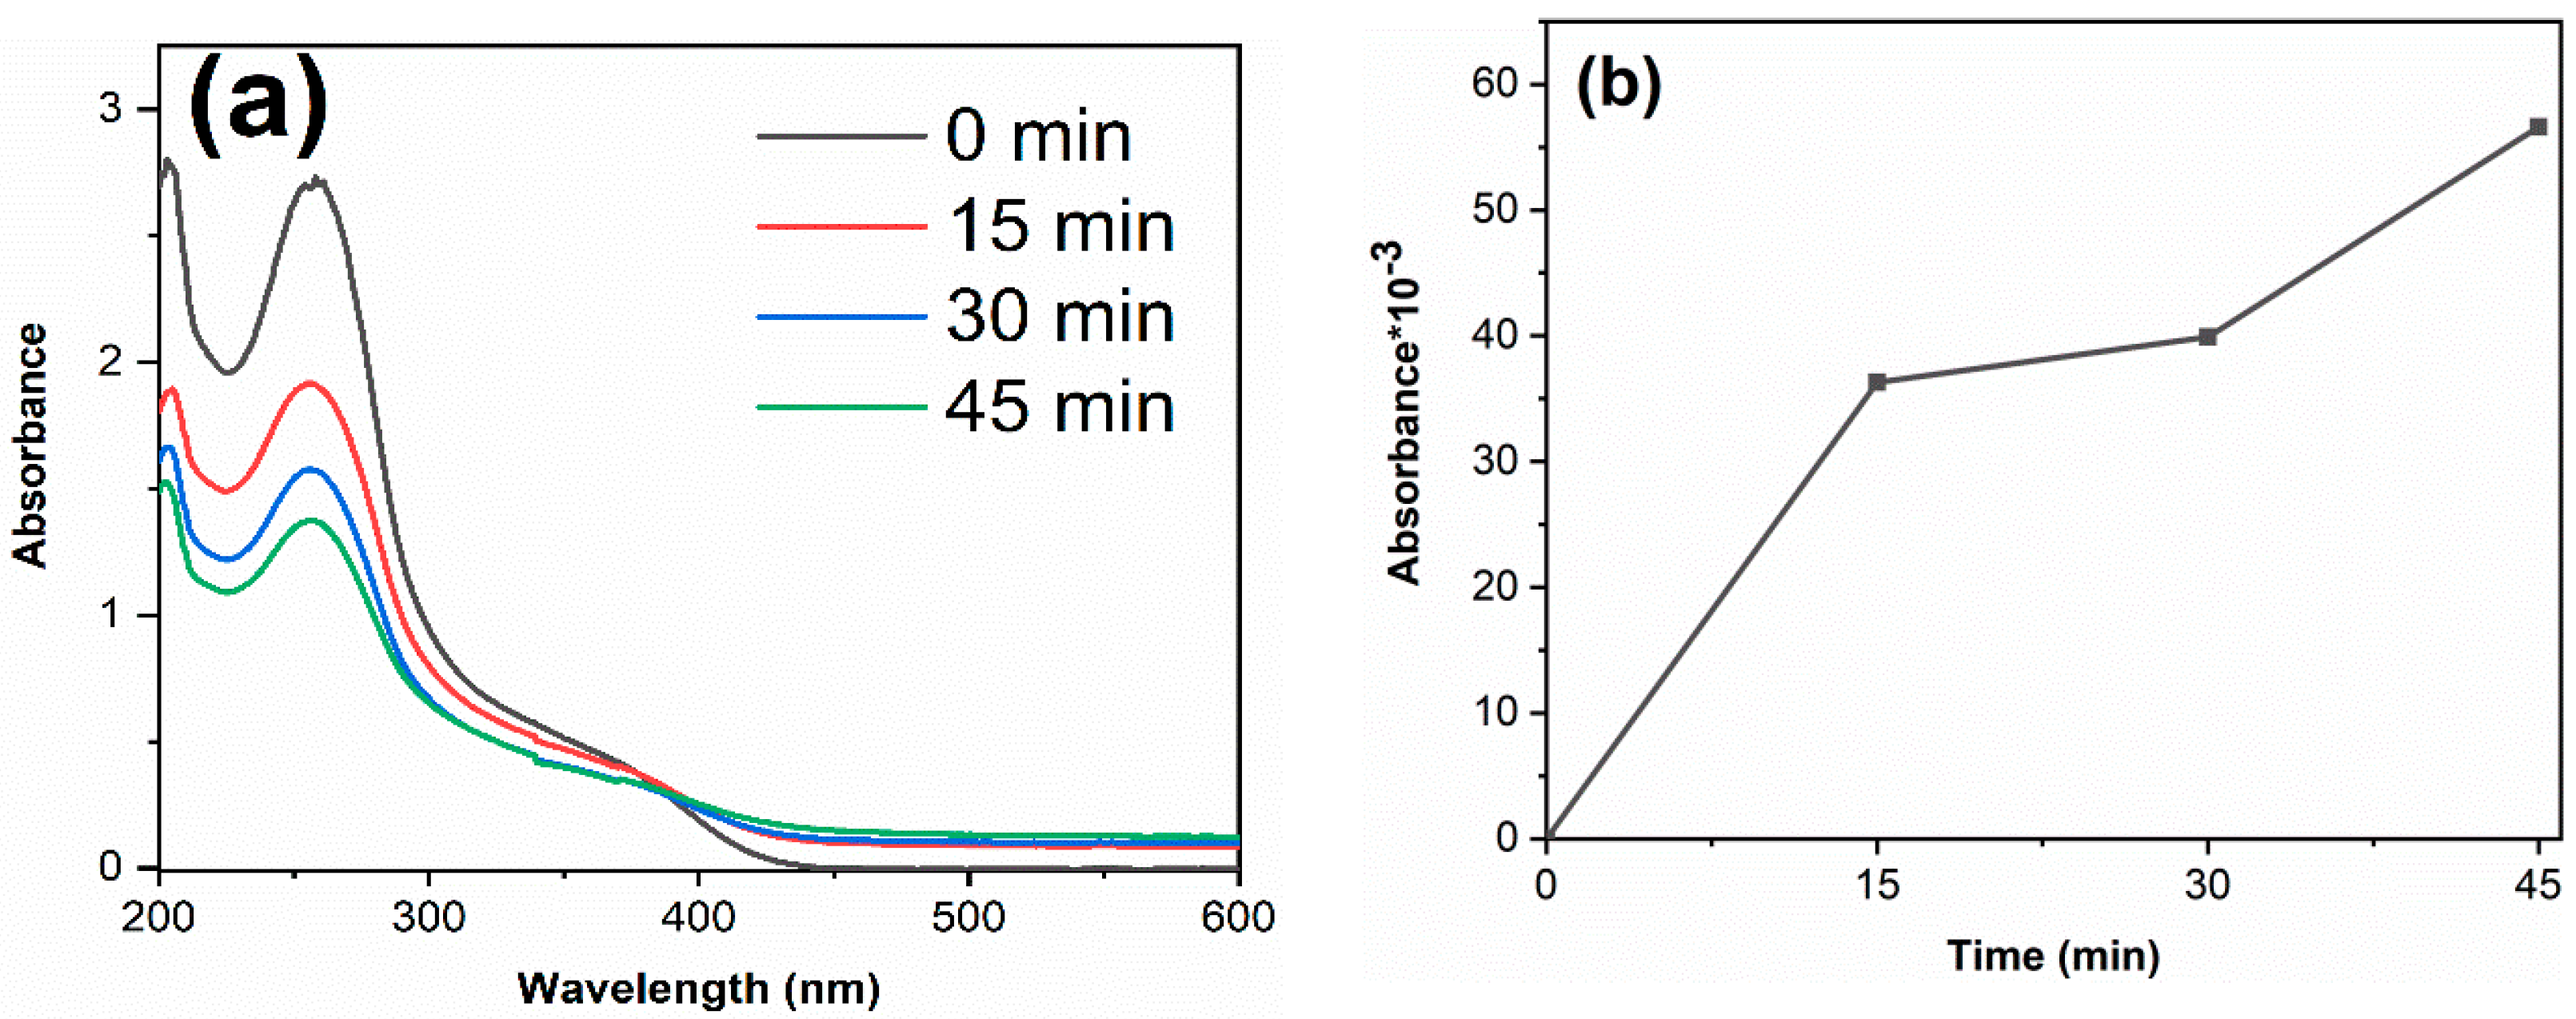
To verify the free radicals generated during the photocatalytic reaction, nitro-blue tetrazolium (NBT) and salicylic acid (SA) tests were carried out on TiO2-12 h sample. The detailed processes of NBT and SA experiments are as follows: Add 0.1 g TiO2-12 h powder into 100 mL NBT solution (0.05 mmol/L) and 100 mL SA solution (0.02 mol/L), respectively, keep stirring, and test their absorbance every 15 min after light irradiation. The results are shown in Figure 9. The photoinduced electrons are excited to conduction band and react with O2 to produce O2 radicals, which further react with NBT. SA react with ·OH radicals, forming 2,3-HBA. Therefore, the decrease in NBT absorbance and the increased 2,3-HBA absorbance suggest that O2 and ·OH radicals are generated under irradiation [48,49].
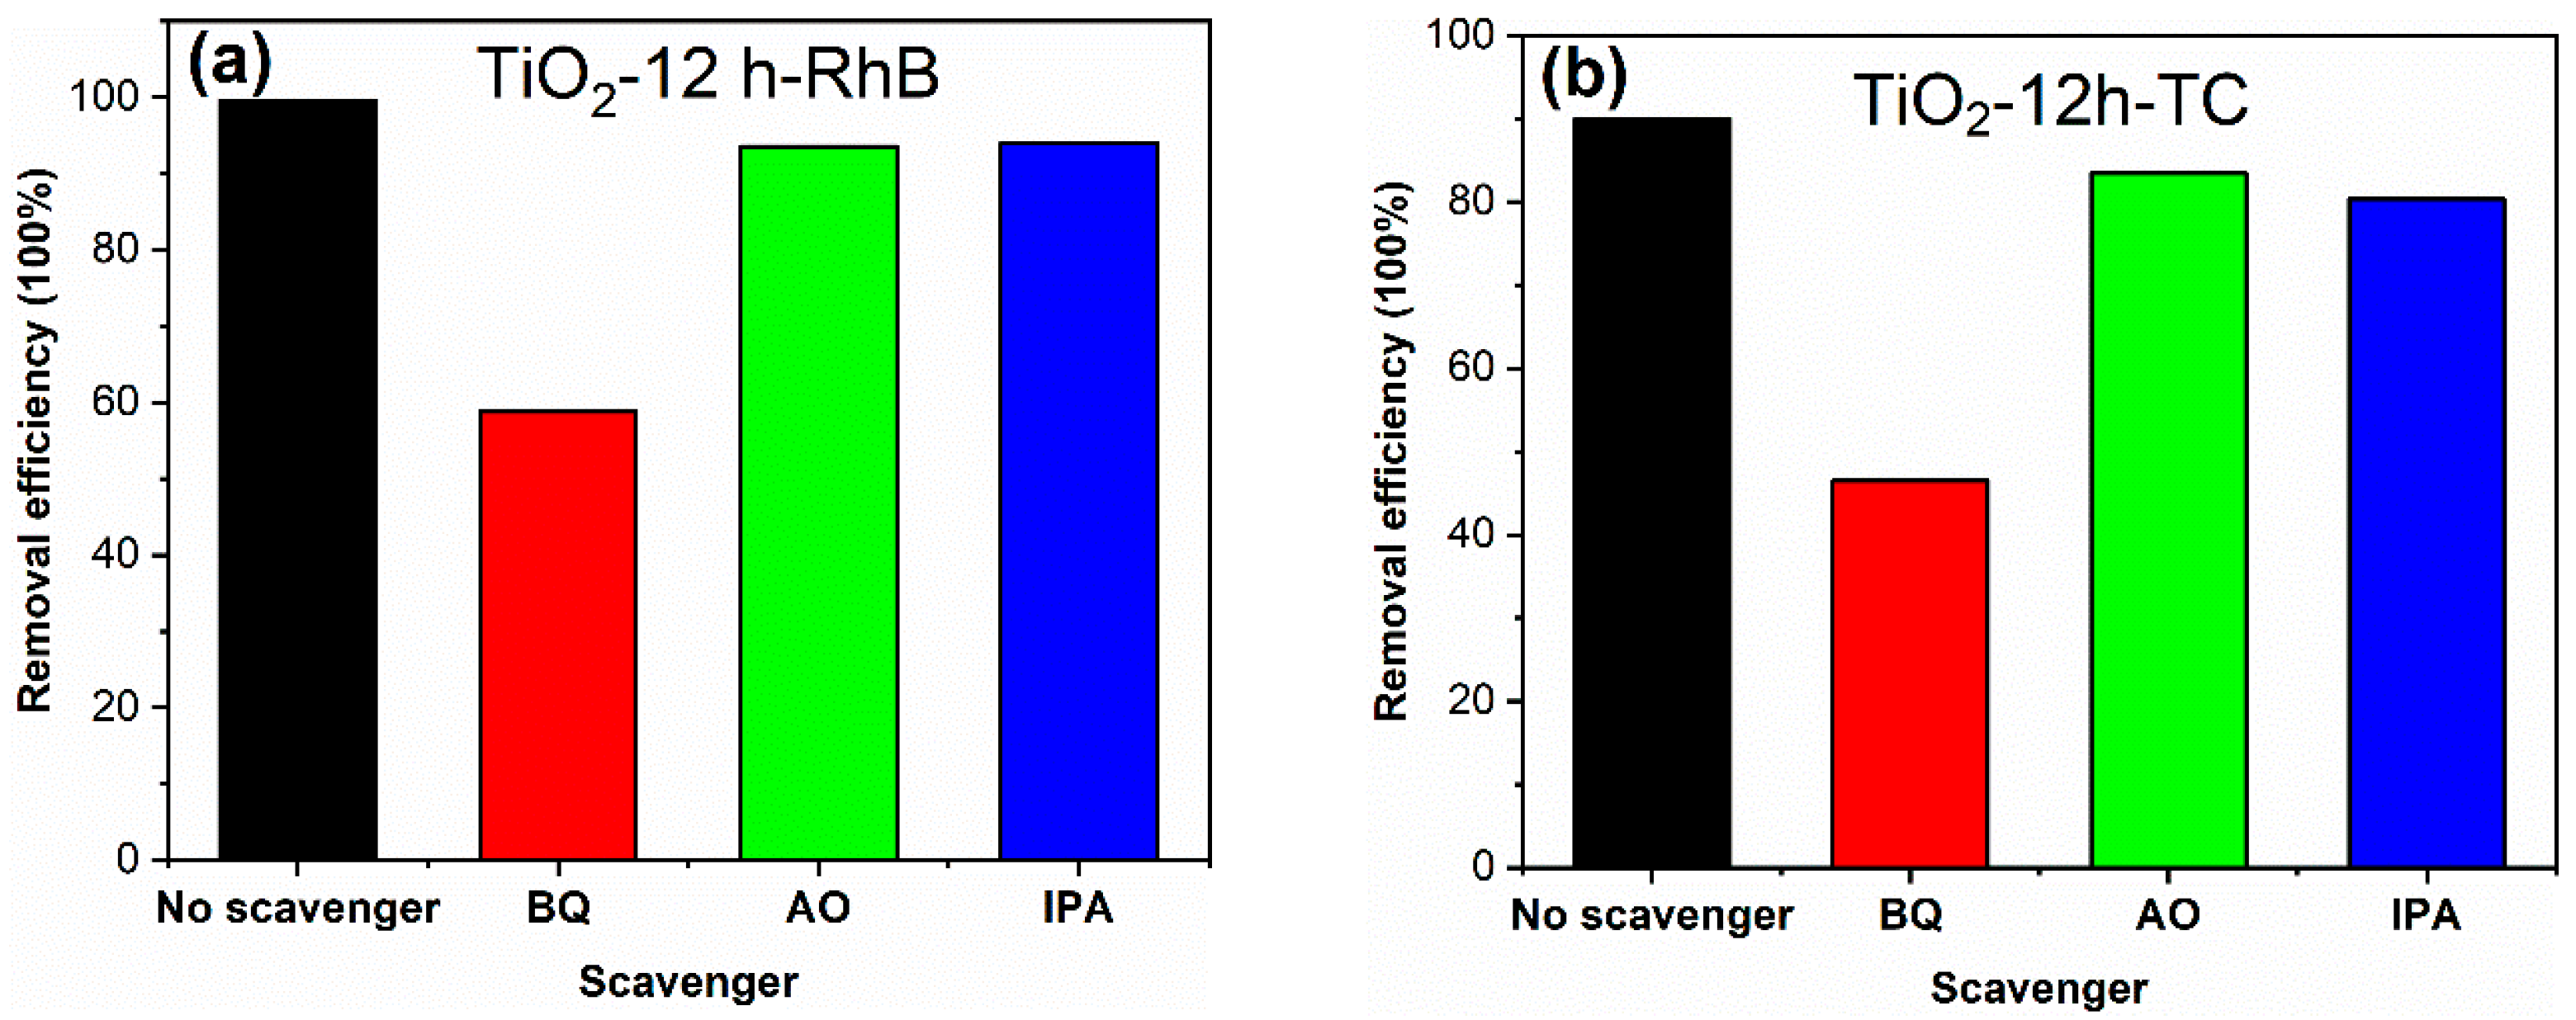
The active species in photocatalytic reaction process were investigated through adding benzoquinone (BQ), ammonium oxalate (AO) and isopropanol (IPA) as scavengers. The detailed processes of active species experiments are as follows: in the photocatalytic experiment, 2 mL (0.1 mol/L) BQ, AO and IPA solutions were added, respectively, keeping other test conditions unchanged. The results are shown in Figure 10. The decolorization degree of RhB for TiO2-12 h declines from 99.6 to 58.8, 93.6 and 94.0% in the presence of BQ, AO and IPA, respectively. Meanwhile, The degradation degree of TC for TiO2-12 h declines from 90.0 to 46.5, 83.4 and 80.3% in the presence of BQ, AO and IPA. Since BQ, AO and IPA capture ·O2, h+ and OH species, it can be concluded that O2 radicals are the main active groups in the degradation process, and h+ and OH radicals play a secondary role.

4. Conclusions

In summary, the influences of hydrothermal time on the structure and photocatalytic performance of TiO2 were studied systematically. TiO2-12 h forms anatase, TiO2-24 h forms anatase/rutile mixed crystal, and TiO2-36 h forms rutile. As the hydrothermal time increases, TiO2 gradually transforms from fine particles to lumps and the surface area decreases. TiO2-24 h and TiO2-36 h show a lower photogenerated charge recombination rate and higher visible light absorption, however, their photocatalytic activities are lower than that of TiO2-12 h, which can be attributed to the relatively high surface area (145.3 m2/g) of TiO2-12 h. Active species tests confirm that·O2 radicals are the main active groups in the degradation process.

Author Contributions

Design, M.T. and X.Z.; Experiment, Y.X., D.Y. and J.L.; Writing, M.T. and X.Z.; Supervision, X.Z. and R.T. All authors have read and agreed to the published version of the manuscript.

Funding

This research was funded by the Training Program for Innovation of Chengdu University grant number: CDU-CX-2021527 and S202011079053.

Informed Consent Statement

Not applicable.

Data Availability Statement

Data is contained within the article.

Conflicts of Interest

There are no conflict to declare.

References

  1. Chen, Y.; Xiang, Z.; Wang, D.; Kang, J.; Qi, H. Effective photocatalytic degradation and physical adsorption of methylene blue using cellulose/GO/TiO2 hydrogels. RSC Adv. 2020, 10, 23936–23943. [Google Scholar] [CrossRef]
  2. Sun, Y.; Liu, E.D.; Zhu, L.; Wen, Y.; Tan, Q.W.; Feng, W. Influence of annealing temperature of TiO2 nanotubes via hydrothermal method on Ti foll for photocatalytic degradation. Dig. J. Nanomater. Bios. 2019, 14, 463–470. [Google Scholar]
  3. Lin, X.; Rong, F.; Fu, D.; Yuan, C. Enhanced photocatalytic activity of fluorine doped TiO2 by loaded with Ag for degradation of organic pollutants. Powder Technol. 2012, 219, 173–178. [Google Scholar] [CrossRef]
  4. Li, X.; Xiong, J.; Huang, J.; Feng, Z.; Luo, J. Novel g-C3N4/h’ZnTiO3-a’TiO2 direct Z-scheme heterojunction with significantly enhanced visible-light photocatalytic activity. J. Alloys Compd. 2019, 774, 768–778. [Google Scholar] [CrossRef]
  5. Chen, J.F.; Zhang, X.D.; Shi, X.Y.; Bi, F.K.; Yang, Y.; Wang, Y.X. Synergistic effects of octahedral TiO2-MIL-101(Cr) with two heterojunctions for enhancing visible-light photocatalytic degradation of liquid tetracycline and gaseous toluene. J. Colloid. Interface. Sci. 2020, 579, 37–49. [Google Scholar] [CrossRef] [PubMed]
  6. Zhu, X.; Zhu, R.; Pei, L.; Liu, H.; Xu, L.; Wang, J.; Feng, W.; Jiao, Y.; Zhang, W.M. Fabrication, characterization, and photocatalytic activity of anatase/rutile/SnO2 nanocomposites. J. Mater. Sci. Mater. Electron. 2019, 24, 21210–21218. [Google Scholar] [CrossRef]
  7. Fouzia, A.; Rabah, B. The influence of doping lead and annealing temperature on grown of nanostructures of TiO2 thin films prepared by a sol-gel method. Mater. Sci. Eng. B 2021, 265, 114982. [Google Scholar] [CrossRef]
  8. Ouerghi, O.; Geesi, M.H.; Ibnouf, E.O.; Ansari, M.J.; Alam, P.; Elsanousi, A.; Kaiba, A.; Riadi, Y. Sol-gel synthesized rutile TiO2 nanoparticles loaded with cardamom essential oil: Enhanced antibacterial activity. J. Drug. Deliv. Sci. Tec. 2021, 64, 102581. [Google Scholar] [CrossRef]
  9. Kumar, V.; Sharma, D.K. Fabrication of dimensional hydrophilic TiO2 nanostructured surfaces by hydrothermal method. Mater. Today 2021, 46, 2171–2174. [Google Scholar]
  10. Zhang, M.; Wang, W.; Wu, C.; Wang, P.; Ru, H.Q. Rapid fabrication of TiO2 nanobelts with controllable crystalline structure by microwave-assisted hydrothermal method and their photocatalytic activity. Ceram. Int. 2019, 45, 22558–22563. [Google Scholar] [CrossRef]
  11. Li, R.; Li, W.; Jin, C.; He, Q.; Wang, Y. Fabrication of ZIF-8@TiO2 micron composite via hydrothermal method with enhanced absorption and photocatalytic activities in tetracycline degradation. J. Alloys Compd. 2020, 825, 154008. [Google Scholar] [CrossRef]
  12. Cruz, M.A.; Sanchez-Martinez, D.; Torres-Martínez, L.M. TiO2 Nanorods grown by hydrothermal method and their photocatalytic activity for hydrogen production. Mater. Lett. 2018, 237, 310–313. [Google Scholar] [CrossRef]
  13. Zhu, X.; Wen, G.; Liu, H.; Han, S.; Chen, S.; Kong, Q.; Feng, W. One-step hydrothermal synthesis and characterization of Cu-doped TiO2 nanoparticles/nanobucks/nanorods with enhanced photocatalytic performance under simulated solar light. J. Mater. Sci. Mater. Electron. 2019, 30, 13826–13834. [Google Scholar] [CrossRef]
  14. Liu, N.; Chen, X.; Zhang, J.; Schwank, J.W. A review on TiO2 -based nanotubes synthesized via hydrothermal method: Formation mechanism, structure modification, and photocatalytic applications. Catal. Today 2014, 225, 34–51. [Google Scholar] [CrossRef]
  15. Najafi, M.; Kermanpur, A.; Rahimipour, M.R.; Najafizadeh, A. Effect of TiO2 morphology on structure of TiO2 -graphene oxide nanocomposite synthesized via a one-step hydrothermal method. J. Alloys Compd. 2017, 722, 272–277. [Google Scholar] [CrossRef]
  16. Esparza, P.; Hernández, T.; Borges, M.E.; Álvarez-Galván, M.C.; Ruiz-Morales, J.C.; Fierro, J.L.G. TiO2 modifications by hydrothermal treatment and doping to improve its photocatalytic behaviour under visible light. Catal. Today 2013, 210, 135–141. [Google Scholar] [CrossRef]
  17. Barrocas, B.; Monteiro, O.C.; Nunes, M.R.; Silvestre, A.J. Influence of Re and Ru doping on the structural, optical and photocatalytic properties of nanocrystalline TiO2. SN Appl. Sci. 2019, 1, 556. [Google Scholar] [CrossRef] [Green Version]
  18. Nešić, J.; Manojlović, D.D.; Anđelković, I.; Dojčinović, B.P.; Vulić, P.J.; Krstić, J.; Roglić, G.M. Preparation, characterization and photocatalytic activity of lanthanum and vanadium co-doped mesoporous TiO2 for azo-dye degradation. J. Mol. Catal. A-Chem. 2013, 378, 67–75. [Google Scholar] [CrossRef] [Green Version]
  19. Lee, D.-S.; Lee, S.-Y.; Rhee, K.; Park, S.-J. Effect of hydrothermal temperature on photocatalytic properties of TiO2 nanotubes. Curr. Appl. Phys. 2014, 14, 415–420. [Google Scholar] [CrossRef]
  20. Mamaghani, A.H.; Haghighat, F.; Lee, C.S. Systematic variation of preparation time, temperature, and pressure in hydrothermal synthesis of macro-/mesoporous TiO2 for photocatalytic air treatment. J. Photochem. Photobiol. A 2019, 378, 156–170. [Google Scholar] [CrossRef]
  21. HLi, H.; Shen, X.; Liu, Y.; Wang, L.; Lei, J.; Zhang, J.L. Facile phase control for hydrothermal synthesis of anatase-rutile TiO2 with enhanced photocatalytic activity. J. Alloys Compd. 2015, 646, 380–386. [Google Scholar]
  22. Nguyen-Phan, T.-D.; Pham, H.-D.; Cuong, T.V.; Kim, E.J.; Kim, S.; Shin, E.W. A simple hydrothermal preparation of TiO2 nanomaterials using concentrated hydrochloric acid. J. Cryst. Growth 2009, 312, 79–85. [Google Scholar] [CrossRef]
  23. Alves, A.K.; Berutti, F.A.; Bergmann, C.P. Visible and UV photocatalytic characterization of Sn–TiO2 electrospun fibers. Catal. Today 2013, 208, 7–10. [Google Scholar] [CrossRef]
  24. Khatun, N.; Rajput, P.; Bhattacharya, D.; Jha, S.N.; Biring, S.; Sen, S. Anatase to rutile phase transition promoted by vanadium substitution in TiO2: A structural, vibrational and optoelectronic study. Ceram. Int. 2017, 43, 14128–14134. [Google Scholar] [CrossRef]
  25. Du, J.; Zhao, G.; Pang, H.; Qian, Y.; Liu, H.; Kang, D.J. A template method for synthesis of porous Sn-doped TiO2 monolith and its enhanced photocatalytic activity. Mater. Lett. 2013, 93, 419–422. [Google Scholar] [CrossRef]
  26. Huang, W.C.; Ting, J.M. Novel nitrogen-doped anatase TiO2 mesoporous bead photocatalysts for enhanced visible light response. Ceram. Int. 2017, 43, 9992–9997. [Google Scholar] [CrossRef]
  27. Mohamed, R.; Aazam, E. Effect of Sn loading on the photocatalytic aniline synthesis activity of TiO2 nanospheres. J. Alloys Compd. 2014, 595, 8–13. [Google Scholar] [CrossRef]
  28. Adyani, S.M.; Ghorbani, M. A comparative study of physicochemical and photocatalytic properties of visible light responsive Fe, Gd and P single and tri-doped TiO2 nanomaterials. J. Rare Earths 2018, 36, 72–85. [Google Scholar] [CrossRef]
  29. Sood, S.; Umar, A.; Mehta, S.K.; Kansal, S.K. Highly effective Fe-doped TiO2 nanoparticles photocatalysts for visible-light driven photocatalytic degradation of toxic organic compounds. J. Colloid Interface Sci. 2015, 450, 213–223. [Google Scholar] [CrossRef] [PubMed]
  30. Liu, J.; Han, L.; An, N.; Xing, L.; Ma, H.; Cheng, L.; Yang, J.; Zhang, Q. Enhanced visible-light photocatalytic activity of carbonate-doped anatase TiO2 based on the electron-withdrawing bidentate carboxylate linkage. Appl. Catal. B: Environ. 2017, 202, 642–652. [Google Scholar] [CrossRef]
  31. Bian, Z.; Zhu, J.; Cao, F.; Lu, Y.; Li, H. In situ encapsulation of Au nanoparticles in mesoporous core–shell TiO2 microspheres with enhanced activity and durability. Chem. Commun. 2009, 25, 3789. [Google Scholar] [CrossRef]
  32. Jing, L.Q.; Sun, X.J.; Xin, B.F.; Wang, B.Q.; Cai, W.M.; Fu, H.G. The preparation and characterization of La doped TiO2 nanoparticles and their photocatalytic activity. J. Solid State Chem. 2004, 177, 3375–3382. [Google Scholar]
  33. Golubović, A.; Šćepanović, M.; Kremenovic, A.; Aškrabić, S.; Berec, V.; Dohčević-Mitrović, Z.; Popović, Z.V. Raman study of the variation in anatase structure of TiO2 nanopowders due to the changes of sol–gel synthesis conditions. J. Sol.-Gel Sci. Technol. 2009, 49, 311–319. [Google Scholar] [CrossRef]
  34. Aghamalyan, N.R.; Gambaryan, I.A.; Goulanian, E.K.; Hovsepyan, R.K.; Kostanyan, R.B.; Petrosyan, S.I.; Vardanyan, E.S.; Zerrouk, A.F. Influence of thermal annealing on optical and electrical properties of ZnO films prepared by electron beam evaporation. Semicond. Sci. Technol. 2003, 18, 525–529. [Google Scholar] [CrossRef]
  35. Ali, Z.; Shah, A.; Ali, Z.; Mahmood, A. Influence of Cu modified surface states by sol gel Technique on Photocatalytic Activity of Titanium dioxide. Mater. Chem. Phys. 2020, 249, 123169. [Google Scholar] [CrossRef]
  36. Chen, H.; Xu, Y. Cooperative effect between cation and anion of copper phosphate on the photocatalytic activity of TiO2 for phenol degradation in aqueous suspension. J. Phys. Chem. C 2012, 116, 24582–24589. [Google Scholar] [CrossRef]
  37. Fan, X.; Wan, J.; Liu, E.; Sun, L.; Hu, Y.; Li, H.; Hu, X.Y.; Fan, J. High-efficiency photoelectrocatalytic hydrogen generation enabled by Ag deposited and Ce doped TiO2 nanotube arrays. Ceram. Int. 2015, 41, 5107–5116. [Google Scholar] [CrossRef]
  38. Lei, X.F.; Xue, X.X.; Yang, H. Preparation and characterization of Ag-doped TiO2 nanomaterials and their photocatalytic reduction of Cr(VI) under visible light. Appl. Surf. Sci. 2014, 321, 396–403. [Google Scholar] [CrossRef]
  39. Khaidukov, N.M.; Makhov, V.N.; Zhang, Q.; Shi, R.; Liang, H.B. Extended broadband luminescence of dodecahedral multisite Ce3+ ions in garnets {Y3 }[MgA](BAlSi)O12 (A =Sc, Ga, Al; B = Ga, Al). Dyes Pigm. 2017, 142, 524–529. [Google Scholar] [CrossRef]
  40. Wang, S.; Song, Z.; Kong, Y.; Liu, Q.L. Relationship of Stokes shift with composition and structure in Ce3+ /Eu2+-doped inorganic compounds. Chinese. J. Lumin. 2019, 212, 250–263. [Google Scholar] [CrossRef]
  41. Zhang, Y.; Wang, T.; Zhou, M.; Wang, Y.; Zhang, Z.M. Hydrothermal preparation of Ag-TiO2 nanostructures with exposed {001}/{101} facets for enhancing visible light photocatalytic activity. Ceram. Int. 2017, 43, 3118–3126. [Google Scholar] [CrossRef]
  42. Shi, F.; Liu, J.-X.; Huang, X.; Yu, L.; Liu, S.-H.; Feng, X.; Wang, X.-K.; Shao, G.-L.; Hu, S.-C.; Yang, B.; et al. Hydrothermal synthesis of mesoporous WO3–TiO2 powders with enhanced photocatalytic activity. Adv. Powder Technol. 2015, 26, 1435–1441. [Google Scholar] [CrossRef]
  43. Si, Y.J.; Liu, H.H.; Li, N.T.; Zhong, J.B.; Li, J.Z.; Ma, D.M. SDBS-assisted hydrothermal treatment of TiO2 with improved photocatalytic activity. Mater. Lett. 2018, 212, 147–150. [Google Scholar] [CrossRef]
  44. Tang, H.; Zhang, D.; Tang, G.; Ji, X.; Li, W.; Li, C.; Yang, X. Hydrothermal synthesis and visible-light photocatalytic activity of α-Fe2O3/TiO2 composite hollow microspheres. Ceram. Int. 2013, 39, 8633–8640. [Google Scholar] [CrossRef]
  45. Huang, J.; Ding, L.; Xi, Y.; Shi, L.; Su, G.; Gao, R.; Wang, W.; Dong, B.; Cao, L.X. Efficient silver modification of TiO2 nanotubes with enhanced photocatalytic activity. Solid State Sci. 2018, 80, 116–122. [Google Scholar] [CrossRef]
  46. Sun, Y.; Gao, Y.; Zeng, J.; Guo, J.; Wang, H. Enhancing visible-light photocatalytic activity of Ag-TiO2 nanowire composites by one-step hydrothermal process. Mater. Lett. 2020, 279, 128506. [Google Scholar] [CrossRef]
  47. Sun, Y.; Gao, Y.; Zhao, B.; Xu, S.; Luo, C.; Zhao, Q. One-step hydrothermal preparation and characterization of ZnO-TiO2 nanocomposites for photocatalytic activity. Mater. Res. Express 2020, 7, 085010. [Google Scholar] [CrossRef]
  48. Qin, J.; Wang, J.; Yang, J.; Hu, Y.; Fu, M.; Ye, D. Metal organic framework derivative-TiO2 composite as efficient and durable photocatalyst for the degradation of toluene. Appl. Catal. B: Environ. 2020, 267, 118667. [Google Scholar] [CrossRef]
  49. Li, J.; Wan, Y.; Li, Y.; Yao, G.; Lai, B. Surface Fe(III)/Fe(II) cycle promoted the degradation of atrazine by peroxymonosulfate activation in the presence of hydroxylamine. Appl. Catal. B: Environ. 2019, 256, 117782. [Google Scholar] [CrossRef]
Figure 1. XRD patterns of TiO2-12 h, TiO2-24 h and TiO2-36 h.
Materials 14 05674 g001
Figure 2. SEM images of TiO2-12 h (a), TiO2-24 h (b) and TiO2-36 h (c).
Materials 14 05674 g002
Figure 3. TEM and HRTEM images of TiO2-12 h (a,b) TiO2-24 h (c,d) and TiO2-36 h (e,f).
Materials 14 05674 g003aMaterials 14 05674 g003b
Figure 4. Nitrogen adsorption–desorption isotherms and pore size distribution curves of samples: (a) TiO2-12 h, (b) TiO2-24 h and (c) TiO2-36 h.
Materials 14 05674 g004
Figure 5. The UV-visible absorption spectra of TiO2-12 h, TiO2-24 h and TiO2-36 h.
Materials 14 05674 g005
Figure 6. The PL spectra of TiO2-12 h, TiO2-24 h and TiO2-36 h.
Materials 14 05674 g006
Figure 7. The RhB decolorization curves (a) and the kinetics fitting curves (b) of samples. (catalyst 0.1 g, RhB solution 100 mL (10 mg/L) and neutral pH).
Materials 14 05674 g007
Figure 8. The TC degradation curves (a) and the kinetics fitting curves (b) of samples. (catalyst 0.1 g, TC solution 100 mL (30 mg/L) and neutral pH).
Materials 14 05674 g008
Figure 9. The absorbance curves of NBT (a) and 2, 3-HBA (b) of TiO2-12 h.
Materials 14 05674 g009
Figure 10. The degradation degrees of TiO2-12 h towards RhB (a) and TC (b) in the presence of different scavengers.
Materials 14 05674 g010
Table 1. Textural properties of samples.
SamplesBET Surface Area (m2/g)Pore Volume (cm3/g)Average Pore Size (nm)
TiO2-12145.30.2647.26
TiO2-2443.00.1079.93
TiO2-3613.30.0298.74
Table 2. The RhB decolorization data of TiO2 photocatalytic materials prepared by hydrothermal method.
RefsMethodPhotocatalystLight SourceDecolorization Degreek (min−1)
[10]hydrothermal methodTiO2Mercury lamp (500 W)96.0% in 90 min-
[13]hydrothermal methodCu-TiO2Xenon lamp (250 W)99.4% in 60 min0.076 (RhB)
[17]hydrothermal methodTiO2Mercury lamp (450 W)92.0% in 30 min0.083 (RhB)
[41]hydrothermal methodAg-TiO2Xenon lamp (800 W, >420 nm)96.0% in 270 min0.011 (RhB)
[42]hydrothermal methodTiO2Mercury lamp (300 W)58.0% in 15 min0.104 (RhB)
[43]hydrothermal methodSDBS-TiO2Xenon lamp (500 W)90.0% in 120 min0.0185 (RhB)
[44]hydrothermal methodC-TiO2Xe lamp (500 W, >400 nm)94.3% in 120 min0.022 (RhB)
[45]hydrothermal methodAg-TiO2Xenon lamp (500 W)80.0% in 240 min-
[46]hydrothermal methodAg-TiO2Xenon lamp (350 W)100% in 45 min-
[47]hydrothermal methodZnO-TiO2Xenon lamp (350 W)85.5% in 60 min0.039 (RhB)
present
work
hydrothermal methodTiO2Xenon lamp (250 W)99.0% in 30 min0.125 (RhB)
Publisher’s Note: MDPI stays neutral with regard to jurisdictional claims in published maps and institutional affiliations.