
Prediction of the Interface Shear Strength between Ultra-High-Performance Concrete and Normal Concrete Using Artificial Neural Networks

Abstract
:1. Introduction
2. Experiment and Database Construction
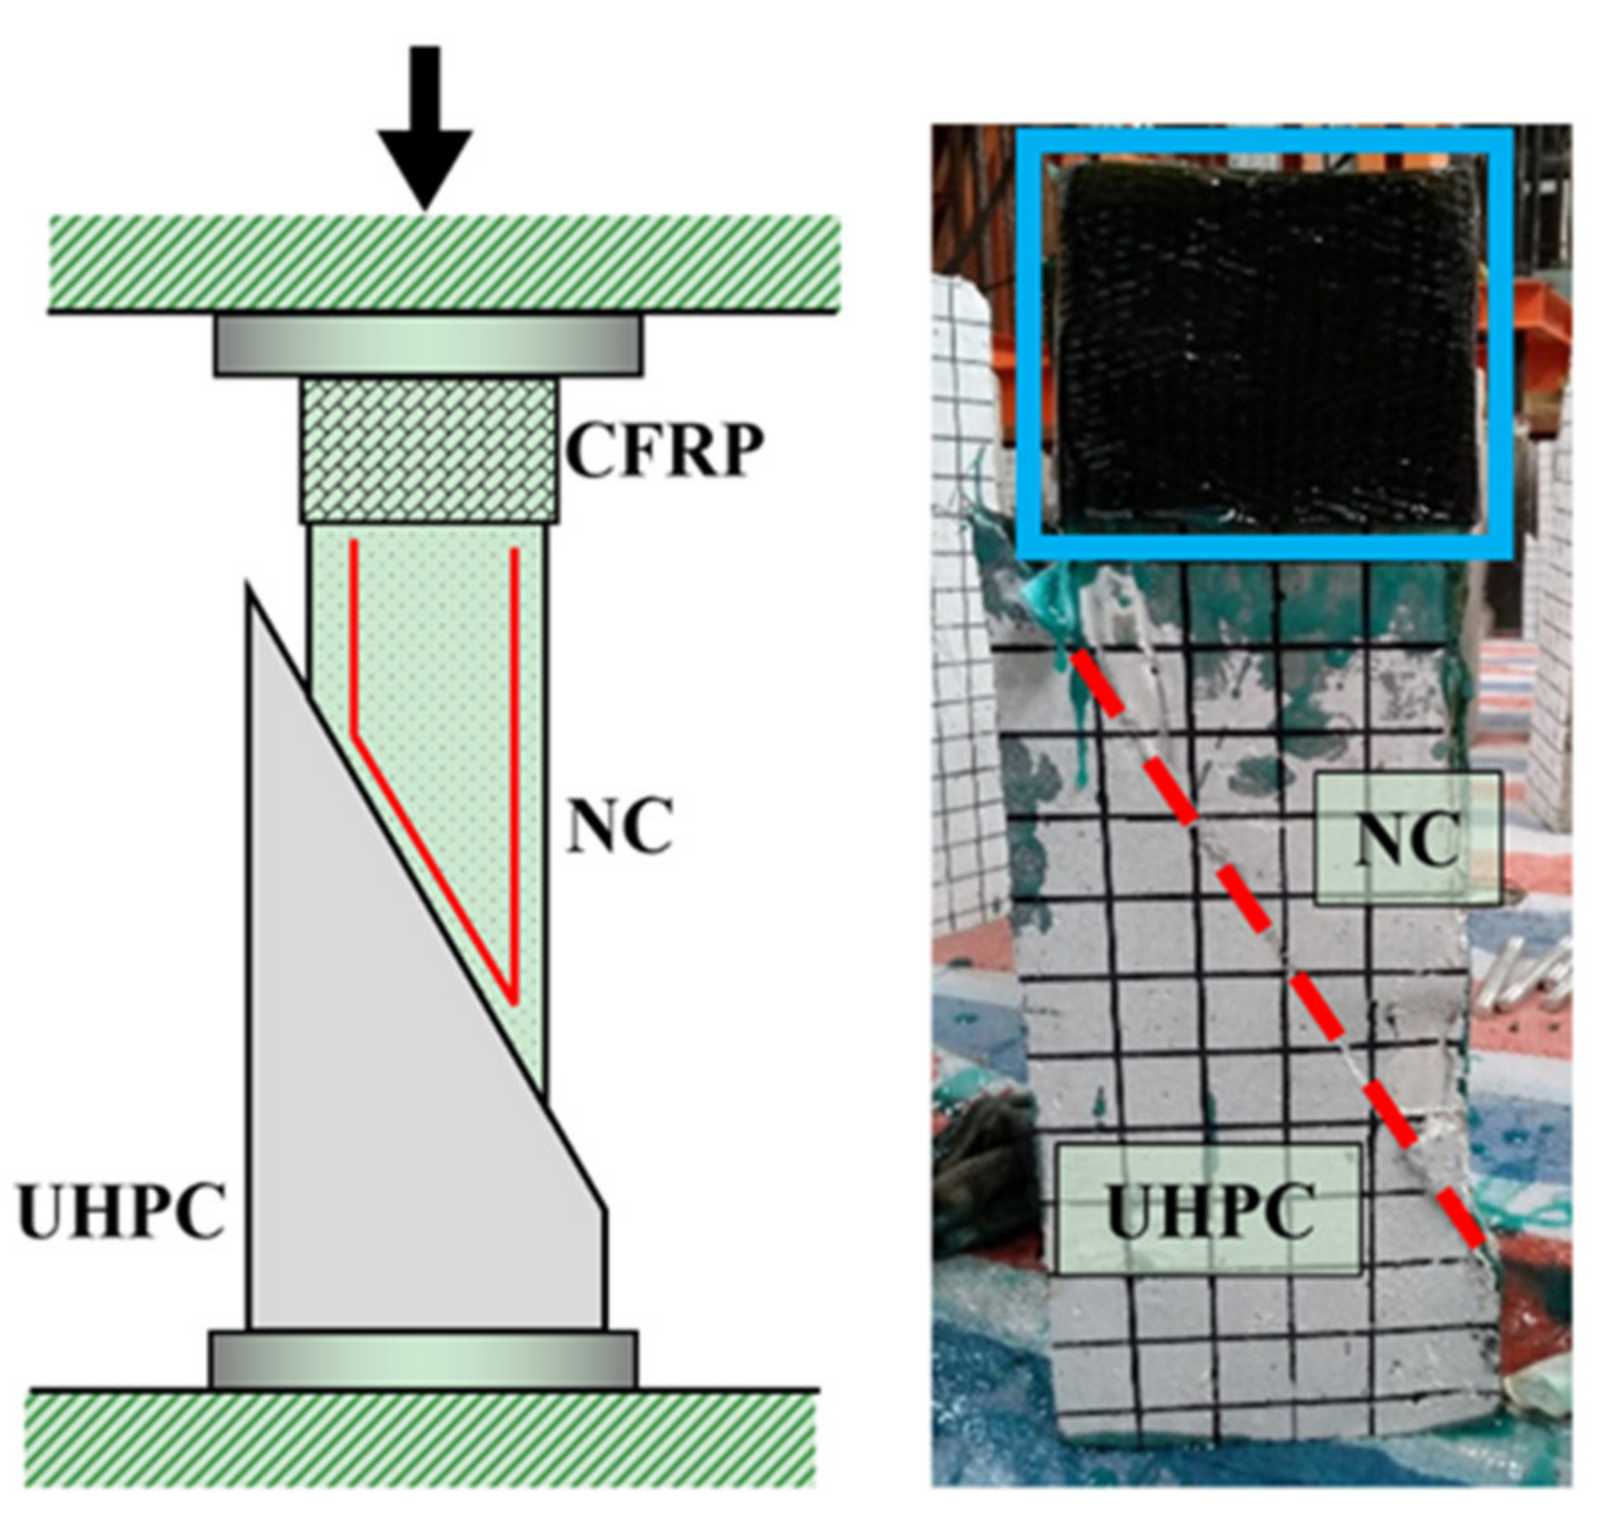
2.1. “Improved” Slant Shear Test
- (i)
- The NC component was wrapped with CFRP materials close to the loading surface;
- (ii)
- The NC component was embedded with U-shaped rebars close to the interface; and
- (iii)
- The top and bottom components had different cross-sections.
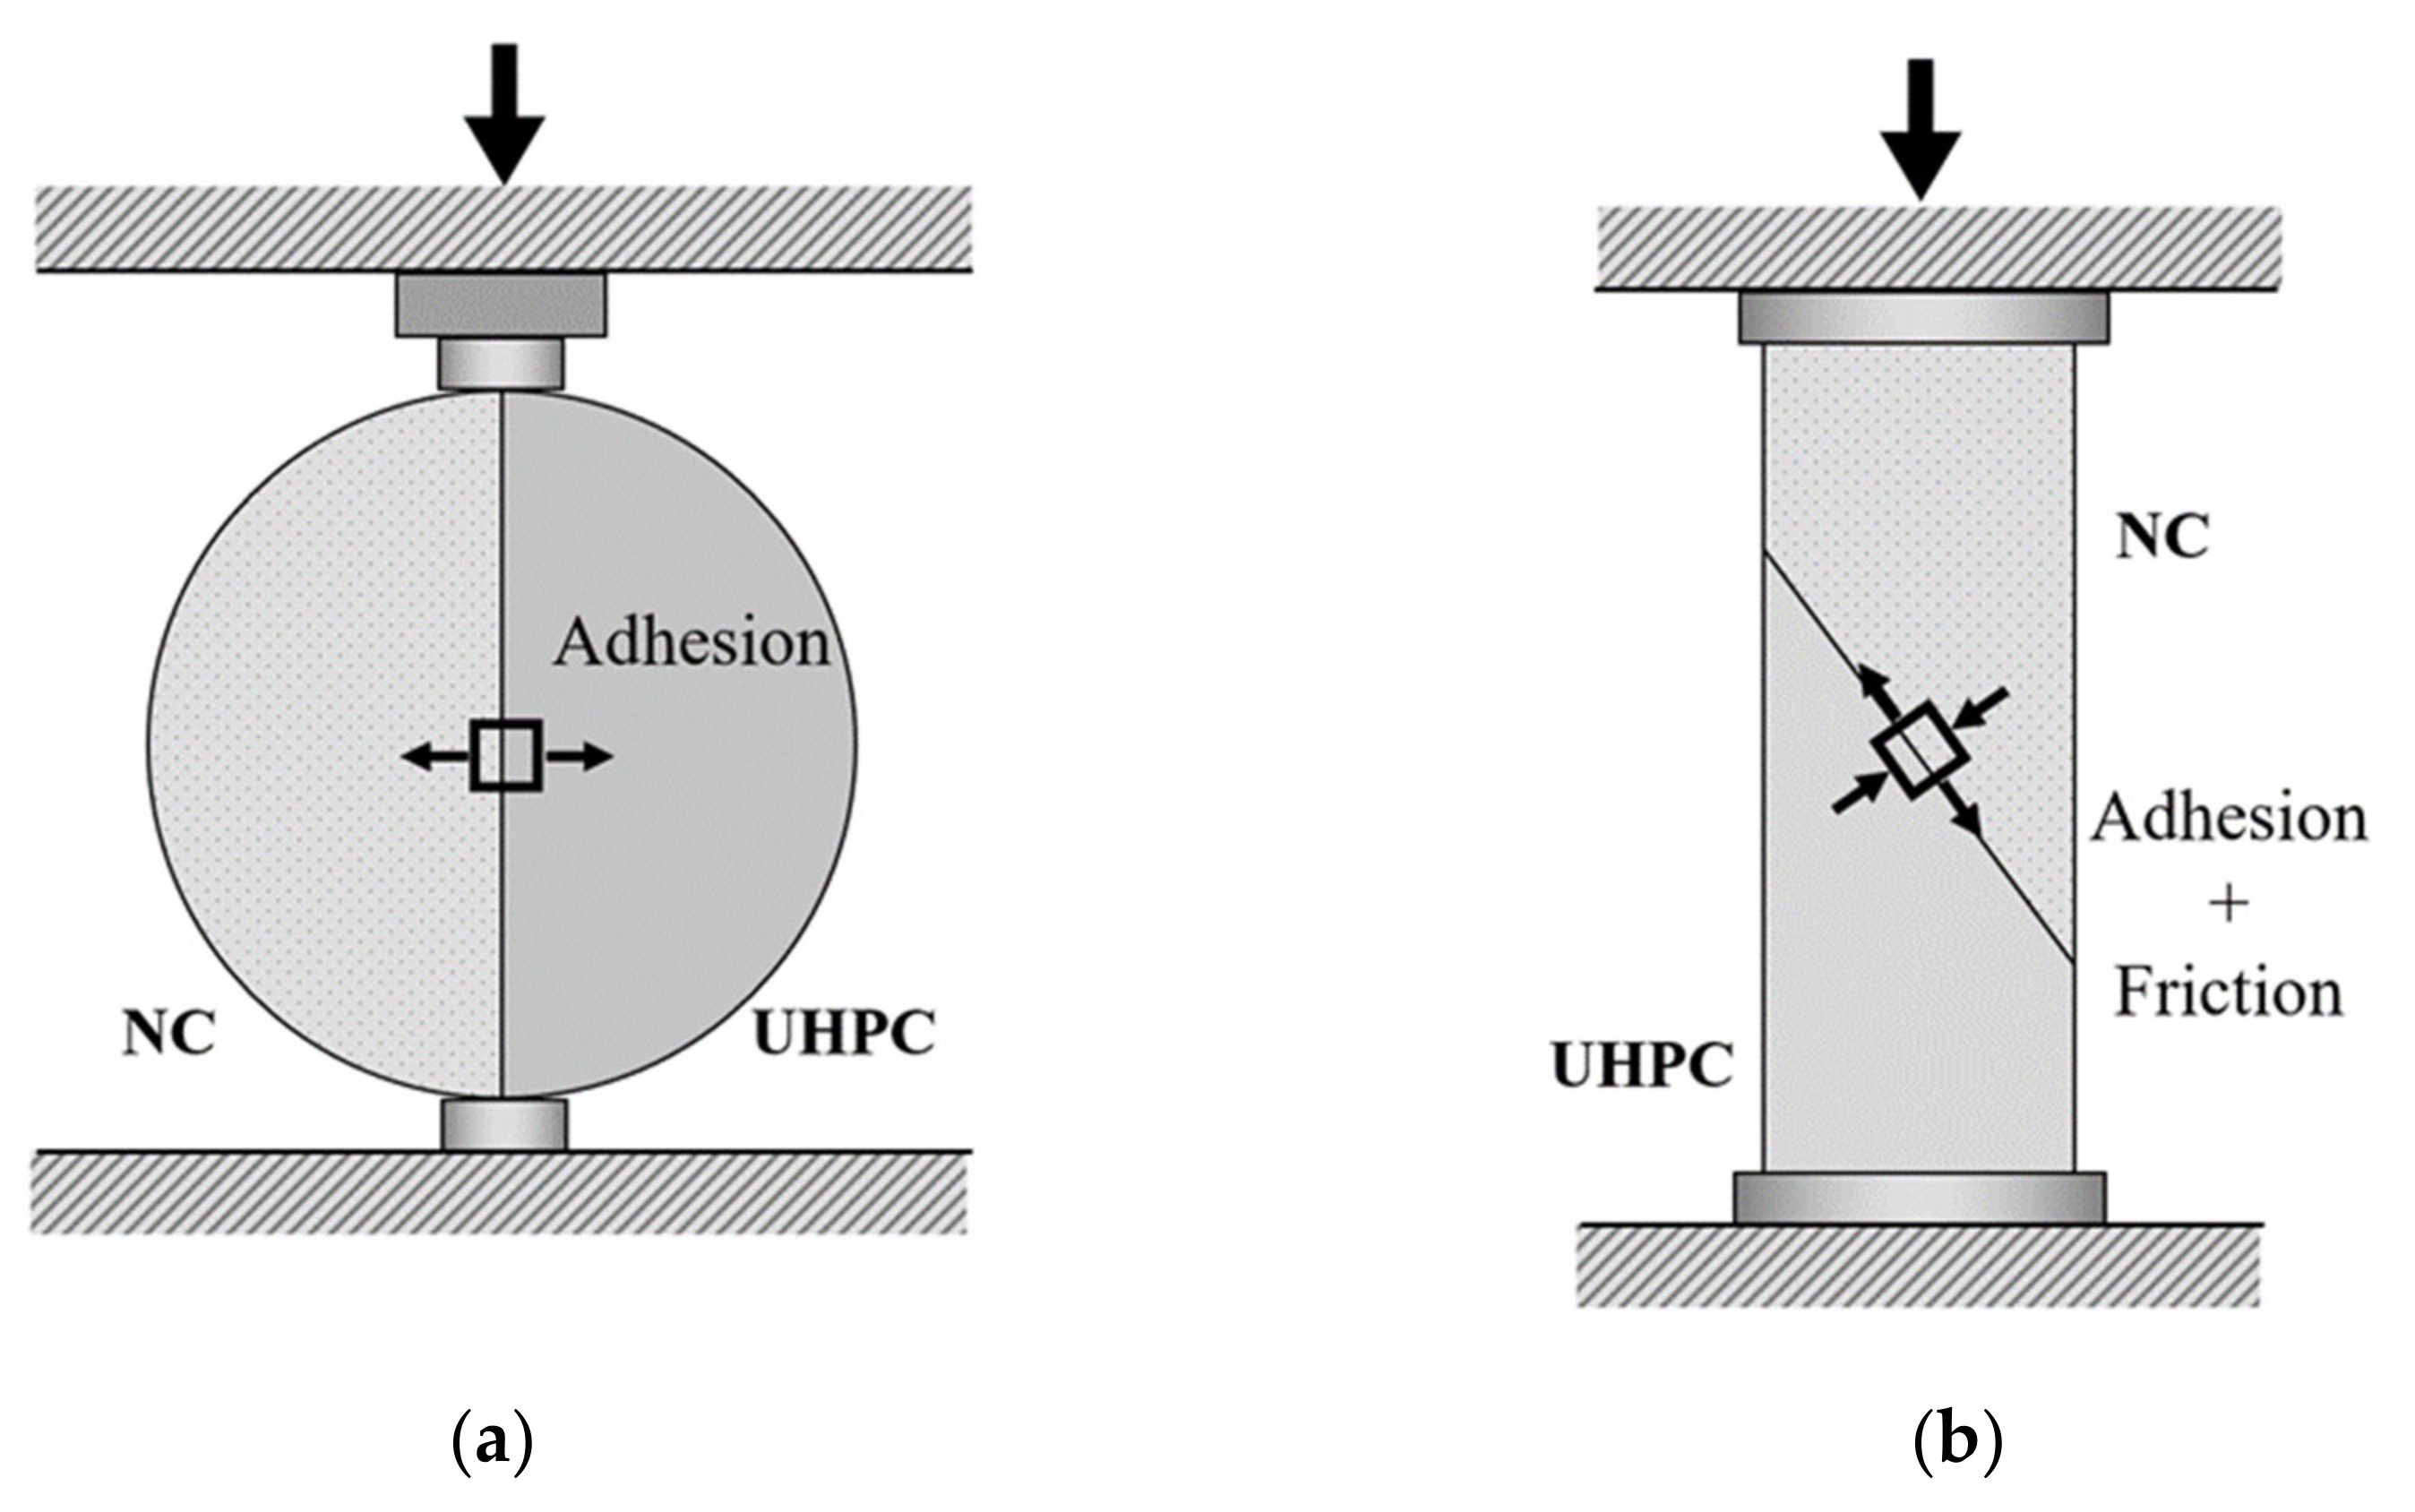
2.2. Database for UHPC–NC Splitting Test
2.3. Database for UHPC–NC Slant Shear Tests
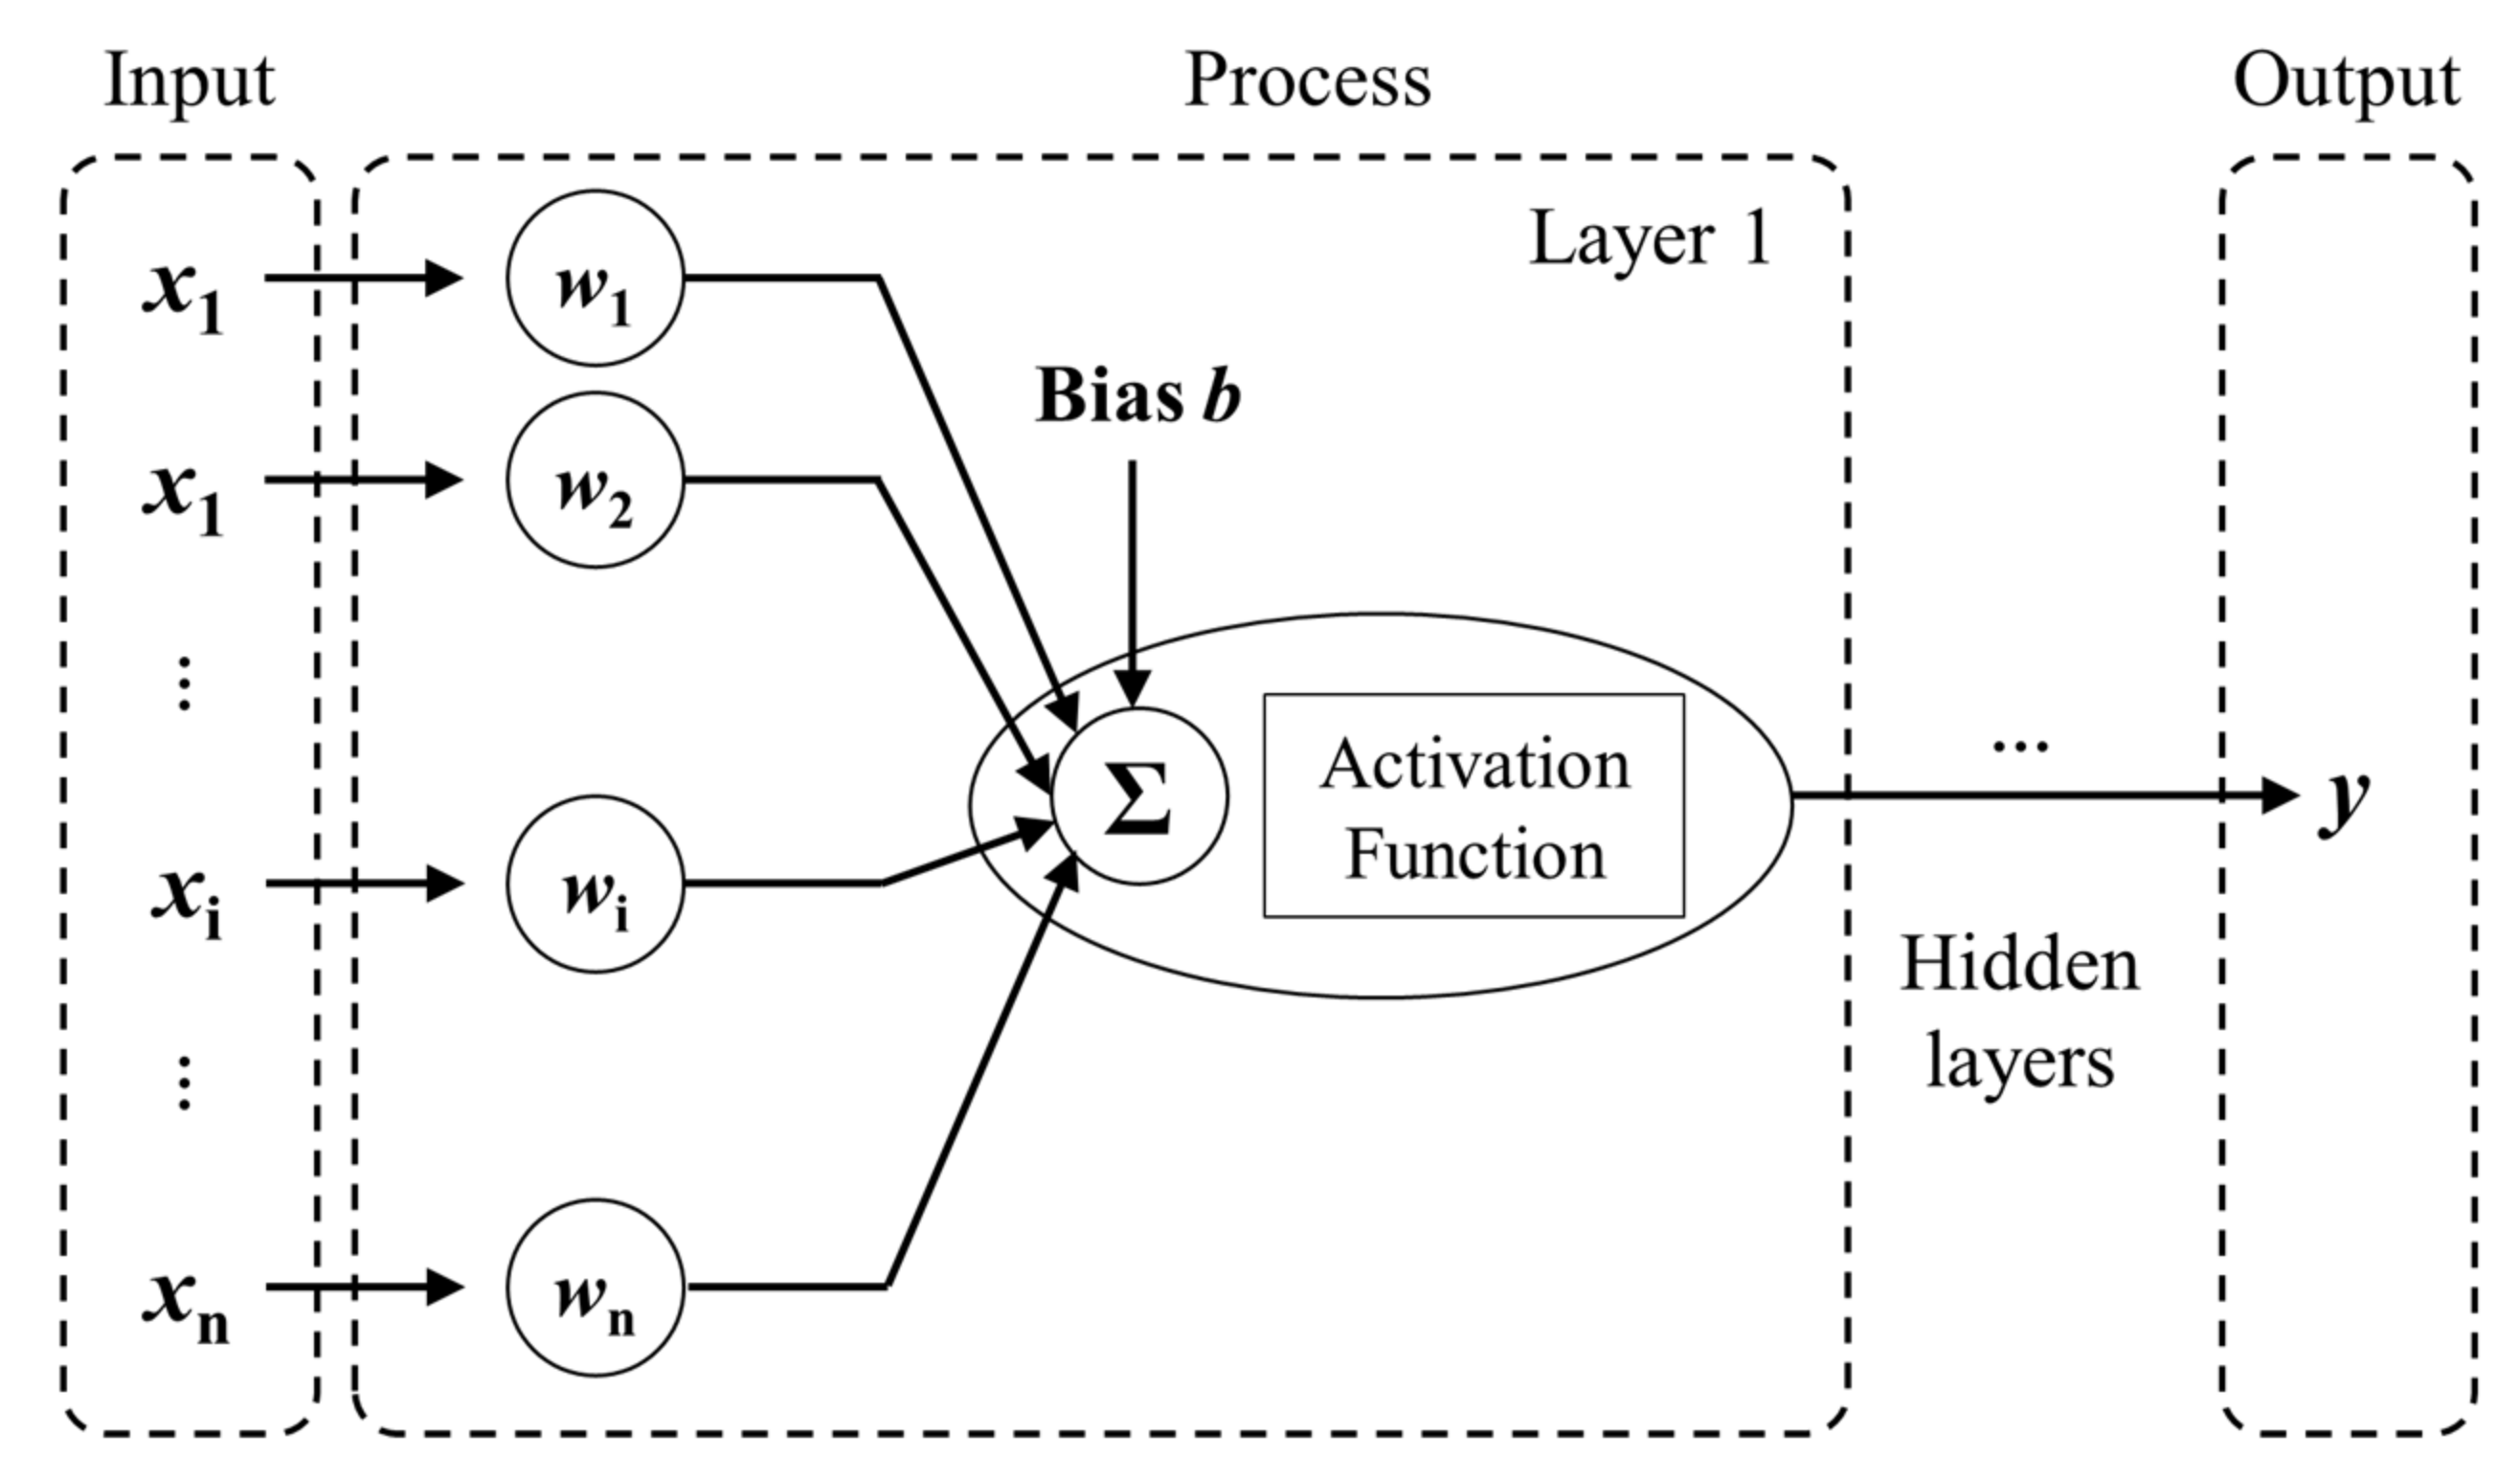
3. ANN Modeling
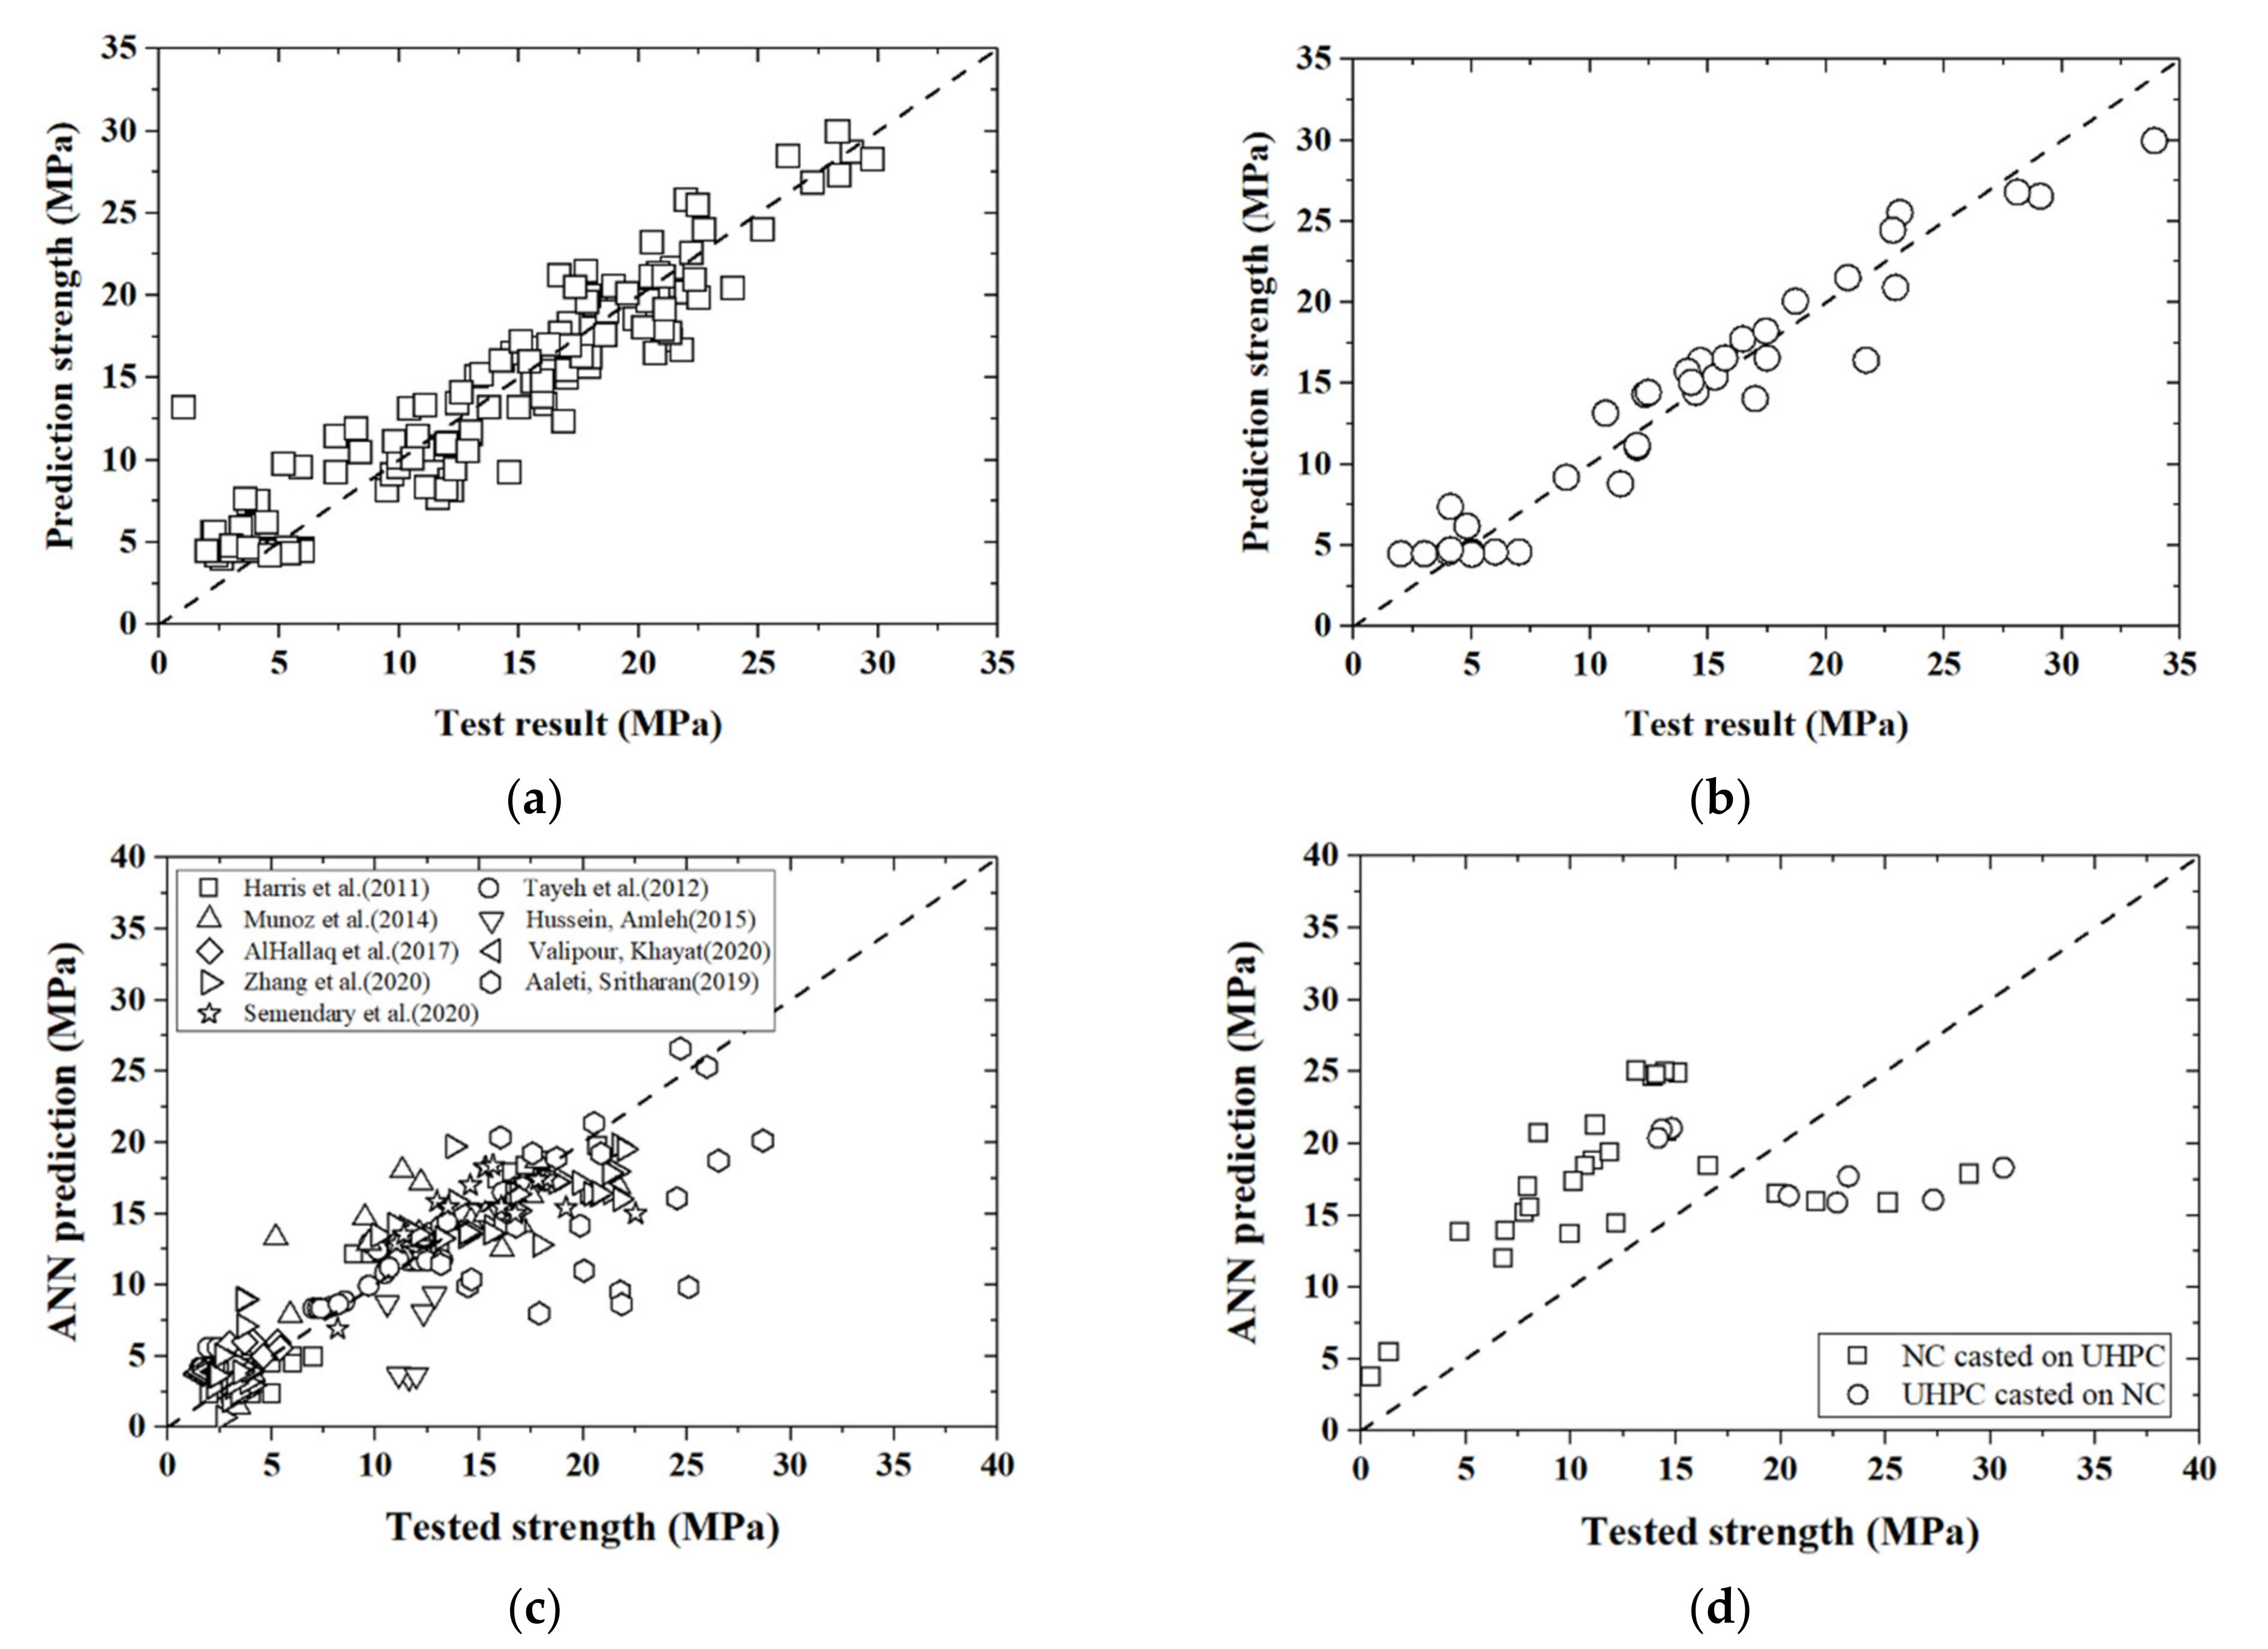
3.1. ANN Training
3.2. ANN Uncertainty Quantification
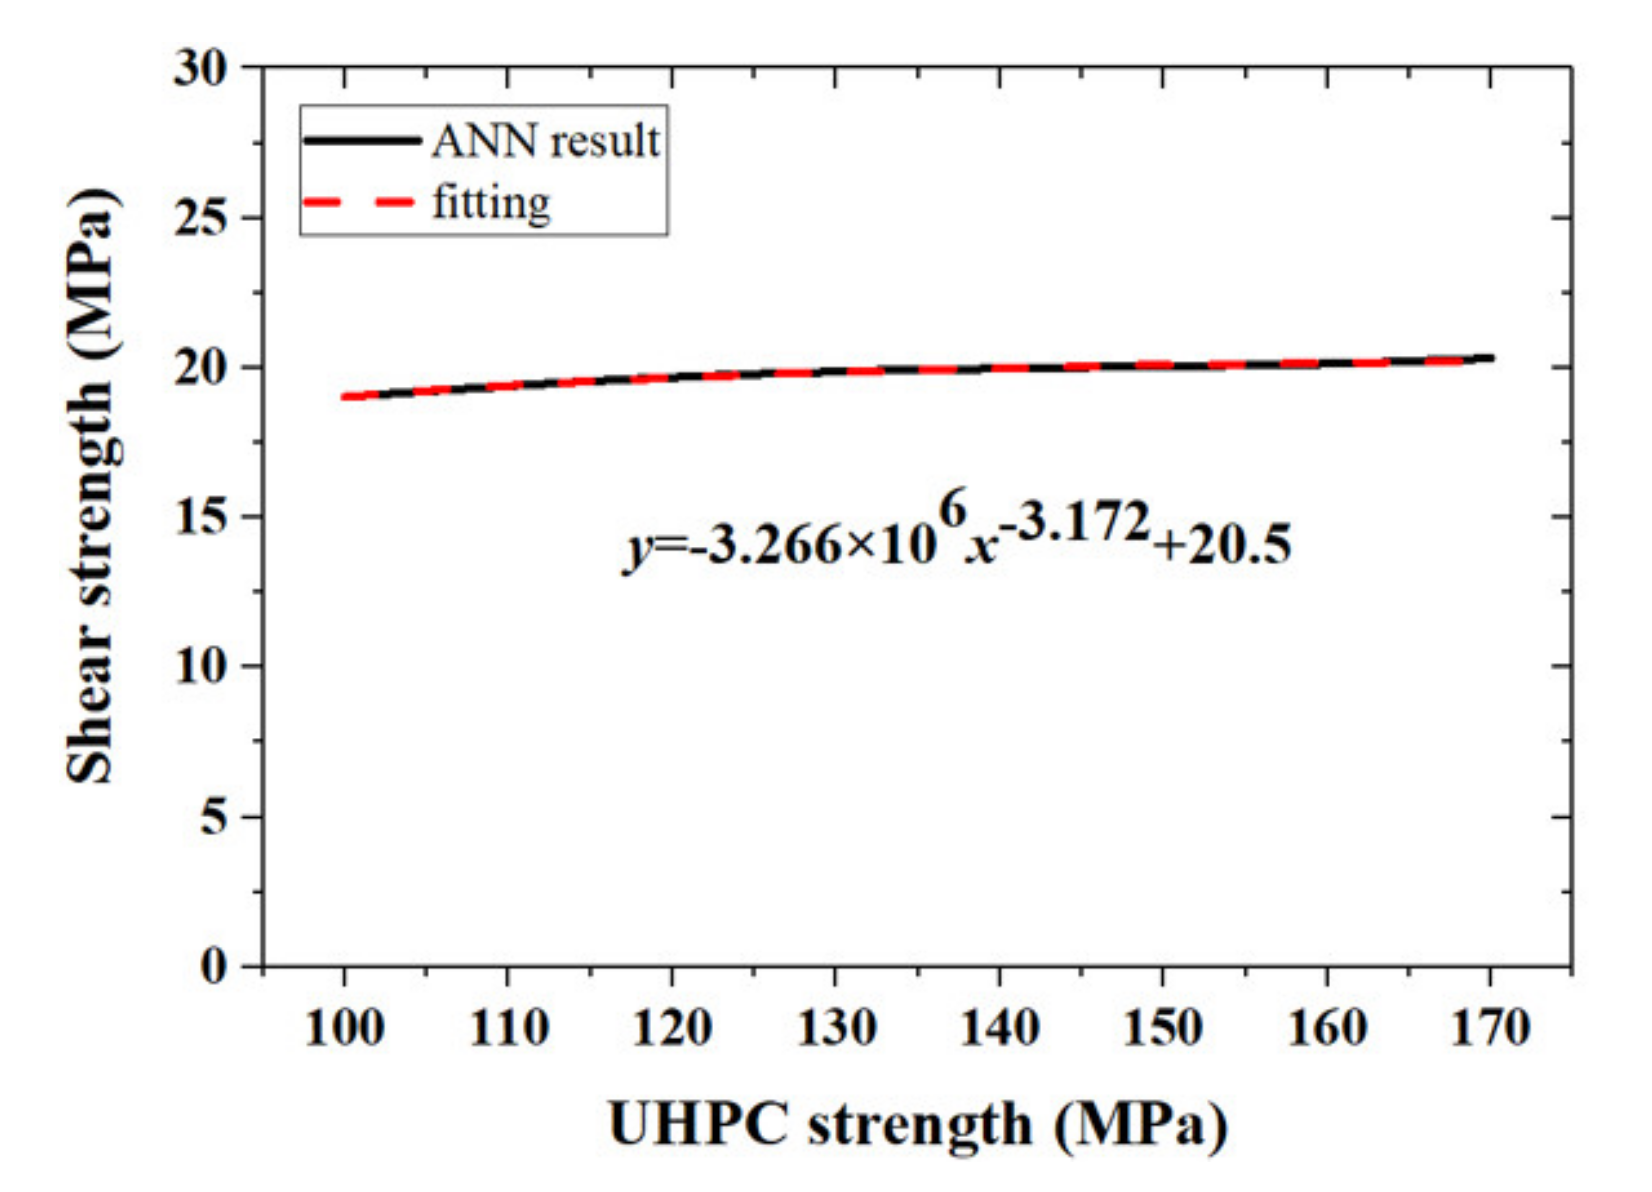
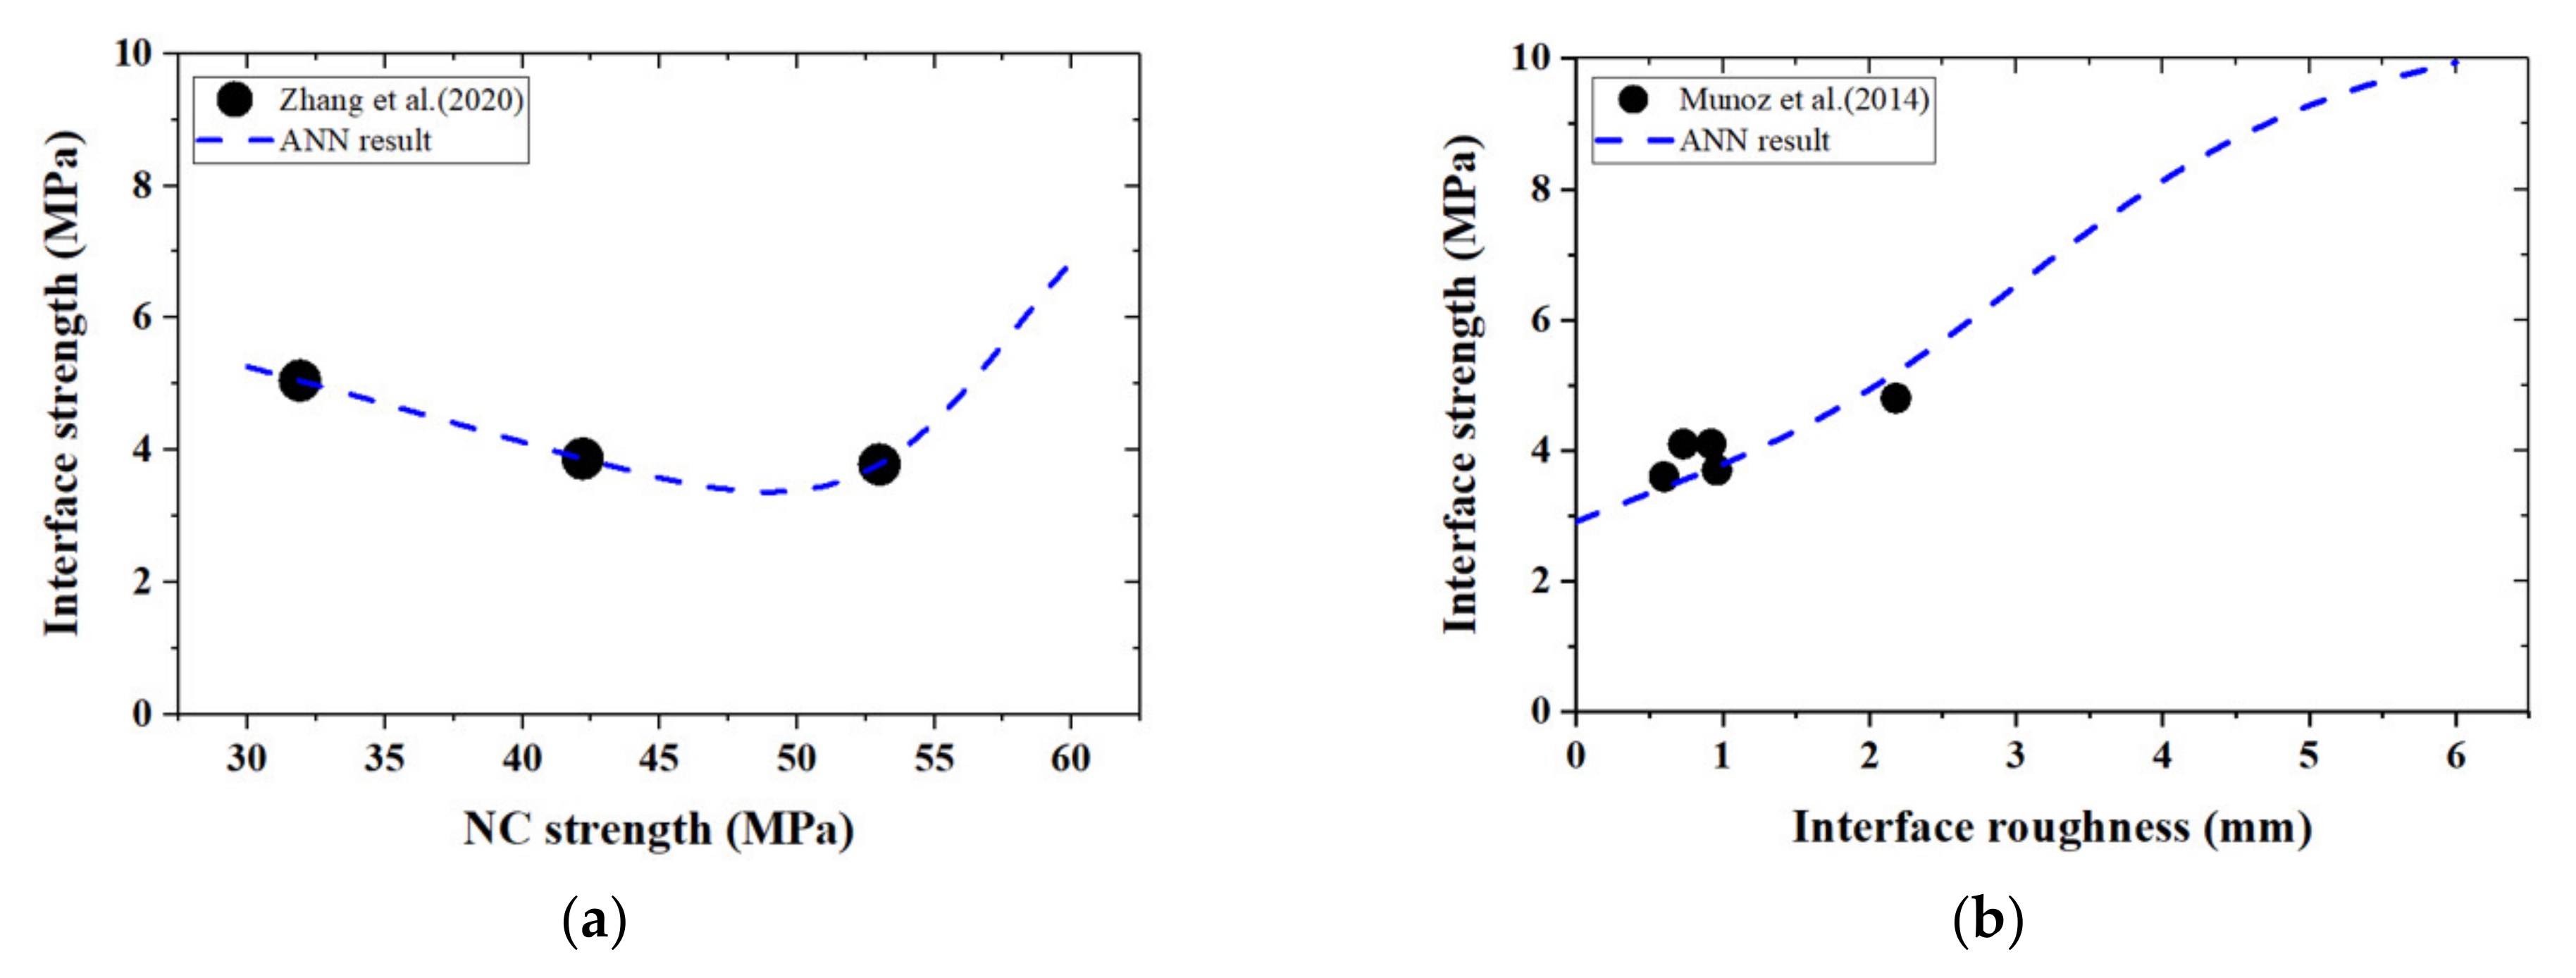
3.3. Simplified Explicit Model for UHPC–NC Bond Strength
4. Improved Empirical Formula Based on Shear-Friction Theory
4.1. Identification of Influencing Factors
4.2. Modified Shear-Friction Formula
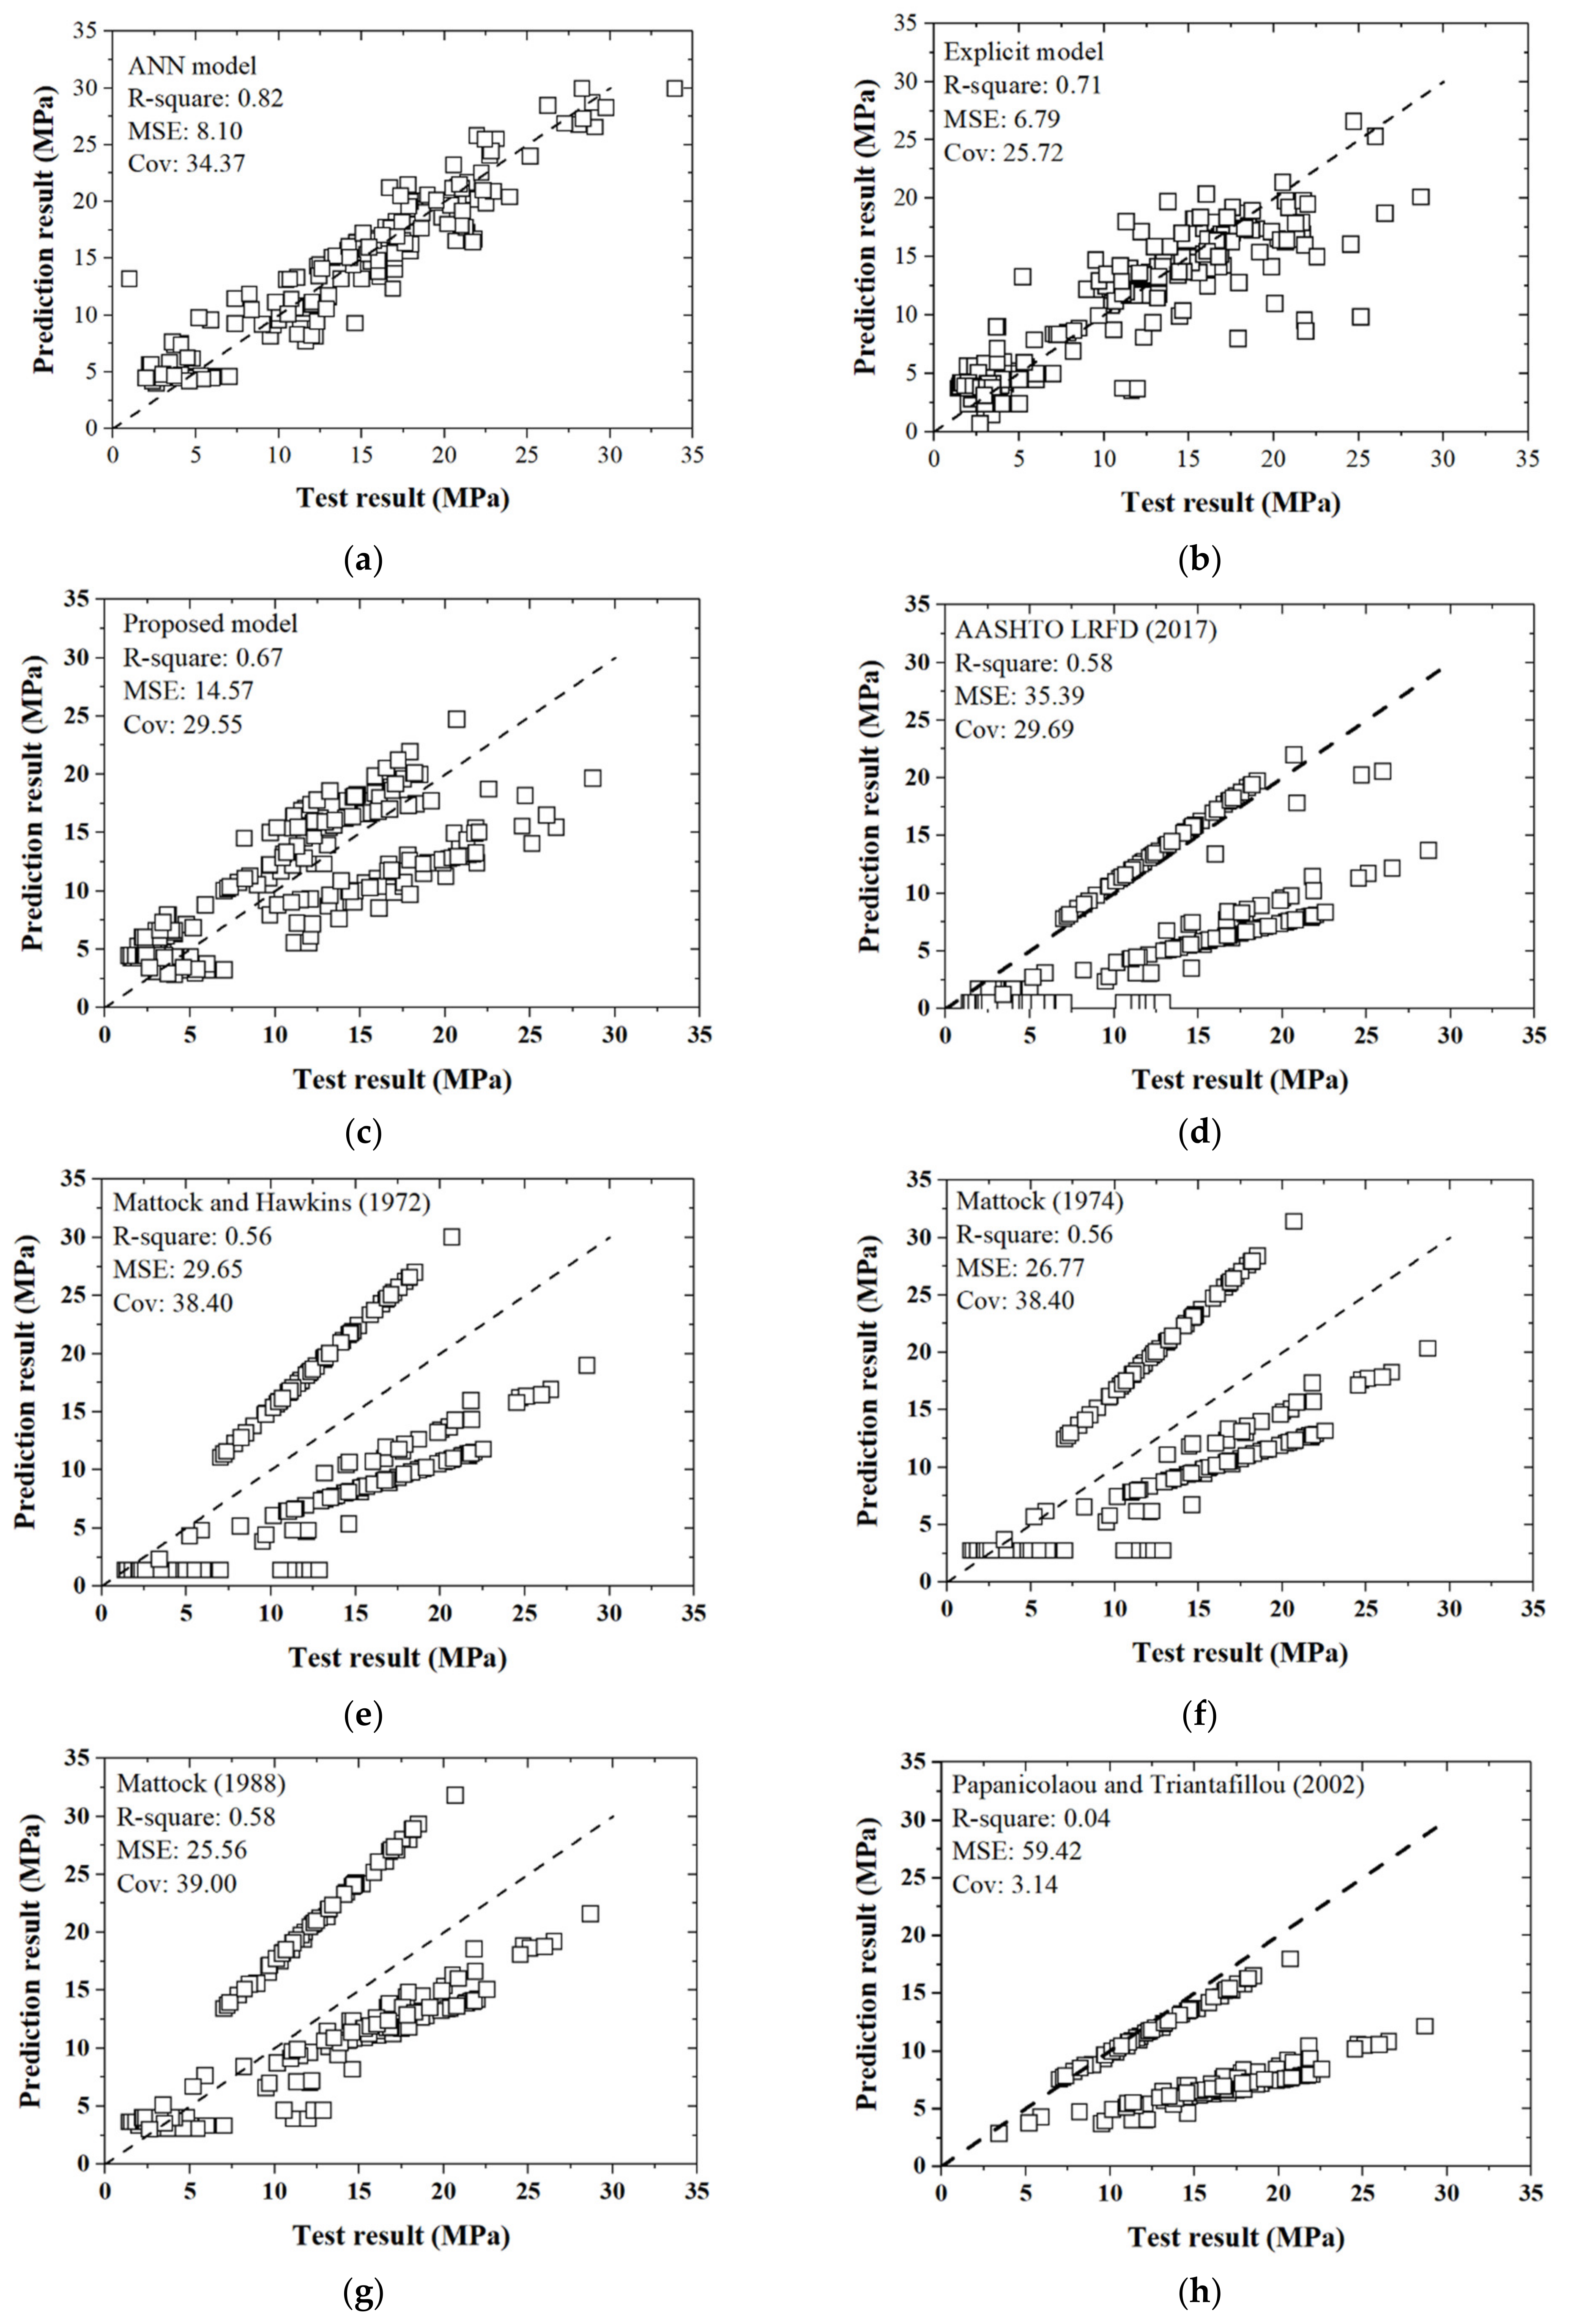
4.3. Comparisons
5. Conclusions
- (1)
- The “improved” slant shear test was devised, and 35 specimens were loaded to failure. It was found that the “improved” test could circumvent concrete crushing and force the occurrence of interfacial debonding, which renders the results more reliable.
- (2)
- It was firstly identified that casting sequence could affect the bond strength between UHPC and NC. Casting NC first, followed by UHPC, could lead to a higher bond strength.
- (3)
- To better predict the bond strength, this study collected 563 specimens in total for the splitting test and 338 specimens for the slant shear test, from published literature in the last few decades. ANN analyses were performed which could give more accurate results, with the following main factors being considered, namely, the normal stress perpendicular to the interface, interface roughness, and compressive strengths of the UHPC and NC materials.
- (4)
- Explicit expressions for the UHPC–NC bond strength were derived based on the proposed ANN model and collected database. Although without a clear underlying physical basis, these explicit expressions are convenient for engineering purposes.
- (5)
- To embrace a physical basis, the conventional shear-friction formula was modified for the UHPC–NC bond strength, which was more straightforward for practical use. The modified formula takes the important factors into account and greatly improves the accuracy of the prediction of UHPC–NC bond strength.
Author Contributions
Funding
Institutional Review Board Statement
Informed Consent Statement
Data Availability Statement
Acknowledgments
Conflicts of Interest
References
- Jawdhari, A.; Fam, A. Thermal-Structural Analysis and Thermal Bowing of Double Wythe UHPC Insulated Walls. Energy Build. 2020, 223, 110012. [Google Scholar] [CrossRef]
- Graybeal, B.; Brühwiler, E.; Kim, B.-S.; Toutlemonde, F.; Voo, Y.L.; Zaghi, A. International Perspective on UHPC in Bridge Engineering. J. Bridg. Eng. 2020, 25, 04020094. [Google Scholar] [CrossRef]
- Abbas, S.; Nehdi, M. Mechanical Behavior of Ultrahigh-Performance Concrete Tunnel Lining Segments. Materials 2021, 14, 2378. [Google Scholar] [CrossRef] [PubMed]
- Chen, J.; Zhao, C.; Ding, F.; Xiang, P. Experimental study on the seismic behavior of precast concrete column with grouted corrugated sleeves and debonded longitudinal reinforcements. Adv. Struct. Eng. 2019, 22, 3277–3289. [Google Scholar] [CrossRef]
- Shafieifar, M.; Farzad, M.; Azizinamini, A. Experimental and numerical study on mechanical properties of Ultra High Performance Concrete (UHPC). Constr. Build. Mater. 2017, 156, 402–411. [Google Scholar] [CrossRef]
- Ghafari, E.; Arezoumandi, M.; Costa, H.; Julio, E. Influence of nano-silica addition on durability of UHPC. Constr. Build. Mater. 2015, 94, 181–188. [Google Scholar] [CrossRef]
- Li, S.; Liew, J.R.; Xiong, M.-X. Prediction of fire resistance of concrete encased steel composite columns using artificial neural network. Eng. Struct. 2021, 245, 112877. [Google Scholar] [CrossRef]
- Safdar, M.; Matsumoto, T.; Kakuma, K. Flexural behavior of reinforced concrete beams repaired with ultra-high performance fiber reinforced concrete (UHPFRC). Compos. Struct. 2016, 157, 448–460. [Google Scholar] [CrossRef]
- Alkaysi, M.; El-Tawil, S.; Liu, Z.; Hansen, W. Effects of silica powder and cement type on durability of ultra high performance concrete (UHPC). Cement Concrete Comp. 2016, 66, 47–56. [Google Scholar] [CrossRef]
- Xu, W.; Ma, B.; Duan, X.; Li, J. Experimental investigation of seismic behavior of UHPC connection between precast columns and footings in bridges. Eng. Struct. 2021, 239, 112344. [Google Scholar] [CrossRef]
- Savino, V.; Lanzoni, L.; Tarantino, A.M.; Viviani, M. A cohesive FE model for simulating the cracking/debonding pattern of composite NSC-HPFRC/UHPFRC members. Constr. Build. Mater. 2020, 258, 119516. [Google Scholar] [CrossRef]
- Shen, Y.; Wang, Y.; Yang, Y.; Sun, Q.; Luo, T.; Zhang, H. Influence of surface roughness and hydrophilicity on bonding strength of concrete-rock interface. Constr. Build. Mater. 2019, 213, 156–166. [Google Scholar] [CrossRef]
- Torsæter, M.; Todorovic, J.; Lavrov, A. Structure and debonding at cement–steel and cement–rock interfaces: Effect of geometry and materials. Constr. Build. Mater. 2015, 96, 164–171. [Google Scholar] [CrossRef]
- Sarkar, J. Characterization of the Bond Strength between Ultra High Performance Concrete Bridge Deck Overlays and Concrete Substrates; Michigan Technological University: Houghton, MI, USA, 2010. [Google Scholar]
- Yuan, S.; Liu, Z.; Tong, T. Investigation of over-nonlocal damage and interface cohesive models for simulating structural behaviors of composite UHPC-NC members. Structures 2020, 28, 2617–2632. [Google Scholar] [CrossRef]
- CEB-FIP. Design of Concrete Structures (CEB-FIP-Model-Code 2010); CEB-FIP: Lausanne, Switzerland, 2010. [Google Scholar]
- European Committee for Standardization. Eurocode 2: Design of Concrete Structures—Part 1-1: General Rules and Rules for Buildings; European Committee for Standardization: Brussels, Belgium, 2004. [Google Scholar]
- American Association of State Highway and Transportation Officials (AASHTO). AASHTO LRFD Bridge Design Specifications; AASHTO: Washington, DC, USA, 2017. [Google Scholar]
- Mattock, A.H.; Hawkins, N.M. Shear Transfer in Reinforced Concrete—Recent Research. PCI J. 1972, 17, 55–75. [Google Scholar] [CrossRef]
- Gohnert, M. Horizontal shear transfer across a roughened surface. Cem. Concr. Compos. 2003, 25, 379–385. [Google Scholar] [CrossRef]
- Momayez, A.; Ehsani, M.; Ramezanianpour, A.; Rajaie, H. Comparison of methods for evaluating bond strength between concrete substrate and repair materials. Cem. Concr. Res. 2005, 35, 748–757. [Google Scholar] [CrossRef]
- Carbonell Muñoz, M.A.; Harris, D.K.; Ahlborn, T.M.; Froster, D.C. Bond performance between ultrahigh-performance concrete and normal-strength concrete. J. Mater. Civ. Eng. 2014, 26, 4014031. [Google Scholar] [CrossRef]
- Hassan, A.; Jones, S.; Mahmud, G. Experimental test methods to determine the uniaxial tensile and compressive behaviour of ultra high performance fibre reinforced concrete (UHPFRC). Constr. Build. Mater. 2012, 37, 874–882. [Google Scholar] [CrossRef]
- Austin, S.; Robins, P.; Pan, Y. Shear bond testing of concrete repairs. Cem. Concr. Res. 1999, 29, 1067–1076. [Google Scholar] [CrossRef]
- Tayeh, B.A.; Abu Bakar, B.; Johari, M.M.; Voo, Y.L. Mechanical and permeability properties of the interface between normal concrete substrate and ultra high performance fiber concrete overlay. Constr. Build. Mater. 2012, 36, 538–548. [Google Scholar] [CrossRef]
- Harris, D.K.; Muñoz, M.A.C.; Gheitasi, A.; Ahlborn, T.M.; Rush, S.V. The Challenges Related to Interface Bond Characterization of Ultra-High-Performance Concrete With Implications for Bridge Rehabilitation Practices. Adv. Civ. Eng. Mater. 2014, 4, 20140034. [Google Scholar] [CrossRef]
- Valikhani, A.; Jaberi Jahromi, A.; Mantawy, I.M.; Azizinamini, A. Numerical modelling of concrete-to-UHPC bond strength. Materials 2020, 13, 1379. [Google Scholar] [CrossRef] [Green Version]
- Aaleti, S.; Sritharan, S. Quantifying Bonding Characteristics between UHPC and Normal-Strength Concrete for Bridge Deck Application. J. Bridg. Eng. 2019, 24, 4019041. [Google Scholar] [CrossRef] [Green Version]
- Farzad, M.; Shafieifar, M.; Azizinamini, A. Experimental and numerical study on bond strength between conventional concrete and Ultra High-Performance Concrete (UHPC). Eng. Struct. 2019, 186, 297–305. [Google Scholar] [CrossRef]
- ASTM International. ASTM C882: Standard Test Method for Bond Strength of Epoxy-Resin Systems Used with Concrete by Slant Shear, Annual Book of ASTM Standards; ASTM International: West Conshohochen, PA, USA, 2005. [Google Scholar]
- British Standards Institution. BS EN 12615: Products and Systems for the Protection and Repair of Concrete Structures—Test Methods—Determination of Slant Shear Strength; British Standards Institution: London, UK, 1999. [Google Scholar]
- Santos, P.; Julio, E. A state-of-the-art review on shear-friction. Eng. Struct. 2012, 45, 435–448. [Google Scholar] [CrossRef]
- Naderpour, H.; Rafiean, A.H.; Fakharian, P. Compressive strength prediction of environmentally friendly concrete using artificial neural networks. J. Build. Eng. 2018, 16, 213–219. [Google Scholar] [CrossRef]
- Hammoudi, A.; Moussaceb, K.; Belebchouche, C.; Dahmoune, F. Comparison of artificial neural network (ANN) and response surface methodology (RSM) prediction in compressive strength of recycled concrete aggregates. Constr. Build. Mater. 2019, 209, 425–436. [Google Scholar] [CrossRef]
- Dahou, Z.; Sbartaï, Z.M.; Castel, A.; Ghomari, F. Artificial neural network model for steel–concrete bond prediction. Eng. Struct. 2009, 31, 1724–1733. [Google Scholar] [CrossRef]
- Shirkhani, A.; Davarnia, D.; Azar, B.F. Prediction of bond strength between concrete and rebar under corrosion using ANN. Comput. Concr. 2019, 23, 273–279. [Google Scholar]
- Hisham, M.; Hamdy, G.A.; El-Mahdy, O.O. Prediction of temperature variation in FRP-wrapped RC columns exposed to fire using artificial neural networks. Eng. Struct. 2021, 238, 112219. [Google Scholar] [CrossRef]
- Abellán-García, J. Four-layer perceptron approach for strength prediction of UHPC. Constr. Build. Mater. 2020, 256, 119465. [Google Scholar] [CrossRef]
- Jahangir, H.; Eidgahee, D.R. A new and robust hybrid artificial bee colony algorithm—ANN model for FRP-concrete bond strength evaluation. Compos. Struct. 2021, 257, 113160. [Google Scholar] [CrossRef]
- Haddad, R.; Haddad, M. Predicting fiber-reinforced polymer–concrete bond strength using artificial neural networks: A comparative analysis study. Struct. Concr. 2021, 22, 38–49. [Google Scholar] [CrossRef]
- Sadowski, Ł.; Hoła, J. ANN modeling of pull-off adhesion of concrete layers. Adv. Eng. Softw. 2015, 89, 17–27. [Google Scholar] [CrossRef]
- Sadowski, L.; Nikoo, M.; Nikoo, M. Principal Component Analysis combined with a Self Organization Feature Map to determine the pull-off adhesion between concrete layers. Constr. Build. Mater. 2015, 78, 386–396. [Google Scholar] [CrossRef]
- Czarnecki, S.; Sadowski, Ł.; Hoła, J. Artificial neural networks for non-destructive identification of the interlayer bonding between repair overlay and concrete substrate. Adv. Eng. Softw. 2020, 141, 102769. [Google Scholar] [CrossRef]
- Raab, C.; Grenfell, J.; El Halim, A.A.; Partl, M.N. The influence of age on interlayer shear properties. Int. J. Pavement Eng. 2015, 16, 559–569. [Google Scholar] [CrossRef]
- Sierra-Beltran, M.G.; Jonkers, H.; Schlangen, E. Characterization of sustainable bio-based mortar for concrete repair. Constr. Build. Mater. 2014, 67, 344–352. [Google Scholar] [CrossRef]
- Kim, H.Y.; Han, D.; Kim, K.; Romero, P. Performance assessment of repair material for deteriorated concrete slabs using chemically bonded cement. Constr. Build. Mater. 2020, 237, 117468. [Google Scholar] [CrossRef]
- Zhou, Y.; Zheng, S.; Huang, Z.; Sui, L.; Chen, Y. Explicit neural network model for predicting FRP-concrete interfacial bond strength based on a large database. Compos. Struct. 2020, 240, 111998. [Google Scholar] [CrossRef]
- Wei, Y.; Zhang, X.; Wu, G.; Zhou, Y. Behaviour of concrete confined by both steel spirals and fiber-reinforced polymer under axial load. Compos. Struct. 2018, 192, 577–591. [Google Scholar] [CrossRef]
- Zhang, Y.; Zhu, P.; Liao, Z.; Wang, L. Interfacial bond properties between normal strength concrete substrate and ultra-high performance concrete as a repair material. Constr. Build. Mater. 2020, 235, 117431. [Google Scholar] [CrossRef]
- Carmona, S. Effect of specimen size and loading conditions on indirect tensile test results. Mater. Constr. 2009, 59, 7–18. [Google Scholar] [CrossRef] [Green Version]
- Harris, D.K.; Sarkar, J.; Ahlborn, T.; Tess, M. Characterization of Interface Bond of Ultra-High-Performance Concrete Bridge Deck Overlays. Transp. Res. Rec. J. Transp. Res. Board 2011, 2240, 40–49. [Google Scholar] [CrossRef]
- Hussein, L.; Amleh, L. Structural behavior of ultra-high performance fiber reinforced concrete-normal strength concrete or high strength concrete composite members. Constr. Build. Mater. 2015, 93, 1105–1116. [Google Scholar] [CrossRef]
- ALHallaq, A.; Tayeh, B.A.; Shihada, S. Investigation of the bond strength between existing concrete substrate and UHPC as a repair material. Int. J. Eng. Adv. Technol. 2017, 6, 2249–8958. [Google Scholar]
- Valipour, M.; Khayat, K.H. Debonding test method to evaluate bond strength between UHPC and concrete substrate. Mater. Struct. 2020, 53, 1–10. [Google Scholar] [CrossRef]
- Júlio, E.N.; Branco, F.; Silva, V.D. Concrete-to-concrete bond strength. Influence of the roughness of the substrate surface. Constr. Build. Mater. 2004, 18, 675–681. [Google Scholar] [CrossRef] [Green Version]
- Mohamad, M.; Ibrahim, I.; Abdullah, R.; Rahman, A.A.; Kueh, A.; Usman, J. Friction and cohesion coefficients of composite concrete-to-concrete bond. Cem. Concr. Compos. 2015, 56, 1–14. [Google Scholar] [CrossRef]
- Pacheco-Torgal, F.; Castro-Gomes, J.; Jalali, S. Adhesion characterization of tungsten mine waste geopolymeric binder. Influence of OPC concrete substrate surface treatment. Constr. Build. Mater. 2008, 22, 154–161. [Google Scholar] [CrossRef] [Green Version]
- Johari, M.A.M.; Brooks, J.; Kabir, S.; Rivard, P. Influence of supplementary cementitious materials on engineering properties of high strength concrete. Constr. Build. Mater. 2011, 25, 2639–2648. [Google Scholar] [CrossRef]
- Popovics, S.; Ujhelyi, J. Contribution to the Concrete Strength versus Water-Cement Ratio Relationship. J. Mater. Civ. Eng. 2008, 20, 459–463. [Google Scholar] [CrossRef]
- Semendary, A.A.; Svecova, D. Interfacial Parameters for Bridge Connections at High-Strength Concrete–Ultrahigh-Performance Concrete Interface. J. Mater. Civ. Eng. 2020, 32, 04020060. [Google Scholar] [CrossRef]
- Soylev, T.; François, R. Quality of steel–concrete interface and corrosion of reinforcing steel. Cem. Concr. Res. 2003, 33, 1407–1415. [Google Scholar] [CrossRef]
- Saldanha, R.; Julio, E.; Dias-Da-Costa, D.; Santos, P. A modified slant shear test designed to enforce adhesive failure. Constr. Build. Mater. 2013, 41, 673–680. [Google Scholar] [CrossRef]
- Pham, T.; Hadi, M. Predicting Stress and Strain of FRP-Confined Square/Rectangular Columns Using Artificial Neural Networks. J. Compos. Constr. 2014, 18, 4014019. [Google Scholar] [CrossRef] [Green Version]
- Lam, W.-H.; Chen, L.; Hashim, R. Analytical wake model of tidal current turbine. Energy 2015, 79, 512–521. [Google Scholar] [CrossRef]
- Prokopski, G.; Halbiniak, J. Interfacial transition zone in cementitious materials. Cem. Concr. Res. 2000, 30, 579–583. [Google Scholar] [CrossRef]
- Tabatabaei, M.; Taleghani, A.D.; Alem, N. Measurement of mixed mode interfacial strengths with cementitious materials. Eng. Fract. Mech. 2020, 223, 106739. [Google Scholar] [CrossRef]
- Santos, P.M.D.; Júlio, E.N.B.S. Development of a laser roughness analyser to predict in situ the bond strength of concrete-to-concrete interfaces. Mag. Concr. Res. 2008, 60, 329–337. [Google Scholar] [CrossRef] [Green Version]
- He, Y.; Zhang, X.; Hooton, R.D.; Zhang, X. Effects of interface roughness and interface adhesion on new-to-old concrete bonding. Constr. Build. Mater. 2017, 151, 582–590. [Google Scholar] [CrossRef]
- Papanicolaou, C.G.; Triantafillou, T. Shear transfer capacity along pumice aggregate concrete and high-performance concrete interfaces. Mater. Struct. 2002, 35, 237–245. [Google Scholar] [CrossRef]
- Mattock, A.H. Shear transfer in concrete having reinforcement at an angle to the shear plane. Spec. Publ. 1974, 42, 17–42. [Google Scholar]
- Walraven, J.; Frénay, J.; Pruijssers, A. Influence of concrete strength and load history on the shear friction capacity of concrete members. Precast/Prestress. Concr. Inst. J. 1987, 32, 66–84. [Google Scholar] [CrossRef]


| Specimen | Quantity | Upper Component | Specimen | Quantity | Upper Component |
|---|---|---|---|---|---|
| NU70HS | 3 | NC | UHPC | 70 | dashed |
| NU70HD | 3 | dotted | |||
| NU70S | 4 | smooth | |||
| NU60S | 1 | 60 | smooth | ||
| NU50S | 1 | 50 | smooth | ||
| NU70E | 9 | 70 | electric pick | ||
| NU60E | 3 | 60 | electric pick | ||
| NU50E | 3 | 50 | electric pick | ||
| UN70E | 2 | UHPC | NC | 70 | electric pick |
| UN60E | 3 | 60 | electric pick | ||
| UN50E | 3 | 50 | electric pick |
| Specimen | Quantity | Roughness (mm) | Peak Load (kN) | Normal Stress (MPa) | Shear Strength (MPa) |
|---|---|---|---|---|---|
| NU70HS | 3 | 5.00 | 410.21 | 5.18 | 14.03 |
| NU70HD | 3 | 5.00 | 386.82 | 4.67 | 13.23 |
| NU70S | 4 | 1.00 | 214.31 | 2.88 | 7.33 |
| NU60S | 1 | 1.00 | 26.00 | 0.72 | 1.30 |
| NU50S | 1 | 1.00 | 72.81 | 3.93 | 4.68 |
| NU70E | 9 | 3.00 | 288.87 | 3.63 | 9.88 |
| NU60E | 3 | 3.00 | 422.20 | 12.06 | 21.11 |
| NU50E | 3 | 3.00 | 296.99 | 16.43 | 19.09 |
| UN70E | 2 | 3.00 | 426.29 | 5.60 | 14.58 |
| UN60E | 3 | 3.00 | 427.60 | 12.13 | 21.38 |
| UN50E | 3 | 3.00 | 385.20 | 22.33 | 24.76 |
| Literature | Quantity | Design Parameters | ||||
|---|---|---|---|---|---|---|
| Roughness | Freeze–Thaw | Age | Material Strength | Moisture | ||
| Harris et al. (2011) [51] | 47 | √ | √ | |||
| Tayeh et al. (2012) [25] | 39 | √ | √ | |||
| Carbonell Muñoz et al. (2014) [22] | 284 | √ | √ | √ | √ | |
| Hussein, Amleh (2015) [52] | 18 | √ | ||||
| Harris et al. (2015) [26] | 72 | √ | ||||
| AlHallaq et al. (2017) [53] | 18 | √ | √ | |||
| Valipour, Khayat (2020) [54] | 60 | √ | √ | |||
| Zhang et al. (2020) [49] | 25 | √ | √ | √ | ||
| Research | Quantity | Design Parameters | ||||
|---|---|---|---|---|---|---|
| Interface Texture | Age | Material Strength | Casting Sequence | Moisture | ||
| Harris et al. (2011) [51] | 81 | √ | ||||
| Tayeh et al. (2012) [25] | 45 | √ | √ | |||
| Carbonell Muñoz et al. (2014) [22] | 54 | √ | √ | |||
| Aaleti and Sritharan (2019) [28] | 63 | √ | √ | √ | ||
| Semendary and Svecova (2020) [60] | 15 | √ | ||||
| Zhang et al. (2020) [49] | 60 | √ | √ | √ | √ | |
| R-Square | MSE | Cov | ||
|---|---|---|---|---|
| Database (563 + 338) | Training group (80%) | 0.818 | 8.06 | 34.86 |
| Verification group (20%) | 0.794 | 8.24 | 31.52 | |
| Overall | 0.82 | 8.10 | 34.37 | |
| Our test (35) | Casting NC on UHPC | 0.22 | 65.57 | 15.70 |
| Casting UHPC on NC | 0.49 | 61.48 | 8.38 |
| Factors | Minimum | Maximum | Average |
|---|---|---|---|
| (MPa) | 0 | 15 | 8 |
| (mm) | 0 | 6 | 3 |
| (MPa) | 40 | 60 | 50 |
| (MPa) | 100 | 170 | 130 |
| Codes | Surface Textures | Expression | Friction Coefficient µ | Adhesion c |
|---|---|---|---|---|
| AASHTO (2017) [18] | CIP slab roughened 6mm | 1.0 | 1.9 | |
| Normal-density concrete monolithically | 1.4 | 2.8 | ||
| Low-density concrete roughened 6mm | 1.0 | 1.7 | ||
| Normal-density concrete roughened 6mm | 1.0 | 1.7 | ||
| Clean concrete, not roughened | 0.6 | 0.52 | ||
| Clean concrete reinforced | 0.7 | 0.17 | ||
| Mattock (1972) [19] | -- | 0.8 | 1.38 | |
| Mattock (1974) [70] | -- | 0.8 | 2.76 | |
| Mattock (1988) [71] | -- | 0.8 | 0.467 | |
| Papanicolaou and Triantafillou (2002) [69] | Smooth interfaces | 1.7 | 0.33 | |
| Rough interfaces | 1.4 | 0.45 |
| R-Square | MSE | Cov | ||
|---|---|---|---|---|
| This study | ANN model | 0.82 | 8.10 | 34.37 |
| Explicit formula | 0.71 | 11.79 | 29.55 | |
| Modified shear-friction formula | 0.67 | 14.57 | 25.72 | |
| Specifications | AASHTO (2017) | 0.58 | 35.39 | 29.69 |
| Research papers | Mattock and Hawkins (1972) | 0.56 | 29.56 | 38.40 |
| Mattock (1974) | 0.56 | 26.77 | 38.40 | |
| Mattock (1988) | 0.58 | 25.56 | 39.00 | |
| Papanicolaou and Triantafillou (2002) | 0.04 | 59.42 | 3.14 |
Publisher’s Note: MDPI stays neutral with regard to jurisdictional claims in published maps and institutional affiliations. |
© 2021 by the authors. Licensee MDPI, Basel, Switzerland. This article is an open access article distributed under the terms and conditions of the Creative Commons Attribution (CC BY) license (https://creativecommons.org/licenses/by/4.0/).
Share and Cite
Du, C.; Liu, X.; Liu, Y.; Tong, T. Prediction of the Interface Shear Strength between Ultra-High-Performance Concrete and Normal Concrete Using Artificial Neural Networks. Materials 2021, 14, 5707. https://doi.org/10.3390/ma14195707
Du C, Liu X, Liu Y, Tong T. Prediction of the Interface Shear Strength between Ultra-High-Performance Concrete and Normal Concrete Using Artificial Neural Networks. Materials. 2021; 14(19):5707. https://doi.org/10.3390/ma14195707
Chicago/Turabian StyleDu, Changqing, Xiaofan Liu, Yinying Liu, and Teng Tong. 2021. "Prediction of the Interface Shear Strength between Ultra-High-Performance Concrete and Normal Concrete Using Artificial Neural Networks" Materials 14, no. 19: 5707. https://doi.org/10.3390/ma14195707
APA StyleDu, C., Liu, X., Liu, Y., & Tong, T. (2021). Prediction of the Interface Shear Strength between Ultra-High-Performance Concrete and Normal Concrete Using Artificial Neural Networks. Materials, 14(19), 5707. https://doi.org/10.3390/ma14195707