
Maximum Achievable N Content in Atom-by-Atom Growth of Amorphous Si-B-C-N Materials


Department of Physics and NTIS—European Centre of Excellence, University of West Bohemia, Univerzitni 8, 30614 Plzen, Czech Republic
Materials 2021, 14(19), 5744; https://doi.org/10.3390/ma14195744
Submission received: 7 September 2021
/
Revised: 27 September 2021
/
Accepted: 28 September 2021
/
Published: 1 October 2021
(This article belongs to the Section Thin Films and Interfaces)
Abstract
:Amorphous Si-B-C-N alloys can combine exceptional oxidation resistance up to 1500 °C with high-temperature stability of superior functional properties. Because some of these characteristics require as high N content as possible, the maximum achievable N content in amorphous Si-B-C-N is examined by combining extensive ab initio molecular dynamics simulations with experimental data. The N content is limited by the formation of unbonded N2 molecules, which depends on the composition (most intensive in C rich materials, medium in B rich materials, least intensive in Si-rich materials) and on the density (increasing N2 formation with decreasing packing factor when the latter is below 0.28, at a higher slope of this increase at lower B content). The maximum content of N bonded in amorphous Si-B-C-N networks of lowest-energy densities is in the range from 34% to 57% (materials which can be grown without unbonded N2) or at most from 42% to 57% (at a cost of affecting materials characteristics by unbonded N2). The results are important for understanding the experimentally reported nitrogen contents, design of stable amorphous nitrides with optimized properties and pathways for their preparation, and identification of what is or is not possible to achieve in this field.

1. Introduction
Amorphous Si-B-C-N alloys are of high and long-term interest [1,2,3,4,5,6,7,8,9,10,11,12,13,14,15,16] because of unique combinations of functional properties such as high hardness [4,17], high optical transparency combined with controllable refractive index at some compositions [18,19] and controllable electrical conductivity at other compositions [20,21], strong absorption of electromagnetic waves [13,22], high photodetection sensitivity [23], strong photoluminescence [5], low leakage current [24] or giant piezorezistivity [14]. In parallel, proper Si-B-C-N compositions exhibit exceptionally high oxidation resistance up to 1500 °C [2,25], thermal stability of the amorphous networks up to 1700 °C [1,25], long-time (tested for 12 years) ageing resistance [19], low thermal expansion coefficient [2] and, perhaps most importantly, high-temperature stability of the aforementioned functional properties [18,25]. This makes the Si-B-C-N alloys very attractive for numerous applications ranging from high-temperature protective coatings to electronics and optoelectronics. The most recent examples include e.g., Si-B-C-N pressure sensors [14], Si-B-C-N protective coatings on optical fibers used at high temperatures [15] or Si-B-C-N-containing composites used for H2 production [16].
Bulk Si-B-C-N materials are often prepared by pyrolysis (recent review [10]) or mechanical alloying followed by sintering (recent review [12]). Thin films of Si-B-C-N can grow from isolated atoms (which is most relevant for the present work; usually using magnetron sputtering) [4,5,6,17,18,19], or from chemical precursors [15,26,27]. There have been numerous efforts to capture the role of individual elements and the relationships between their concentrations ([Si], [B], [C] and [N]total—not to be confused with [N]network defined below; all given in at.%) and materials properties. See the works dealing with the [Si]/[C] ratio [19,28], [B] [28,29] or [N]total [6,21]. For example, as much N as possible is desirable for high thermal stability, high hardness or wide band gap.
The status of nitrogen is special: while [Si], [B] and [C] can be varied from 0 to 100%, maximum achievable values of [N]total are much lower and depend on the preparation technique (e.g., N2 pressure during sputtering [21] or combination of sputtering with N(2)+ ion beam [6]). See the literature overview [30] on CNx for an extreme case: maximum [N]total obtained by various techniques of 23–45% (atom-by-atom growth) or 23–57% (including growth from N-rich precursors or assisted by N2+ bombardment). Furthermore, the composition is sometimes measured by techniques (e.g., X-ray fluorescence or elastic recoil detection) which cannot distinguish the content of N bonded in the amorphous networks ([N]network) and the total N content ([N]total which may include also unbonded N2 or other N-rich molecules, reported e.g., for TiN [31] or oxidized TiN [32]). Thus, owing to the aforementioned importance of as high [N]network as possible for some of the functional properties, it is desirable to quantify the highest achievable [N]network at a given [Si]/[B]/[C] ratio.
The relationships between composition, density, structure and energy of (pure or hydrogenated) amorphous (Si)-(B)-(C)-(N) materials can be and are often studied by ab initio molecular dynamics (MD) simulations, see the examples for C [33,34], CHx [35], CNx [36,37], Si-C-H [38], Si-C-N [39,40] or Si-B-C-N [21,28]. The reliable predictions of local energy minima followed by their characterization in terms of bonding environment of individual atoms or localization of individual electronic states on these atoms allows one to obtain a lot of information not available experimentally. Recently, enhanced computing capacities have allowed the shift from modeling of few selected compositions to detailed sampling over a wide range of compositions and densities.
The main aim of this work is to predict maximum achievable [N]network in amorphous Si-B-C-N materials in a wide range of [Si]/[B]/[C] ratios. The background hypothesis, supported by the author’s previous works [30,41] on simpler nitrides and the discussion therein, is that maximum [N]network in those materials which are not affected by the composition and structure of their precursors is largely given by the formation of N2 molecules during the atom-by-atom growth (not to be confused with polymerization of N-rich precursors such as melamine or dicyandiamide [42], which is beyond the present scope). Maximum [N]network calculated at numerous [Si]/[B]/[C] ratios is compared with experimental [N]total values obtained in our laboratory by reactive magnetron sputtering using equally numerous sputter target compositions. The effect of packing factor (not only atomic density) on the N2 formation is investigated as well.
2. Materials and Methods
2.1. Simulation Technique
All simulations utilized density functional theory (DFT) and Car–Parrinello MD implemented in the CPMD code [43]. The amorphous structures were predicted by the liquid-quench (LQ) algorithm consisting of (1) mixing of a melt (6000 K) of a given composition and density, (2) exponential cooling to a representative deposition temperature (450 K), (3) equilibration at this temperature and (4) collecting the results. The length of each step was 0.5 ps, leading to a total length of all steps of 2 ps. This frequently used [21,28,30,33,34,35,36,38,39,41] algorithm captures material formation conditions arising from melting and subsequent rapid quenching of a small volume of a material after an energetic particle impact.
The presented energy differences (E-Emin where Emin corresponds to the lowest-energy density of a given composition) were obtained using time-averaged Kohn–Sham energies collected at the aforementioned temperature of 450 K. For the purpose of a low-temperature comparison of qualitatively similar structures of materials with a band gap, the relevance of time-averaged energy differences is considered to be comparable with that of free energy differences. The bonding statistics, including the number of N2 molecules ([N2]), were calculated using a representation of pairs of valence electrons by centers of maximally localized Wannier functions (WFCs) [38,44].
2.2. List of Simulations
All simulations were performed with 70 atoms of random initial coordinates in a cubic periodical cell. The presented data span 16 different [Si]/[B]/[C] ratios including:
- [Si]/[Si+C] of 0, ≈11, ≈22, ≈33, ≈66 and 100% at [B] = 0,
- [B]/[B+C] of 0, ≈11, ≈22, ≈33, ≈66 and 100% at [Si] = 0 and
- [Si]/[Si+B+C] of, again, 0, ≈11, ≈22, ≈33, ≈66 and 100% at [B]/[C] ≈ 4.
The first group (B-free) is repeated for completeness from the previous work [41], the second and third group (B-containing) are considered for the first time. The [B]/[C] ratio of 4 which characterizes the third group is motivated by the experimentally used [18,19,21,25] B4C sputter target.
Each [Si]/[B]/[C] ratio was combined with 13 [N]total values up to 57%: 0, 10, 20, and then a step of 2 up to 40 N atoms in the 70-atom cell. All 16 × 13 = 208 compositions are visualized in Figure 1a–c. The total N content is given by (i) the number of unbonded nitrogen molecules ([N2]) and (ii) the content of nitrogen bonded in the amorphous networks, given in at.% out of the network atoms ([N]network).
Si-B-C-N materials with different energies and N2 contents were obtained using 13–19 inverse atomic densities (volumes per atom, V) of 6, 6.5, 7, 7.5, 8, and then a step of 1 up to 16, 18, 20 and 22 Å3/at. for [Si]/[Si+B+C] = 0–22%, 33–66%, 100% except pure Si and pure Si, respectively. These V ranges capture all lowest-energy densities calculated in this paper as well as all densities of crystalline or amorphous materials from the Si-B-C-N system found in the literature. Furthermore, the statistical noise has been reduced by performing each simulation 5× with different random initial coordinates and averaging all quantities (consequently, [N2] is not necessarily integer). Thus, the calculated data are based on 16 × 13 × 13 − 19 × 5 ≈ 15,000 liquid-quench simulations.
2.3. Reliability of the Simulation Protocol
While the LQ algorithm in itself is well established, it is worth discussing the decision to allow the N atoms to form unbonded N2 molecules which are not instantly lost to the atmosphere. Figure 1d,e show lowest-energy V of CNx and SiNx (binary systems chosen because of the availability of corresponding experimental data) predicted using the described simulation protocol in a wide [N]total range. The calculated V is compared with measured V (converted from mass density, ρ, using the Avogadro number, NA, and the molar masses, MSi,C,N):
ρCNx (g/cm3) = 2.897 − 0.01784 × [N]total (fit on experimental data by authors of [37]) ⇔
and
VCNx (Å3/at.) = {MC×(100 − [N]total) + MN×[N]total)}/{(2.897 − 0.01784 × [N]total) × NA × 10−22}
ρSiNx (g/cm3) = 2.3 + 0.01575 × [N]total (own fit on experimental data reported in [45]) ⇔
VSiNx (Å3/at.) = {MSi × (100 − [N]total) + MN × [N]total)}/{(2.3 + 0.01575 × [N]total) × NA × 10−22}.
It can be seen that the agreement shown in Figure 1d,e is excellent, supporting the correctness of the simulation protocol in general and the decision concerning allowed presence of unbonded N2 in particular. Indeed, V of CNx increases with [N]total because of more/larger voids occupied by unbonded N2 (not e.g., because of covalent radii of both elements: that of N is actually slightly lower). It is crucial that the agreement was achieved without any fitting parameters, only by reproducing the material formation process on the experimentally relevant time scale.
2.4. Reactive Magnetron Sputtering
The presented Si-B-C-N films were deposited on Si substrates by dc reactive magnetron sputtering of the following 15 composite targets [4,19,46]:
- SixC100-x (graphite overlapped by Si plates) at x = 5, 20, 40, 60 and 80%;
- SixB20C80-x (graphite overlapped by Si and B plates) at x = 5, 40, 60 and 75%; and
- Six(B4C)100-x (B4C overlapped by Si plates) at x = 0, 5, 20, 40, 60 and 75%.
The total pressure was 0.500 Pa and the composition of the discharge gas mixture (except the series which examines its effect) was 50% (0.250 Pa) N2 + 50% (0.250 Pa) Ar. Varying the substrate surface temperature (up to 700 °C) and substrate bias voltage (down to −500 V) did not visibly affect the measured [N]total values (the effect of both these parameters on other film characteristics such as content of implanted argon, stress or hardness is examined elsewhere [17,19]).
The film composition was measured by Rutherford back-scattering spectroscopy (evaluated by the code GISA [47]; all elements except H) and elastic recoil detection (evaluated by the code SIMNRA [48]; H) using a Van de Graaf generator with a linear electrostatic accelerator. The accuracy of compositional measurements was 1–2%. The constitutive elements were accompanied by small contents of Ar (≤5 at.%), H (≤5 at.%) and O (≈1 at.%), at a median [Ar+H+O] of 7%. These impurities were neglected for the present purpose, i.e., the presented [N]total values are equal to [N]/[Si+B+C+N] rather then to [N]/[Si+B+C+N+Ar+H+O]. The effect of implanted Ar is investigated elsewhere [49].
3. Results and Discussion
3.1. Maximum Achievable N Content
The N2 formation in itself and its dependence on V is illustrated in Figure 2a. The figure constitutes an example for the composition Si7B18C5N40 characterized by medium [Si]/[B]/[C] (complementary to extremal compositions Si30N40 and C30N40 discussed in detail previously [41]) and high [N]total. The figure shows a non-monotonic evolution of E characterized by E = Emin around V = 9 A3/at. This is combined with monotonically increasing [N2] from 0 at the highest densities (lowest V) to ≈8 at the lowest density (highest V) considered. Note that the number of triple N≡N bonds is only slightly higher than [N2], i.e., that most of N≡N bonds which are natural precursors of N2 formation indeed converted to unbonded N2 molecules. The lowest-energy density corresponds to a low but convincingly non-zero [N2]: the first fingerprint of the differences between [N]total and stable [N]network (Section 2.2) which are discussed next.
Calculating lowest-energy [N2] and [N]network for all elemental compositions investigated reveals (not shown graphically) that at fixed [Si]/[B]/[C], [N2] is almost zero up to a certain [N]total threshold. Above this threshold, [N2] starts to linearly increase with [N]total (most of the extra N atoms end up in unbonded N2 molecules) and [N]network almost saturates. This allows one to predict the maximum achievable [N]network as a function of [Si]/[B]/[C], and the result is shown in Figure 2b,c. Figure 2b shows the maximum [N]network which is achievable without the presence of N2 molecules (less than one molecule per the 70-atom simulation cell). It can be seen that the predicted maximum [N]network smoothly changes with [Si]/[B]/[C], including ≈34% for CNx, just above 50% for BNx (allowing BN) and 57% for SiNx (allowing Si3N4). The first of these numbers corresponds to C3N1.5, far from C3N4 which was predicted to be superhard in its β phase [50] but which seems to be impossible to prepare at least by the low-pressure atom-by-atom growth. The N-rich compositions allowed by the figure include SiBCN3 in the middle of the triangle, one of the early examples [2] of extremal thermal stability and oxidation resistance of Si-B-C-N ceramics. Figure 2c shows the aforementioned saturation values of [N]network which are achievable when the network formation is accompanied by N2 formation. These values are of course higher than those in Figure 2b, e.g., ≈42% (C3N2.2) instead of ≈34% (C3N1.5) in the case of CNx, but arguably at a cost of properties affected by the lower densification resulting from the presence of voids occupied (either permanently, or temporarily until a loss to the atmosphere) by unbonded N2.
The dependence of the maximum achievable [N]network on ratios of the other elements can be captured well by the following two fitted (R2 = 0.96 in both cases) quadratic dependencies on x = [Si]/[Si+B+C] and y = [B]/[Si+B+C]:
for networks without N2 (Figure 2b) and
for networks with N2-containing voids (Figure 2c).
[N]network (%) = 34.3 + 50.8x + 36.9y − 28.5x2 −16.9y2 − 33.9xy
[N]network (%) = 41.7 + 39.1x + 31.5y − 24.3x2 − 18.7y2 − 37.1xy
This constitutes the key result of the present paper, which can be tested experimentally (below).
3.2. Densification and Packing Factor
The formation of N2-containing voids affects the lowest-energy atomic density and packing factor (p; calculated using the covalent radii rSi = 1.11 Å, rB = 0.82 Å, rC = 0.77 Å, rN = 0.75 Å) of the materials. An example of the dependence of these two quantities on [Si]/[B]/[C] at a fixed [N]total (shown for [N]total = 54%, chosen because it leads to similar V of CNx and SiNx) is presented in Figure 3a,b, respectively. Indeed, Figure 3a shows that V of 10.5–11.0 Å3/at. can be found in the two bottom corners, i.e., for CNx and SiNx. However, as confirmed in Figure 3b, the reasons behind these two maxima are fundamentally different. In the case of CNx, the enhanced V (despite the low radii of C and N) is due to the large volume occupied by N2-containing voids and leading to a low packing factor down to ≈16%. In the case of SiNx, there are no unbonded N2 molecules which allows more than 2× higher packing factor of ≈34%, and the enhanced V is due to the high radius of Si atoms. Contrary to CNx and SiNx which represent local maxima of V, BNx represents the minimum V of ≈7.5 Å3/at. resulting from a combination of medium packing factor (nonzero but low number of N2 molecules) of ≈25% with the low radius of B.
While the minimum V leading to N2 formation is different for different compositions, the maximum p leading to N2 formation is almost independent of the composition. In particular, Figure 3c shows that p ≥ 0.28 leads to almost zero [N2], while p < 0.28 leads to increasing [N2] with decreasing p. Note that while this finding is shown graphically only for the highest [N]total investigated, it is independent of [N]total. The limit p ≥ 0.28 is consistent with the densities of covalent nitrides such as β-Si3N4 (p = 0.33), β-C3N4 (predicted p = 0.30) or c-BN (p = 0.34; the bonds between hexagonal planes of h-BN with p = 0.21 are not covalent). The results obtained at [B] = 0 almost exactly reproduce the linear dependence which connects [N2] = 0 at p = 0.28 with the other obvious limit [N]network = 0 (nitrogen only in the form of N2 molecules) at p = 0. The results obtained at [B] > 0 exhibit the same critical p = 0.28, but lead to slower increase of [N2] with p decreasing below 28%, by a factor which is actually very close to (1 − 0.01 × [B]). This indicates, beyond the present scope, a qualitative difference between compositionally stable low-density B doped by N ([B] close to 100%, i.e., 1 − 0.01 × [B] close to zero) and unstable low-density Si or C doped by N.
3.3. Experimental Verification
The experimentally measured [N]total obtained by sputtering 15 different targets at fixed process parameters such as total N2+Ar pressure, N2 partial pressure or sputtering current, are shown in Figure 4a. Note that the experimental [N]total values were calculated for this purpose as [N]/[Si+B+C+N] (27–61%) after neglecting the impurities, i.e., they are higher than the truly measured [N]/[Si+B+C+N+Ar+H+O] (26–54%). The figure conservatively spans only the pentagon defined by the compositions investigated, without any extrapolation. While the chosen deposition conditions do not necessarily always lead to the achievable maximum of [N]total (see the quantitative comparison below), it is clear that the experimental data exhibit exactly the same trend as the theoretical prediction: lowest values of predicted maximum [N]network and measured [N]total in the C-rich corner, medium values in the middle of the triangle and in the B-rich corner, highest values in the Si-rich corner. In other words, the figure supports the predicted dependence of the N2 formation at the lowest-energy density on the composition.
The qualitative agreement of the simulation (Figure 2b) and the experiment (Figure 4a) is complemented by their quantified comparison in Figure 4b. First, Figure 4b confirms that the calculated values of maximum [N]network shown in Figure 2b are well represented by the simple quadratic Equation (3): the median vertical distance of squares in Figure 4b from the diagonal line is less than 1% of N. Second, the figure confirms that the measured [N]total almost monotonically increases with the predicted maximum [N]network. Third, quantitatively, the measured [N]total values are well below the predicted maxima when the prediction is low, but converge to the predicted maxima when the prediction is high. In other words, the figure shows that less intensive N2 formation and loss does not only mean that the maximum N content is higher, it also means that this higher N content can be achieved in a wider range of experimental conditions. The single [N]total value which exceeds the predicted maximum [N]network may not only be due to the presence of unbonded molecules (unlikely in this particular case, taking the thermal stability [25,28] into account) but also due to a higher than estimated measurement error (the four rightmost datapoints include two almost exactly reproducing the predicted maximum, one above it and one below it) and/or the role of impurities (e.g., compressive stress and changes in network topology resulting from implantation of Ar+ ions [49]: even when [N]/([Si+B+C+N] = 61% is above the prediction, [N]/[Si+B+C+N+Ar+O+H] = 54% is below it). The role of impurities is important in various field of materials science (e.g., [51,52]) but beyond the present scope. Fourth, the empty balls in Figure 4b confirm that increasing the N2 partial pressure from 0.125 Pa to 0.500 Pa can move the measured [N]total from a value well below the prediction almost all the way toward the prediction.
4. Conclusions
Ab initio simulations of structures and energies of amorphous Si-B-C-N materials have been performed in a wide range of compositions and densities, and compared with the preparation of the same materials in the form of thin films by reactive magnetron sputtering in a wide range of sputter target compositions. The maximum content of N bonded in the Si-B-C-N networks is limited by the formation of unbonded N2 molecules, and can be well represented by a quadratic dependence (for N2-free materials; in %) 34.3 + 50.8x + 36.9y − 28.5x2 − 16.9y2 − 33.9xy where x = [Si]/[Si+B+C] and y = [B]/[Si+B+C]. While various compositions correspond to various lowest-energy packing factors both below and above 0.28, the N2 formation is non-negligible when the packing factor is below 0.28 regardless of the composition. The driving force toward N2 formation at a given packing factor (lower than 0.28) decreases with increasing B content. The theoretical densities and especially the maximum N contents (predicted without any fitting parameters, only by reproducing the material formation process) are in very good agreement with the experiment. Because as high N content as possible is crucial for numerous functional properties of Si-B-C-N, the results are useful for the design of these technologically important nitrides (including knowing when the content of bonded N can be enhanced without any tradeoff/can be enhanced at a cost of unbonded N2/cannot be enhanced), their preparation (e.g., conditions for N2 implantation and diffusion), knowing when to use characterization techniques (e.g., vibrational spectroscopy) which can distinguish bonded and unbonded N, and identification of what is or is not possible to achieve (including preparation of crystalline phases such as β-C3N4) in this field.
Funding
This research was funded by the Grant Agency of the Czech Republic under Project No. 19-14011S.
Institutional Review Board Statement
Not applicable.
Informed Consent Statement
Not applicable.
Data Availability Statement
The data that support the findings of this study are available from the author upon reasonable request.
Acknowledgments
Computational resources were provided by the National Grid Infrastructure MetaCentrum (Czech Republic) through Project No. LM2018140.
Conflicts of Interest
The author declares no conflict of interest. The funders had no role in the design of the study; in the collection, analyses, or interpretation of data; in the writing of the manuscript, or in the decision to publish the results.
References
- Riedel, R.; Klenzle, A.; Dressler, W.; Ruwisch, L.; Bill, J.; Aldinger, F. A Silicoboron Carbonitride Ceramic Stable to 2000 °C. Nature 1996, 382, 796–798. [Google Scholar] [CrossRef]
- Baldus, H.P.; Jansen, M. Novel High-Performance Ceramics-Amorphous Inorganic Networks from Molecular Precursors. Angew. Chem. Int. Ed. 1997, 36, 328–343. [Google Scholar] [CrossRef]
- Rooke, M.A.; Sherwood, P.M.A. Surface Studies of Potentially Oxidation Protective Si-B-N-C Films for Carbon Fibers. Chem. Mater. 1997, 9, 285–296. [Google Scholar] [CrossRef]
- Vlcek, J.; Potocky, S.; Cizek, J.; Houska, J.; Kormunda, M.; Zeman, P.; Perina, V.; Zemek, J.; Setsuhara, Y.; Konuma, S. Reactive Magnetron Sputtering of Hard Si-B-C-N Films with a High-temperature Oxidation Resistance. J. Vac. Sci. Technol. A 2005, 23, 1513–1522. [Google Scholar] [CrossRef]
- Vijayakumar, A.; Warren, A.P.; Todi, R.M.; Sundaram, K.B. Photoluminescence from RF Sputtered SiCBN Thin Films. J. Mater. Sci. Mater. Electron. 2009, 20, 144–148. [Google Scholar] [CrossRef]
- Vishnaykov, V.M.; Ehiasarian, A.P.; Vishnaykov, V.V.; Hovsepian, P.; Colligon, J.S. Amorphous Boron Containing Silicon Carbo-Nitrides Created by Ion Sputtering. Surf. Coat. Technol. 2011, 206, 149–154. [Google Scholar] [CrossRef] [Green Version]
- Zhang, P.; Jia, D.; Yang, Z.; Duan, X.; Zhou, Y. Progress of a Novel Non-Oxide Si-B-C-N Ceramic and its Matrix Composites. J. Adv. Ceram. 2012, 1, 157–178. [Google Scholar] [CrossRef]
- Kiryukhantsev-Korneev, P.V.; Sheveyko, A.N.; Levashov, E.A.; Shtansky, D.V. Investigation of the Si–B–C–N Coatings Deposited by Magnetron Sputtering of SiBC targets. Russ. J. Non-ferr. Met. 2015, 56, 540–547. [Google Scholar] [CrossRef]
- Zhao, G.; Hu, P.; Zhou, S.; Chen, G.; An, Y.; Cheng, Y.; An, J.; Zhang, X.; Han, W. Ordered Silica Nanoparticles Grown on a Three-Dimensional Carbon Fiber Architecture Substrate with Siliconborocarbonitride Ceramic as a Thermal Barrier Coating. ACS Appl. Mater. Interfaces 2016, 8, 4216–4225. [Google Scholar] [CrossRef]
- Viard, A.; Fonblanc, D.; Lopez-Ferber, D.; Schmidt, M.; Lale, A.; Durif, C.; Balestrat, M.; Rossignol, F.; Weinmann, M.; Riedel, R.; et al. Polymer Derived Si–B–C–N Ceramics: 30 Years of Research. Adv. Eng. Mater. 2018, 20, 1800360. [Google Scholar] [CrossRef]
- Ji, X.; Wang, S.; Shao, C.; Wang, H. High-Temperature Corrosion Behavior of SiBCN Fibers for Aerospace Applications. ACS Appl. Mater. Interfaces 2018, 10, 19712–19720. [Google Scholar] [CrossRef]
- Jia, D.; Liang, B.; Yang, Z.; Zhou, Y. Metastable Si-B-C-N Ceramics and Their Matrix Composites Developed by Inorganic Route Based on Mechanical Alloying: Fabrication, Microstructures, Properties and Their Relevant Basic Scientific Issues. Prog. Mater. Sci. 2018, 98, 1–67. [Google Scholar] [CrossRef]
- Luo, C.; Jiao, T.; Gu, J.; Tang, Y.; Kong, J. High-Temperature Stable and Metal-Free Electromagnetic Wave-Absorbing SiBCN Ceramics Derived from Carbon-Rich Hyperbranched Polyborosilazanes. ACS Appl. Mater. Interfaces 2018, 10, 28051–28061. [Google Scholar] [CrossRef] [PubMed]
- Shao, G.; Jiang, J.; Jiang, M.; Su, J.; Liu, W.; Wang, H.; Xu, H.; Lu, H.; Zhang, R. Polymer-derived SiBCN Ceramic Pressure Sensor with Excellent Sensing Performance. J. Adv. Ceram. 2020, 9, 374–379. [Google Scholar] [CrossRef]
- Chen, S.; Zhang, Q.; Luan, X.; Yu, R.; Zhang, S.; Cheng, L. Sapphire Optical Fiber with SiBCN Coating Prepared by Chemical Vapor Deposition for High-Temperature Sensing Applications. Thin Solid Film. 2020, 709, 138242. [Google Scholar] [CrossRef]
- Hanniet, Q.; Boussmen, M.; Barés, J.; Huon, V.; Iatsunskyi, I.; Coy, E.; Bechelany, M.; Gervais, C.; Voiry, D.; Miele, P.; et al. Investigation of Polymer-Derived Si–(B)–C–N Ceramic / Reduced Graphene Oxide Composite Systems as Active Catalysts Towards the Hydrogen Evolution Reaction. Sci. Rep. 2020, 10, 22003. [Google Scholar] [CrossRef] [PubMed]
- Houska, J.; Vlcek, J.; Potocky, S.; Perina, V. Influence of Substrate Bias Voltage on Structure and Properties of Hard Si–B–C–N Films Prepared by Reactive Magnetron Sputtering. Diam. Relat. Mater. 2007, 16, 29–36. [Google Scholar] [CrossRef]
- Kalas, J.; Vernhes, R.; Hreben, S.; Vlcek, J.; Klemberg-Sapieha, J.E.; Martinu, L. High-temperature Stability of the Mechanical and Optical Properties of Si-B-C-N Films Prepared by Magnetron Sputtering. Thin Solid Film. 2009, 518, 174–179. [Google Scholar] [CrossRef]
- Houska, J. Ageing Resistance of SiBCN Ceramics. Ceram. Int. 2015, 41, 7921–7928. [Google Scholar] [CrossRef]
- Ramakrishnan, P.A.; Wang, Y.T.; Balzar, D.; An, L.; Haluschka, C.; Riedel, R.; Hermann, A.M. Silicoboron–Carbonitride Ceramics: A class of High-Temperature, Dopable Electronic Materials. Appl. Phys. Lett. 2011, 78, 3076–3078. [Google Scholar] [CrossRef]
- Petrman, V.; Houska, J.; Kos, S.; Calta, P.; Vlcek, J. Effect of Nitrogen Content on Electronic Structure and Properties of SiBCN Materials. Acta Mater. 2011, 59, 2341–2349. [Google Scholar] [CrossRef]
- Yin, X.; Kong, L.; Zhang, L.; Cheng, L.; Travitzky, N.; Greil, P. Electromagnetic Properties of Si–C–N Based Ceramics and Composites. Int. Mater. Rev. 2014, 59, 326–355. [Google Scholar] [CrossRef]
- Vijayakumar, A.; Todi, R.M.; Sundaram, K.B. Amorphous SiCBN-based Metal-Semiconductor-Metal Photodetector for High-Temperature Applications. IEEE Electron Device Lett. 2007, 28, 713–715. [Google Scholar] [CrossRef]
- Benaissa, K.; Yang, J.Y.; Crenshaw, D.; Williams, B.; Sridhar, S.; Ai, J.; Boselli, G.; Zhao, S.; Tang, S.; Ashburn, S.; et al. RF CMOS on High-Resistivity Substrates for System-on-Chip Applications. IEEE Trans. Electron Devices 2003, 50, 567–576. [Google Scholar] [CrossRef]
- Vlcek, J.; Calta, P.; Steidl, P.; Zeman, P.; Cerstvy, R.; Houska, J.; Kohout, J. Pulsed Reactive Magnetron Sputtering of High-Temperature Si–B–C–N Films with High Optical Transparency. Surf. Coat. Technol. 2013, 226, 34–39. [Google Scholar] [CrossRef]
- Hegemann, D.; Riedel, R.; Oehr, C. PACVD-Derived Thin Films in the System Si-B-C-N. Chem. Vap. Depos. 1999, 5, 61–65. [Google Scholar] [CrossRef]
- Li, J.; Zhao, M.; Liu, Y.; Chai, N.; Ye, F.; Qin, H.; Cheng, L.; Zhang, L. Microstructure and Dielectric Properties of LPCVD/CVI-SiBCN Ceramics Annealed at Different Temperatures. Materials 2017, 10, 655. [Google Scholar] [CrossRef] [PubMed] [Green Version]
- Houska, J.; Vlcek, J.; Hreben, S.; Bilek, M.M.M.; McKenzie, D.R. Effect of B and the Si/C Ratio on High-temperature Stability of Si-B-C-N Materials. Europhys. Lett. 2006, 76, 512–518. [Google Scholar] [CrossRef]
- Muller, A.; Gerstel, P.; Weinmann, M.; Bill, J.; Aldinger, F. Correlation of Boron Content and High Temperature Stability in Si-B-C-N Ceramics. J. Eur. Ceram. Soc. 2000, 20, 2655–2659. [Google Scholar] [CrossRef]
- Houska, J. Maximum N Content in a-CNx by Ab-initio Simulations. Acta Mater. 2019, 174, 189–194. [Google Scholar] [CrossRef]
- Eftekhari, G. Reactively Sputtered Titanium Nitride Schottky Contacts on n-GaAs and Their Thermal Stability. Semicond. Sci. Technol. 1996, 11, 285–288. [Google Scholar] [CrossRef]
- Filatova, E.O.; Sakhonenkov, S.S.; Konashuk, A.S.; Kasatikov, S.A.; Afanasev, V.V. Inhibition of Oxygen Scavenging by TiN at the TiN/SiO2 Interface by Atomic-layer-deposited Al2O3 Protective Interlayer. J. Phys. Chem. C 2019, 123, 22335–22344. [Google Scholar] [CrossRef]
- Marks, N.A. Evidence for Subpicosecond Thermal Spikes in the Formation of Tetrahedral Amorphous Carbon. Phys. Rev. B 1997, 56, 2441–2446. [Google Scholar] [CrossRef]
- Han, J.C.; Gao, W.; Zhu, J.Q.; Meng, S.H.; Zheng, W.T. Density-functional Theory Study of the Microstructure, Electronic Structure, and Optical Properties of Amorphous Carbon. Phys. Rev. B 2007, 75, 155418. [Google Scholar] [CrossRef]
- Bilek, M.M.M.; McKenzie, D.R.; McCulloch, D.G.; Goringe, C.M. Ab Initio Simulation of Structure in Amorphous Hydrogenated Carbon. Phys. Rev. B 2000, 62, 3071–3077. [Google Scholar] [CrossRef]
- Merchant, A.R.; McKenzie, D.R.; McCulloch, D.G. Ab Initio Simulations of Amorphous Carbon Nitrides. Phys. Rev. B 2001, 65, 024208. [Google Scholar] [CrossRef]
- Valladares, A.A.; Alvarez-Ramirez, F. Bonding in Amorphous Carbon-nitrogen Alloys: A First Principles Study. Phys. Rev. B 2006, 73, 024206. [Google Scholar] [CrossRef]
- Fitzhenry, P.; Bilek, M.M.M.; Marks, N.A.; Cooper, N.C.; McKenzie, D.R. Wannier Function Analysis of Silicon-carbon Alloys. J. Phys. Condens. Matter 2003, 15, 165–173. [Google Scholar] [CrossRef]
- Ivashchenko, V.I.; Kozak, A.O.; Porada, O.K.; Ivashchenko, L.A.; Sinelnichenko, O.K.; Lytvynb, O.S.; Tomila, T.V.; Malakhova, V.J. Characterization of SiCN Thin Films: Experimental and Theoretical Investigations. Thin Solid Film. 2014, 569, 57–63. [Google Scholar] [CrossRef]
- Kroll, P. Modelling Polymer-derived Ceramics. J. Eur. Ceram. Soc. 2005, 25, 163–174. [Google Scholar] [CrossRef]
- Houska, J. Maximum Achievable N Content in Atom-by-atom Growth of Amorphous Si-C-N. ACS Appl. Mater. Inter. 2020, 12, 41666–41673. [Google Scholar] [CrossRef]
- Sun, Z.; Zhang, X.; Zhu, R.; Dong, X.; Xu, J.; Wang, B. Facile Synthesis of Visible Light-Induced g-C3N4/Rectorite Composite for Efficient Photodegradation of Ciprofloxacin. Materials 2018, 11, 2452. [Google Scholar] [CrossRef] [Green Version]
- CPMD 3.13.1, IBM Corp. 1990–2008, MPI fur Festkorperforschung Stuttgart 1997–2001. Available online: www.cpmd.org (accessed on 1 September 2021).
- Resta, R. Quantum-mechanical Position Operator in Extended Systems. Phys. Rev. Lett. 1998, 80, 1800–1803. [Google Scholar] [CrossRef] [Green Version]
- Yen, B.K.; White, R.L.; Waltman, R.J.; Dai, Q.; Miller, D.C.; Kellock, A.J.; Marchon, B.; Kasai, P.H.; Toney, M.F.; York, B.R.; et al. Microstructure and Properties of Ultrathin Amorphous Silicon Nitride Protective Coating. J. Vac. Sci. Technol. A 2003, 21, 1895–1904. [Google Scholar] [CrossRef] [Green Version]
- Vlcek, J.; Kormunda, M.; Cizek, J.; Soukup, Z.; Perina, V.; Zemek, J. Reactive Magnetron Sputtering of Si-C-N Films with Controlled Mechanical and Optical Properties. Diam. Relat. Mater. 2003, 12, 1287–1294. [Google Scholar] [CrossRef]
- Saarilahti, J.; Rauhala, E. Interactive Personal-computer Data Analysis of Ion Backscattering Spectra. Nucl. Instrum. Method Phys. Res. B 1992, 64, 734–738. [Google Scholar] [CrossRef]
- Mayer, M. SIMNRA, User’s Guide; Forschungscentrum Julich, Institute for Plasma Physics: Jülich, Germany, 1998. [Google Scholar]
- Houska, J.; Warschkow, O.; Bilek, M.M.M.; McKenzie, D.R.; Vlcek, J.; Potocky, S. The effect of argon on the structure of amorphous SiBCN materials: An experimental and ab initio study. J. Phys. Condens. Matter 2006, 18, 2337–2348. [Google Scholar] [CrossRef]
- Liu, A.Y.; Cohen, M.L. Structural Properties and Electronic Structure of Low-compressibility Materials: β-Si3N4 and Hypothetical β-C3N4. Phys. Rev. B 1990, 41, 10727–10734. [Google Scholar] [CrossRef]
- Ajmal, H.M.S.; Khan, F.; Huda, N.U.; Lee, S.; Nam, K.; Kim, H.Y.; Eom, T.-H.; Kim, S.D. High-Performance Flexible Ultraviolet Photodetectors with Ni/Cu-Codoped ZnO Nanorods Grown on PET Substrates. Nanomaterials 2019, 9, 1067. [Google Scholar] [CrossRef] [Green Version]
- Ajmal, H.M.S.; Khan, F.; Nam, K.; Kim, H.Y.; Kim, S.D. Ultraviolet Photodetection Based on High-Performance Co-Plus-Ni Doped ZnO Nanorods Grown by Hydrothermal Method on Transparent Plastic Substrate. Nanomaterials 2020, 10, 1225. [Google Scholar] [CrossRef]
- Vlcek, J.; Kormunda, M.; Cizek, J.; Perina, V.; Zemek, J. Influence of Nitrogen-Argon Gas Mixtures on Reactive Magnetron Sputtering of Hard Si-C-N Films. Surf. Coat. Technol. 2002, 160, 74–81. [Google Scholar] [CrossRef]
Figure 1.
Panels (a–c) show the compositions simulated. There are 16 different [Si]/[B]/[C] ratios (18 lines of datapoints including SiNx and CNx which are shown in two panels) and 13 [N]total values at each of these ratios. Some of the lines corresponding to B-containing compositions are more noisy because of keeping even number of electrons in the simulation cell. Panels (d,e) constitute a verification of the simulation technique and of the algorithm which allows the atoms to form unbonded N2. The datapoints show calculated lowest-energy inverse atomic density (V) of CNx (panel (d)) and SiNx (panel (e)) [41]. The black lines are fits to experimental densities of CNx (Equation (1) [37]) and SiNx (Equation (2) [45]). The error bars (mainly due to limited simulation cell size) represent the smallest intervals of V values which include simulations leading to (i) the two lowest energies and (ii) all other energies within 20 meV/at. from Emin, if there are any.
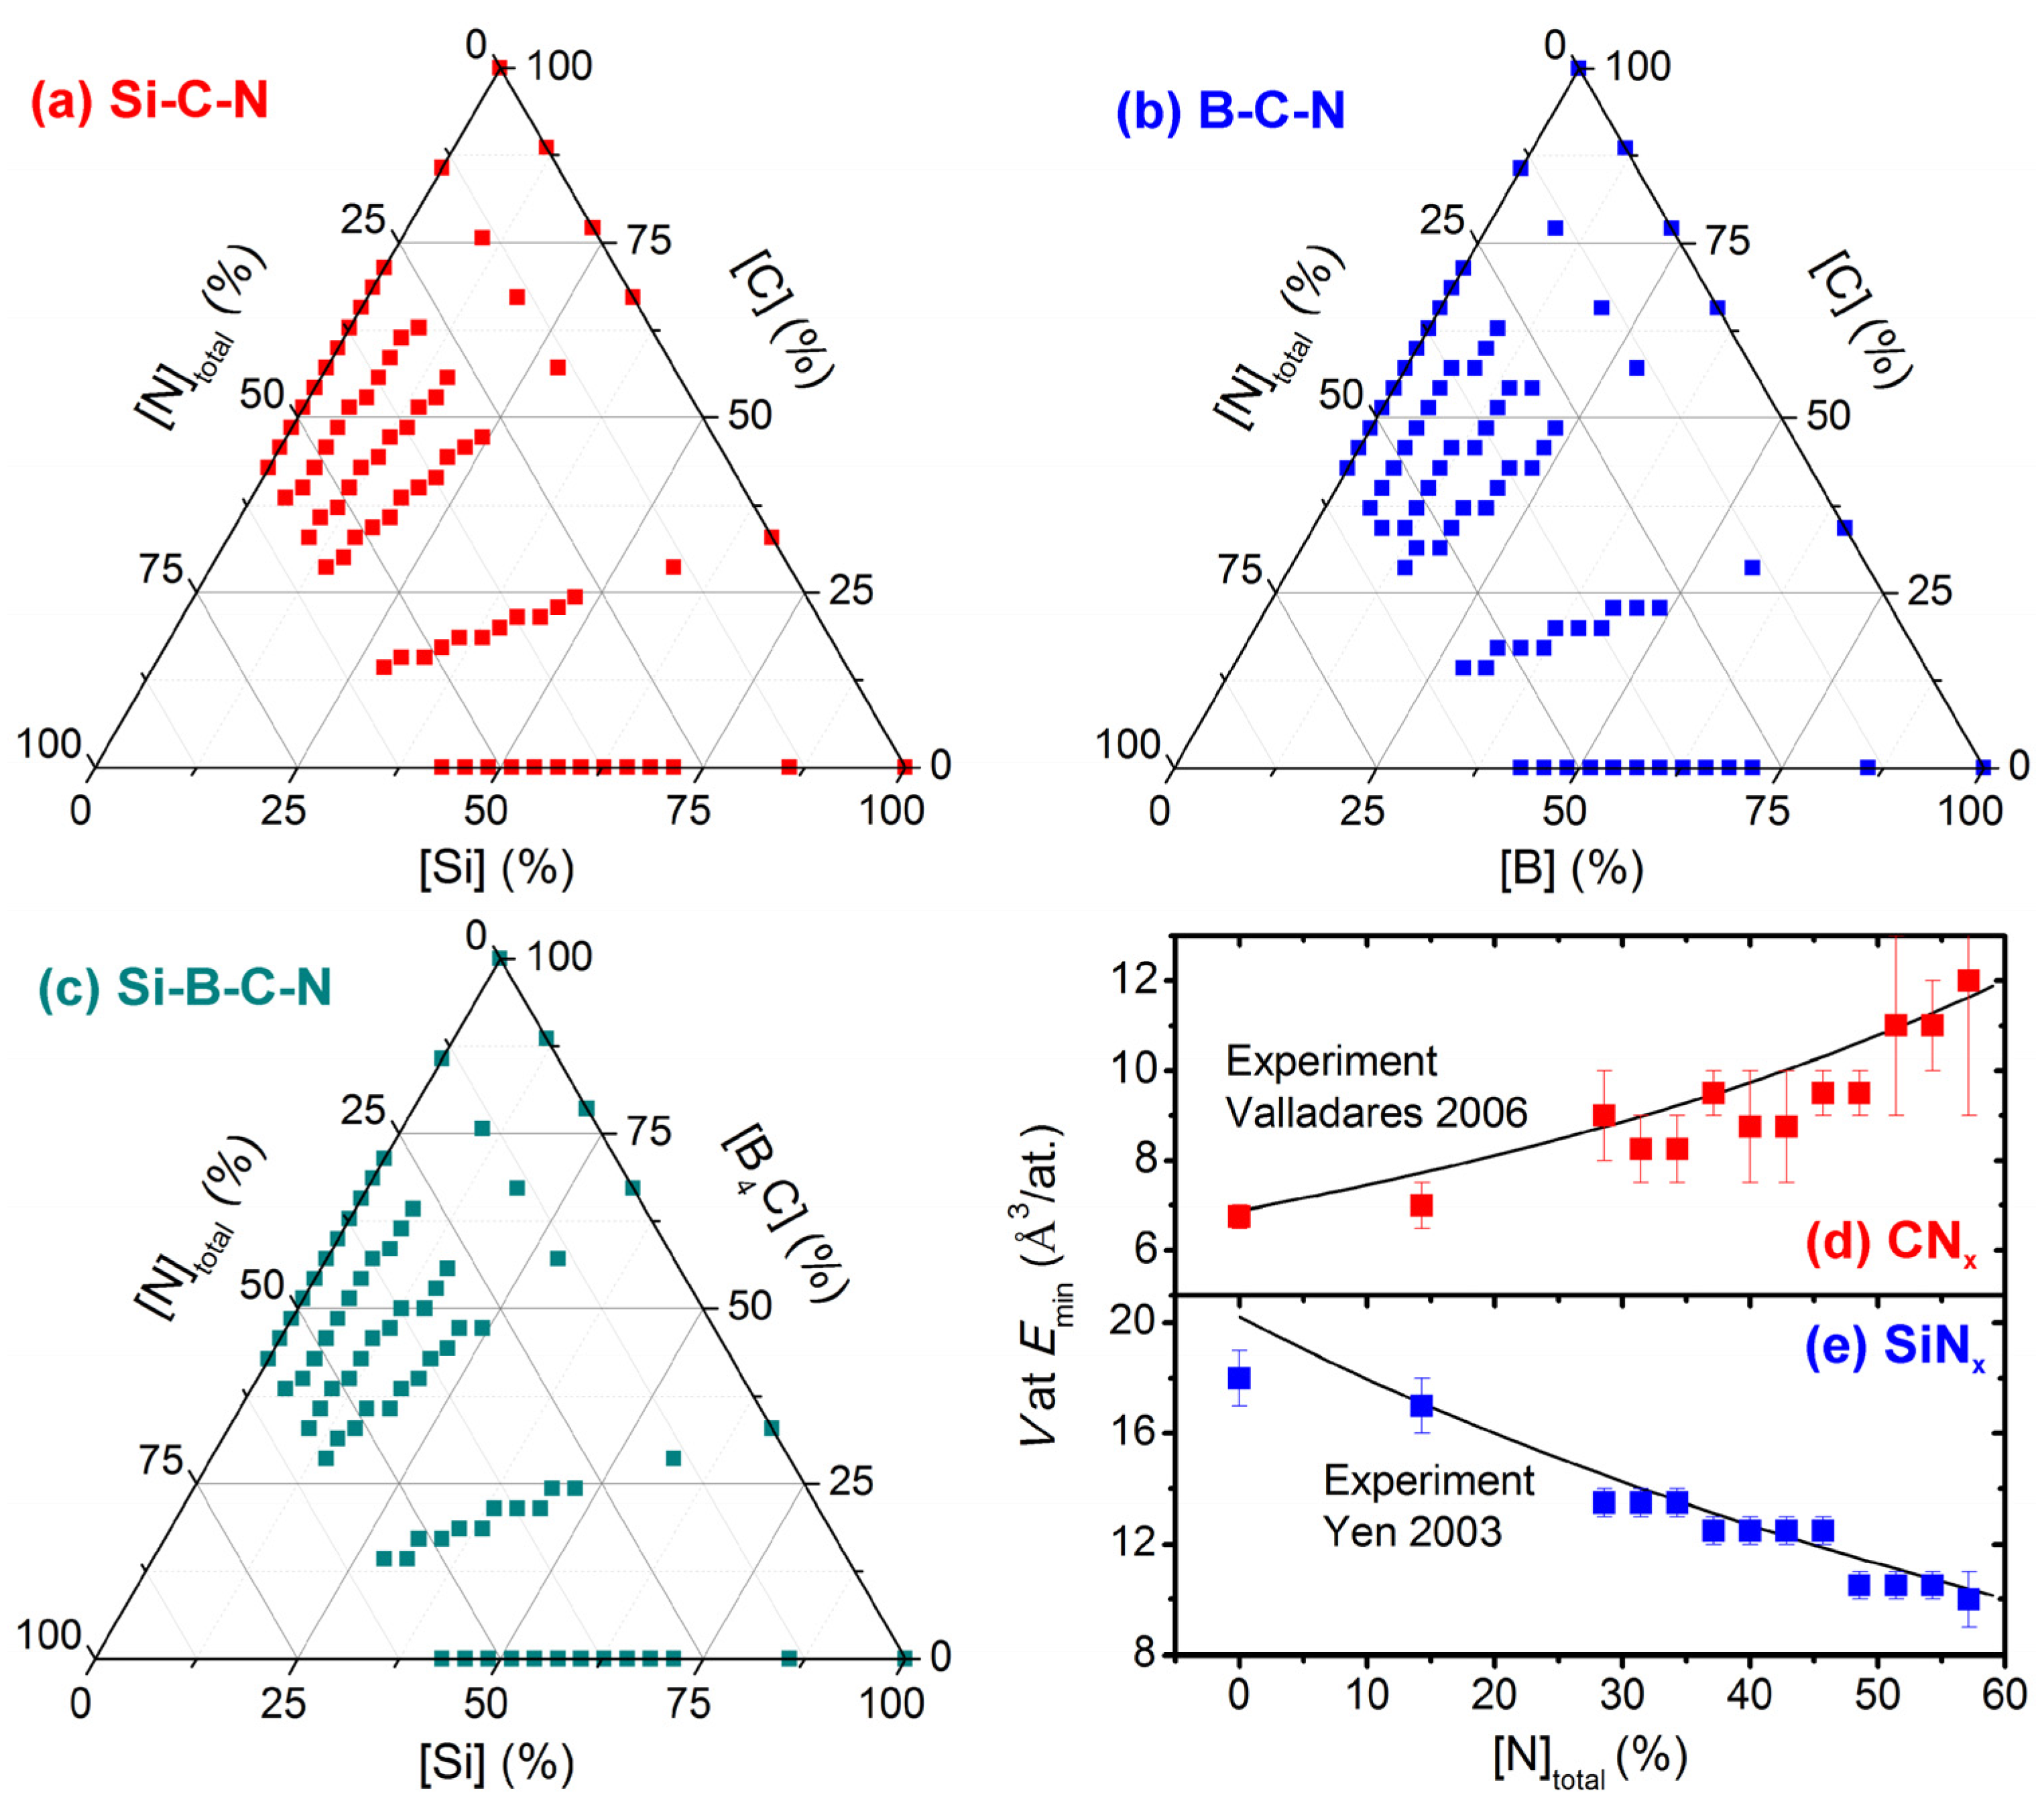
Figure 2.
Panel (a) shows an example of the dependence of energy (E-Emin; squares; left axis), number of unbonded N2 molecules ([N2]; full balls; right axis) and number of triple N≡N bonds (empty balls; right axis) on the inverse atomic density (V) for the composition of the 70-atom cell Si7B18C5N40. The inset is a snapshot taken at V = 9 Å3 (red Si, orange B, blue C, yellow N, small black WFCs). Panels (b,c) show the maximum achievable content of N bonded in Si-B-C-N networks ([N]network) without unbonded N2, i.e., at [N]network ≈ [N]total (less than one N2 per cell; panel (b)) and at a presence of unbonded N2, i.e., at [N]network < [N]total (panel (c)).
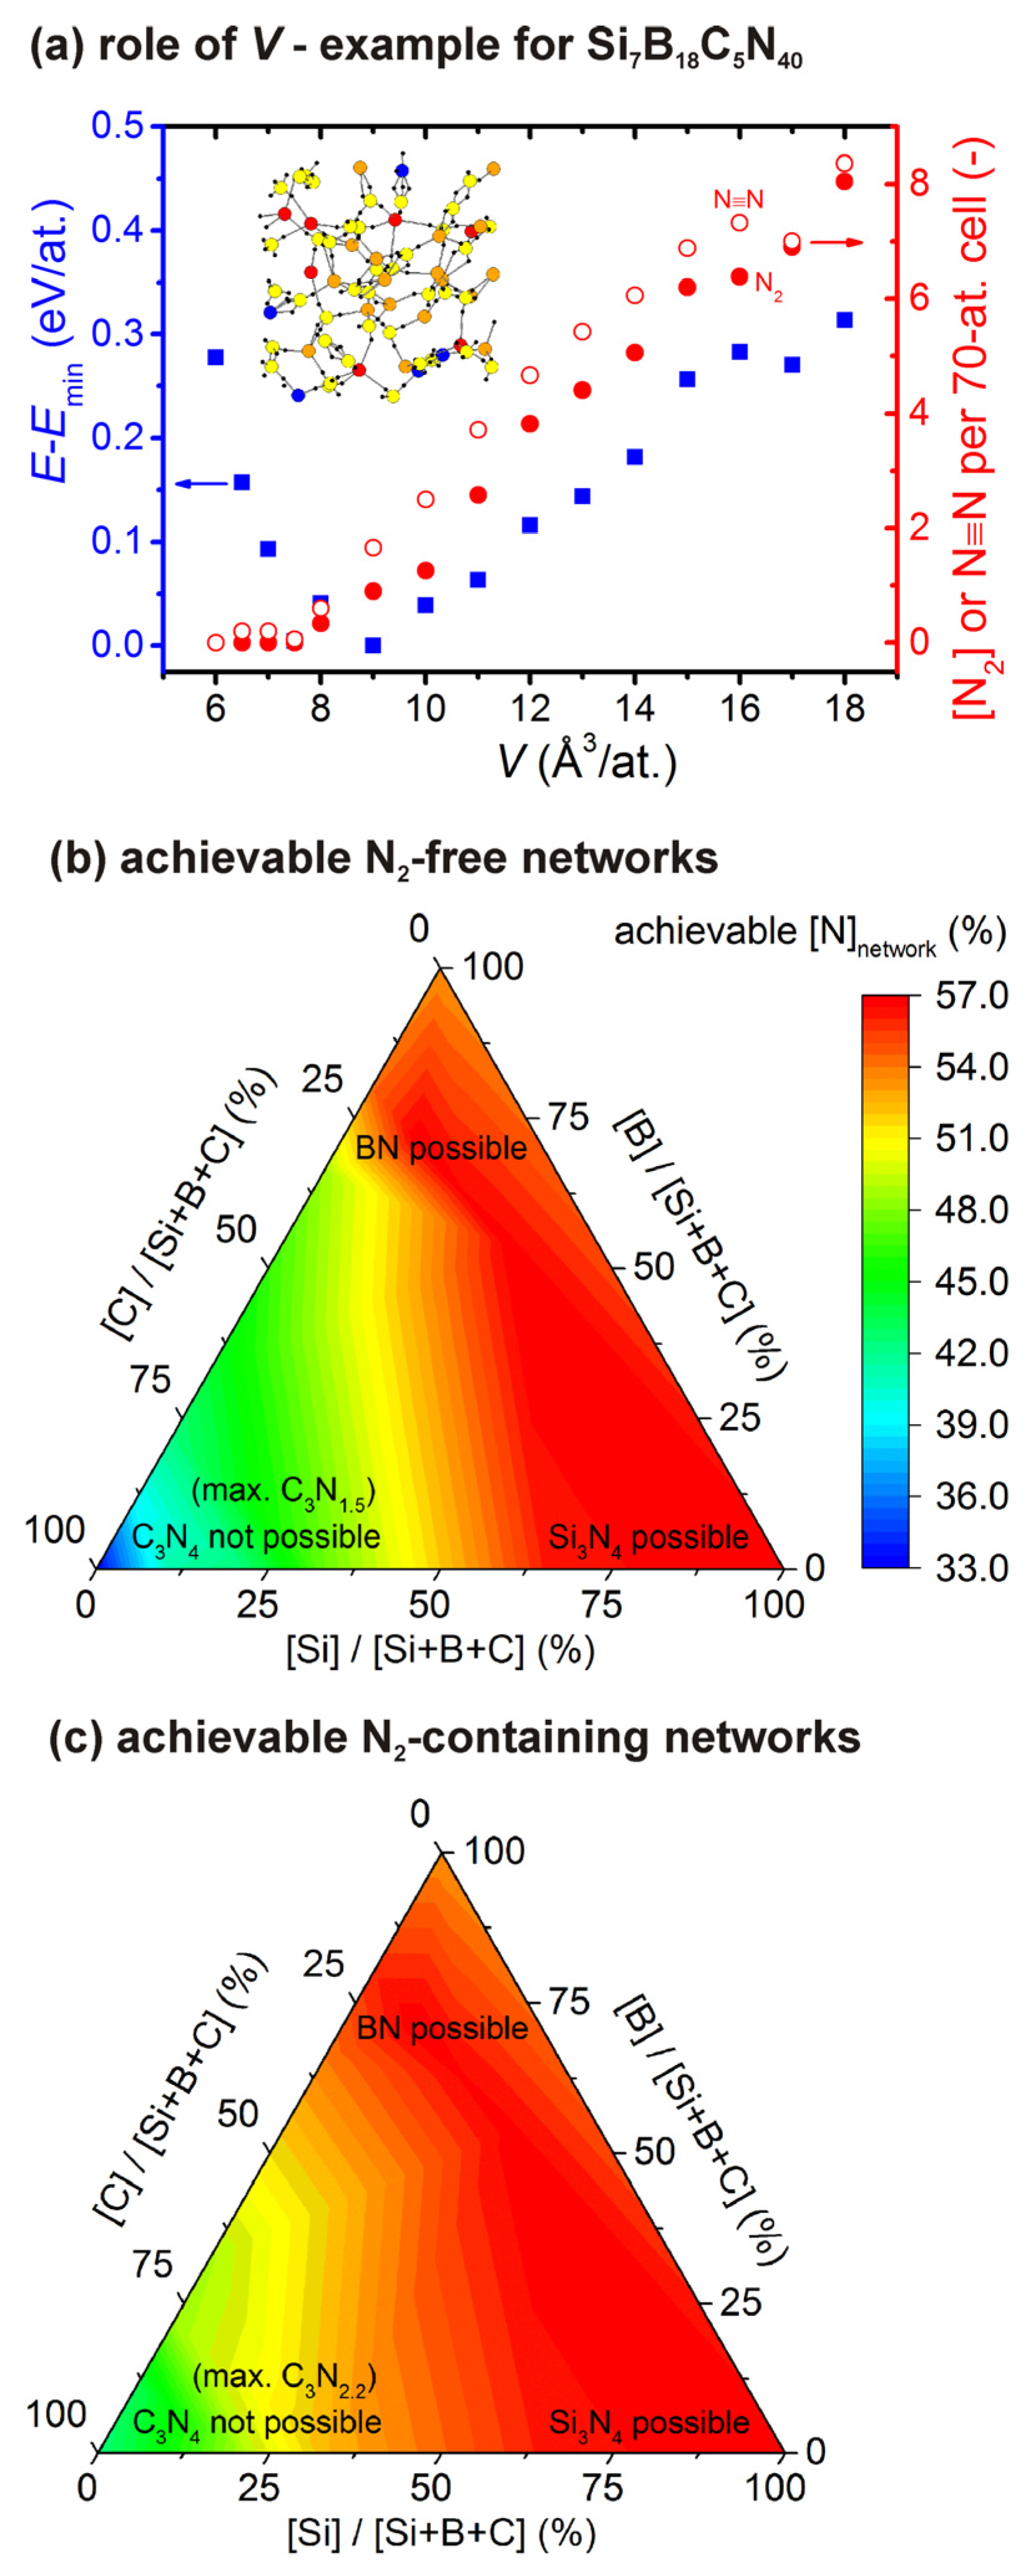
Figure 3.
Panels (a,b) show lowest-energy inverse atomic density (V) and packing factor (p), respectively, of Si-B-C-N materials. The panels constitute an example for [N]total = 54%, leading to similar V of CNx (which increases with [N]total—Figure 1d) and V of SiNx (which decreases with [N]total—Figure 1e). Panel (c) shows the N2 formation in terms of the number of unbonded N2 molecules ([N2], left axis) and the resulting content of N which remains bonded in the Si-B-C-N network ([N]network, right axis) as a function of p. The datapoints are shown for all 16 [Si]/[B]/[C] ratios, the highest [N]total value and all p (⇔ V) values considered. The black line connects [N]network = 0 (maximum [N2]) at p = 0 and [N2] = 0 (maximum [N]network) at p = 0.28 (critical value almost independent of [Si]/[B]/[C] and [N]total).
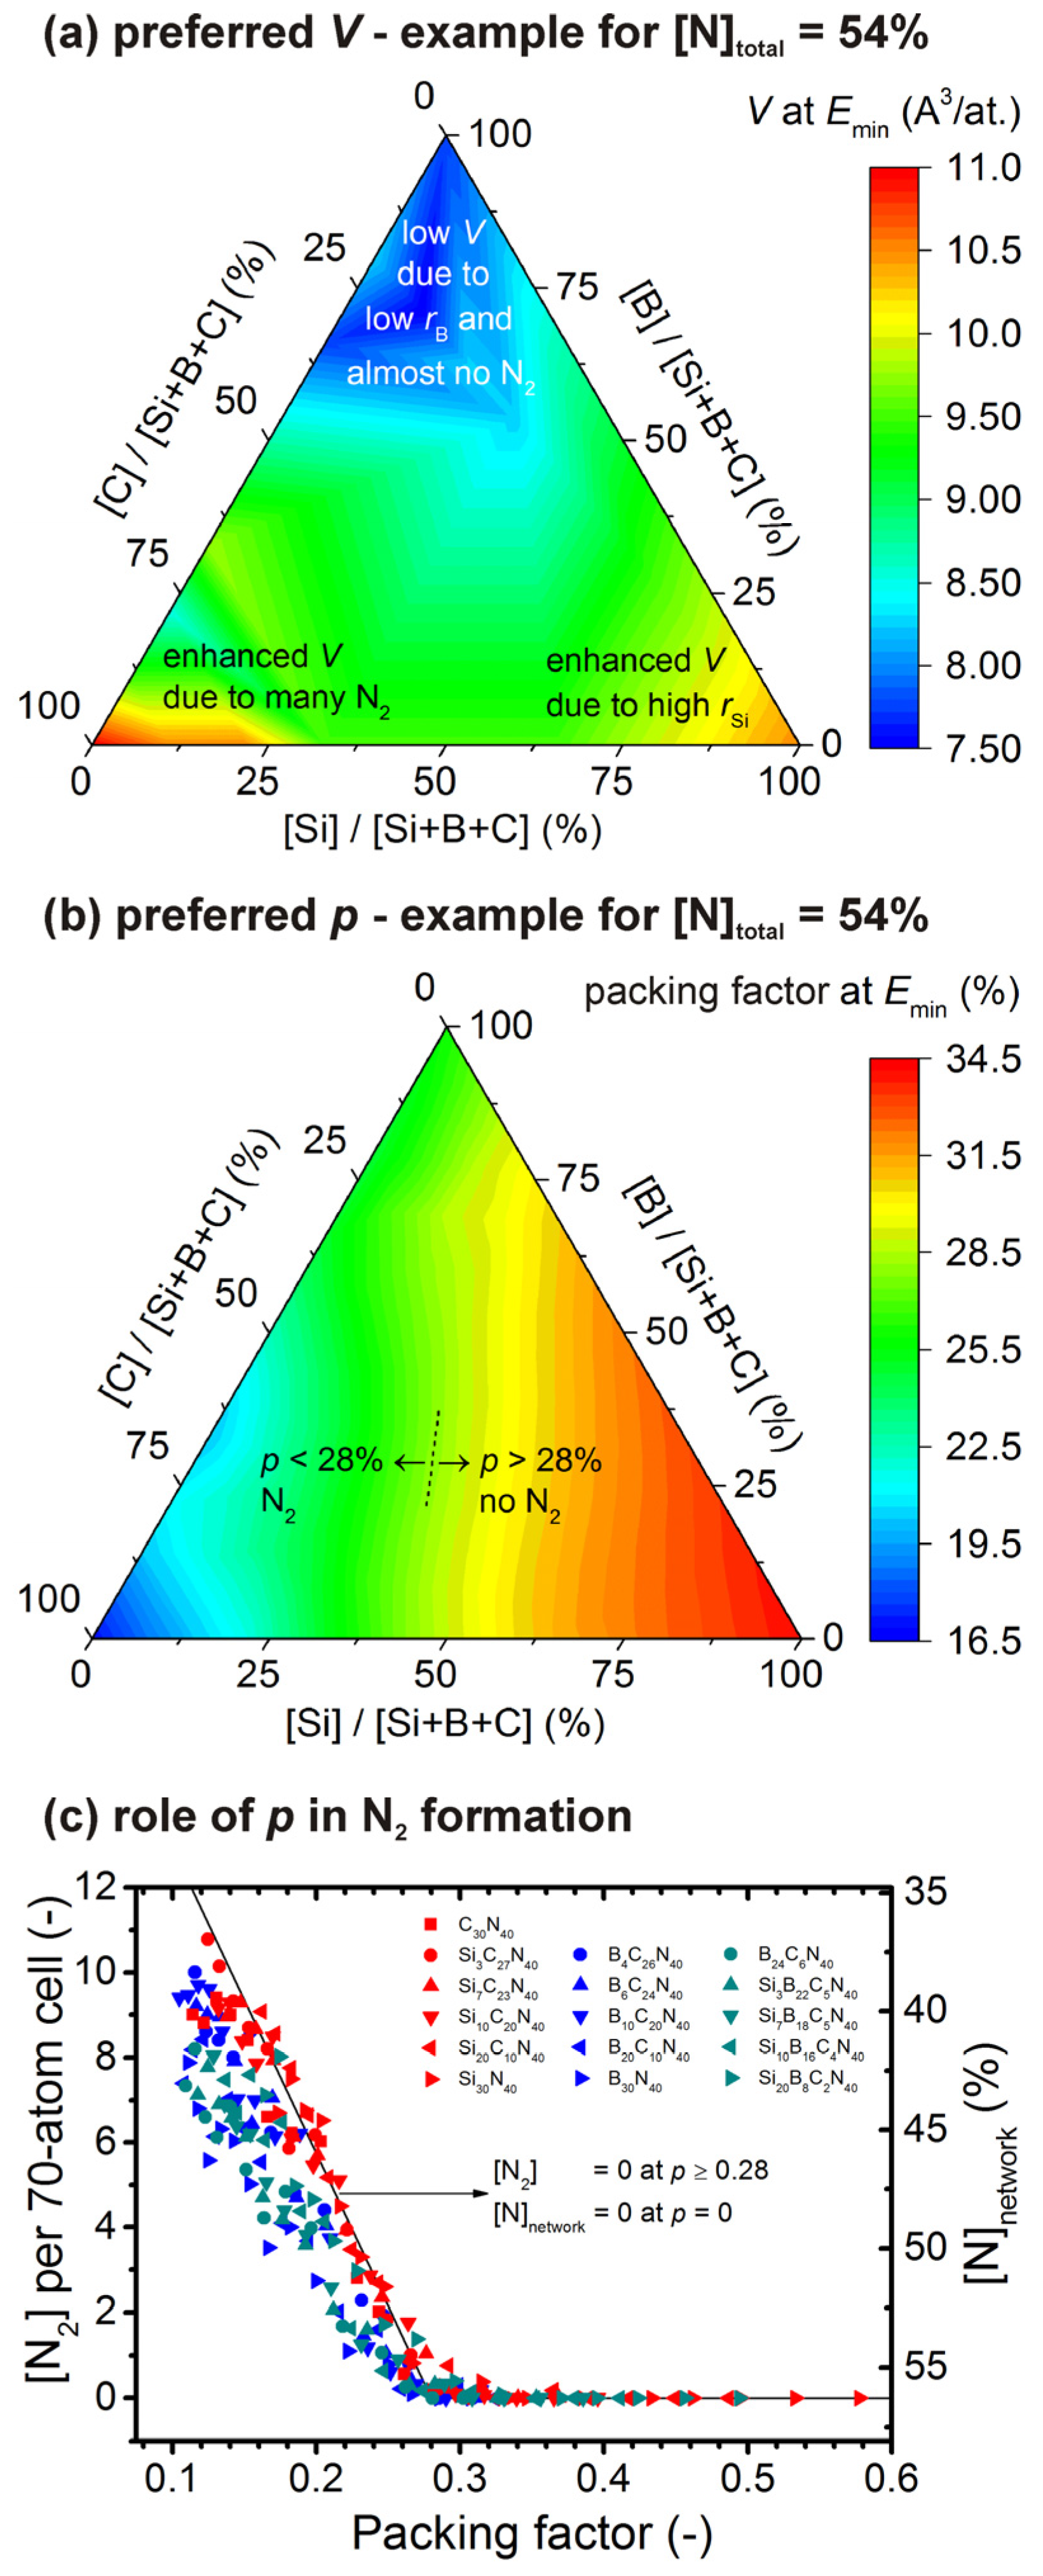
Figure 4.
Panel (a) shows experimental values of [N]total in Si-B-C-N (neglecting the impurities) prepared by reactive magnetron sputtering in 0.250 Pa of N2 + 0.250 Pa of Ar. The black balls correspond to compositions obtained using SixC100-x targets [46], SixB20C80-x targets [4] and Six(B4C)100-x targets [19] (bottom, middle and top dashed oval, respectively). Panel (b) compares these experimental values with those given by Equation (3). The squares are calculated maxima of [N]network (Figure 2b). The diagonal line represents Equation (3) (fitted using these calculated data). The balls are the aforementioned values of [N]total in Si-B-C-N (neglecting the impurities) obtained by reactive magnetron sputtering in 0.250 Pa of N2 + 0.250 Pa of Ar using SixC100-x, SixB20C80-x and Six(B4C)100-x targets (full balls [4,19,46]) or in 0.125–0.500 Pa of N2 at a fixed total pressure of 0.500 Pa using the Si40C60 target (empty balls [53]; this dependence is not vertical because of different ratios of sputtering yields of individual elements by N2+ and by Ar+).

Publisher’s Note: MDPI stays neutral with regard to jurisdictional claims in published maps and institutional affiliations. |
© 2021 by the author. Licensee MDPI, Basel, Switzerland. This article is an open access article distributed under the terms and conditions of the Creative Commons Attribution (CC BY) license (https://creativecommons.org/licenses/by/4.0/).
Share and Cite
MDPI and ACS Style
Houska, J. Maximum Achievable N Content in Atom-by-Atom Growth of Amorphous Si-B-C-N Materials. Materials 2021, 14, 5744. https://doi.org/10.3390/ma14195744
AMA Style
Houska J. Maximum Achievable N Content in Atom-by-Atom Growth of Amorphous Si-B-C-N Materials. Materials. 2021; 14(19):5744. https://doi.org/10.3390/ma14195744
Chicago/Turabian StyleHouska, Jiri. 2021. "Maximum Achievable N Content in Atom-by-Atom Growth of Amorphous Si-B-C-N Materials" Materials 14, no. 19: 5744. https://doi.org/10.3390/ma14195744
Note that from the first issue of 2016, this journal uses article numbers instead of page numbers. See further details here.