Article

In Situ Observation of the Tensile Deformation and Fracture Behavior of Ti–5Al–5Mo–5V–1Cr–1Fe Alloy with Different Microstructures

1
School of Materials Science and Engineering, Central South University, Changsha 410083, China
2
Advanced Research Center, Central South University, Changsha 410083, China
3
State Key Laboratory of Powder Metallurgy, Central South University, Changsha 410083, China
4
Hunan Engineering Research Center of Forming Technology and Damage Resistance Evaluation for High Efficiency Light Alloy Components, Hunan University of Science and Technology, Xiangtan 411201, China
*
Authors to whom correspondence should be addressed.
Materials 2021, 14(19), 5794; https://doi.org/10.3390/ma14195794
Submission received: 21 July 2021 / Revised: 17 September 2021 / Accepted: 29 September 2021 / Published: 3 October 2021
(This article belongs to the Special Issue Advances in High-Performance Non-ferrous Materials)

Abstract

:
The plastic deformation processes and fracture behavior of a Ti–5Al–5Mo–5V–1Cr–1Fe alloy with bimodal and lamellar microstructures were studied by room-temperature tensile tests with in situ scanning electron microscopy (SEM) observations. The results indicate that a bimodal microstructure has a lower strength but higher ductility than a lamellar microstructure. For the bimodal microstructure, parallel, deep slip bands (SBs) are first noticed in the primary α (αp) phase lying at an angle of about 45° to the direction of the applied tension, while they are first observed in the coarse lath α (αL) phase or its interface at grain boundaries (GBs) for the lamellar microstructure. The β matrix undergoes larger plastic deformation than the αL phase in the bimodal microstructure before fracture. Microcracks are prone to nucleate at the αp/β interface and interconnect, finally causing the fracture of the bimodal microstructure. The plastic deformation is mainly restricted to within the coarse αL phase at GBs, which promotes the formation of microcracks and the intergranular fracture of the lamellar microstructure.

1. Introduction

Due to their strength, corrosion resistance, and heat resistance, near-β-titanium alloys have been widely used in aerospace and automotive engineering as structural materials [1]. With the continuous progress of aerospace and automotive technology, more challenging requirements are imposed on the mechanical properties of titanium alloys [2]. The design of titanium alloys with better mechanical properties is therefore the focus of many studies [3,4,5,6].
Previous studies found that the mechanical properties of titanium alloys are closely related to the morphology and distribution of the α phase [7,8,9]. Two types of typical microstructure (bimodal and lamellar microstructures) can be obtained in titanium alloys by different heat treatments [10]. Many studies concerning the microstructure–property relationship of titanium alloys showed that bimodal variants have a higher ductility and lower strength than their lamellar counterparts [11,12,13]. Qin et al. [14] found that the yield strength (σ0.2) of lamellar variants reaches 1900 MPa while that of bimodal alloys is around 1600 MPa. Zheng et al. [15] found that the elongation of bimodal variants is 11.5–14.5% and that of lamellar alloys is 4.5–9.5%. Therefore, the microstructure plays an essential role in determining the mechanical properties of titanium alloys.
Many studies have been performed to reveal the essential mechanism underpinning the different mechanical properties of titanium alloys induced by bimodal and lamellar microstructures. Wu et al. [16] found that the higher ductility of bimodal alloys can be mainly attributed to the more numerous deformation mechanisms available to the equiaxed primary α phase (αp) in bimodal alloys (including dislocation slips, twins, and shear bands) than those of the α lath (αL) in lamellar structures. Some believed that the tensile fracture of near-β-titanium alloys is sensitive to micro-void nucleation. Qin et al. [17] found that the tensile fracture of lamellar alloys is a process of the initiation of nano-scale voids, followed by their growth and coalescence in the deformation band, and transgranular shearing. The reason for the formation of micro-voids is the stress concentration caused by the difference in the strength of the α phase and β matrix. Stress concentration at the GBs is derived from the precipitation of the αL phase along the α/β interface, which results in micro-void nucleation. This behavior is mainly responsible for the low ductility of lamellar alloys. Prior research into the deformation and properties of materials is based on ex situ test methods, which make it difficult to provide direct evidence of the deformation and fracture behavior; therefore, detailed information concerning the evolution of a microstructure, and its corresponding effect on the fracture process under tension, remains unclear.
Recently, in situ tensile SEM observation has become a powerful and effective tool to evaluate the deformation behavior from a microstructural perspective by capturing the microstructural evolution dynamically [18,19]. Huang et al. [20] indicated that localized stress concentration at the GBs derived from the geometric incompatibility between neighboring α grains was mainly responsible for microcrack formation in a Ti–6Al alloy. Zhang et al. [21] studied the deformation mechanism of a Ti–5Al–2Sn–2Zr–4Cr–4Mo alloy with a bimodal microstructure, implying that the αp had high compatibility of deformation and the slip line in the αp phase was the primary deformation mechanism. Shao et al. [22] found that microcracks were primarily initiated along the αL phase at the edges of the sample. To date, however, the essential mechanism of the effect of microstructure on the mechanical properties of titanium alloys remains unclear, which hinders any further attempts to improve the mechanical properties of alloys.
In this study, Ti–5Al–5Mo–5V–1Cr–1Fe alloy samples with bimodal and lamellar microstructures were prepared through heat treatments. Their room-temperature tensile deformation process and fracture behavior were monitored in real time by in situ SEM observations. On this basis, the aim of this work is to ascertain the essential effects of microstructure on the mechanism of tensile deformation and fracture of titanium alloys. The results of this work are expected to provide a basis for future improvement in the mechanical properties of such titanium alloys.

2. Materials and Methods
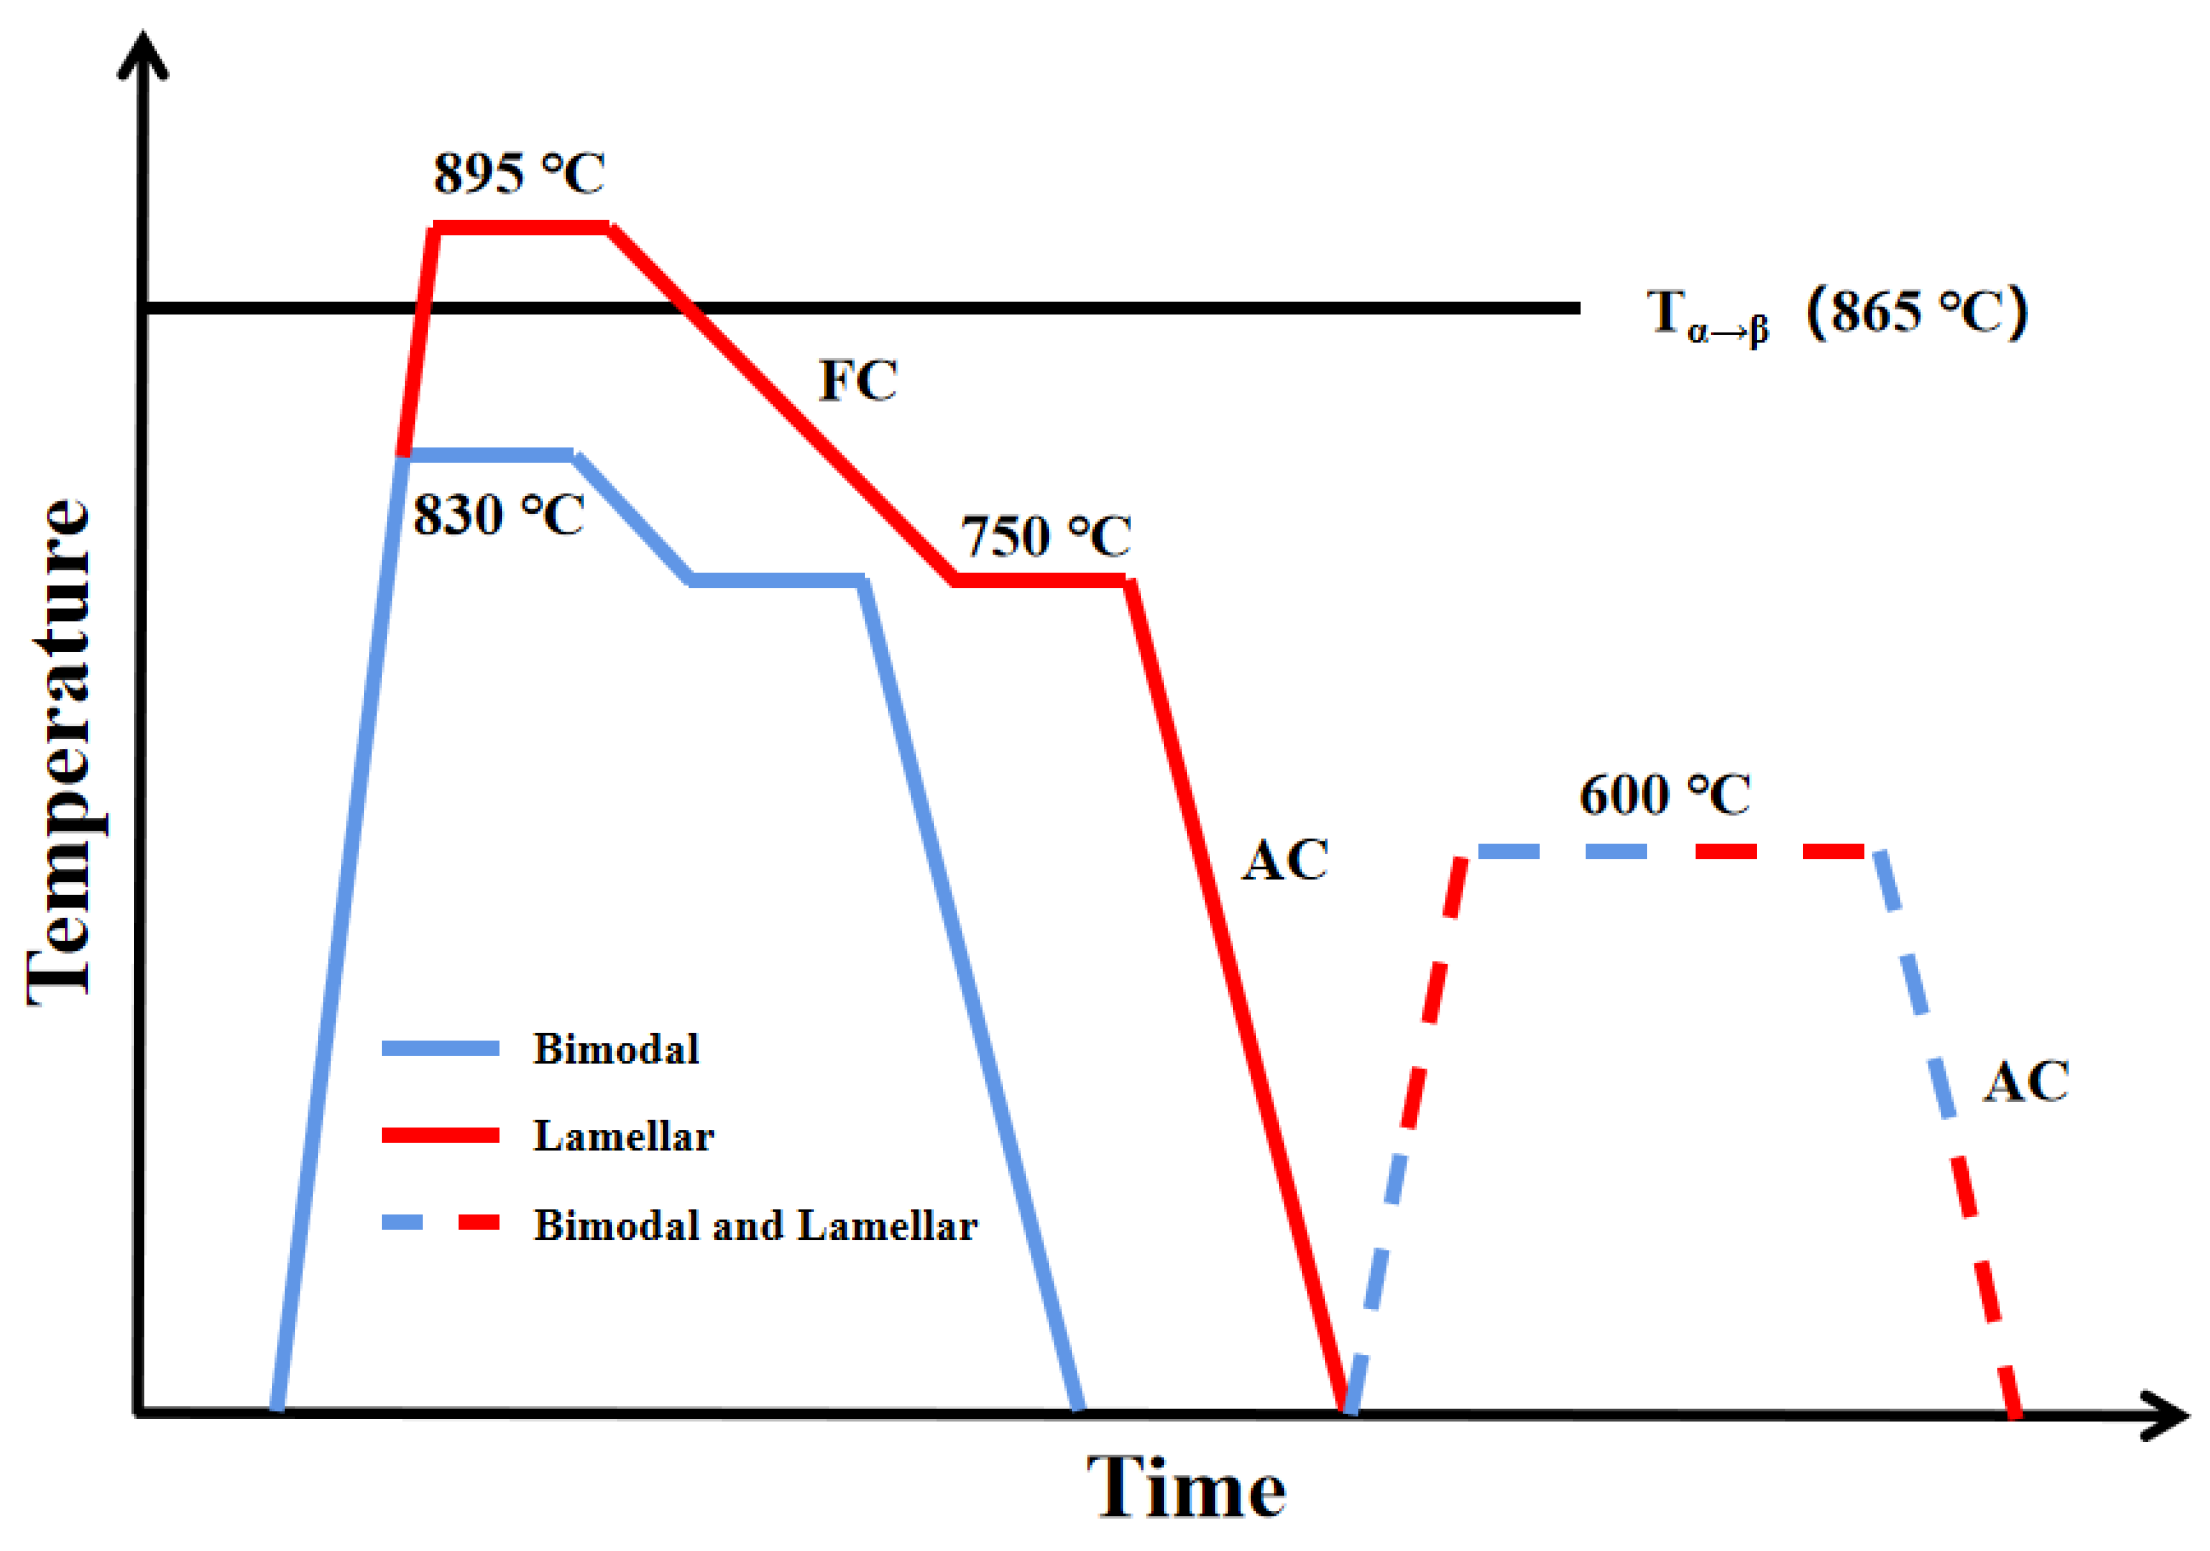
2.1. Materials

The as-received material in this study was a forged Ti–5Al–5Mo–5V–1Cr–1Fe alloy provided by Baoti Group Ltd (Baoji, China) as cuboidal specimens (98.0 mm in length, 20.0 mm in width, and 7.0 mm in height) with a nominal composition of 5.07% Al, 4.81% Mo, 4.74% V, 1.06% Fe, 0.95% Cr, and the rest Ti (all in wt%). The α + β/β transition temperature (Tα + ββ) of this alloy is about 865 °C.
To obtain the desired microstructure, two as-received cuboids were, respectively, solution-treated at 830 °C (below Tα + ββ) and 895 °C (above Tα + ββ) for 2 h. Then, these cuboids were cooled in a furnace (FC) to 750 °C and held for 2 h before air cooling (AC). Thereafter, they were aged at 600 °C for 8 h, before air cooling (AC) to room temperature (Figure 1).

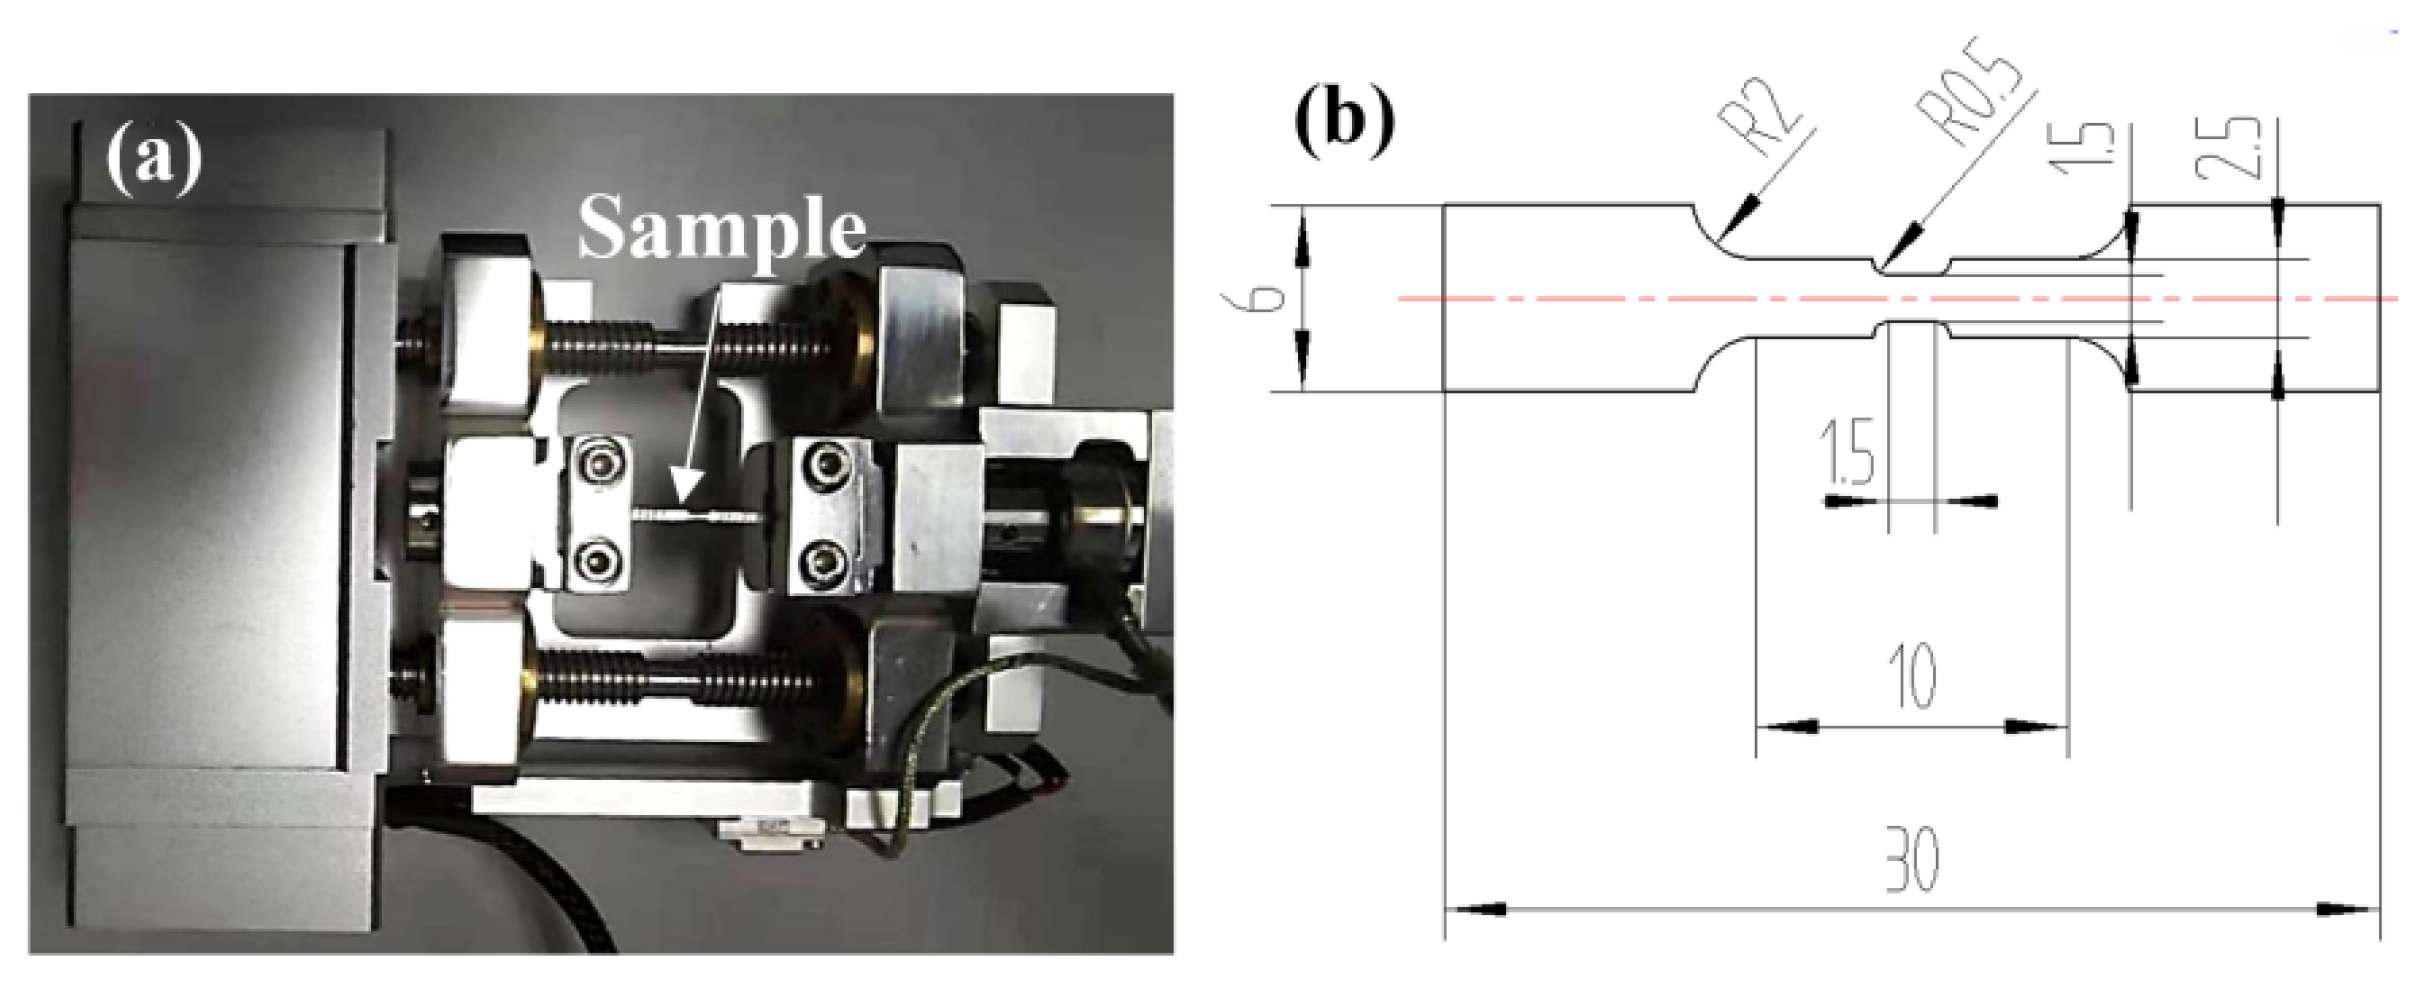
2.2. In Situ Tensile Test

The sample for the in situ tensile test was cut by wire-electrode cutting with a gauge length of 1.5 mm, a gauge width of 1.5 mm, and a thickness of 1.0 mm (Figure 2). It was mechanically polished using emery papers with SiC (5 μm, 3 µm, 1 µm, and 0.25 µm). Then, it was chemo-mechanically polished using Al2O3 (0.04 µm) suspension to remove the work-hardening resulting from previous mechanical polishing. A micro-stage (Figure 2a) and Mini MTS (Liweiauto Ltd., Hangzhou, China) controller (with a maximum load capacity of 2500 N) were employed to clamp the sample and control the tensile strain rate, respectively. The Mini MTS system was adopted to measure the mechanical properties of in situ samples. Before in situ testing, the sample was mechanically polished and then stretched at a speed of 1.5 μm/s at room temperature in vacuum.
Processes during the in situ tensile deformation in bimodal and lamellar microstructures were observed using a JSM-5600 field-emission gun SEM (JEOL Ltd., Tokyo, Japan) with an accelerating voltage of 15 kV. Several interruptions were allowed by the loading system during tensile testing: this allowed the load to be held while capturing the SEM micrographs, after which the tensile test was resumed from the same applied load and displacement at the same rate. Three repeated in situ tensile tests were carried out under each set of experimental conditions, and typical results were provided. The tensile direction for the corresponding SEM images printed herein was parallel to the vertical direction.
Electron backscattered diffraction (EBSD) measurements were conducted before and after in situ tensile tests using an AZtec system (Oxford Instruments Group, Oxford, UK) coupled to a Hitachi-Regulus 8230 cold field emission SEM (Hitachi High-Technologies Corporation, Tokyo, Japan). The operating voltage used was 20 kV to optimize the quality of the diffraction patterns. The EBSD samples were electropolished using a solution of 8% perchloric acid (HClO4) and 92% CH4O at −25 °C.

3. Results

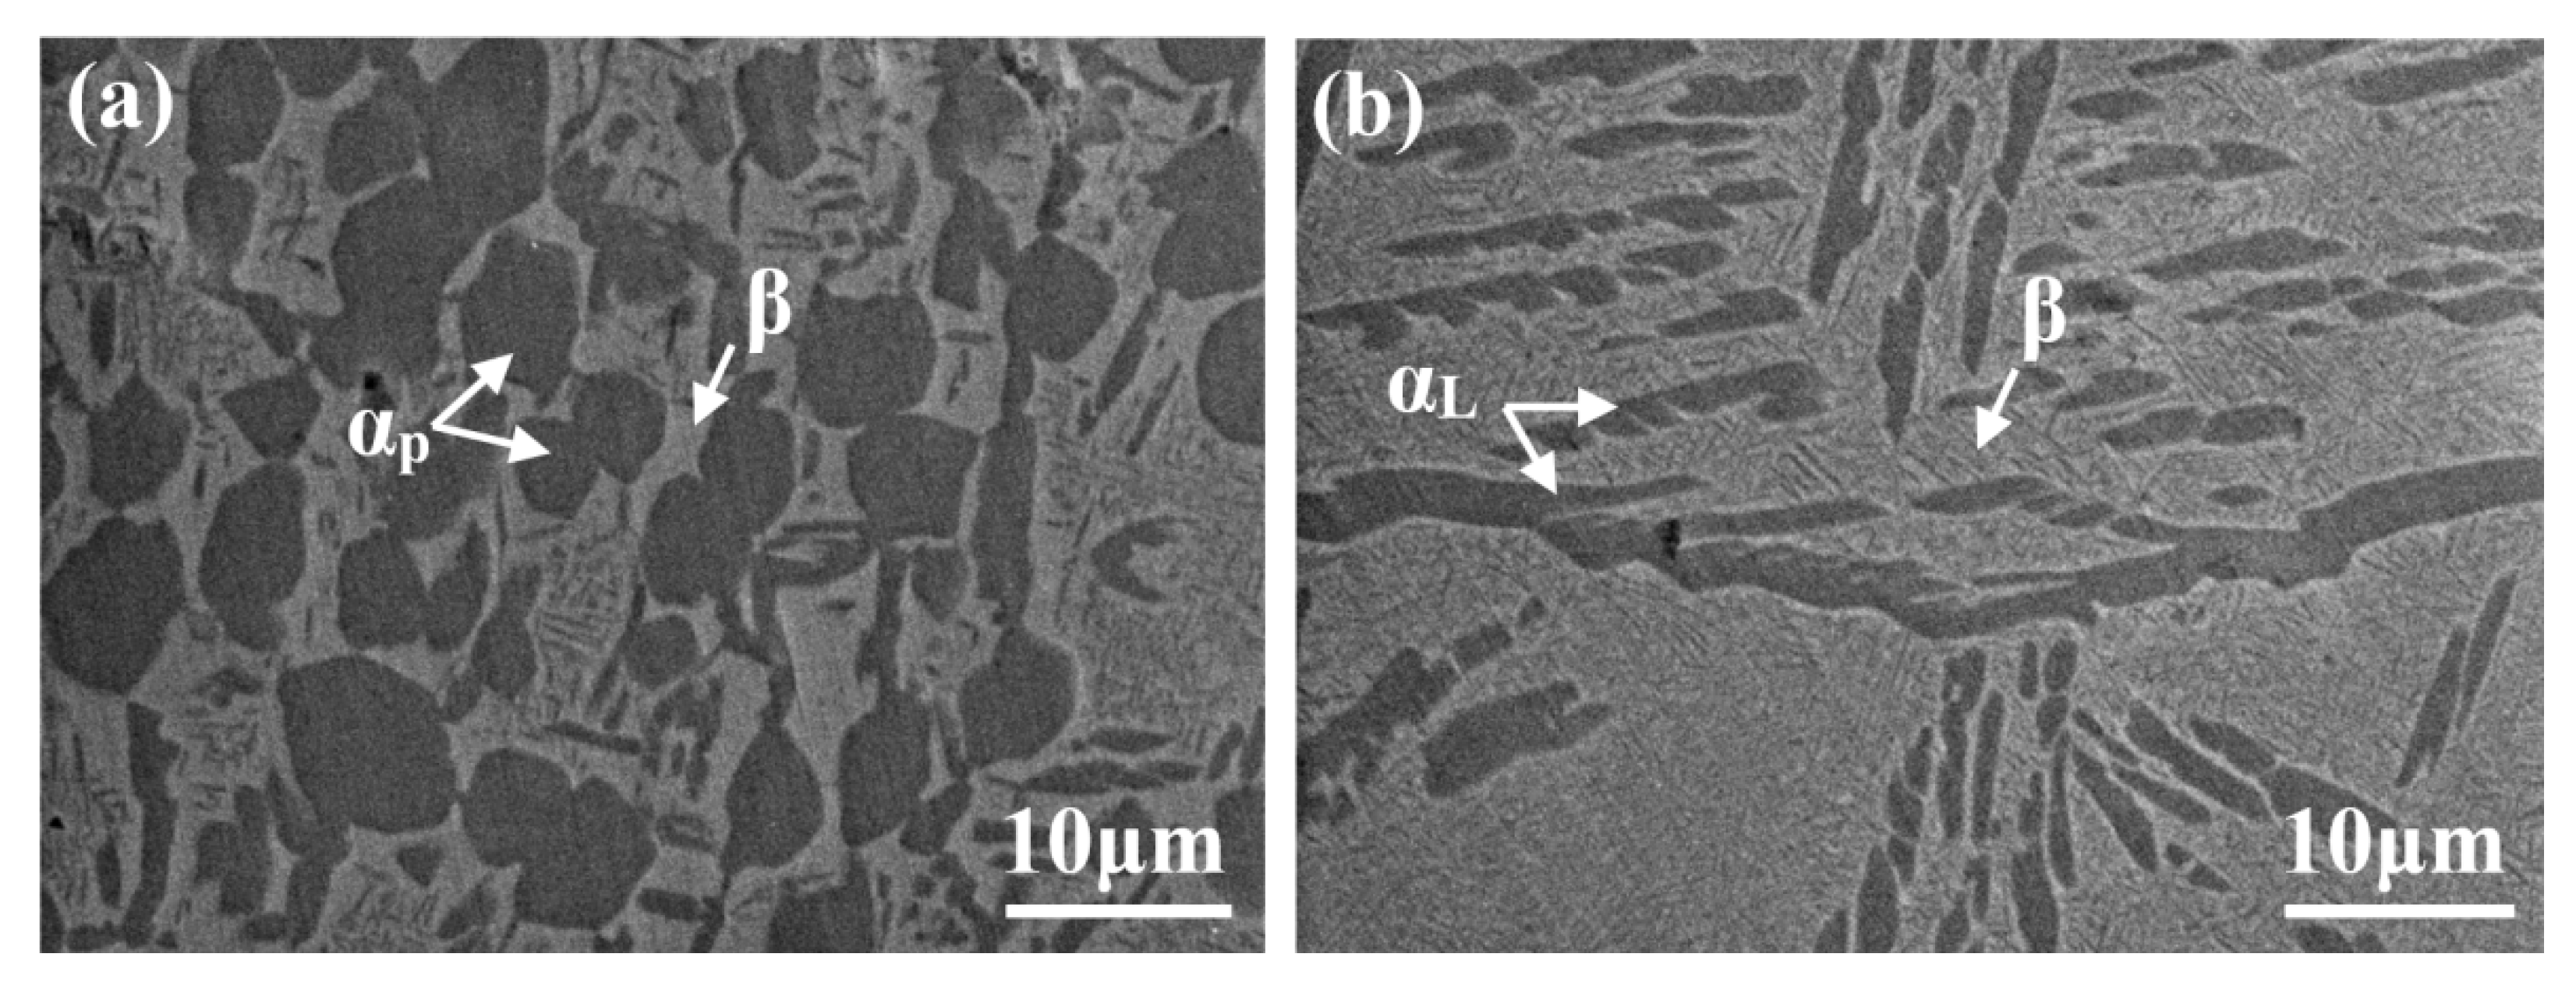
3.1. Microstructure of As-Heat-Treated Samples

Figure 3a shows backscattered electron (BSE)-SEM images of bimodal samples before in situ tensile testing. Since this sample was solution-treated at a temperature below Tα + ββ, some coarse globular αp phases were maintained, which were evenly distributed in the β matrix. For the lamellar microstructure seen in Figure 3b, αp was completely dissolved during solution treatment at a temperature above Tα + ββ (i.e., 895 °C for 2 h), while coarse αL, formed during subsequent low-temperature aging treatment, was distributed along GBs of the β matrix.

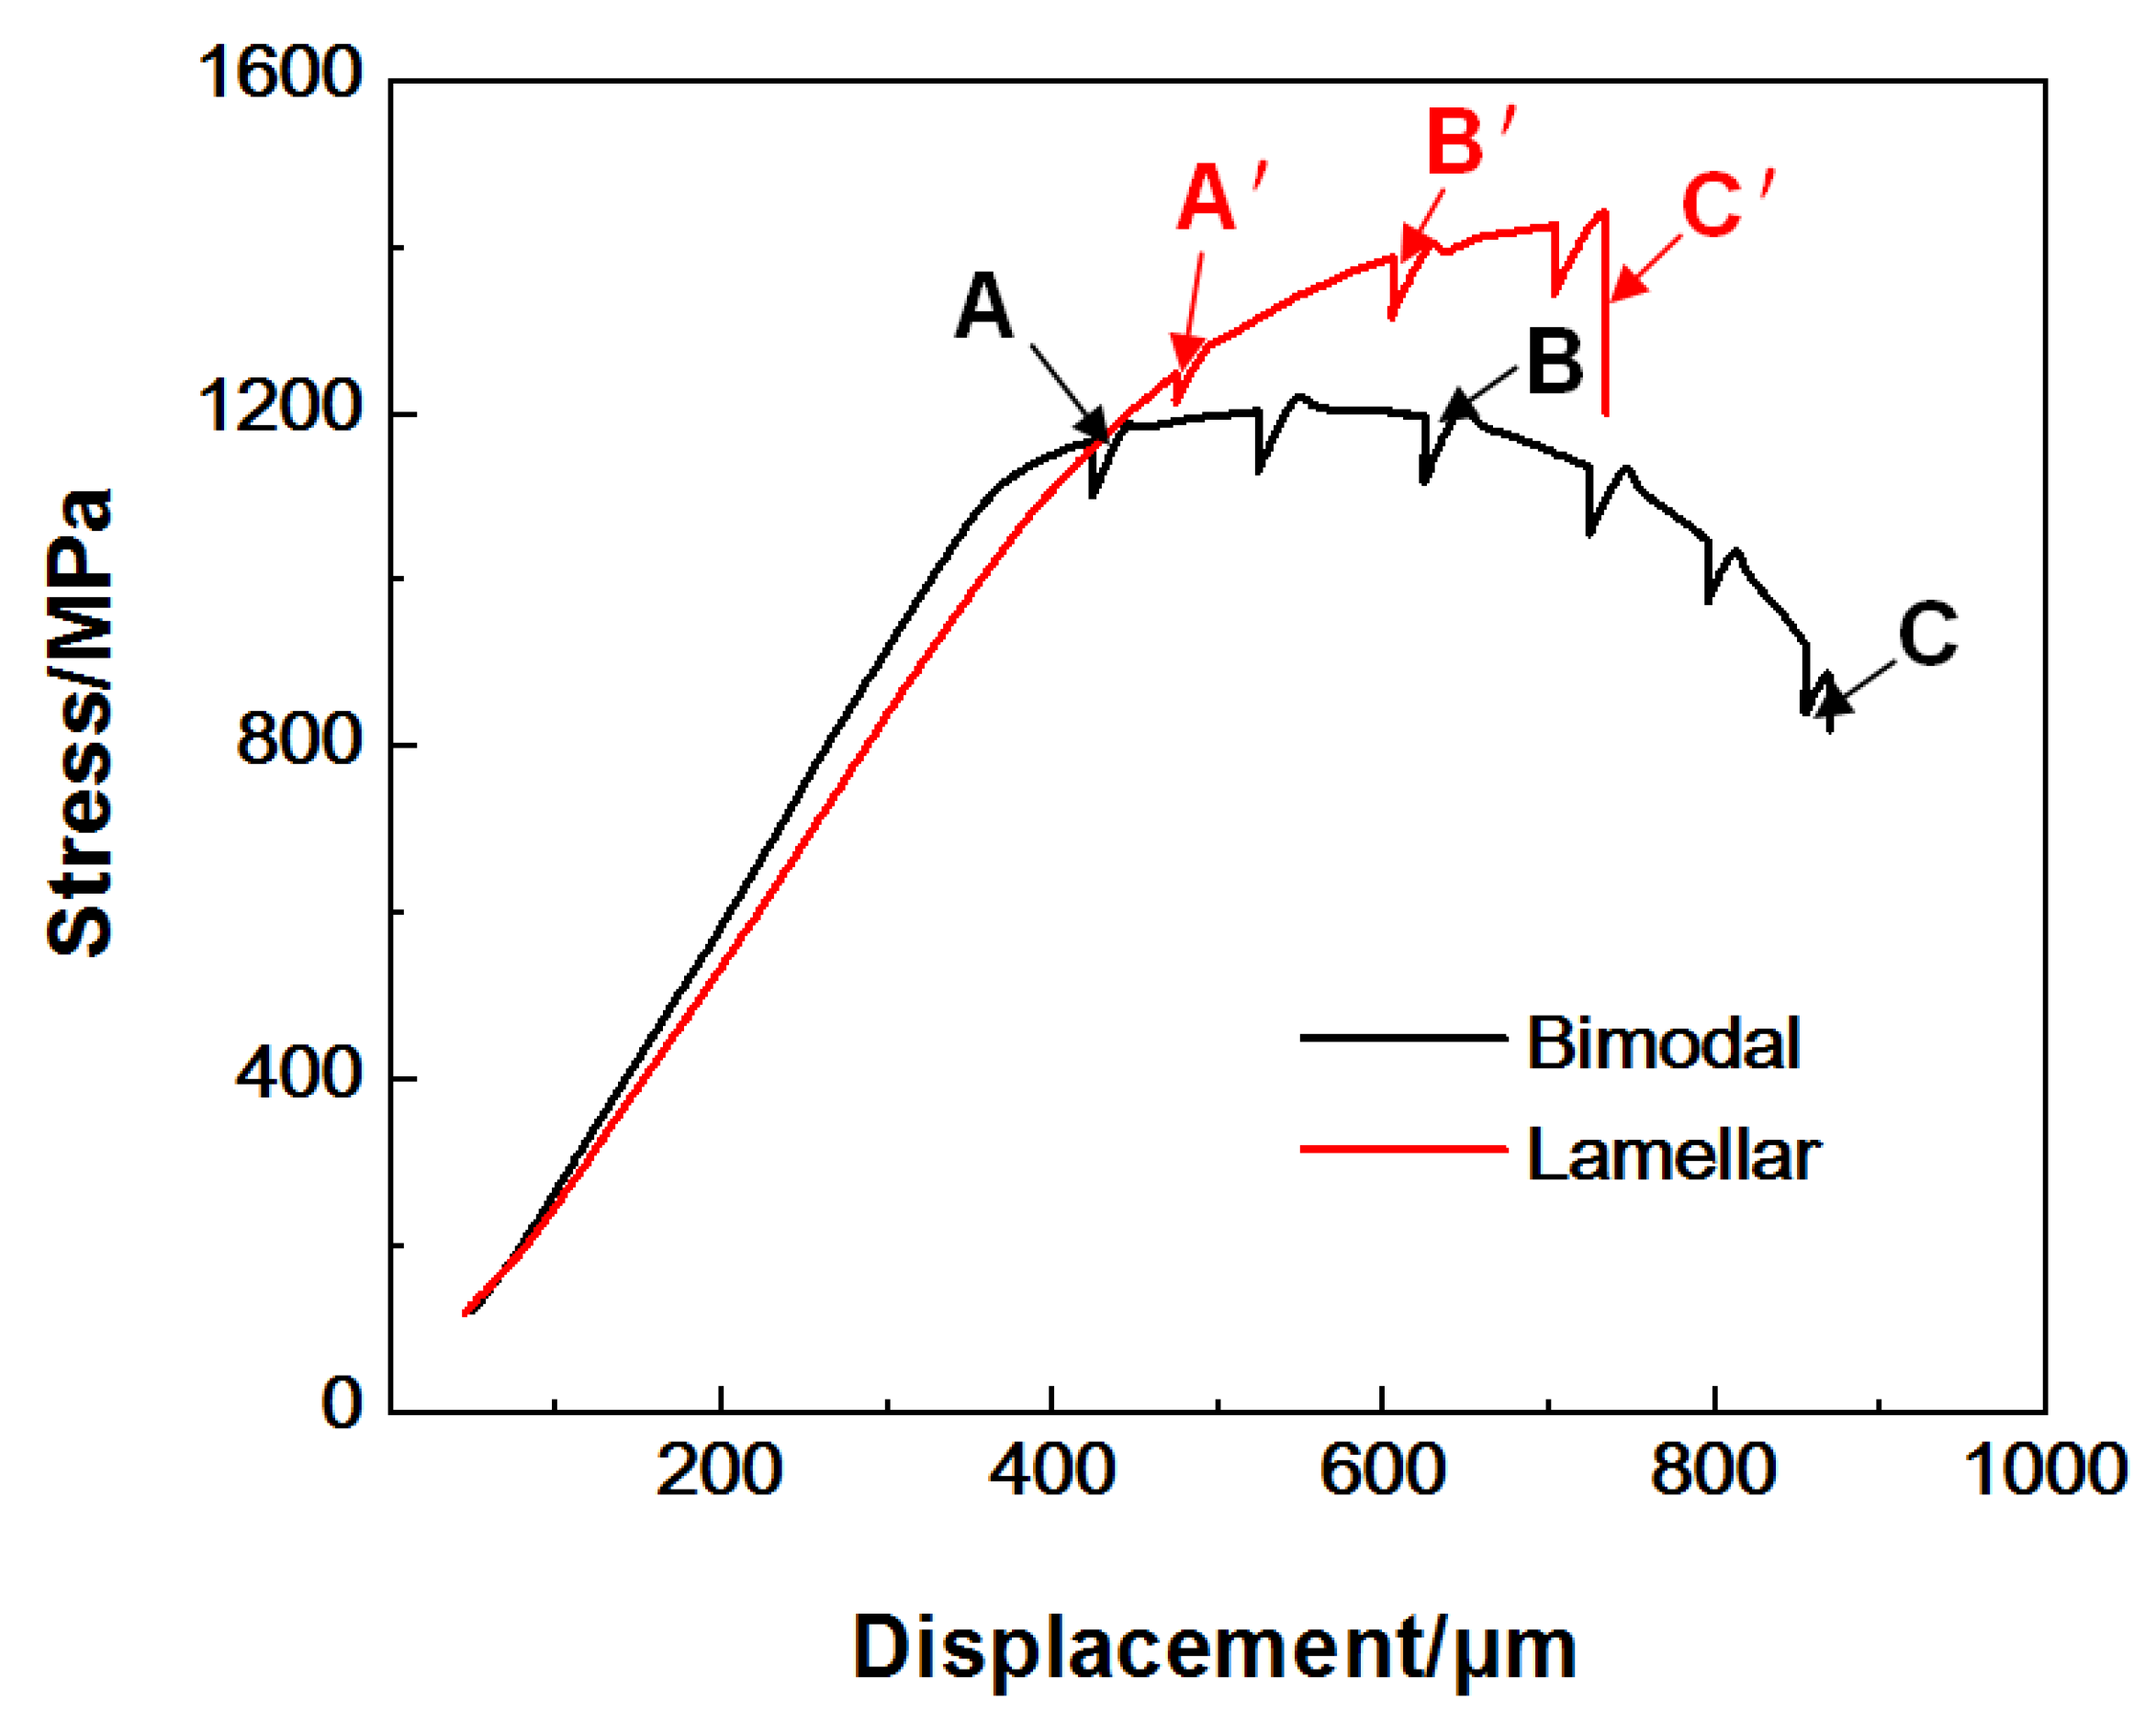
3.2. The Stress–Displacement Curves during In Situ Testing

The stress–displacement curves of bimodal and lamellar microstructures under in situ stretching are demonstrated in Figure 4. The drops in the curves are caused by slight stress relaxation during the pauses for SEM imaging, in which three typical drops for each sample are marked, respectively (A, B, and C for the bimodal microstructure and A’, B’, and C’ for the lamellar microstructure).
As can be seen from Figure 4, σ0.2 and the ultimate tensile stress (σth) of the bimodal microstructure are 1041.8 and 1220.5 MPa, which are much lower than those of specimens with a lamellar microstructure (σ0.2 = 1102.7 MPa, σth = 1441.3 MPa). The maximum tensile displacement of the bimodal microstructure is about 872 μm, while that of the lamellar microstructure is about 736 μm. This result indicates that the lamellar microstructure is stronger, but less ductile than the bimodal microstructure, which is consistent with findings from previous studies [11,12,13,14,15].

3.3. Microstructure Evolution during In Situ Stretching

3.3.1. Microstructure Evolution of Bimodal Microstructure

Figure 5a illustrates the in situ SEM images of the bimodal microstructure at position A. At this stage, some parallel and deep SBs can be seen in a small number of αp phase regions. These SBs generally lie at an angle of 41° to 49° with the tensile direction. As shown in Figure 5c, most of them are quite short (only several microns) and strictly confined within a single αp phase, while some of them not only cross the whole αp phase grain, but also pass through the αp/β interface and enter the region containing the β matrix (Figure 5b). In addition, there is a certain region of distortion arising at the αp/β interface (Figure 5d), which may be attributed to the deformation incompatibility between αp and β due to their different crystal structures.
Figure 6 illustrates BSE-SEM images of bimodal samples stretched at position B. Obvious necking appears (Figure 6a) and some microcracks form on the edge of the sample (Figure 6b) caused by the increasing strain. The microcrack tends to propagate along the αp/β interface and gradually grows to the center of the sample, as shown in Figure 6b. Noticeable SBs can be found in the β matrix adjacent to regions of αp phase and the distortion at the αp/β interface increases in severity (Figure 6d). This indicates that a higher stress concentration arises at this region near the αp/β interface. In addition, Figure 6c shows that the SBs in the αp phase become deepened and some tiny microcracks are also initiated in the β matrix close to regions containing the αp phase.
Figure 7 illustrates in situ SEM images of the bimodal microstructure at position C (after fracture). The fracture surface is relatively rough (Figure 7e) and significant necking can be observed at the region close to the fracture surface (Figure 7c,f). As shown in Figure 7b,d, many microcracks form in the region close to the fracture surface: these nucleate at and generally propagate along the αp/β interface (the crack path is tortuous). Although the number of SBs increases, the αp phase still maintains a granular shape (Figure 7d) and grains are wrapped by the significantly distorted β matrix (Figure 7d). As can be seen in Figure 7a, the morphology of the β matrix near the fractured zone becomes streamlined in shape, implying that it undergoes significant plastic deformation before fracture. Therefore, the β matrix undergoes greater deformation than the αp phase during in situ stretching; in addition, this deformation is relatively uniformly distributed in the β matrix, probably due to the excellent deformation compatibility.
To assess the deformation behavior of the bimodal microstructure during in situ tensile loading, an area of the sample was selected for tracking, and the SEM images thereof at different stages were recorded. Figure 8a,c show the SEM images of the same area on a specimen with a bimodal microstructure surface at the stage of positions A and B, respectively: with increasing strain, the sample surface became significantly rougher and took on an undulate appearance (Figure 8c). To determine the strain in this local area, the changes in distance between two αp phase grains on the sample surface were measured. Stretched from position A to position B, the distance increased from 135.71 μm (position A) to 167.85 μm (position B), indicating some 23.68% of the plastic deformation appears along the tensile direction (εL) in this region.
Figure 8b,d are magnified images of Figure 8a,c, respectively. Although the sample underwent severe plastic deformation, the distribution of SBs in the β matrix remained relatively uniform. For further analysis, 25 αp phase grains were selected for calibration (and assigned serial numbers 1 to 25). The size changes of these 25 αp phase grains along the tensile direction from positions A to B were statistically studied (Table 1); most αp phase regions have εL values of less than 10%, and their average εL value is 9.72%, which is only 41% of the average εL value over the region. This result demonstrates that during tensile deformation, the β matrix was subject to larger plastic deformation than the αp phase.

3.3.2. Evolution of the Lamellar Microstructure

Figure 9 shows BSE-SEM images of specimens with a lamellar microstructure during in situ stretching at position A’ on the stress–displacement curve (Figure 4). As shown in Figure 9d, some parallel SBs form within or at the boundaries of the αL phase at an angle of about 45° to the tensile direction. Differing from those in specimens with a bimodal microstructure, in which such SBs measure only several microns, these SBs aligned along the length of the αL phase are significantly longer and can always grow to several tens of microns.
Figure 10 illustrates BSE-SEM images of lamellar samples during in situ stretching at position B’. As the strain increases, SBs gradually extend and connect with each other along the length of αL at which some extremely long SBs are formed. As shown in Figure 10d, the connected SBs in the αL at the grain boundary are over one hundred microns in length, besides which certain microcracks evolving from SBs can also be found in the αL grains or at their interfaces.
Figure 11 exhibits in situ SEM images of lamellar samples during stretching at position C’. No obvious necking occurs in the sample until it fractures, which indicates that the lamellar microstructure undergoes less plastic deformation than the bimodal microstructure. Although there are slight SBs in the β matrix adjacent to the fracture surface, they are fewer in number than in specimens with a bimodal microstructure. Judging from Figure 11c,d, specimens with a lamellar microstructure generally fracture along the GBs, which results in a sharp fracture surface.
As shown in Figure 12a,c, the changes in a selected area of the lamellar microstructure from position A’ to position B’ are tracked. The changes in roughness of the sample surface are small and there are fewer SBs compared with those in specimens with a bimodal microstructure (Figure 11). The εL value in this local area from position A’ to position B’ is found to be 1.33% (less than that in specimens with a bimodal microstructure).
Figure 12b,d demonstrate magnified versions of Figure 12a,c, respectively. To quantify the deformation behavior, 12 αL phase grains were selected for calibration and assigned serial numbers 1 to 12. As shown in Figure 12b, SBs are mainly found in the large αL phase (αL12), which can extend along the GB, while they are scarcely found in the β matrix or small αL phase regions. With the increase in strain from position A’ to position B’, SBs in αL12 deepen, while the microstructure in the β matrix and small αL phase changes little (Figure 12d). The εL values of the selected 12 αL phase grains deformed from position A’ to position B’ were statistically analyzed (Table 2). According to the data in Table 2, the relatively small αL phase (αL1L11) has quite small εL values (less than 1.0%), while the εL value of the long αL phase at the GB (αL12) is found to be 5.79%, which is 3.35 times greater than the εL value across this area; the deformation in the lamellar microstructure is mainly concentrated in the large αL phase found at the GB (i.e., αL12).

4. Discussion

Recently, investigators have found that mechanical behavior and its related mechanism of action are sensitive to the initial microstructure of titanium alloys. Specimens with a bimodal microstructure are found to have a lower strength but higher ductility than those with a lamellar microstructure [11,12,13,14,15], while the essential reason for the differences in mechanical behavior between bimodal and lamellar microstructures is still hotly debated. Huang et al. [23] found that the αp phase in specimens with a bimodal microstructure plays a major role in accommodating the plastic strain of titanium alloys due to its good compatibility during deformation, while Tan et al. [24] stated that cracks are readily initiated at SBs in the αp phase, which lies at the crux of the tensile deformation. Liu et al. [25,26] considered that a high stress concentration at the αL/β grain boundary results in intergranular fracture and low ductility of specimens with a lamellar microstructure, whereas Qin et al. [27] found that the crack nucleates inside the β grains and will spread under high tensile stress without hindrance in the larger β grains, leading to the low plasticity of specimens with a lamellar microstructure. In this study, their quite different mechanical properties were found to be essentially attributed to different microstructural evolutions during tensile loading.

4.1. Deformation Mechanisms and Microstructural Evolution of the Bimodal Microstructure

Based on the results of in situ SEM observation, the deformation mechanisms and microstructural evolution of the bimodal microstructure are shown schematically in Figure 13.
The bimodal microstructure contains coarse globular αp grains distributed in the β matrix (Figure 13a). Under a relatively small strain (Figure 13b), many parallel, deep SBs are formed inside some αp phase regions due to the limited slip systems of αp and the stress concentration caused by their relatively large size. As previously proved by Semiatin et al. [28], the ratio of critical resolved shear stress in the α phase at room temperature was 1:0.7:3.2 for basal ({0001}<11−20>), prismatic ({1−100}<11−20>), and pyramidal slip ({1−101}<11−20>), respectively. This indicates that pyramidal slip is difficult to take place and the αp phase is more likely to slip along its basal or prismatic plane at room temperature. Figure 14 demonstrates four examples of SB identification for a bimodal microstructure after in situ stretching. These SBs essentially correspond to prismatic or basal slip systems and to single slip behavior with a relatively large Schmid factor (SF) (SF > 3.7), which agrees well with the results of Semiatin et al. [28].
In addition, as shown in Figure 15a, the orientations of αp phases are randomly distributed in the bimodal microstructure. For the same αp phase, there is a large difference in SF values for basal and prismatic slips (Figure 15b,c); the one with the maximum SF is supposed to be the easiest to activate [21]. Therefore, it is difficult for the αp phase to activate both basal and prismatic slips simultaneously. SBs are prone to occur along a single basal or prismatic plane of the αp phase, which is oriented solely along the maximum shear stress direction, i.e., at an angle of 45° to the applied tension. Differing from the αp phase, there are significantly more slip systems in the β phase, among which {1−10}<111>, {11−2}<111>, and {12−3}<111> slips were thought to be the three typical cases [28,29]. As presented in Figure 15d,f, there is no significant difference in the SF values for these three types of slips in the β phase. Thus, it is difficult to observe β phase regions’ slip strictly along one single plane especially under a small strain.
In the bimodal microstructure, although a small number of SBs in the αp phase can pass through the αp/β interface, most are restricted at the interface between β and αp and confined to within a single αp phase grain. This will lead to an increased stress concentration at the αp/β interface, therefore distorting the interface. As the strain increases (Figure 13c), the αp phase is elongated slightly along the tensile direction (Figure 8).
β is softer than αp due to lower concentrations of solute Al in β [30], thus β should bear more significant deformation than the αp phase at the same stress, while due to the more numerous slip systems and greater deformation coordination in BCC β, parallel, deep SBs may be less likely to form in the β phase when the strain is relatively small (Figure 6 and Figure 7). Caused by the different deformation behaviors between αp and β, stress concentration at the interface gradually increases with increasing strain, finally generating microcracks. Then, with the further increase in strain (Figure 13d), the number of SBs in the αp phase increases slightly due to its more limited slip system, while that in the β matrix increases to a much greater extent. This further aggravates the stress concentration at the αp/β interface, making the microcrack propagate along the αp/β interface and into the β matrix. As the microcracks grow, they gradually come closer together, whereupon they tend to interconnect to form a main crack. Additionally, as the main crack grows, it is likely to bridge these microcracks formed at the αp/β interfaces. This finally leads to the zig-zag crack path and rough fracture surface of the sample since the αp grains are randomly distributed in the β matrix (Figure 13d).
It should also be pointed out that, because of the connected distribution of the β phase and isolated distribution of the αp phase in specimens with a bimodal microstructure, localized deformation readily propagates into the surrounding area by way of the soft β phase, with only a minor role played by the harder αp phase. This ensures relatively uniform deformation, giving rise to the excellent ductility of the bimodal microstructure.

4.2. Deformation Mechanisms and Microstructural Evolution of the Lamellar Microstructure

Figure 16 schematically presents the deformation mechanisms and microstructural evolution of the lamellar microstructure based on the results of in situ SEM observation.
Differing from the bimodal microstructure, many long and coarse lamellar αL grains, rather than globular αp regions, are seen in the lamellar microstructure: these are mainly distributed at or near GBs (Figure 16a). Since these αL phase regions are much harder than the β phase [31], they can exert a strong fencing effect and therefore separate each β grain into a relatively isolated region between which dislocation cannot easily pass. This in turn leads to a great stress concentration at the αL phase. Therefore, deep SBs are first observed in the coarse αL phase at GBs under a relatively low tensile strain (Figure 16b). As shown in Figure 17, these SBs correspond to prismatic slip behavior (SF > 4.2) and generally lie along the plane at an angle of approximately 45° to the direction of the applied tension (i.e., the direction of maximum shear stress).
Meanwhile, the deformation in the β matrix is much smaller due to the strong fencing effect of the αL (Figure 9). With increasing strain, the number of SBs in the large αL phase increases while that in the β matrix remains low (Figure 10), suggesting that the deformation in lamellar microstructures is non-uniform and mainly concentrated in the large αL grains at GBs. As a result of this inhomogeneous deformation, microcracks are readily initiated from, and propagate along, the SBs (Figure 16c). The formation of microcracks in these αL regions in turn produces a greater stress concentration, releasing stress accumulation in the β matrix. This aggravates the inhomogeneity of the deformation of specimens with a lamellar microstructure. Finally, the sample fractures along the large αL grains at GBs, leading to the low plasticity of the lamellar microstructure (Figure 16d).

5. Conclusions

In this study, the microstructural evolution and fracture mechanisms of a Ti–5Al–5Mo–5V–1Cr–1Fe alloy with bimodal and lamellar microstructures were investigated through in situ tensile SEM observation. The following conclusions can be obtained:
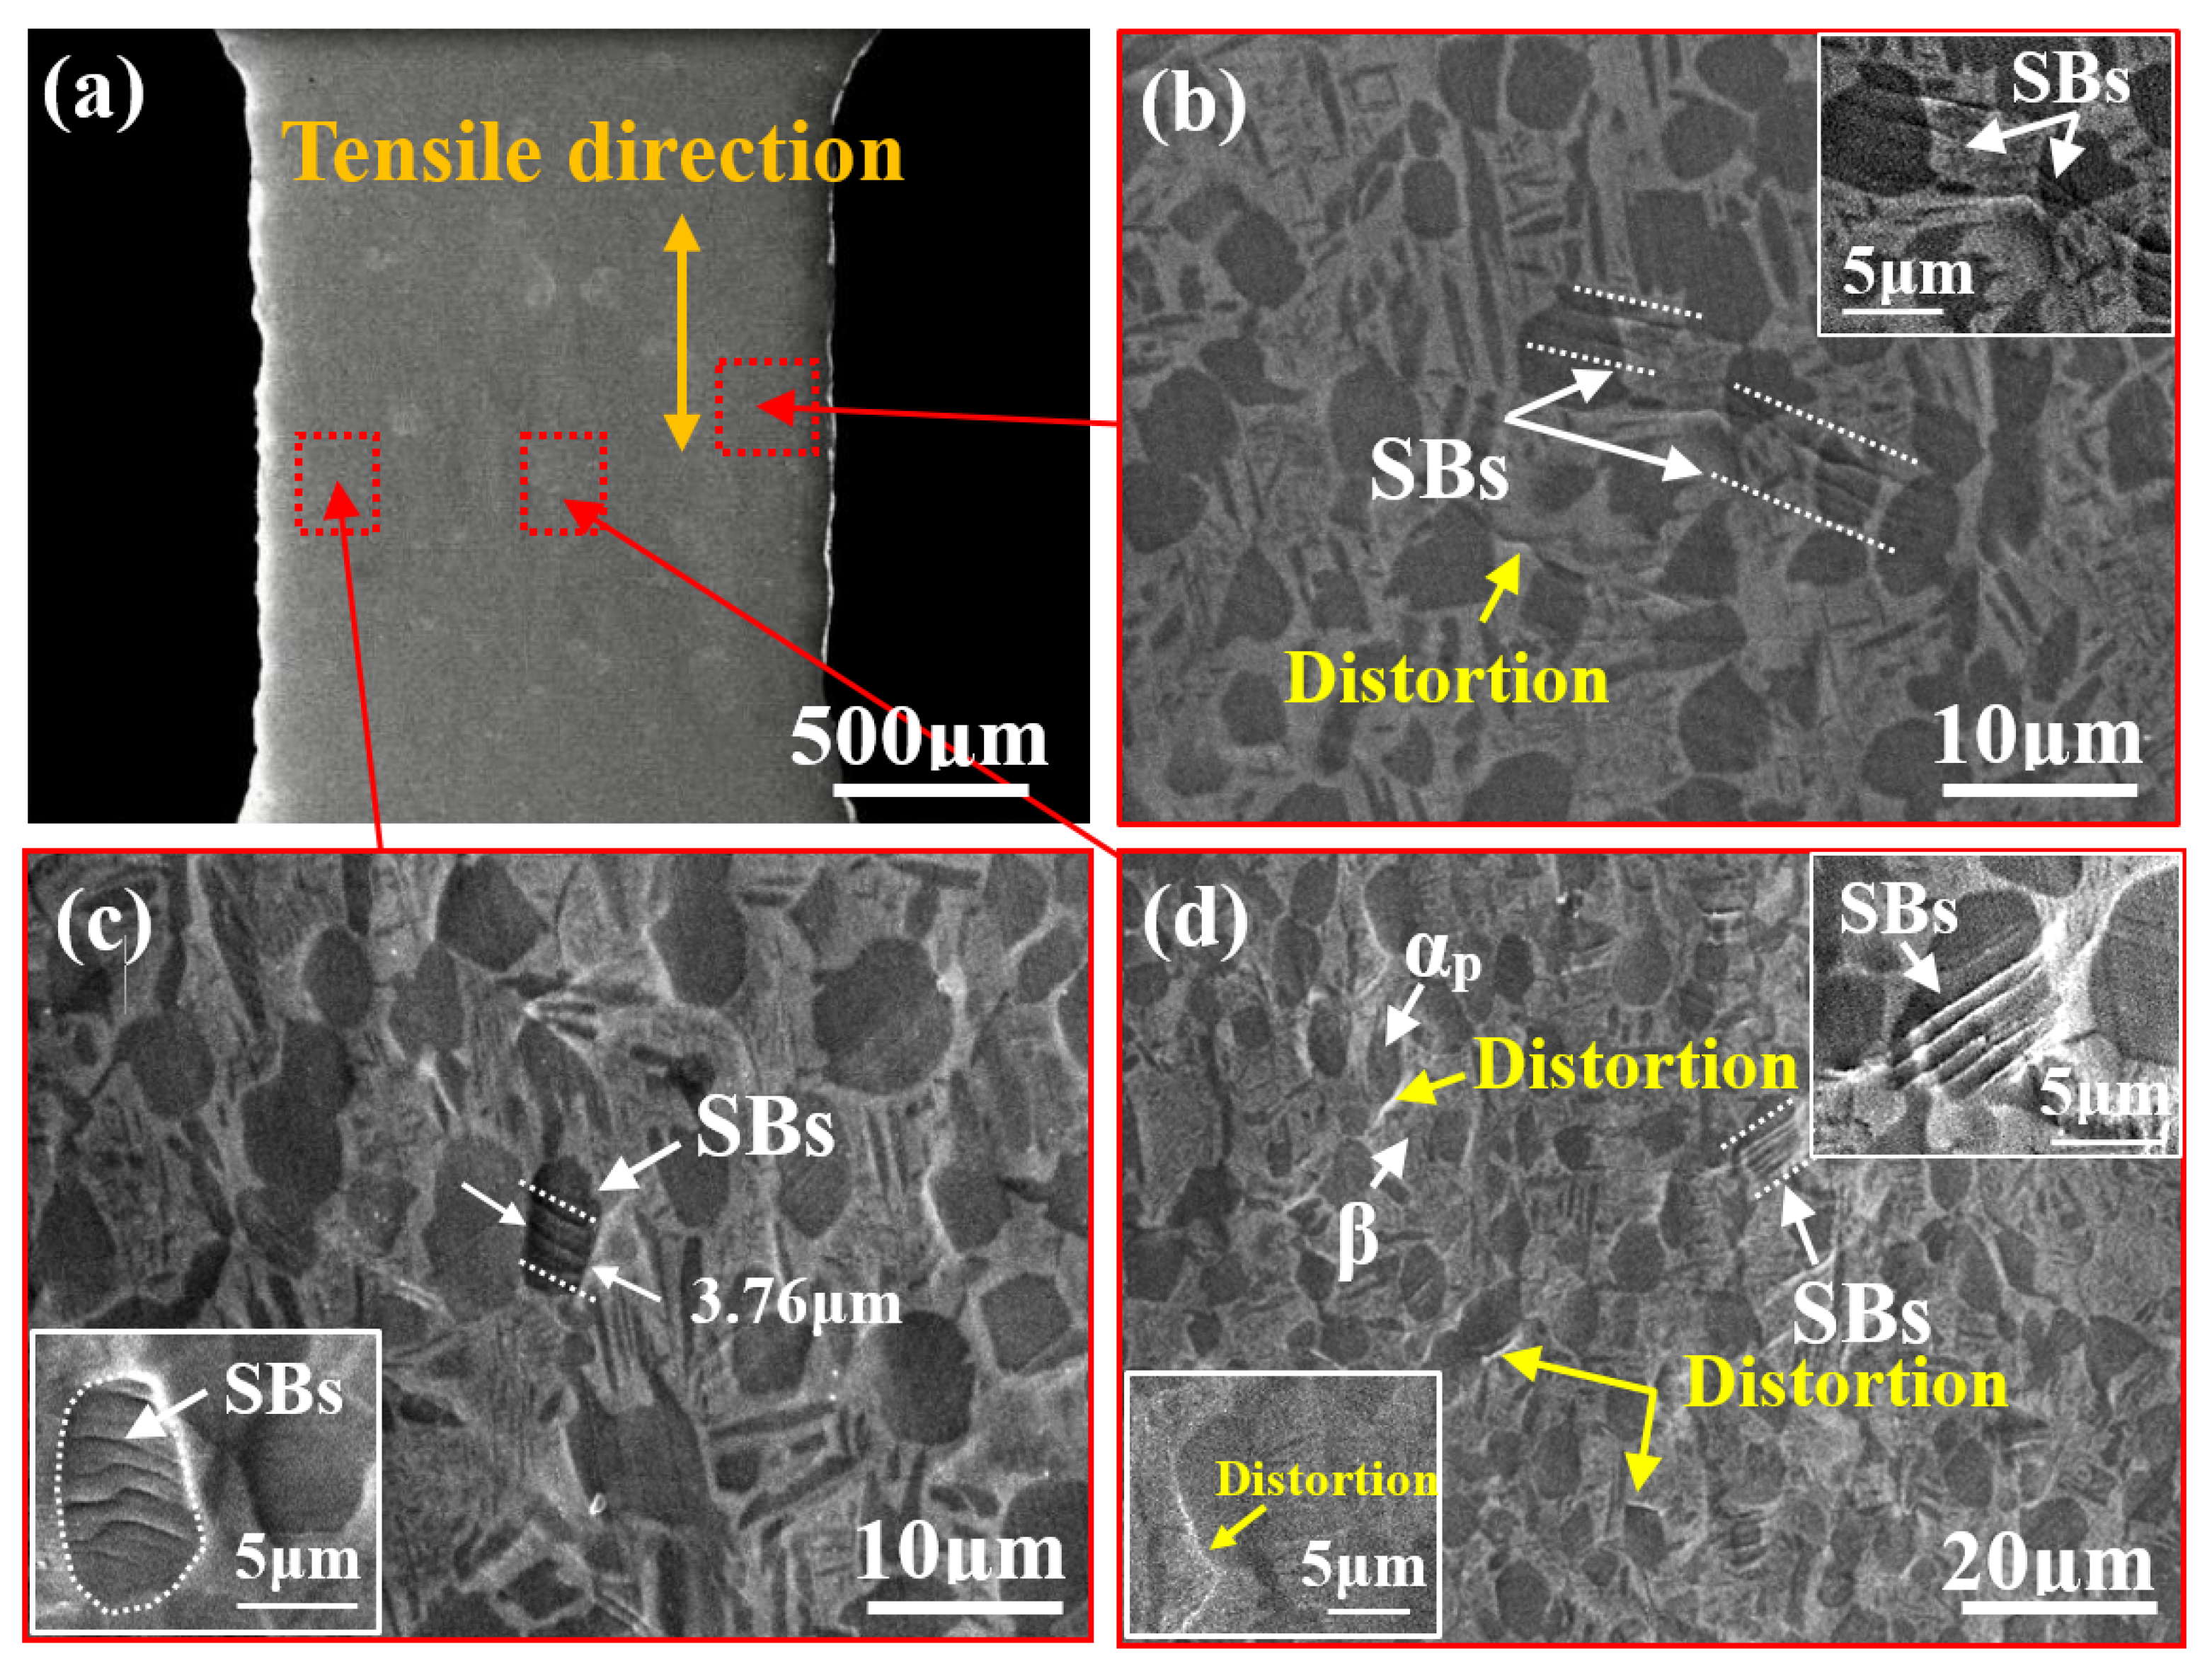
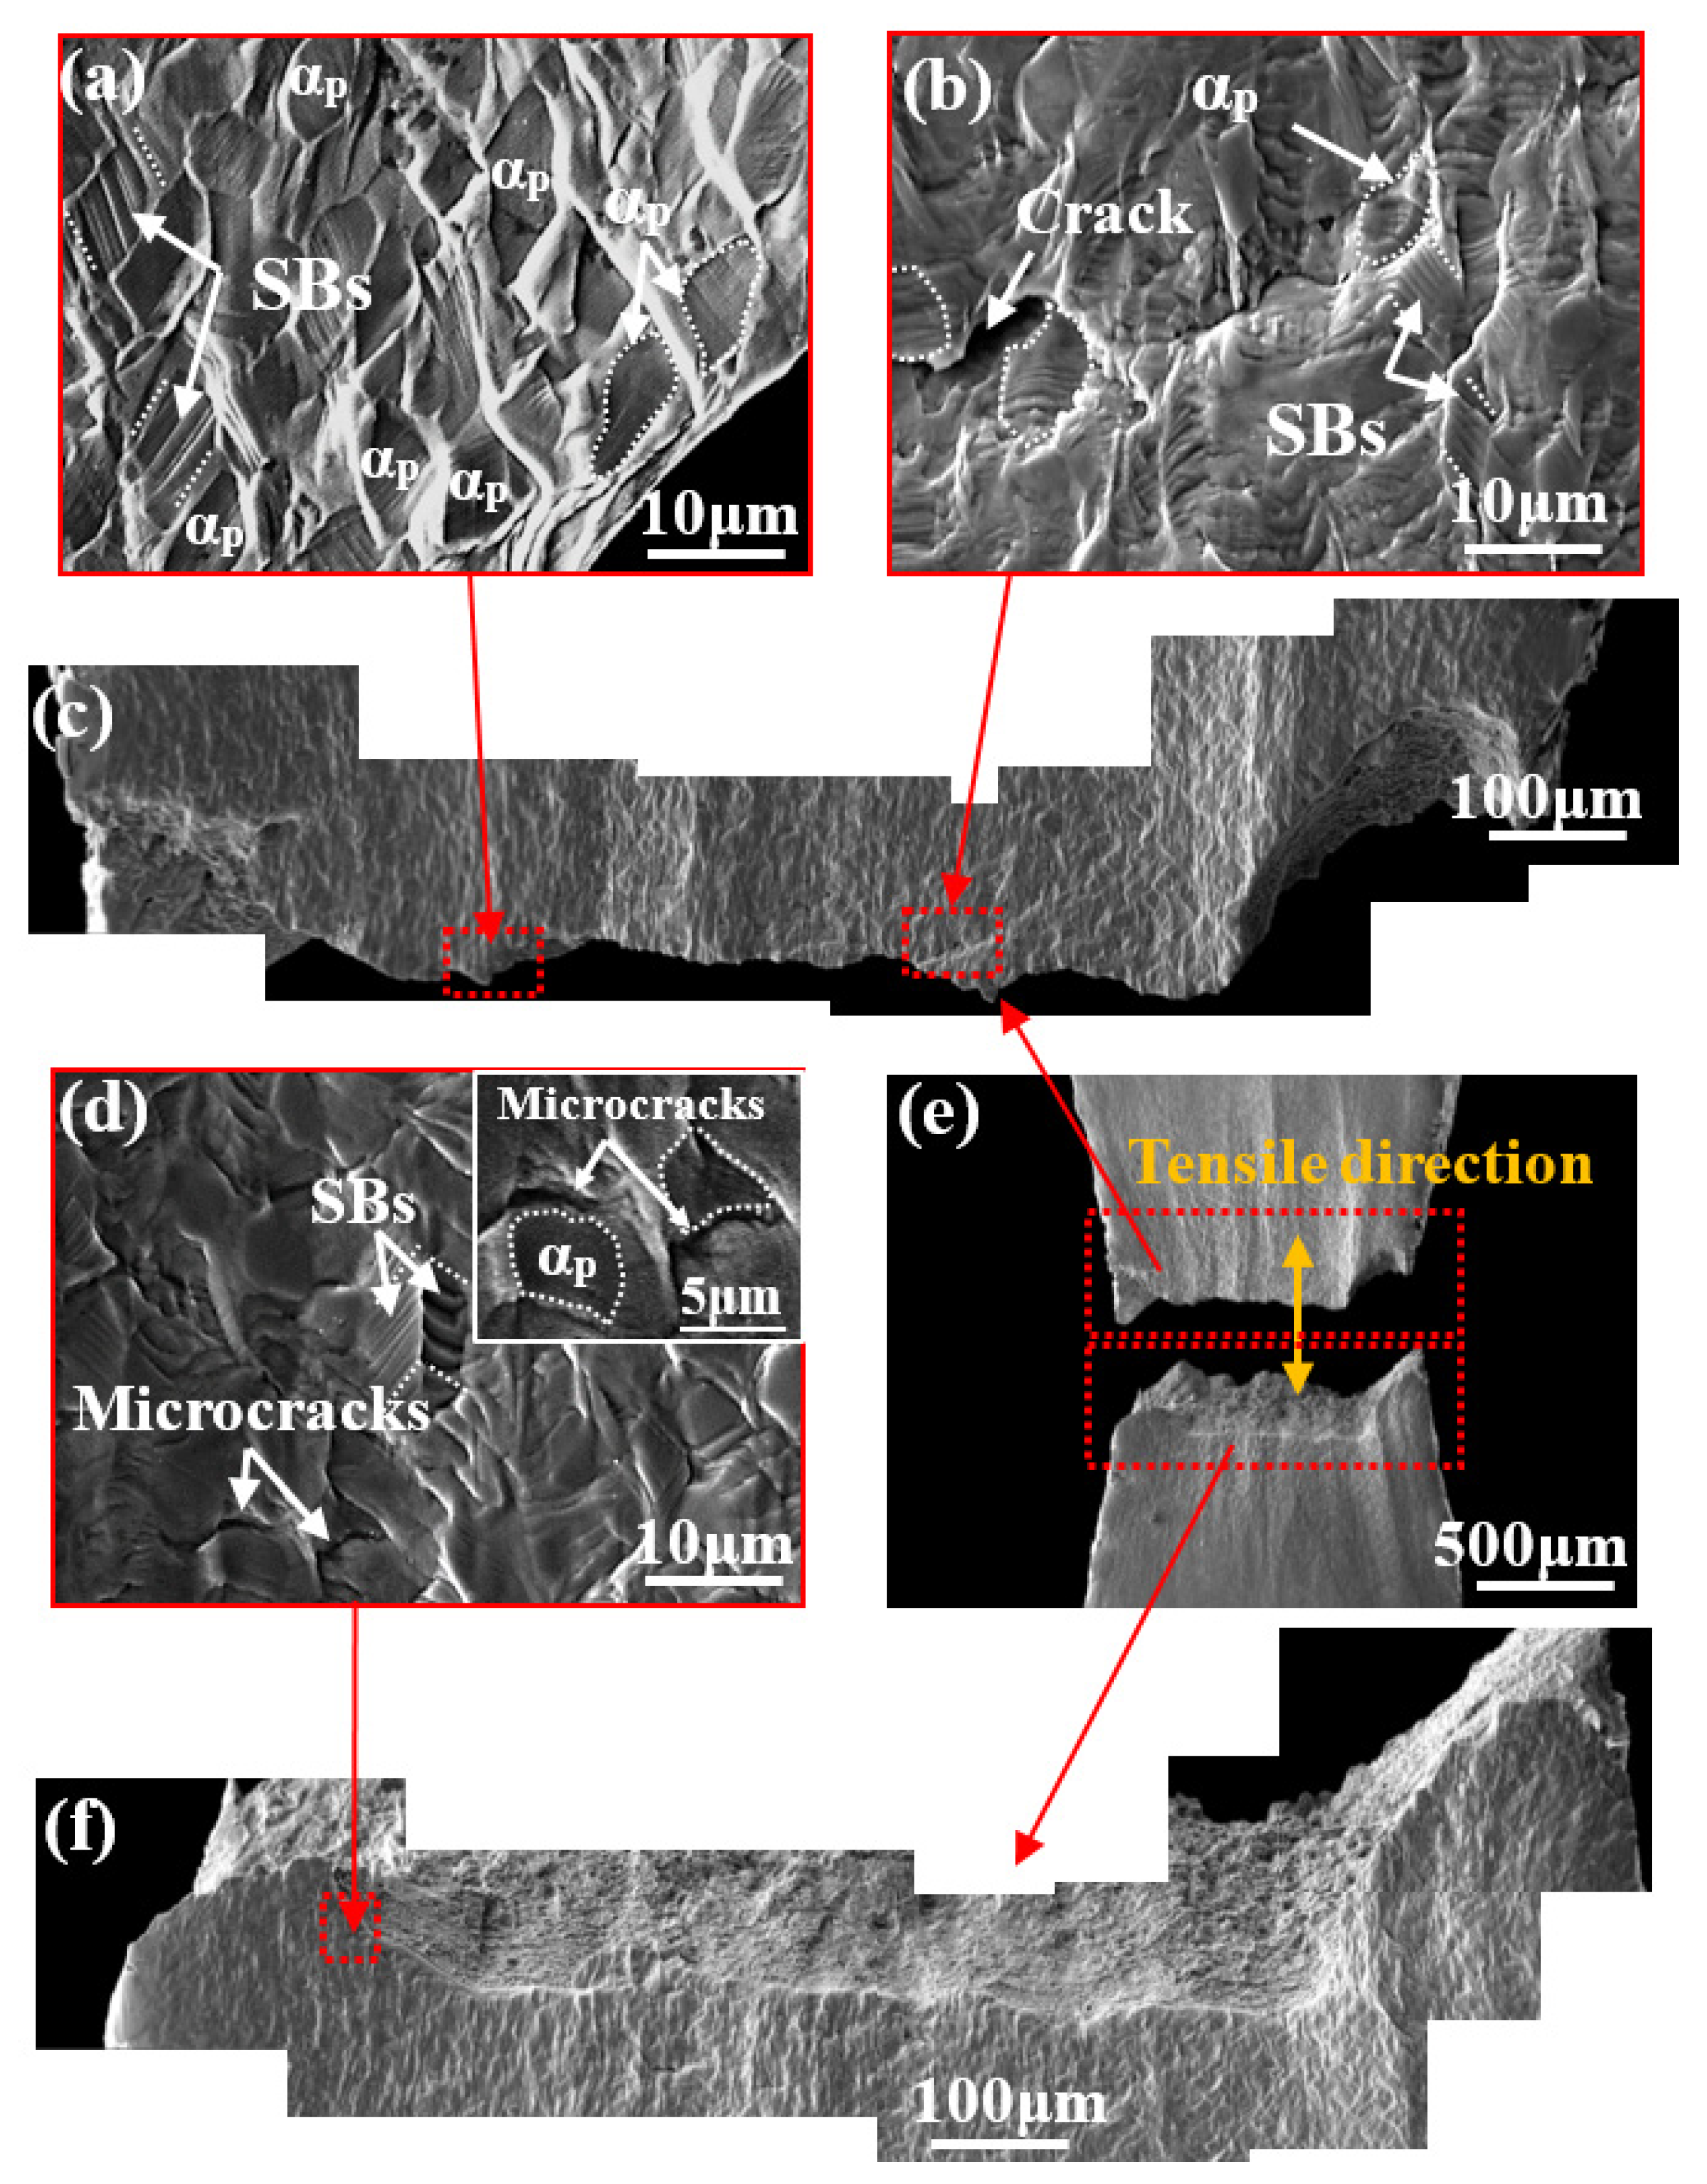
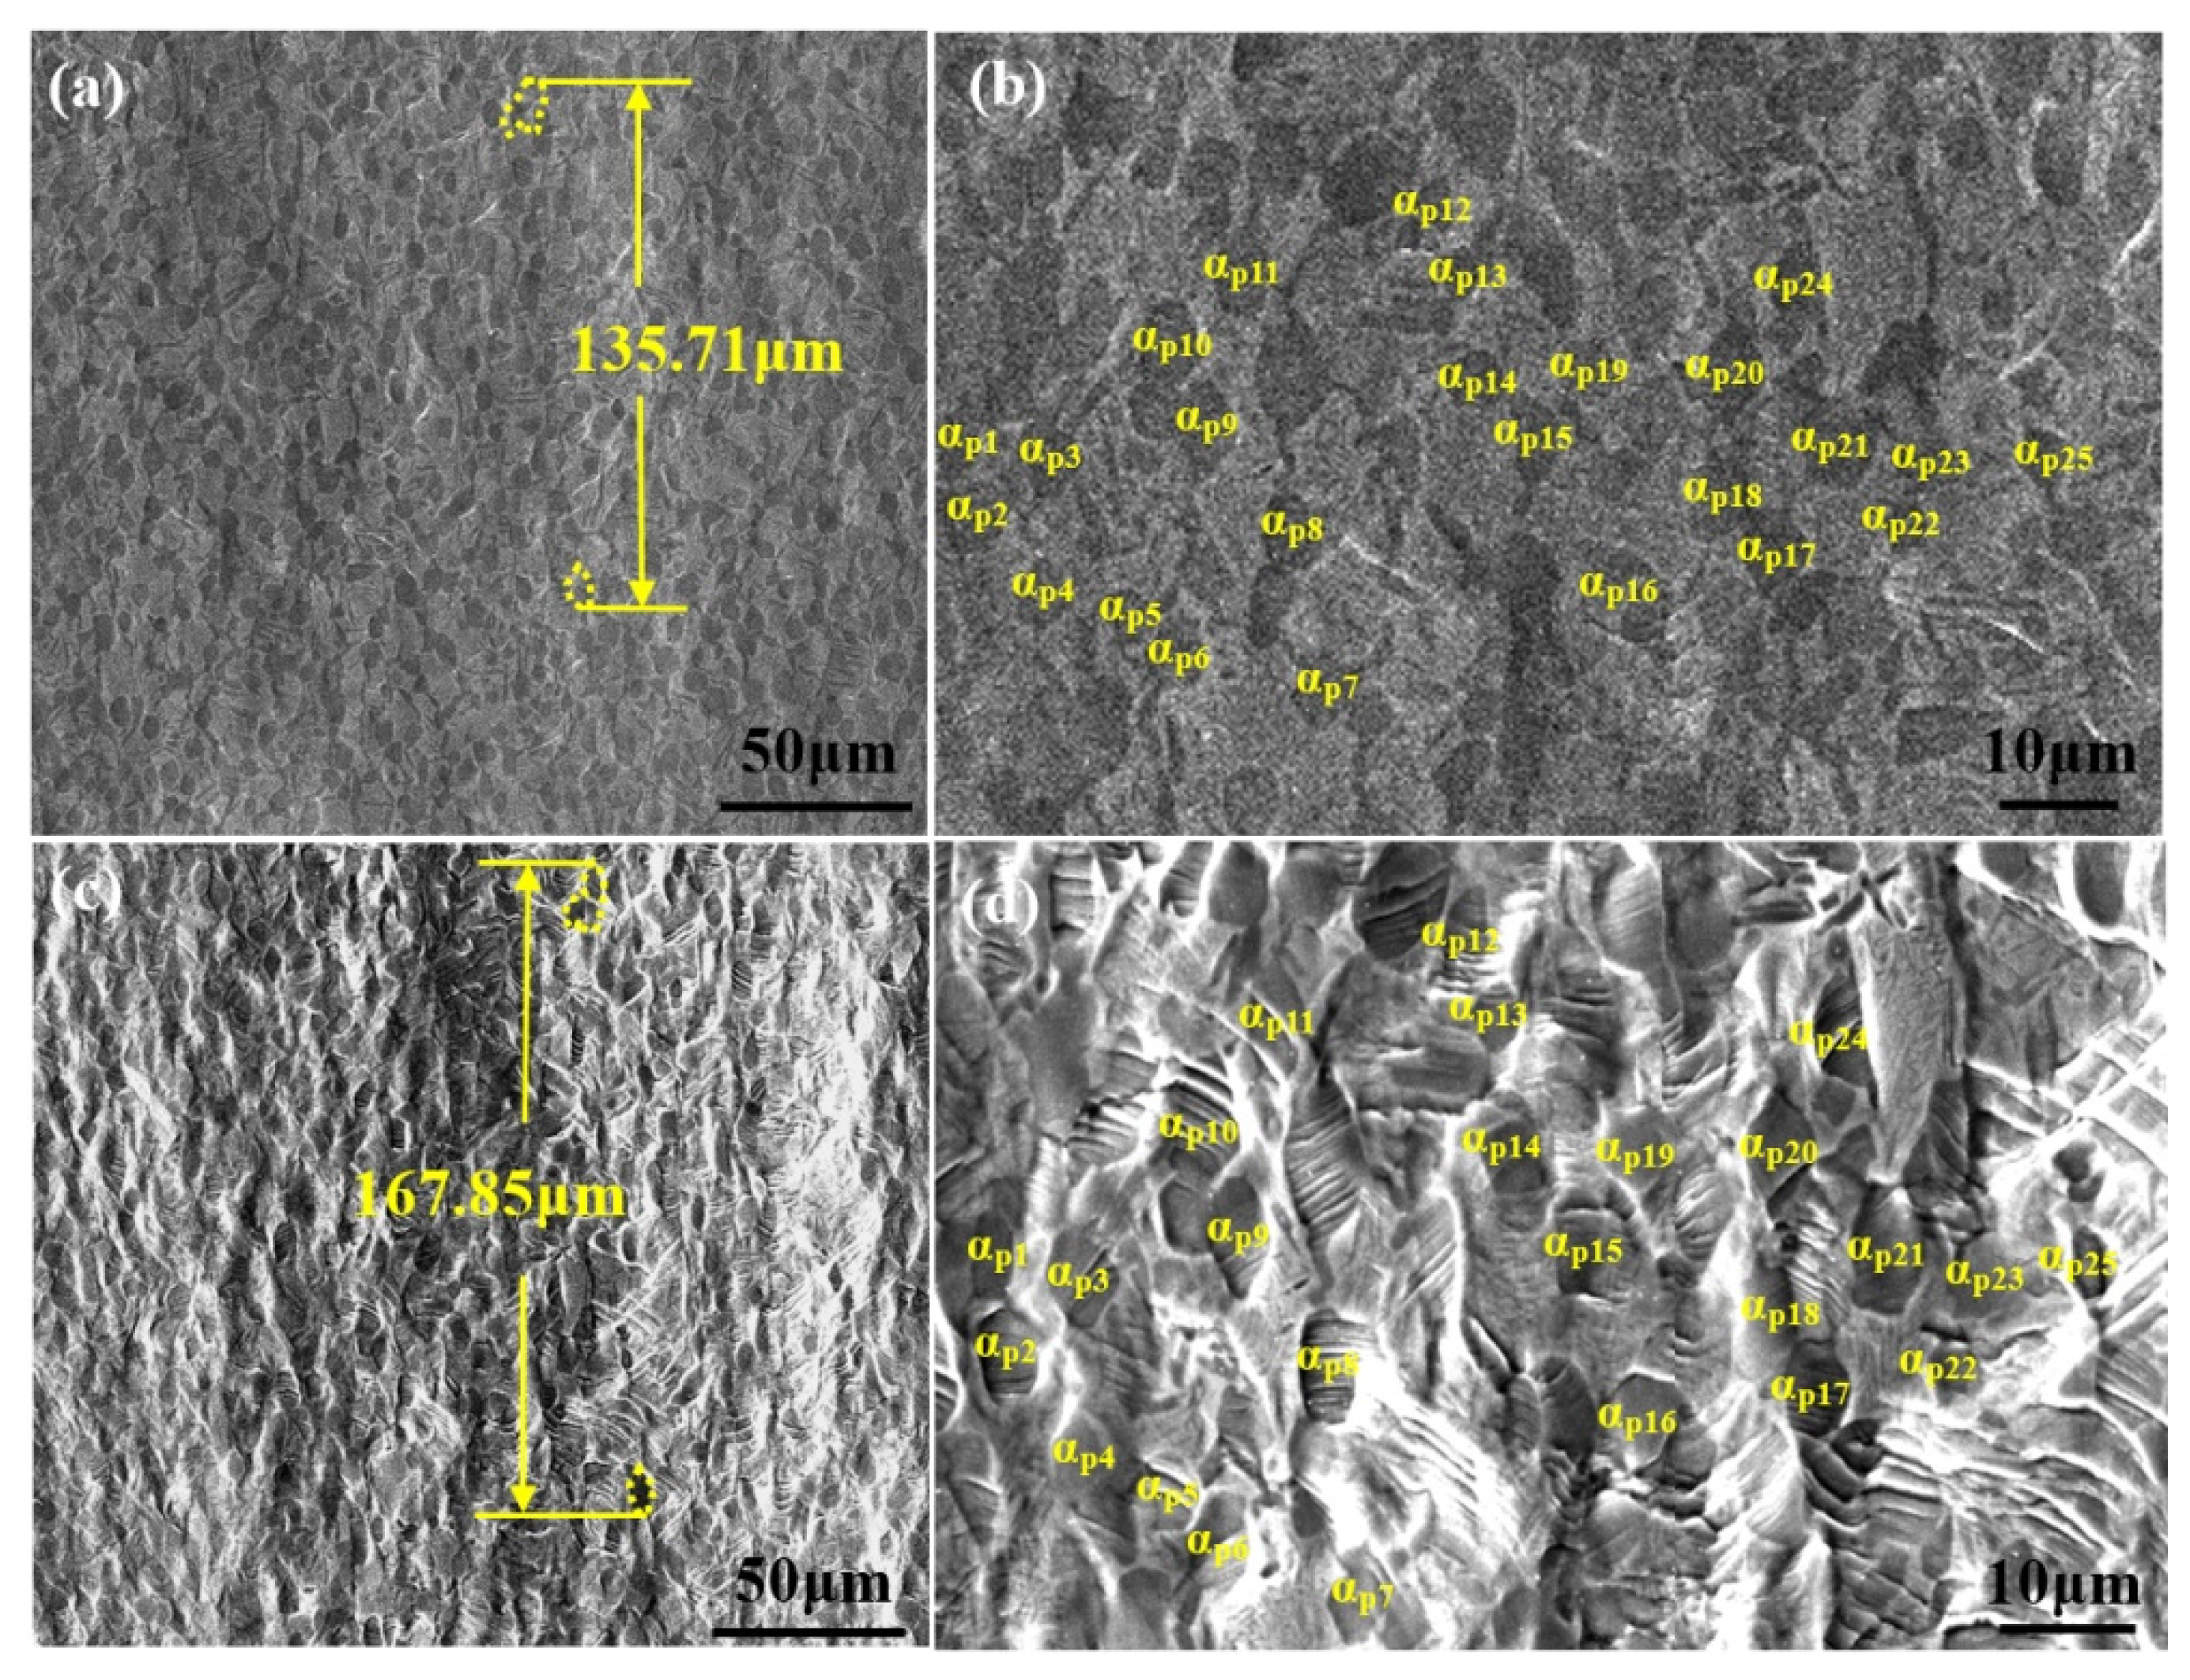
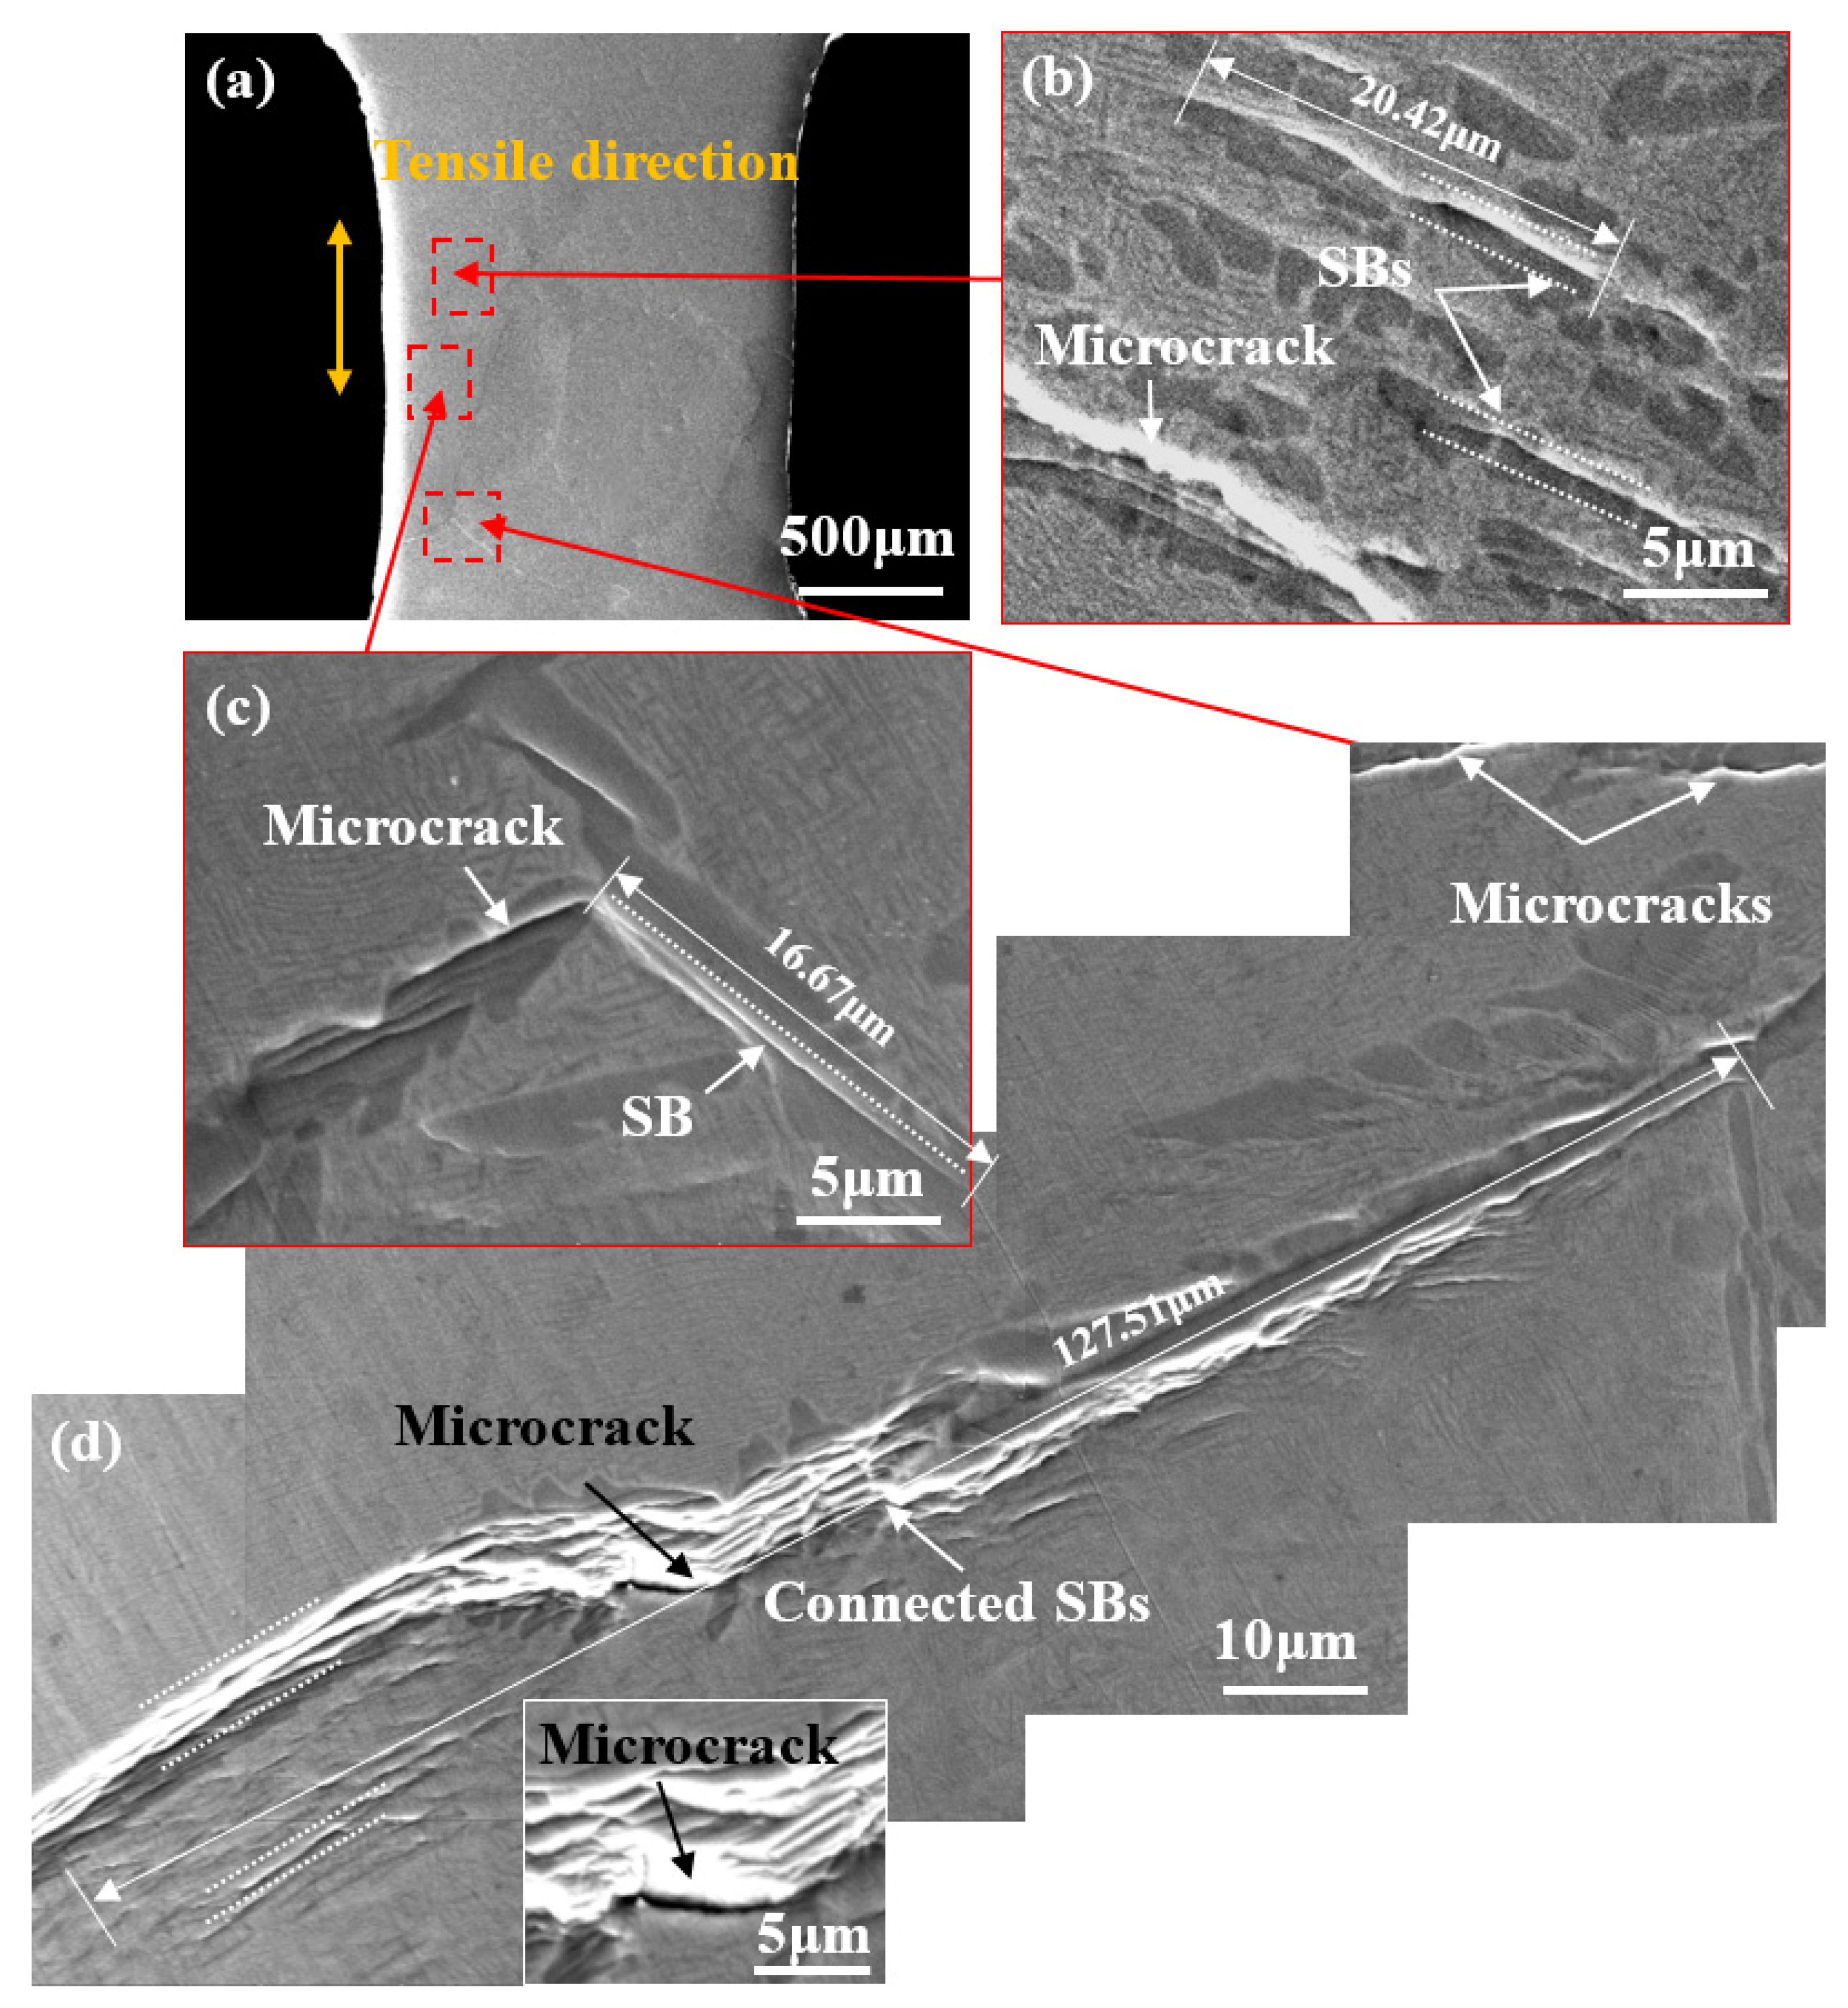
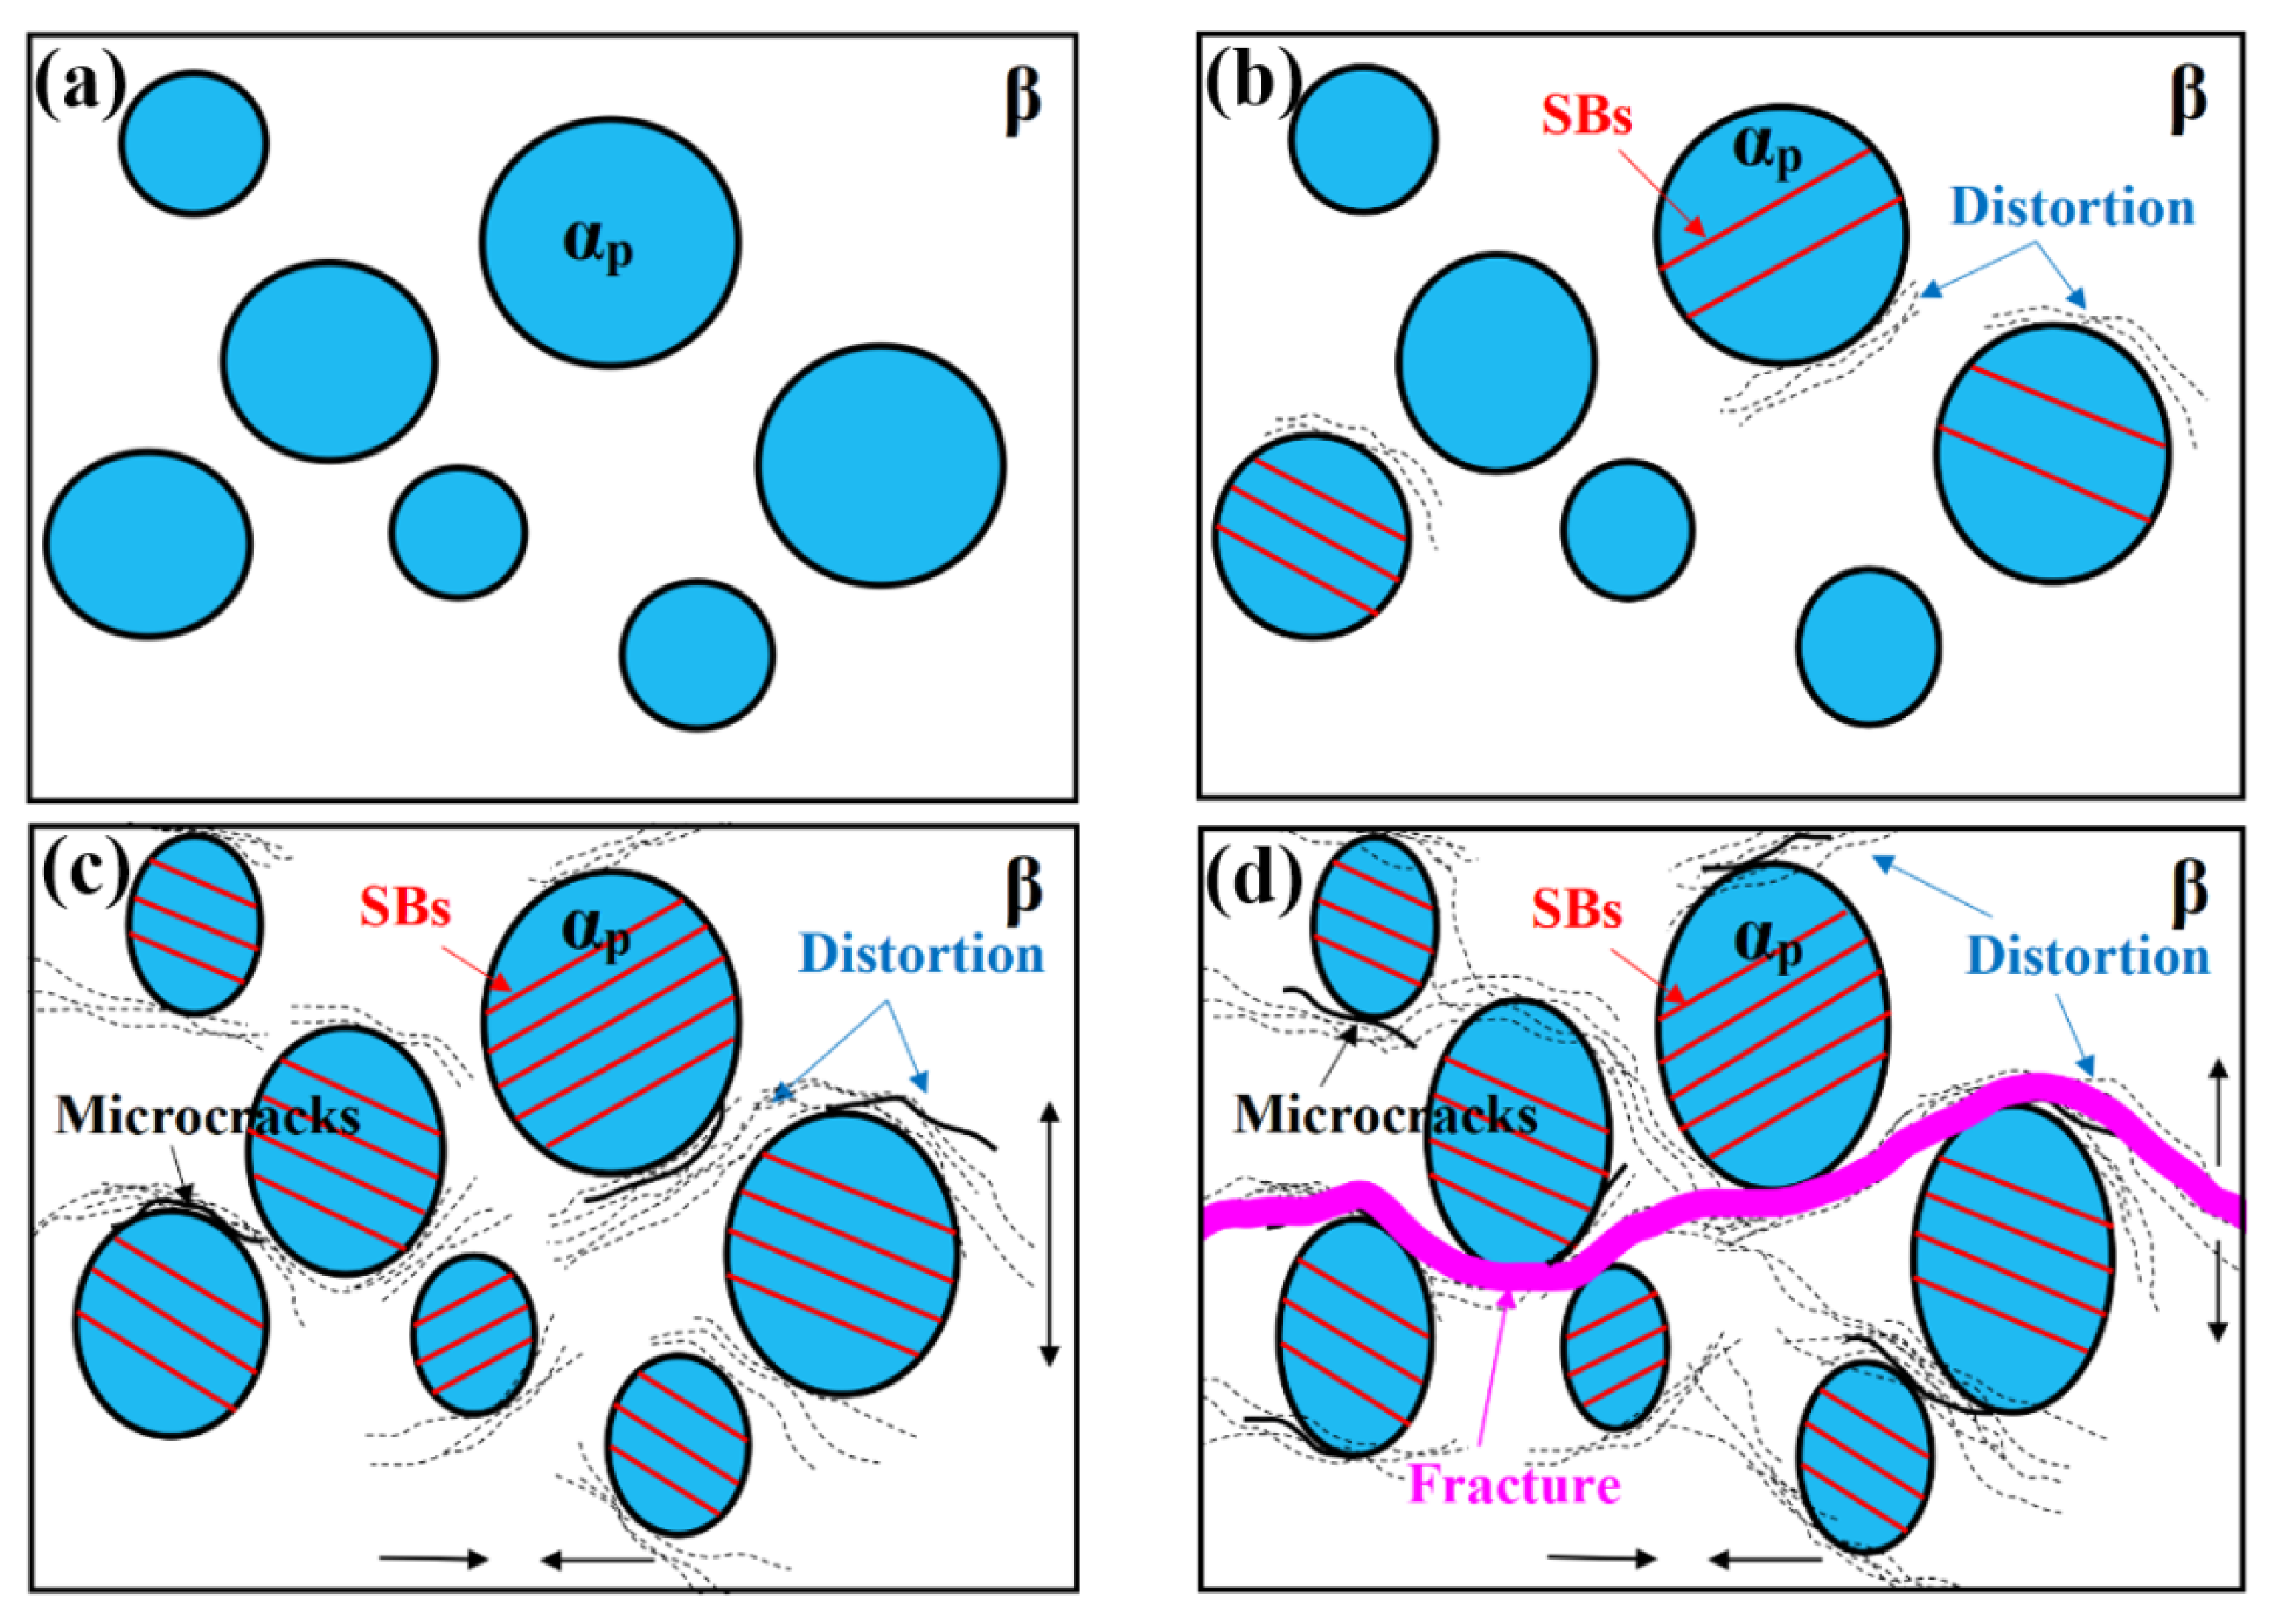
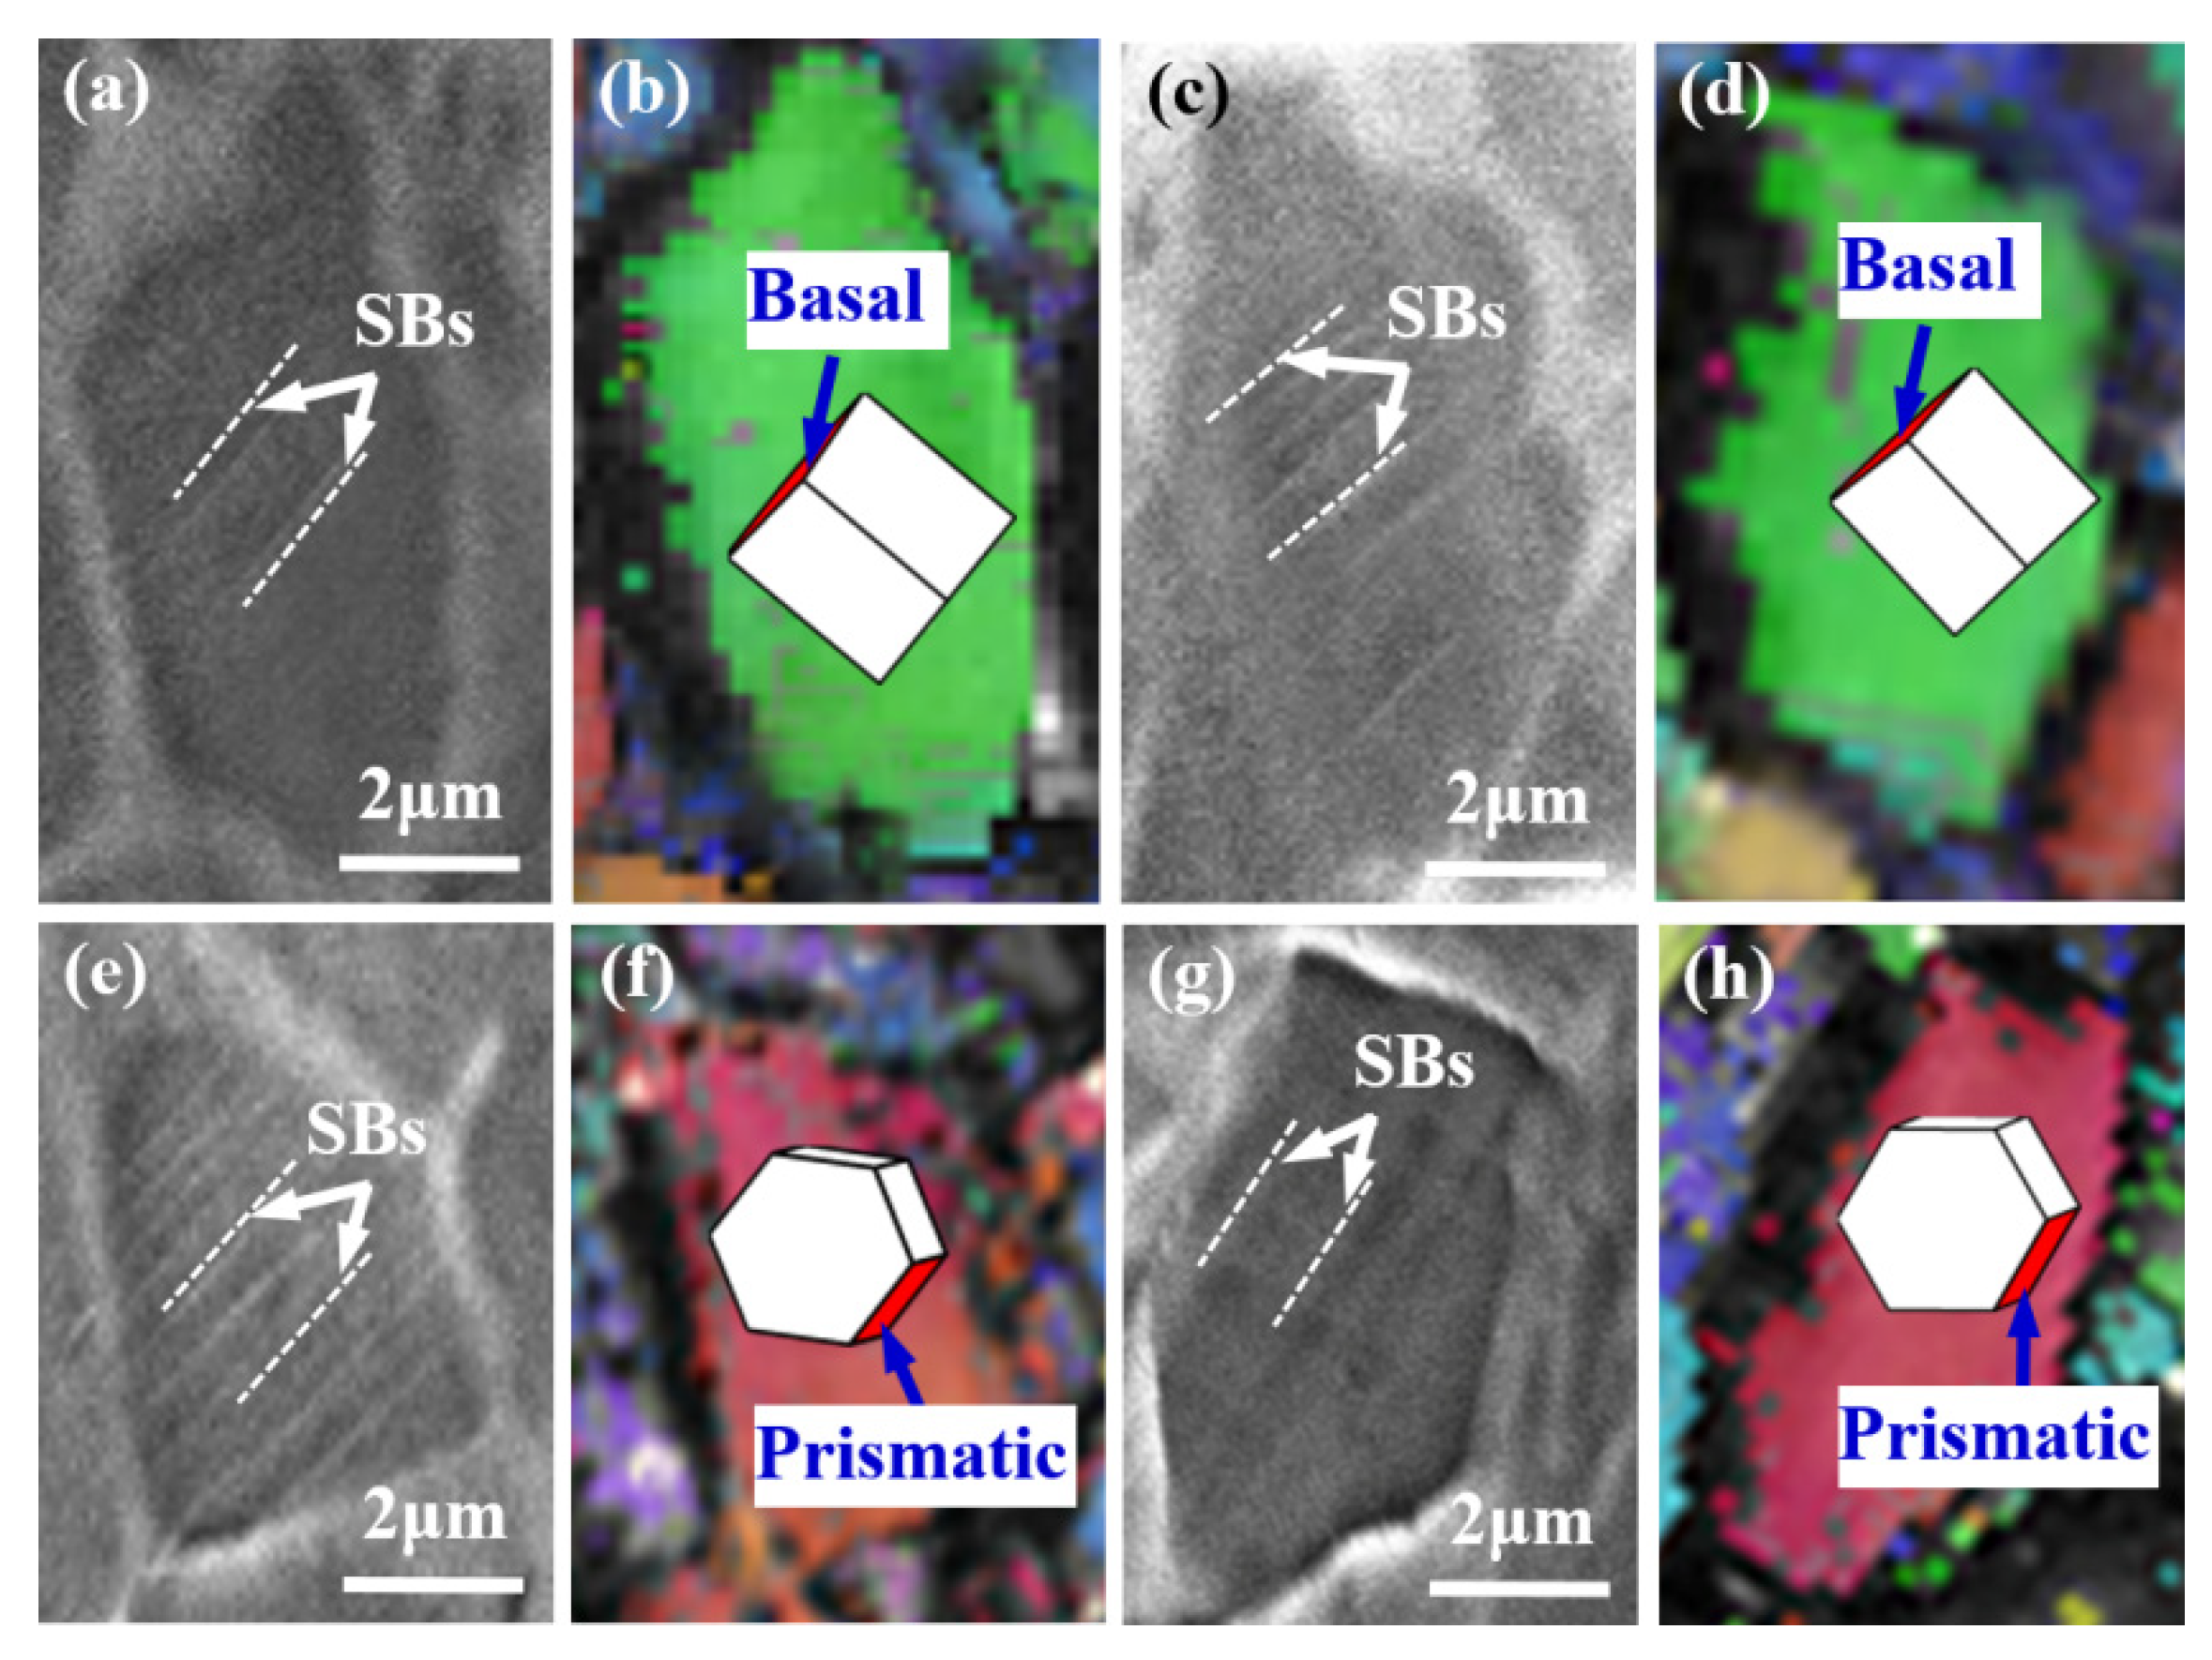
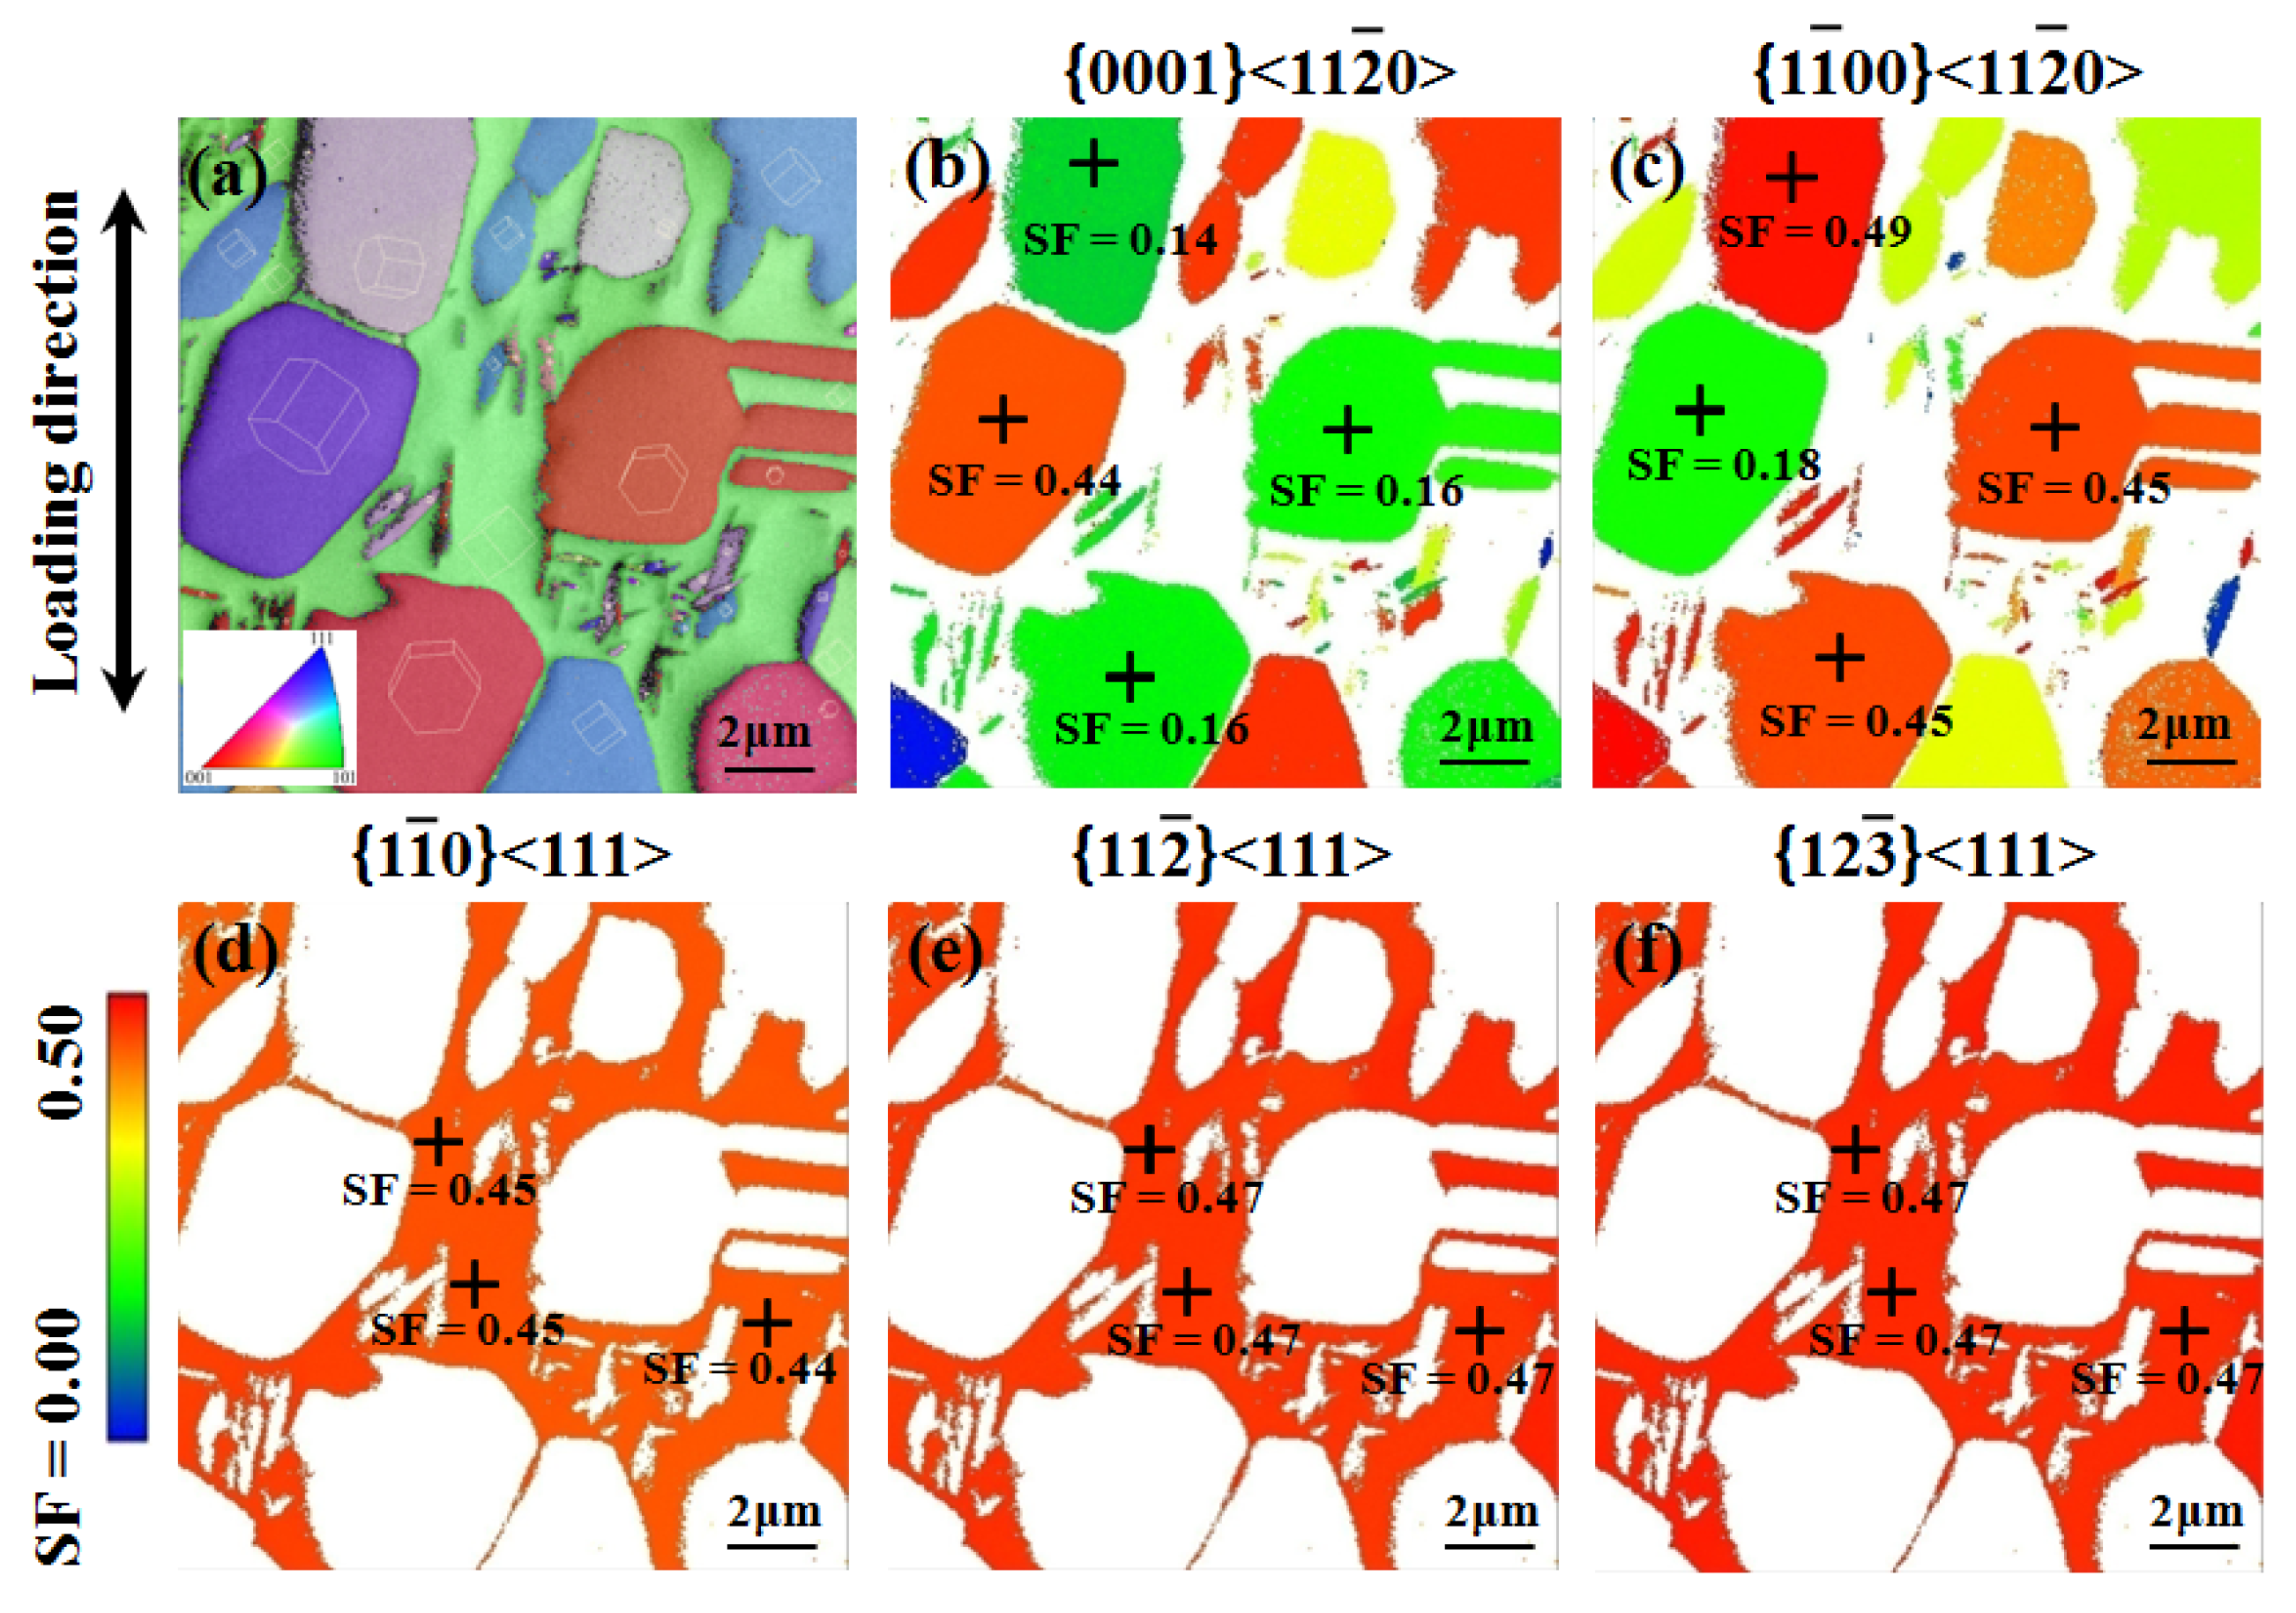
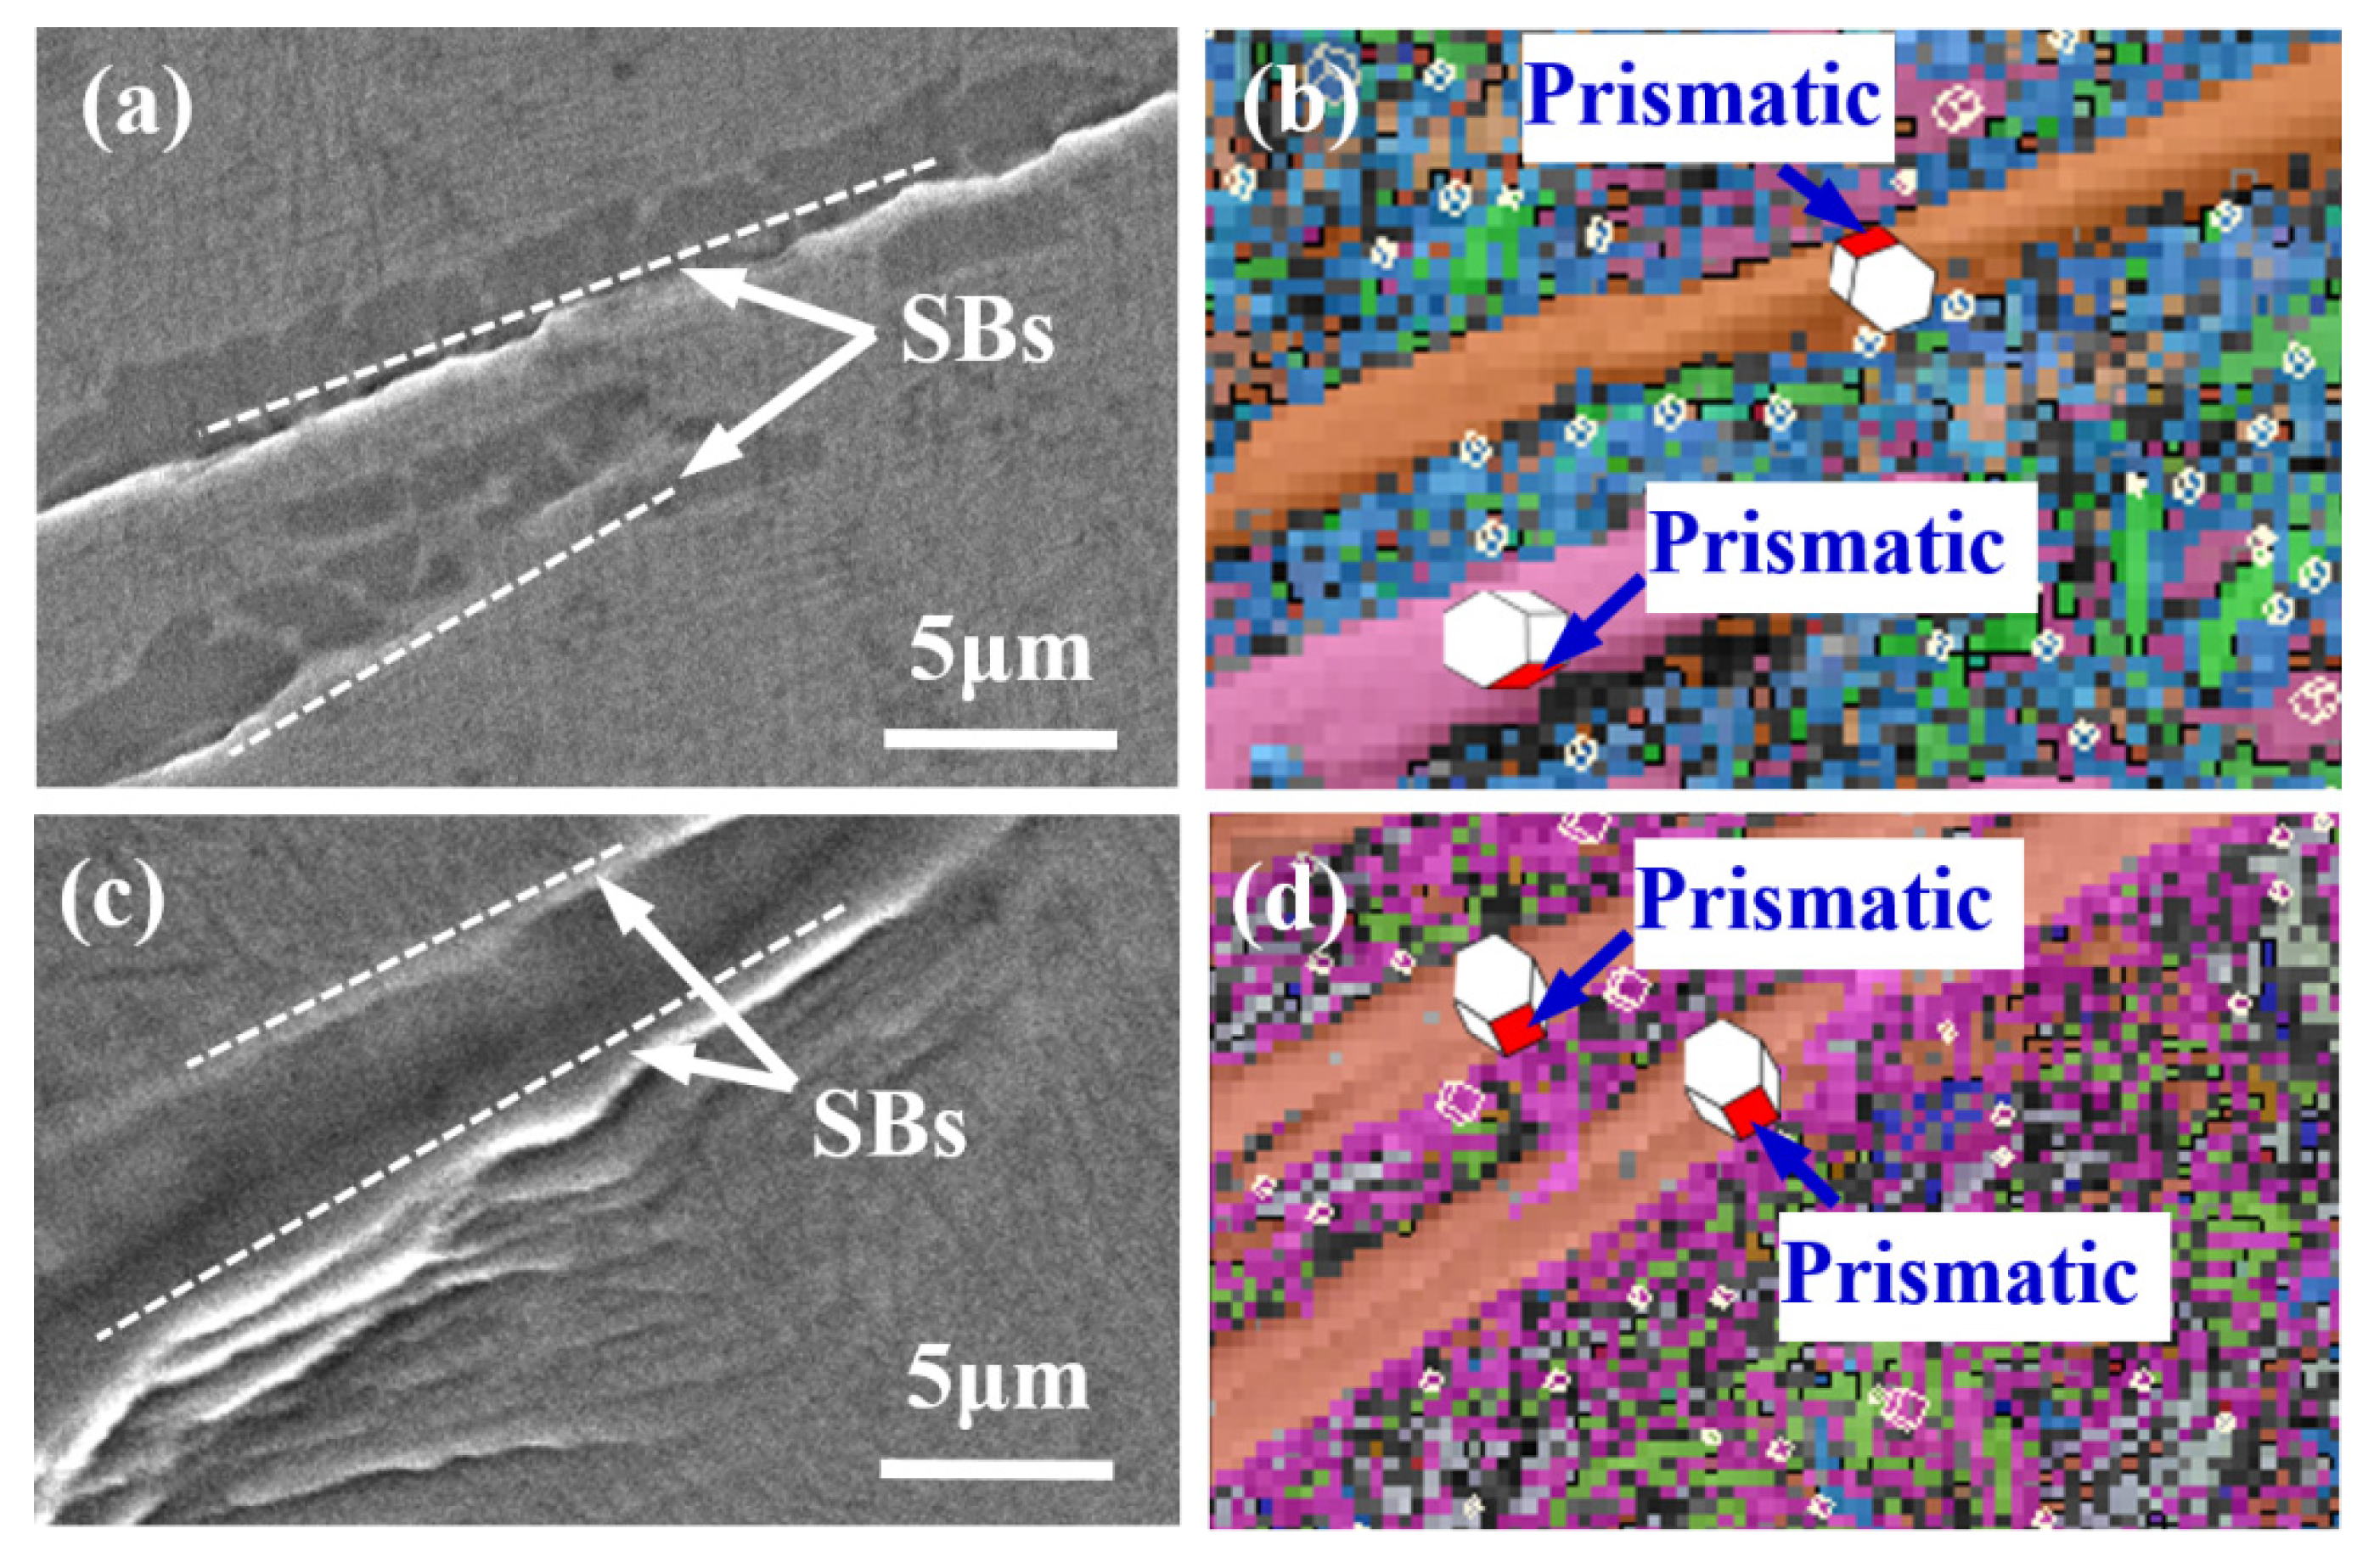
  • For the bimodal microstructure, parallel and deep SBs, at around 45° to the tensile direction, are first observed in the αp phase due to the limited slip systems therein and the stress concentration caused by its large size. These SBs mainly correspond to prismatic or basal slip systems. With increasing strain, distortion at the αp/β interface arises, leading to the evolution of microcracks: the interconnection of the microcracks at the αp/β interface finally leads to the fracturing of the bimodal microstructure.
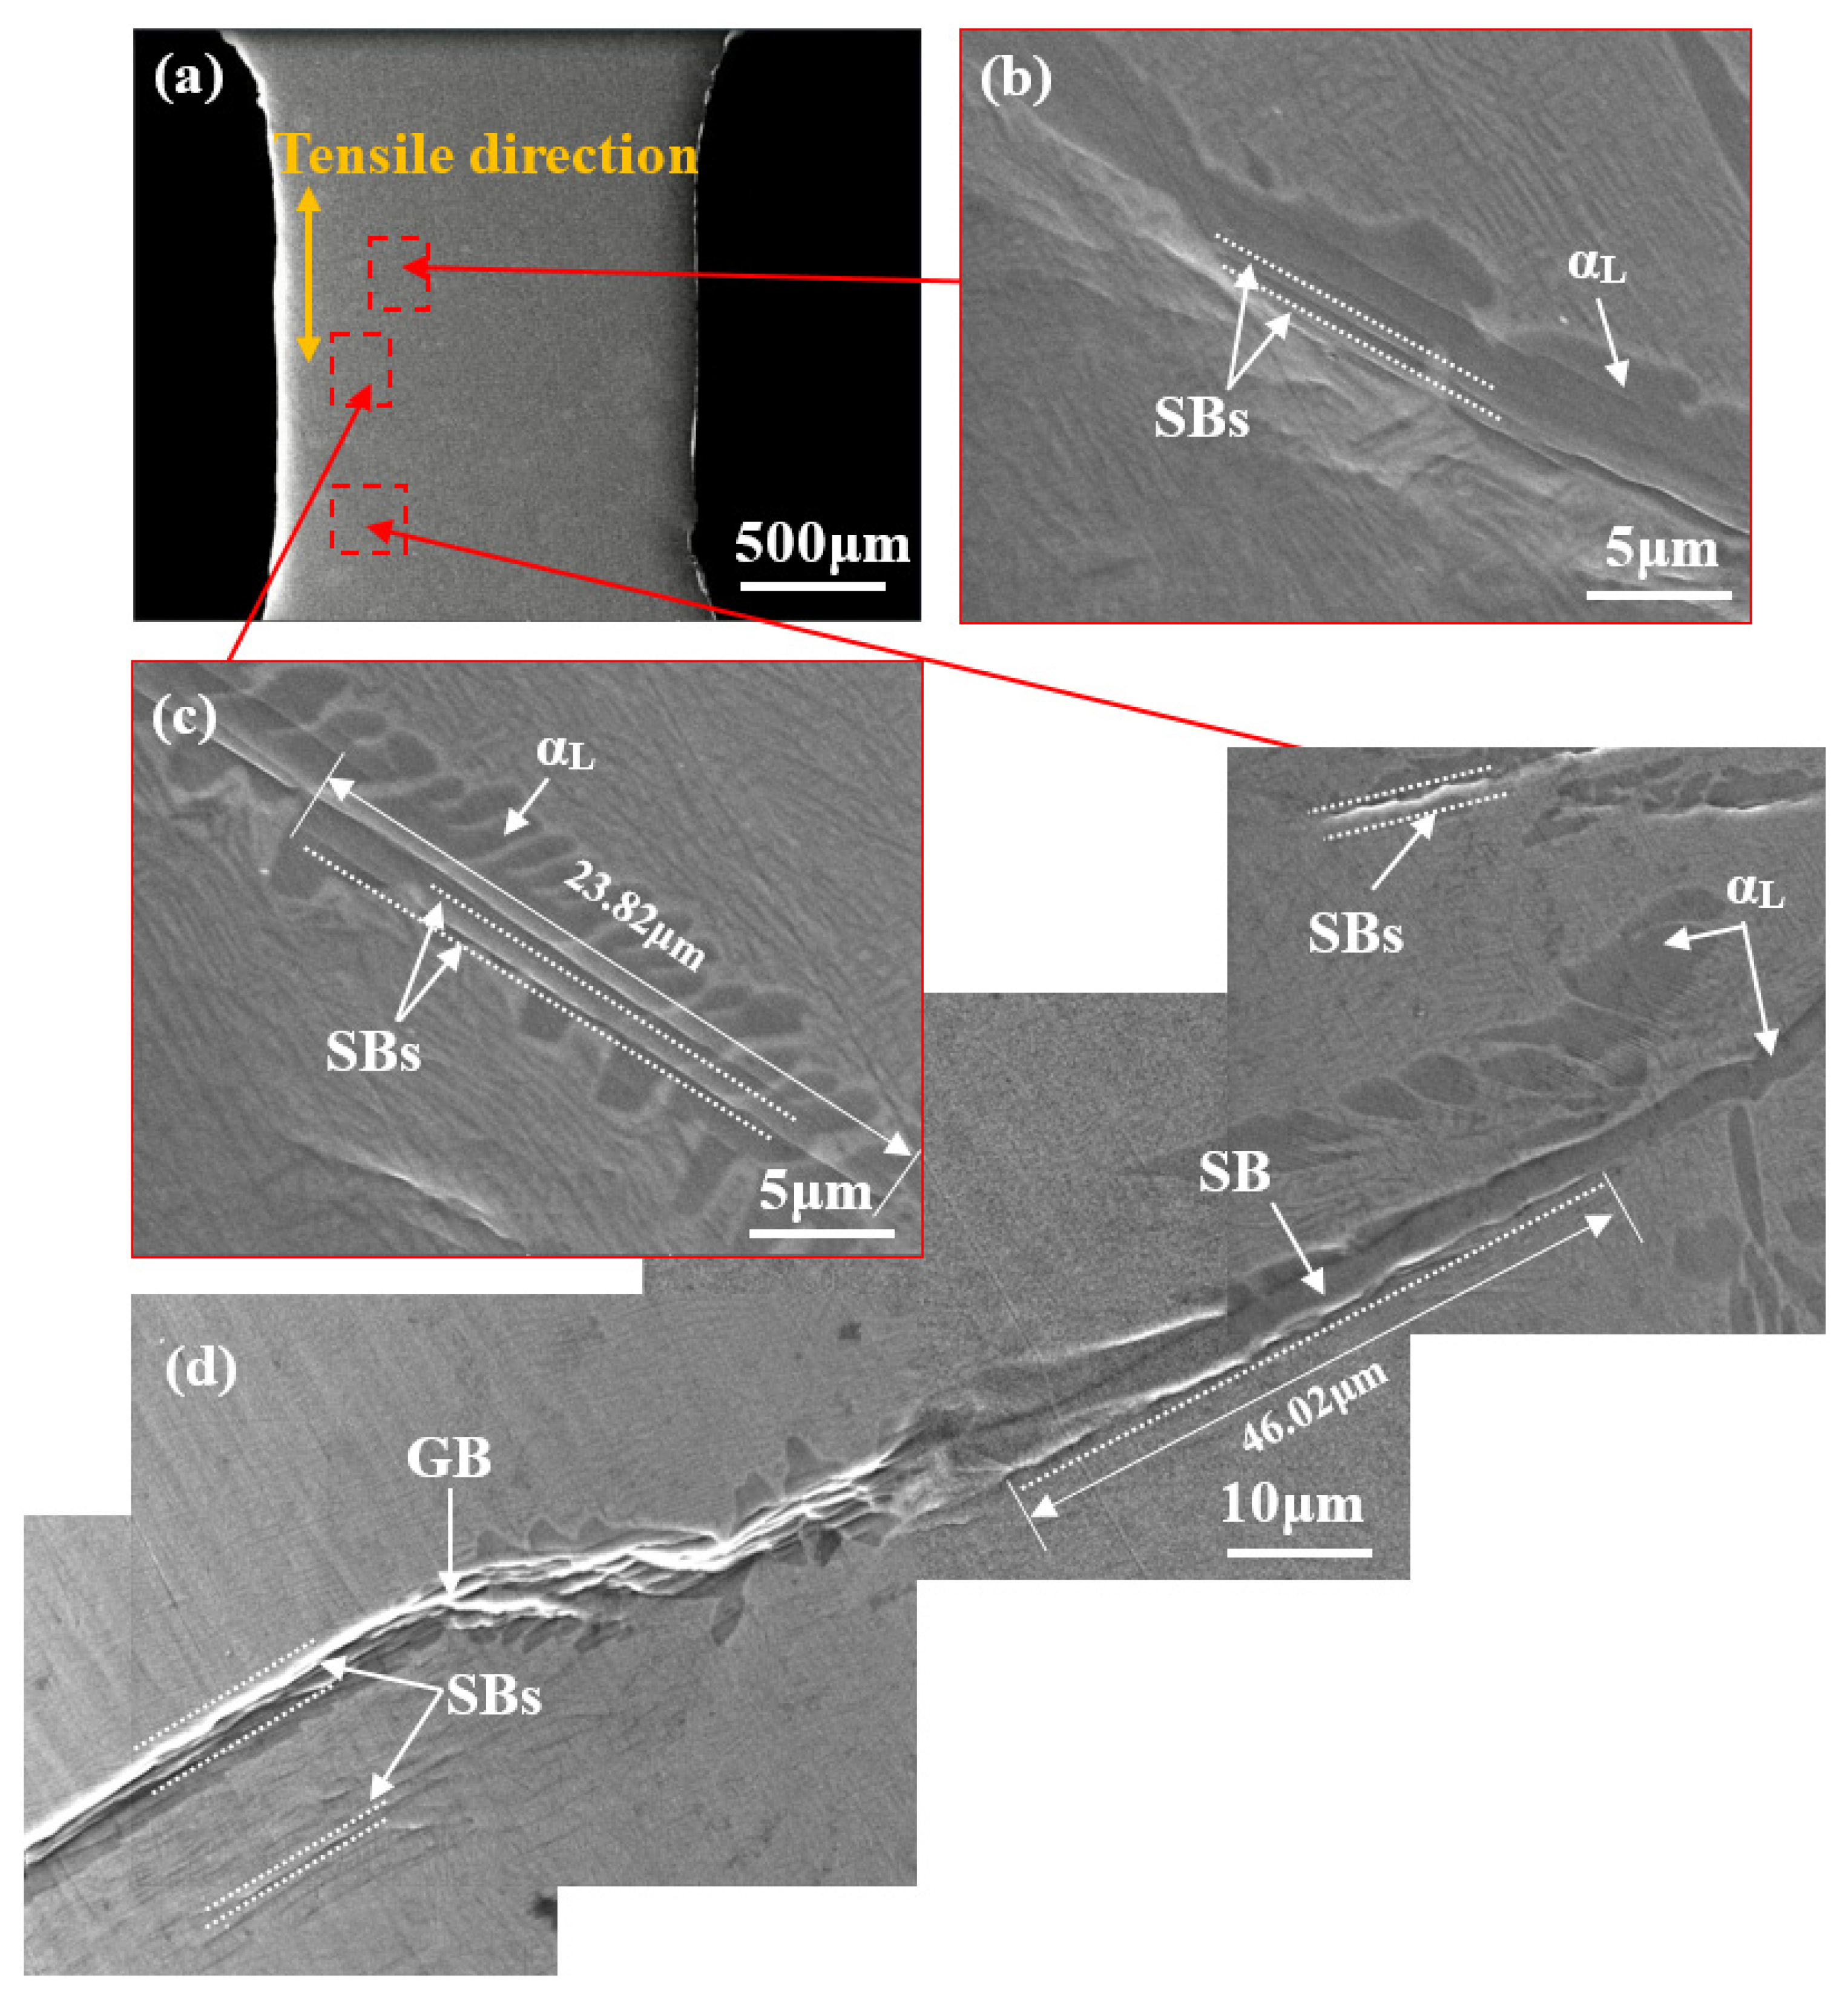
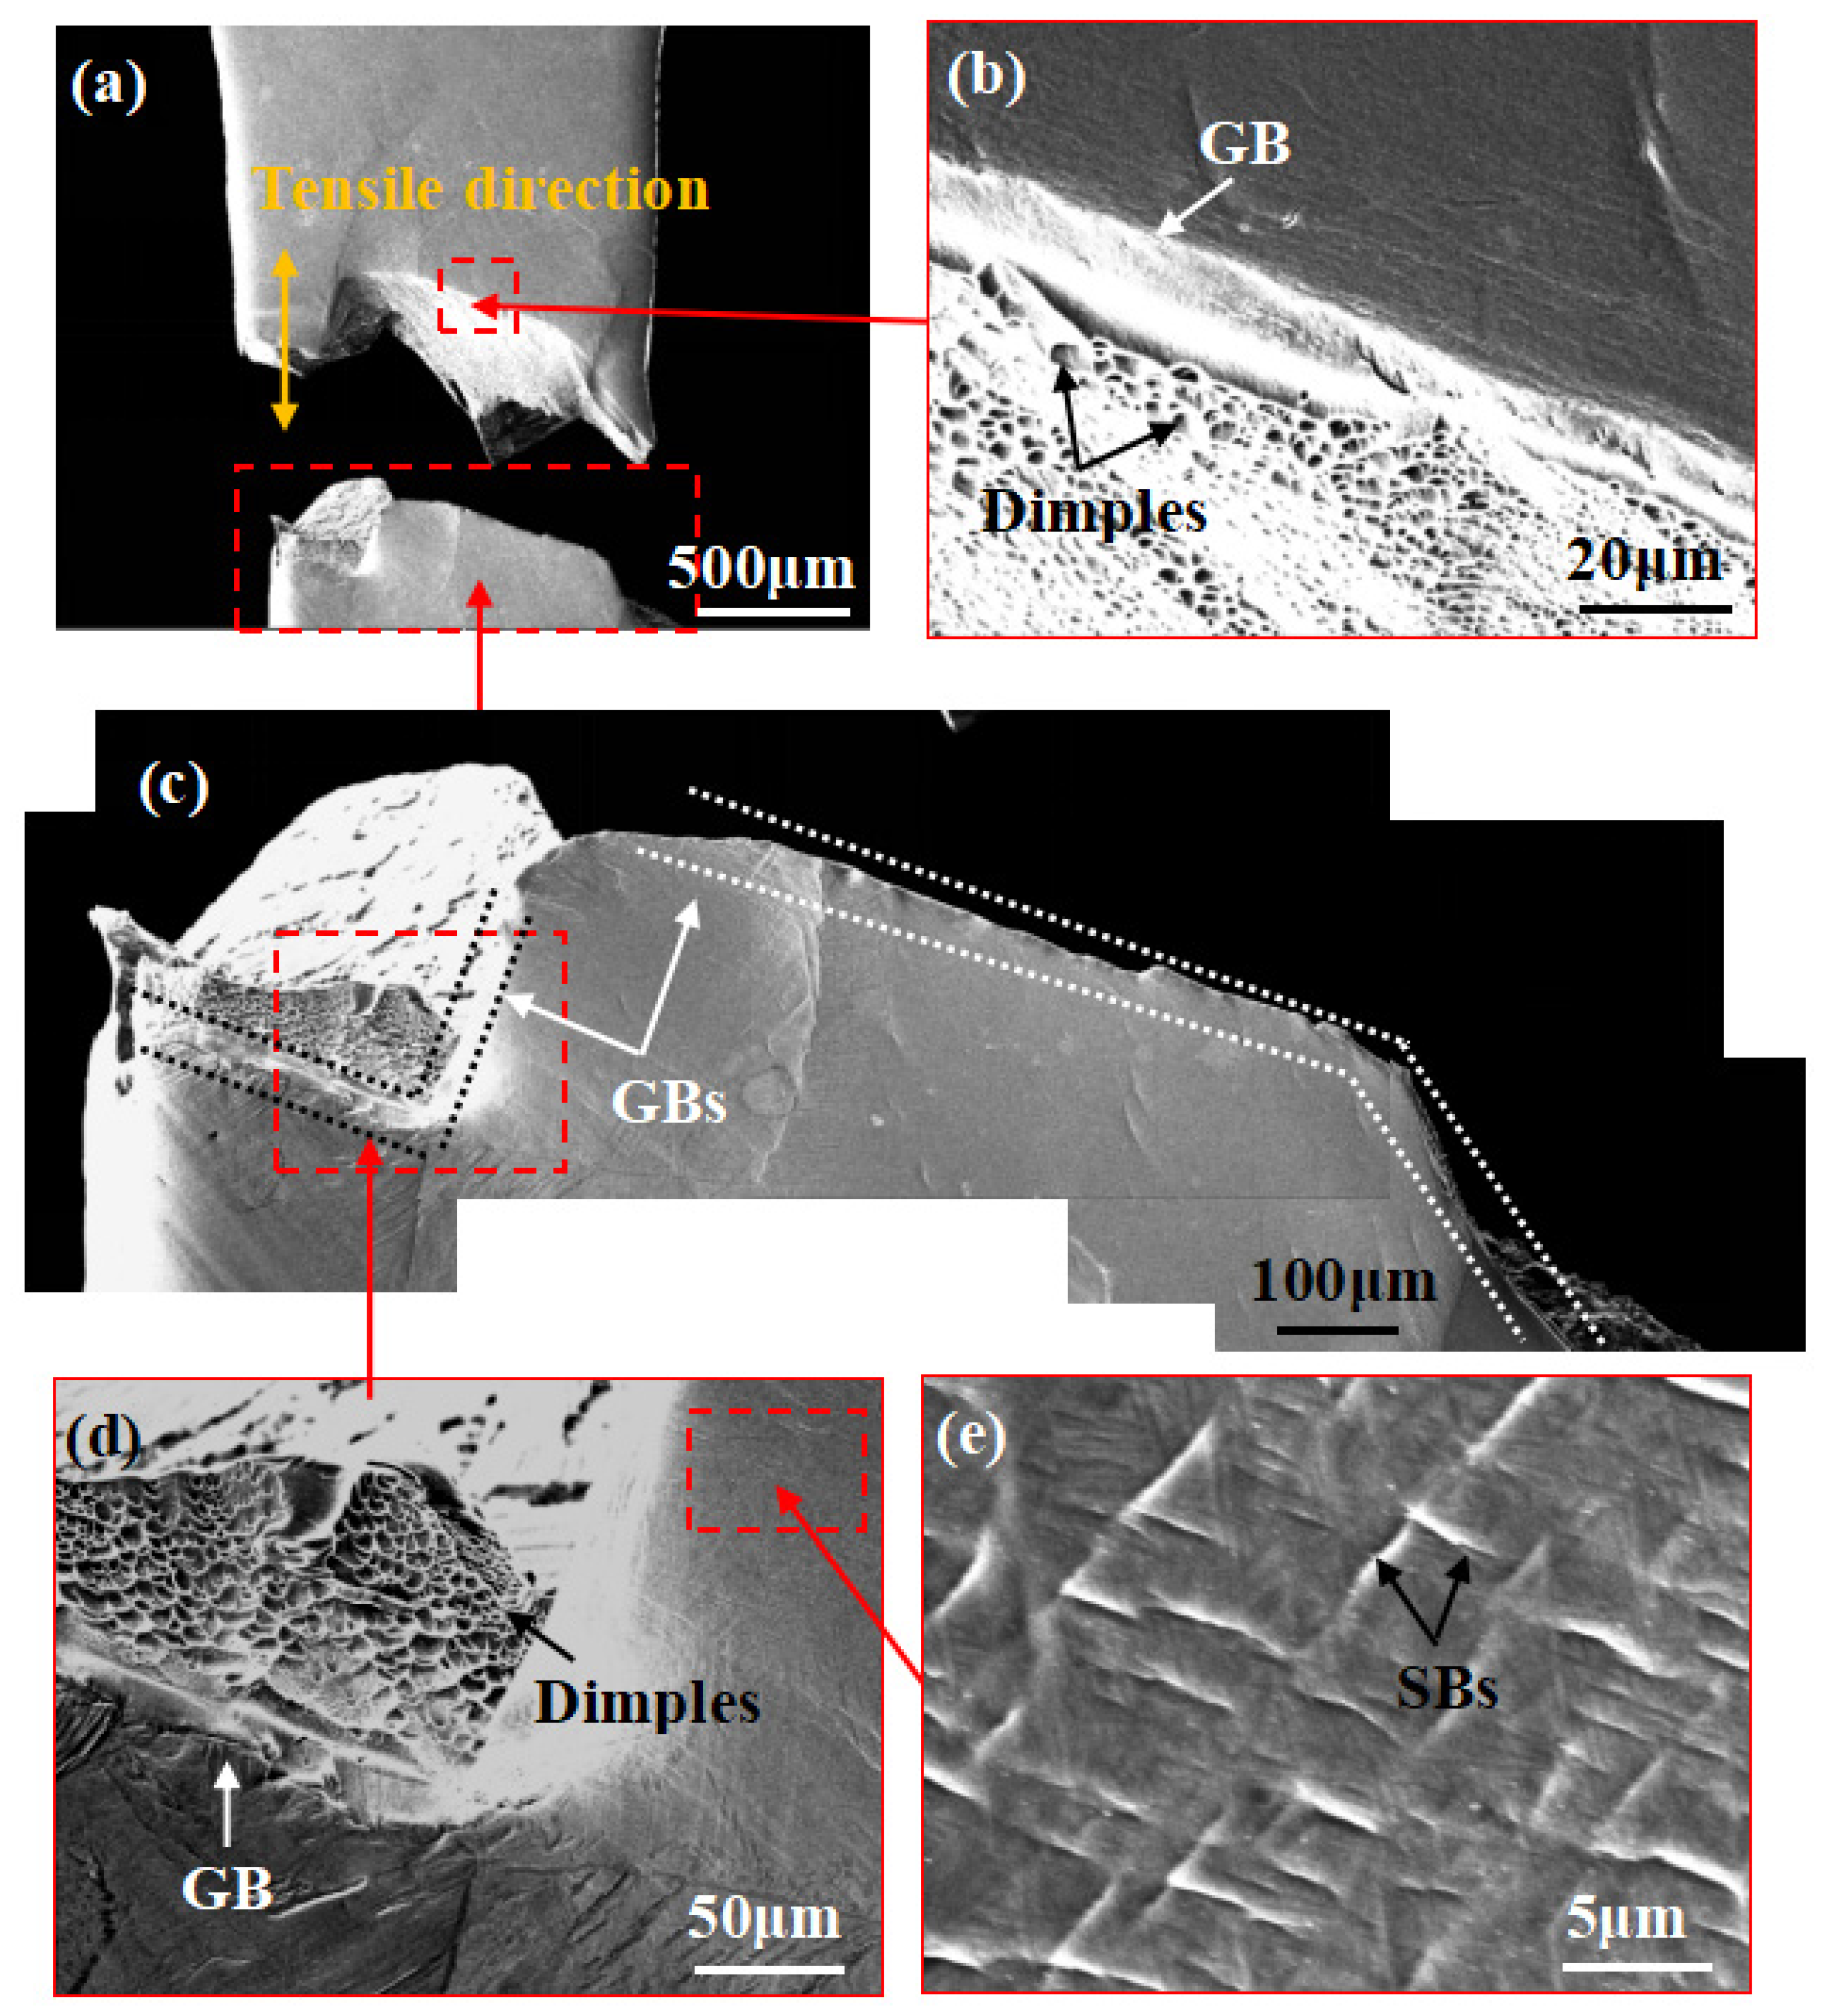
  • For the lamellar microstructure, parallel and deep SBs are first observed in coarse αL phase grains or its interfaces at GBs, making an angle of around 45° to the tensile direction. With increasing strain, these SBs grow along the length of the αL phase and gradually interconnect, thus forming microcracks. The lamellar microstructure finally fractures along the αL phase at GBs through the interconnection of those microcracks in the αL phase.
  • Due to the connected distribution of β and isolated distribution of the αp phase in the bimodal microstructure, the localized deformation readily propagates into the surrounding area through β, which is softer and has a better ability to undergo plastic deformation. This results in the more uniform deformation and higher ductility of specimens with a bimodal microstructure.
  • The coarse αL phase at the GBs greatly restricts the deformation in the β matrix during tensile loading, which in turn produces a significant stress concentration and local deformation in the coarse αL phase. This finally leads to intergranular fracture and contributes to the higher strength and lower ductility of those specimens with a lamellar microstructure.

Author Contributions

Investigation, S.P. and Y.C.; Data acquisition Y.C., S.P. and M.F.; Formal analysis, M.F., H.L., D.Y. and S.P.; Resources, H.L. and Y.C.; Writing—original draft, S.P. and M.F.; Conceptualization, D.Y. H.L. and Y.C. All authors have read and agreed to the published version of the manuscript.

Funding

This research was funded by the State Key Laboratory of Powder Metallurgy (Grant No. 10500-621022001), Central South University, Changsha, China.

Institutional Review Board Statement

Not applicable.

Informed Consent Statement

Informed consent was obtained from all subjects involved in the study.

Data Availability Statement

The data presented in this study are available on request from the corresponding author.

Conflicts of Interest

The authors declare no conflict of interest.

References

  1. Gao, F.Y.; Guo, Y.F.; Yang, S.L.; Yu, Y.; Yu, W. Fatigue properties of friction stir welded joint of titanium alloy. Mater. Sci. Eng. A 2020, 793, 139819. [Google Scholar] [CrossRef]
  2. Vitus, M.T.; Li, C.; Wang, S.F.; Li, J.W.; Xu, X.J. Mechanical properties of near alpha titanium alloys for high–temperature applications—A review. Aircr. Eng. Aerosp. Technol. 2020, 92, 521–540. [Google Scholar]
  3. Chen, W.; Li, C.; Zhang, X.Y.; Chen, C.; Lin, Y.C.; Zhou, K.C. Deformation−induced variations in microstructure evolution and mechanical properties of bi−modal Ti−55511 titanium alloy. J. Alloys Compd. 2019, 783, 709–717. [Google Scholar] [CrossRef]
  4. Zhang, D.D.; Liu, N.; Chen, Y.Y.; Zhang, G.Q.; Tian, J.; Kong, F.T.; Xiao, S.L.; Sun, J.F. Microstructure Evolution and Mechanical Properties of PM-Ti43Al9V0.3Y Alloy. Materials 2020, 13, 198. [Google Scholar] [CrossRef] [Green Version]
  5. Di, W.; Tian, Y.Y.; Zhang, L.G.; Wang, Z.Y.; Sheng, J.W.; Wang, W.L.; Zhou, K.C.; Liu, L.B. Optimal Design of High–Strength Ti–Al–V–Zr Alloys through a Combinatorial Approach. Materials 2018, 11, 1603. [Google Scholar]
  6. Shao, H.; Shan, D.; Wang, K.X.; Zhang, G.J.; Zhao, Y.Q. Massive α precipitation selectivity and tensile fracture behavior of TC18 alloy. J. Alloys Compd. 2019, 797, 10–17. [Google Scholar] [CrossRef]
  7. Li, C.; Chen, J.; Li, W.; He, J.J.; Qin, W.; Ren, Y.J.; Chen, J.L.; Chen, J.H. Study on the relationship between microstructure and mechanical property in a metastable β titanium alloy. J. Alloys Compd. 2015, 627, 222–230. [Google Scholar] [CrossRef]
  8. Cui, N.; Wu, Q.Q.; Bi, K.X.; Xu, T.W.; Kong, F.T. Effect of Heat Treatment on Microstructures and Mechanical Properties of a Novel β-Solidifying TiAl Alloy. Materials 2019, 12, 1672. [Google Scholar] [CrossRef] [PubMed] [Green Version]
  9. Yadav, P.; Saxena, K.K. Effect of heat−treatment on microstructure and mechanical properties of Ti alloys: An overview. Mater. Today Proc. 2020, 26, 2546–2557. [Google Scholar] [CrossRef]
  10. Zhu, W.G.; Sun, Q.Y.; Tan, C.S.; Li, P.; Xiao, L.; Sun, J. Tensile brittleness and ductility improvement in a novel metastable β titanium alloy with lamella structure. J. Alloys Compd. 2020, 827, 154311. [Google Scholar] [CrossRef]
  11. Srinivasu, G.; Natraj, Y.; Bhattacharjee, A.; Nandy, T.K.; Rao, G.V.S.N. Tensile and fracture toughness of high strength β Titanium alloy, Ti–10V–2Fe–3Al, as a function of rolling and solution treatment temperatures–ScienceDirect. Mater. Des. 2013, 47, 323–330. [Google Scholar] [CrossRef]
  12. Kar, S.K.; Suman, S.; Shivaprasad, S.; Chaudhuri, A.; Bhattacharjee, A. Processing–microstructure–yield strength correlation in a near β Ti alloy, Ti–5Al–5Mo–5V–3Cr. Mater. Sci. Eng. A 2014, 610, 171–180. [Google Scholar] [CrossRef]
  13. Wu, G.Q.; Shi, C.L.; Sha, W.; Sha, A.X.; Jiang, H.R. Microstructure and high cycle fatigue fracture surface of a Ti–5Al–5Mo–5V–1Cr–1Fe titanium alloy. Mater. Sci. Eng. A 2013, 575, 111–118. [Google Scholar] [CrossRef] [Green Version]
  14. Qin, D.Y.; Li, Y.L. The role of microstructure and stress state in dynamic mechanical behavior of Ti−5Al−5V−5Mo−3Cr alloy. Mater. Charact. 2018, 147, 421–433. [Google Scholar] [CrossRef]
  15. Zheng, C.; Wang, F.C.; Cheng, X.W.; Fu, K.Q.; Liu, J.X.; Wang, Y.F.; Liu, T.T.; Zhu, Z.X. Effect of microstructures on ballistic impact property of Ti-6Al-4V targets. Mater. Sci. Eng. A 2014, 608, 53–62. [Google Scholar] [CrossRef]
  16. Wu, D.; Liu, L.B.; Zhang, L.G.; Wang, W.L.; Zhou, K.C. Tensile deformation mechanism and micro−void nucleation of Ti−55531 alloy with bimodal microstructure. J. Mater. Res. Technol. 2020, 9, 15442–15453. [Google Scholar] [CrossRef]
  17. Qin, D.Y.; Li, Y.L.; Zhang, S.Y.; Zhou, L. On the tensile embrittlement of lamellar Ti–5Al–5V–5Mo–3Cr alloy. J. Alloys Compd. 2016, 663, 581–593. [Google Scholar] [CrossRef]
  18. Zhao, Q.Y.; Yang, F.; Torrens, R.; Bolzoni, L. In-situ observation of the tensile deformation and fracture behaviour of powder–consolidated and as–cast metastable beta titanium alloys. Mater. Sci. Eng. A 2019, 750, 45–59. [Google Scholar] [CrossRef]
  19. Wan, X.; Zhu, K.; Xu, Y.J.; Han, B.S.; Jing, T. In-Situ Observation of Fracture Behavior of Ti–Aluminide Multi–Layered Composites Produced by a Hybrid Sintering Process. Materials 2019, 12, 1568. [Google Scholar] [CrossRef] [PubMed] [Green Version]
  20. Huang, S.X.; Zhao, Q.Y.; Lin, C.; Wu, C.; Zhao, Y.Q.; Jia, W.J.; Mao, C.L. In-situ investigation of tensile behaviors of Ti–6Al alloy with extra low interstitial. Mater. Sci. Eng. A 2021, 809, 140958. [Google Scholar] [CrossRef]
  21. Zhang, S.F.; Zeng, W.D.; Zhao, Q.Y.; Ge, L.L.; Zhang, M. In situ SEM study of tensile deformation of a near–β titanium alloy. Mater. Sci. Eng. A 2017, 708, 574–581. [Google Scholar] [CrossRef]
  22. Shao, H.; Zhao, Y.Q.; Ge, P.; Zeng, W.D. In-situ SEM observations of tensile deformation of the lamellar microstructure in TC21 titanium alloy. Mater. Sci. Eng. A 2013, 559, 515–519. [Google Scholar] [CrossRef]
  23. Huang, J.; Wang, Z.R.; Xue, K.M. Cyclic deformation response and micromechanisms of Ti alloy Ti–5Al–5V–5Mo–3Cr–0.5Fe. Mater. Sci. Eng. A 2011, 528, 8723–8732. [Google Scholar] [CrossRef]
  24. Tan, C.S.; Sun, Q.Y.; Xiao, L.; Zhao, Y.Q.; Sun, J. Characterization of deformation in primary α phase and crack initiation and propagation of TC21 alloy using in-situ SEM experiments. Mater. Sci. Eng. A 2018, 725, 33–42. [Google Scholar] [CrossRef]
  25. Liu, R.; Hui, S.X.; Ye, W.J.; Xiong, B.Q.; Yu, Y.; Fu, Y.Y. Dynamic fracture toughness of TA15ELI alloy studied by instrumented impact test. Rare Metals 2010, 29, 608–612. [Google Scholar] [CrossRef]
  26. Liu, R.; Hui, S.X.; Ye, W.J.; Yu, Y.; Fu, Y.Y.; Song, X.Y.; Deng, X.G. Tensile and fracture properties of Ti–62A alloy plate with different microstructures. Rare Metals 2012, 31, 420–423. [Google Scholar] [CrossRef]
  27. Qin, D.Y.; Lu, Y.F.; Liu, Q.; Zheng, L.; Zhou, L. Transgranular shearing introduced brittlement of Ti–5Al–5V–5Mo–3Cr alloy with full lamellar structure at room temperature. Mater. Sci. Eng. A 2013, 572, 19–24. [Google Scholar] [CrossRef]
  28. Semiatin, S.L.; Bieler, T.R. Effect of texture and slip mode on the anisotropy of plastic flow and flow softening during hot working of Ti–6Al–4V. Metall. Mater. Trans. A 2001, 32, 1787–1799. [Google Scholar] [CrossRef]
  29. Banerjee, D.; Williams, J.C. Microstructure and slip character in titanium alloys. Def. Sci. J. 2014, 36, 191–206. [Google Scholar] [CrossRef]
  30. Chong, Y.; Bhattacharjee, T.; Park, M.H.; Shibata, A.; Tsuji, N. Factors determining room temperature mechanical properties of bimodal microstructures in Ti–6Al–4V alloy. Mater. Sci. Eng. A 2018, 730, 217–222. [Google Scholar] [CrossRef]
  31. Chong, Y.; Deng, G.Y.; Yi, J.H.; Shibata, A.; Tsuji, N. On the strain hardening abilities of α+β titanium alloys: The roles of strain partitioning and interface length density. J. Alloys Compd. 2019, 811, 152040. [Google Scholar] [CrossRef]
Figure 1. Heat treatment routes for bimodal and lamellar samples.
Materials 14 05794 g001
Figure 2. (a) Mechanical test bench; (b) geometry and dimensions of in situ tensile test specimens at room temperature (units: mm).
Materials 14 05794 g002
Figure 3. BSE-SEM images of samples before stretching in situ; (a) bimodal microstructure; (b) lamellar microstructure.
Materials 14 05794 g003
Figure 4. The stress–displacement curves of samples with bimodal and lamellar microstructures stretched in situ at room temperature.
Materials 14 05794 g004
Figure 5. (a) In situ SEM images of the bimodal microstructure at position A; (b) magnified image showing SBs passing through the αp/β interface; (c) SBs formed in the region containing the αp phase; (d) distortion at the αp/β interface region.
Materials 14 05794 g005
Figure 6. (a) In situ SEM images of the bimodal microstructure at position B; (b) magnified image showing microcracks formed on the edge of the sample; (c) microcracks initiated from the αp/β interface; (d) distortion was aggravated around the αp/β interface.
Materials 14 05794 g006
Figure 7. (a) The streamlined shape of the β matrix near the fractured zone at position C; (b) a crack propagated along the αp/β interface; (c,f) SEM images showing the rough fracture surface of the sample; (d) magnified image showing intensified SB formation in the αp phase and microcracking at the αp/β interface; (e) macroscopical SEM images of the bimodal microstructure at position C.
Materials 14 05794 g007
Figure 8. In situ SEM images of bimodal samples; (a) a selected area at position A; (b) magnified image showing the morphologies of αp phase at position A; (c) the area in (a) stretched to position B; (d) magnified image illustrating the deformation within αp phase at position B.
Materials 14 05794 g008
Figure 9. (a) In situ SEM images of lamellar microstructure at position A’; (b,c) magnified image showing several SBs in an αL phase or at its interface; (d) magnified image showing plentiful SBs in a long coarse αL phase at a GB at an angle of about 45° to the tensile direction.
Materials 14 05794 g009
Figure 10. (a) In situ SEM images of lamellar microstructure at position B’; (b,c) magnified image showing several microcracks formed in αL phase or at their interfaces; (d) magnified image showing SBs connected with each other and forming an SB with a length of 127.51 μm.
Materials 14 05794 g010
Figure 11. (a) In situ SEM images of the lamellar microstructure at position C’; (b,d) magnified images showing many small, shallow dimples on the fracture surface; (c) magnified image showing the sample with a shape fracture surface generally breaking along the GB; (e) some short crossed SBs are shown in the β matrix adjacent to the fracture surface.
Materials 14 05794 g011
Figure 12. In situ SEM images of the lamellar microstructure; (a) a selected area at position A’; (b) magnified image showing the morphologies of αL phase at position A’; (c) the area in (a) stretched to position B’; (d) magnified image illustrating the deformation within αL phase at position B’.
Materials 14 05794 g012
Figure 13. Schematic mechanism showing the evolution of bimodal microstructure during in situ stretching; (a) the initial microstructure; (b) at a relatively low strain; (c) at a relatively high strain; (d) schematic mechanism of deformation of bimodal samples after fracture.
Materials 14 05794 g013
Figure 14. Examples of identification of activated slip systems on the αp phase in bimodal microstructure; (a,b) a basal slip activates (SF = 0.38) in the αp phase; (c,d) a basal slip activates (SF = 0.37) in the αp phase; (e,f) a prismatic slip activates (SF = 0.45) in the αp phase; (g,h) a prismatic slip activates (SF = 0.46) in the αp phase.
Materials 14 05794 g014
Figure 15. EBSD images of bimodal microstructure before stretching in situ; (a) inverse pole-figure (IPF) map; (b) SF map of α for basal slip; (c) SF map of α for prismatic slip; (d) SF map of β for {1−10}<111> slip; (e) SF map of β for {11−2}<111> slip; (f) SF map of β for {12−3}<111> slip.
Materials 14 05794 g015
Figure 16. Schematic mechanism showing the evolution of lamellar samples during in situ stretching; (a) initial microstructure; (b) at a relatively low tensile displacement; (c) at a relatively high tensile displacement; (d) schematic mechanism of the deformation of lamellar samples after fracture.
Materials 14 05794 g016
Figure 17. Examples of identification of activated slip systems on αL phase in lamellar microstructure; (a,b) prismatic slips activate in two αL phase with SF values of 0.44 and 0.42, respectively; (c,d) prismatic slips activate in two αL phases with SF values of 0.43 and 0.45, respectively.
Materials 14 05794 g017
Table 1. Calculation of εL values for αp phase (Figure 8) from positions A to B.
No.Position A (μm)Position B (μm)Δ (Position A→B) (μm)εL (%)
αp16.547.15 0.61 9.33
αp26.78 7.30 0.52 7.67
αp36.84 7.52 0.68 9.94
αp45.67 6.13 0.46 8.11
αp55.34 5.77 0.43 8.05
αp66.78 7.44 0.66 9.73
αp77.12 7.73 0.61 8.57
αp87.46 8.32 0.86 11.53
αp98.64 9.43 0.79 9.14
αp107.54 8.61 1.07 14.19
αp118.13 9.27 1.14 14.02
αp125.49 5.98 0.49 8.93
αp134.91 5.39 0.48 9.78
αp145.17 5.62 0.45 8.70
αp157.80 8.25 0.45 5.77
αp166.19 6.86 0.67 10.82
αp176.89 7.29 0.40 5.81
αp188.22 9.12 0.90 10.95
αp195.94 6.43 0.49 8.25
αp209.83 10.57 0.74 7.53
αp218.14 9.36 1.22 14.99
αp224.87 5.21 0.34 6.98
αp235.59 6.28 0.69 12.34
αp248.64 9.78 1.14 13.19
αp256.19 6.72 0.53 8.56
Average9.72
Table 2. Calculation of εL values of αL phase (Figure 12) from positions A’ to B’.
No.Position A’ (μm)Position B’ (μm)Δ (Position A’→B’) (μm)εL (%)
αL13.4413.4590.0180.52
αL22.9572.9730.0160.54
αL36.0686.1080.0400.66
αL43.9253.9340.0090.23
αL54.0844.1080.0240.59
αL67.1897.2570.0680.95
αL72.9963.0120.0160.53
αL85.8395.8740.0350.60
αL96.2266.2830.0570.92
αL105.1445.1810.0370.72
αL112.5272.5450.0180.71
αL1226.77428.3241.5505.79
---Average1.06
Publisher’s Note: MDPI stays neutral with regard to jurisdictional claims in published maps and institutional affiliations.

