
Experimental Study on Tensile Mechanical Properties and Reinforcement Ratio of Steel–Plastic Compound Geogrid-Reinforced Belt


 ,
, 
Abstract
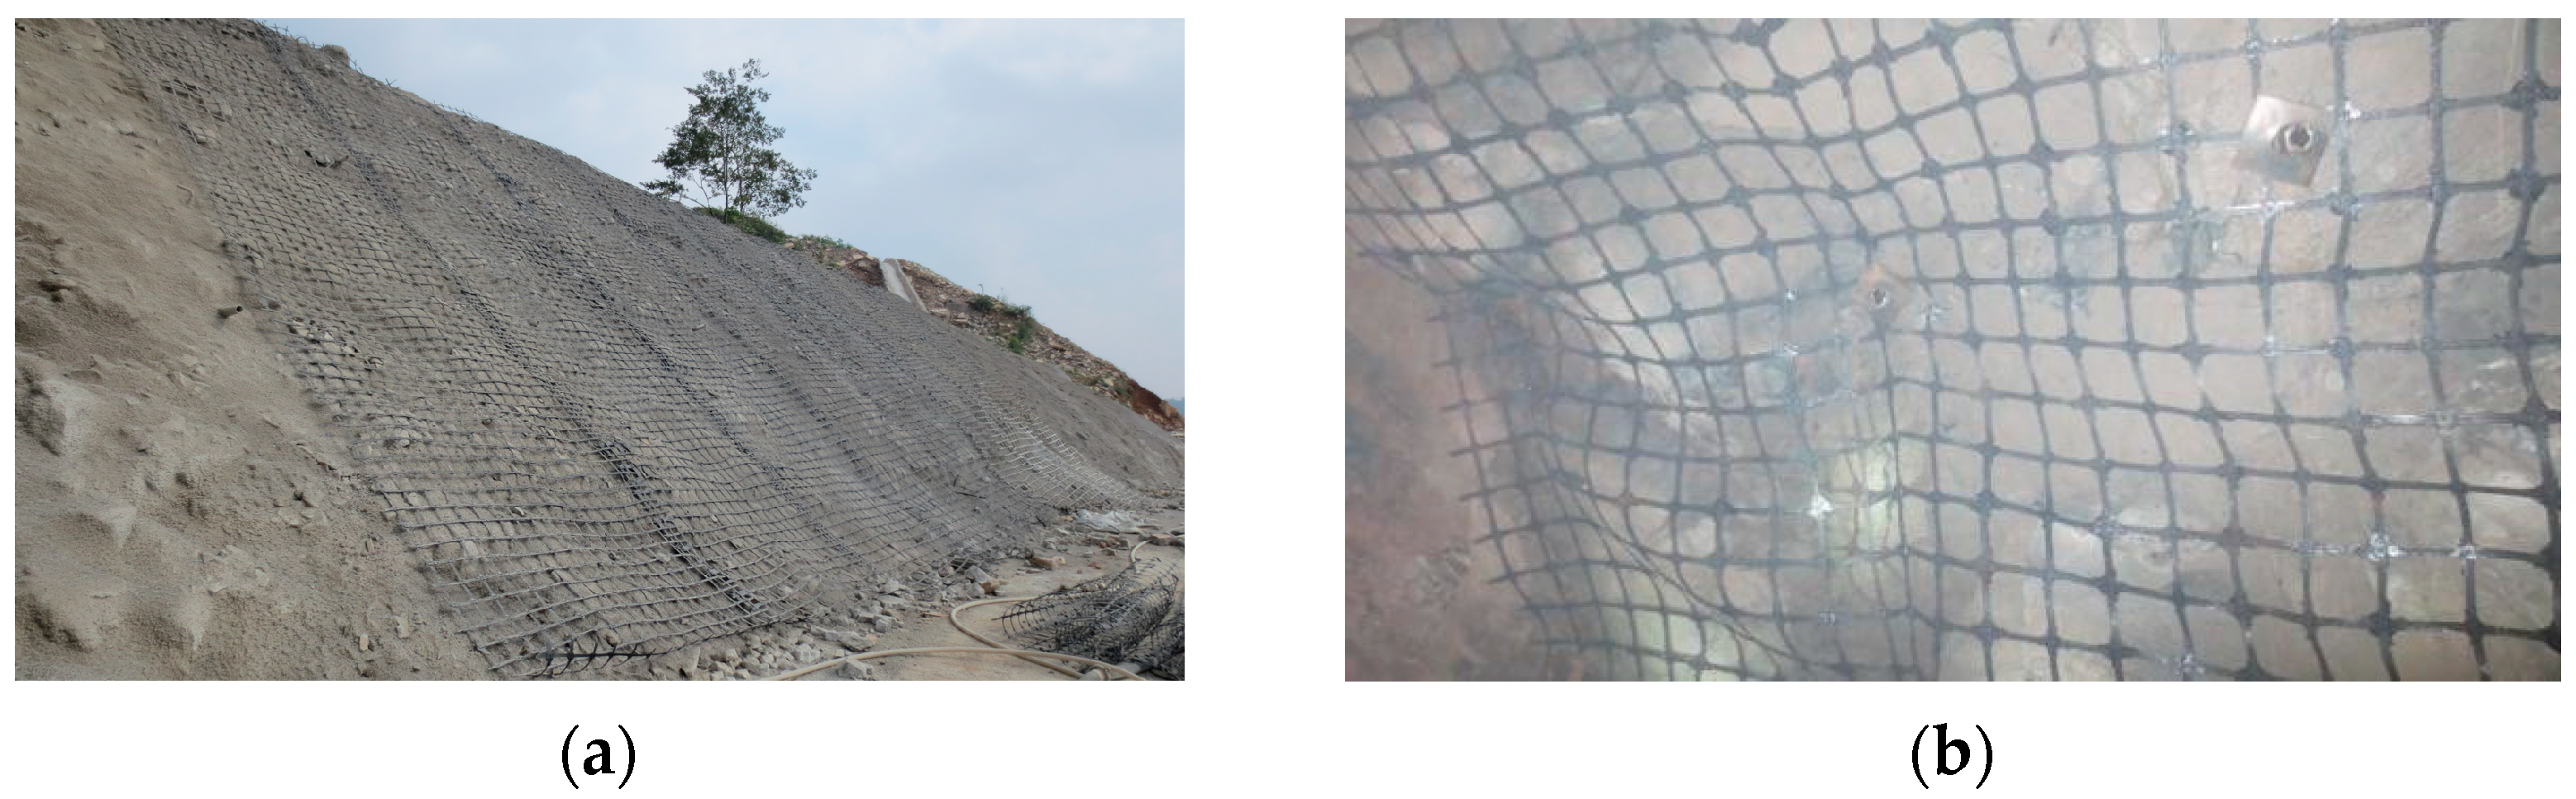
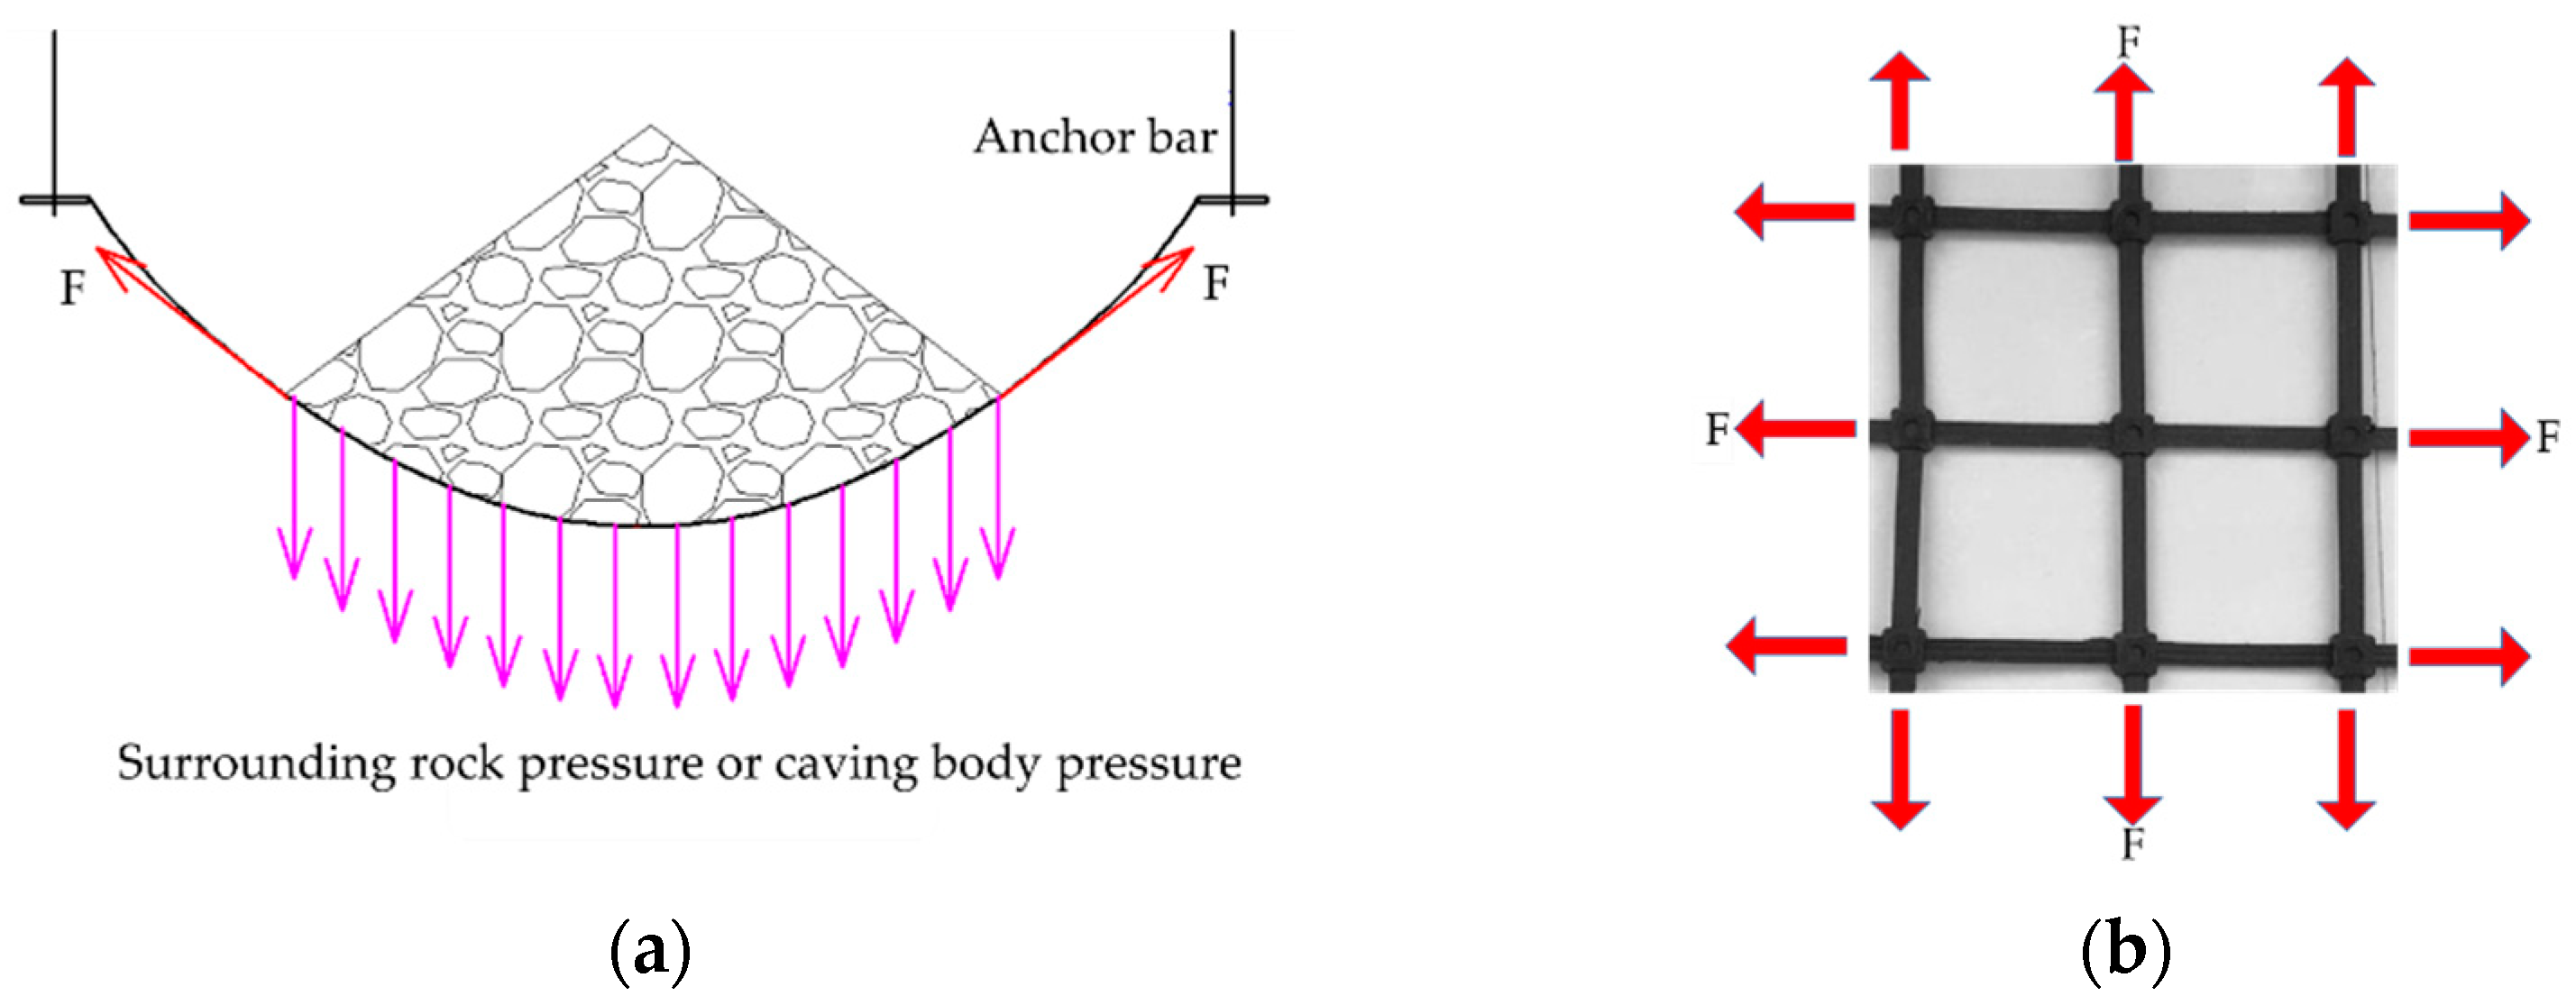
:1. Introduction
2. Materials and Methods
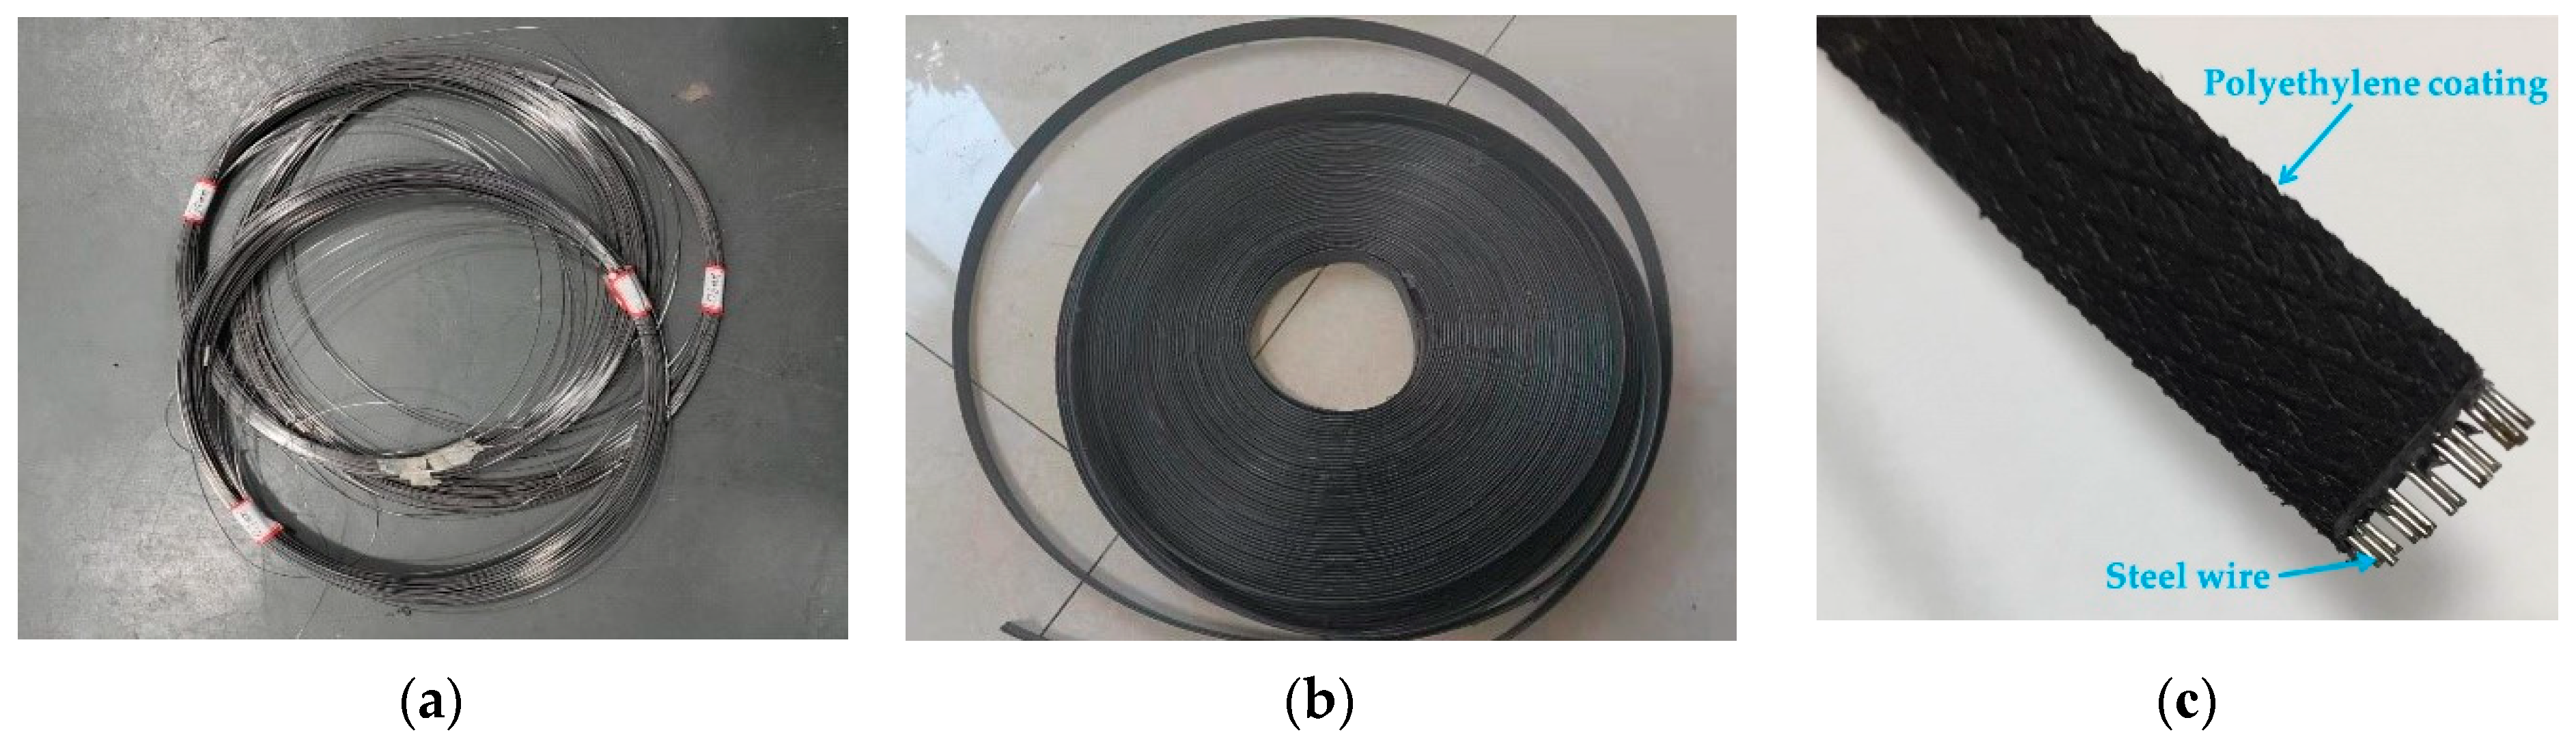
2.1. Testing Materials
2.2. Test Equipment and Scheme
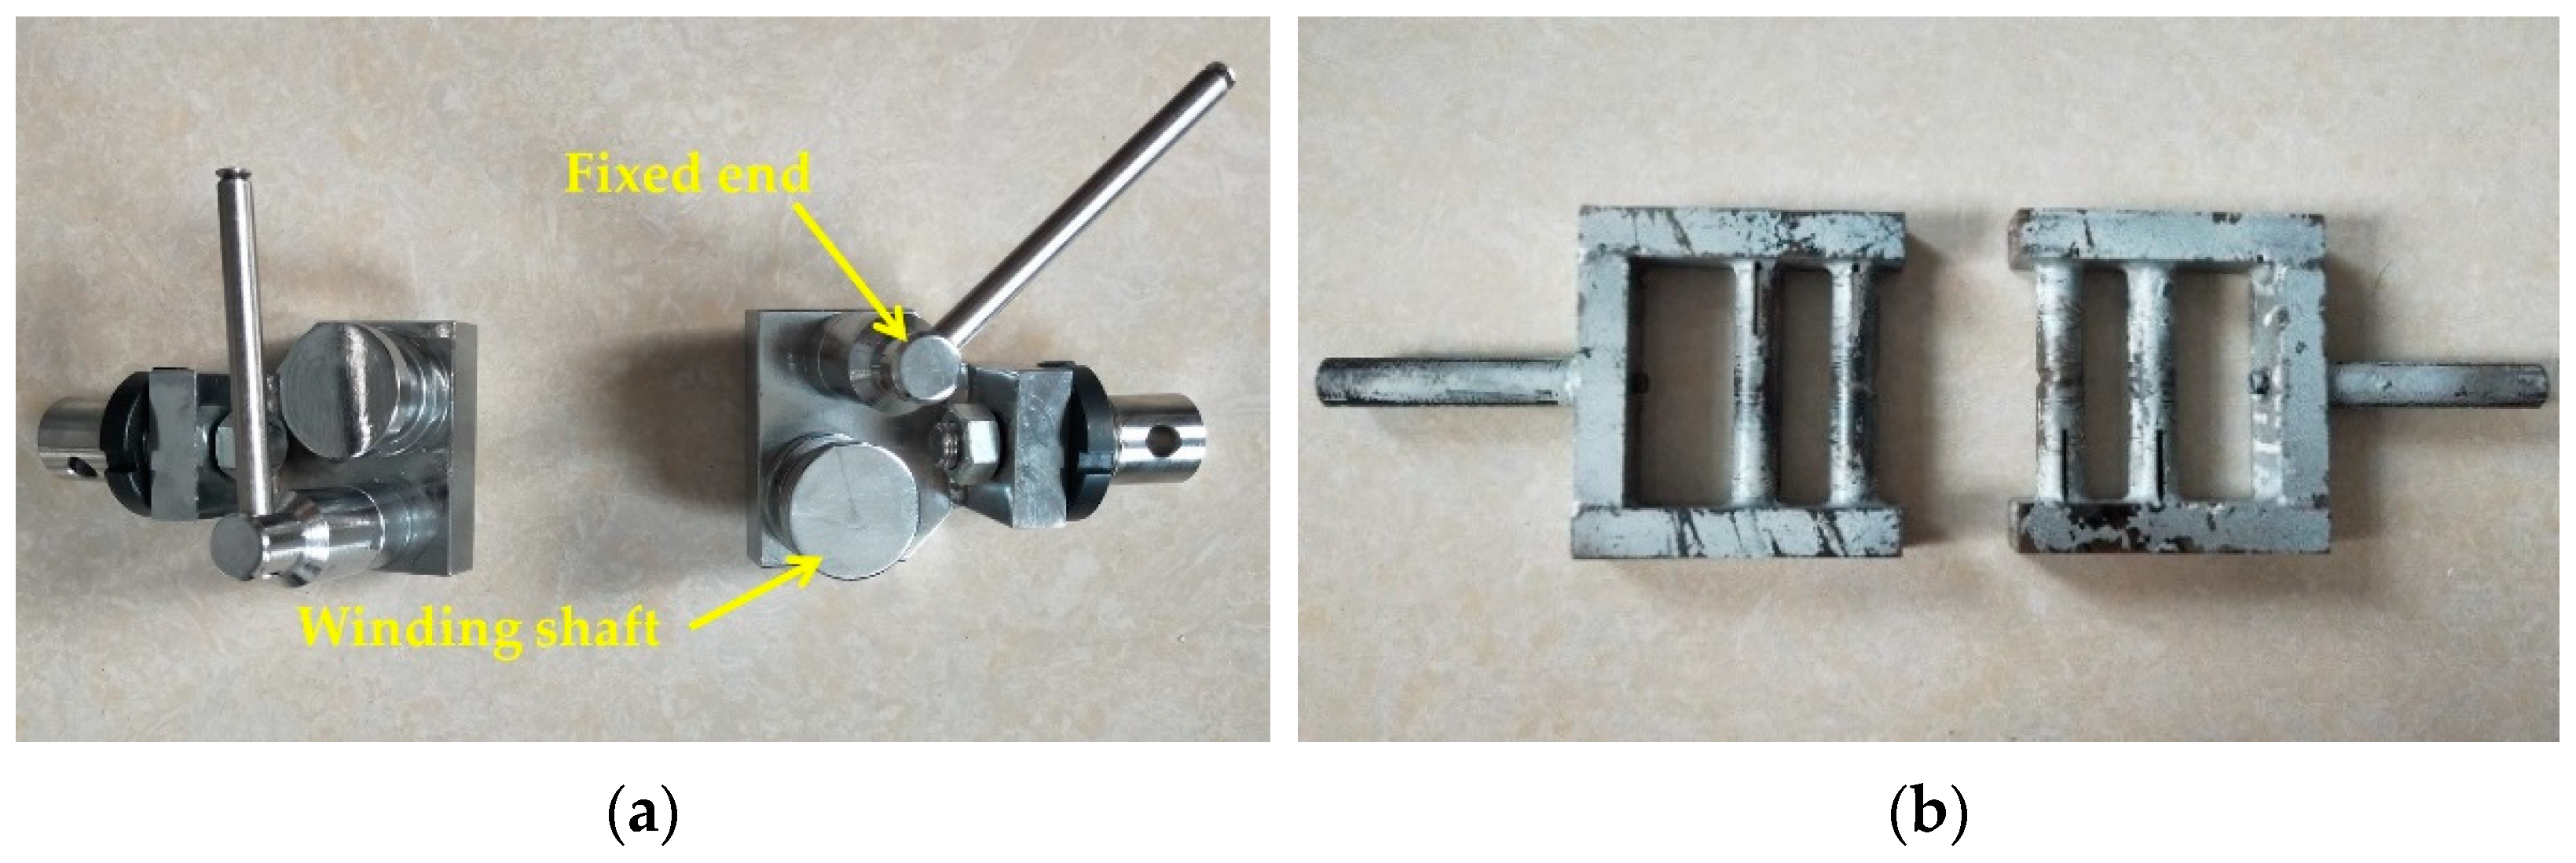
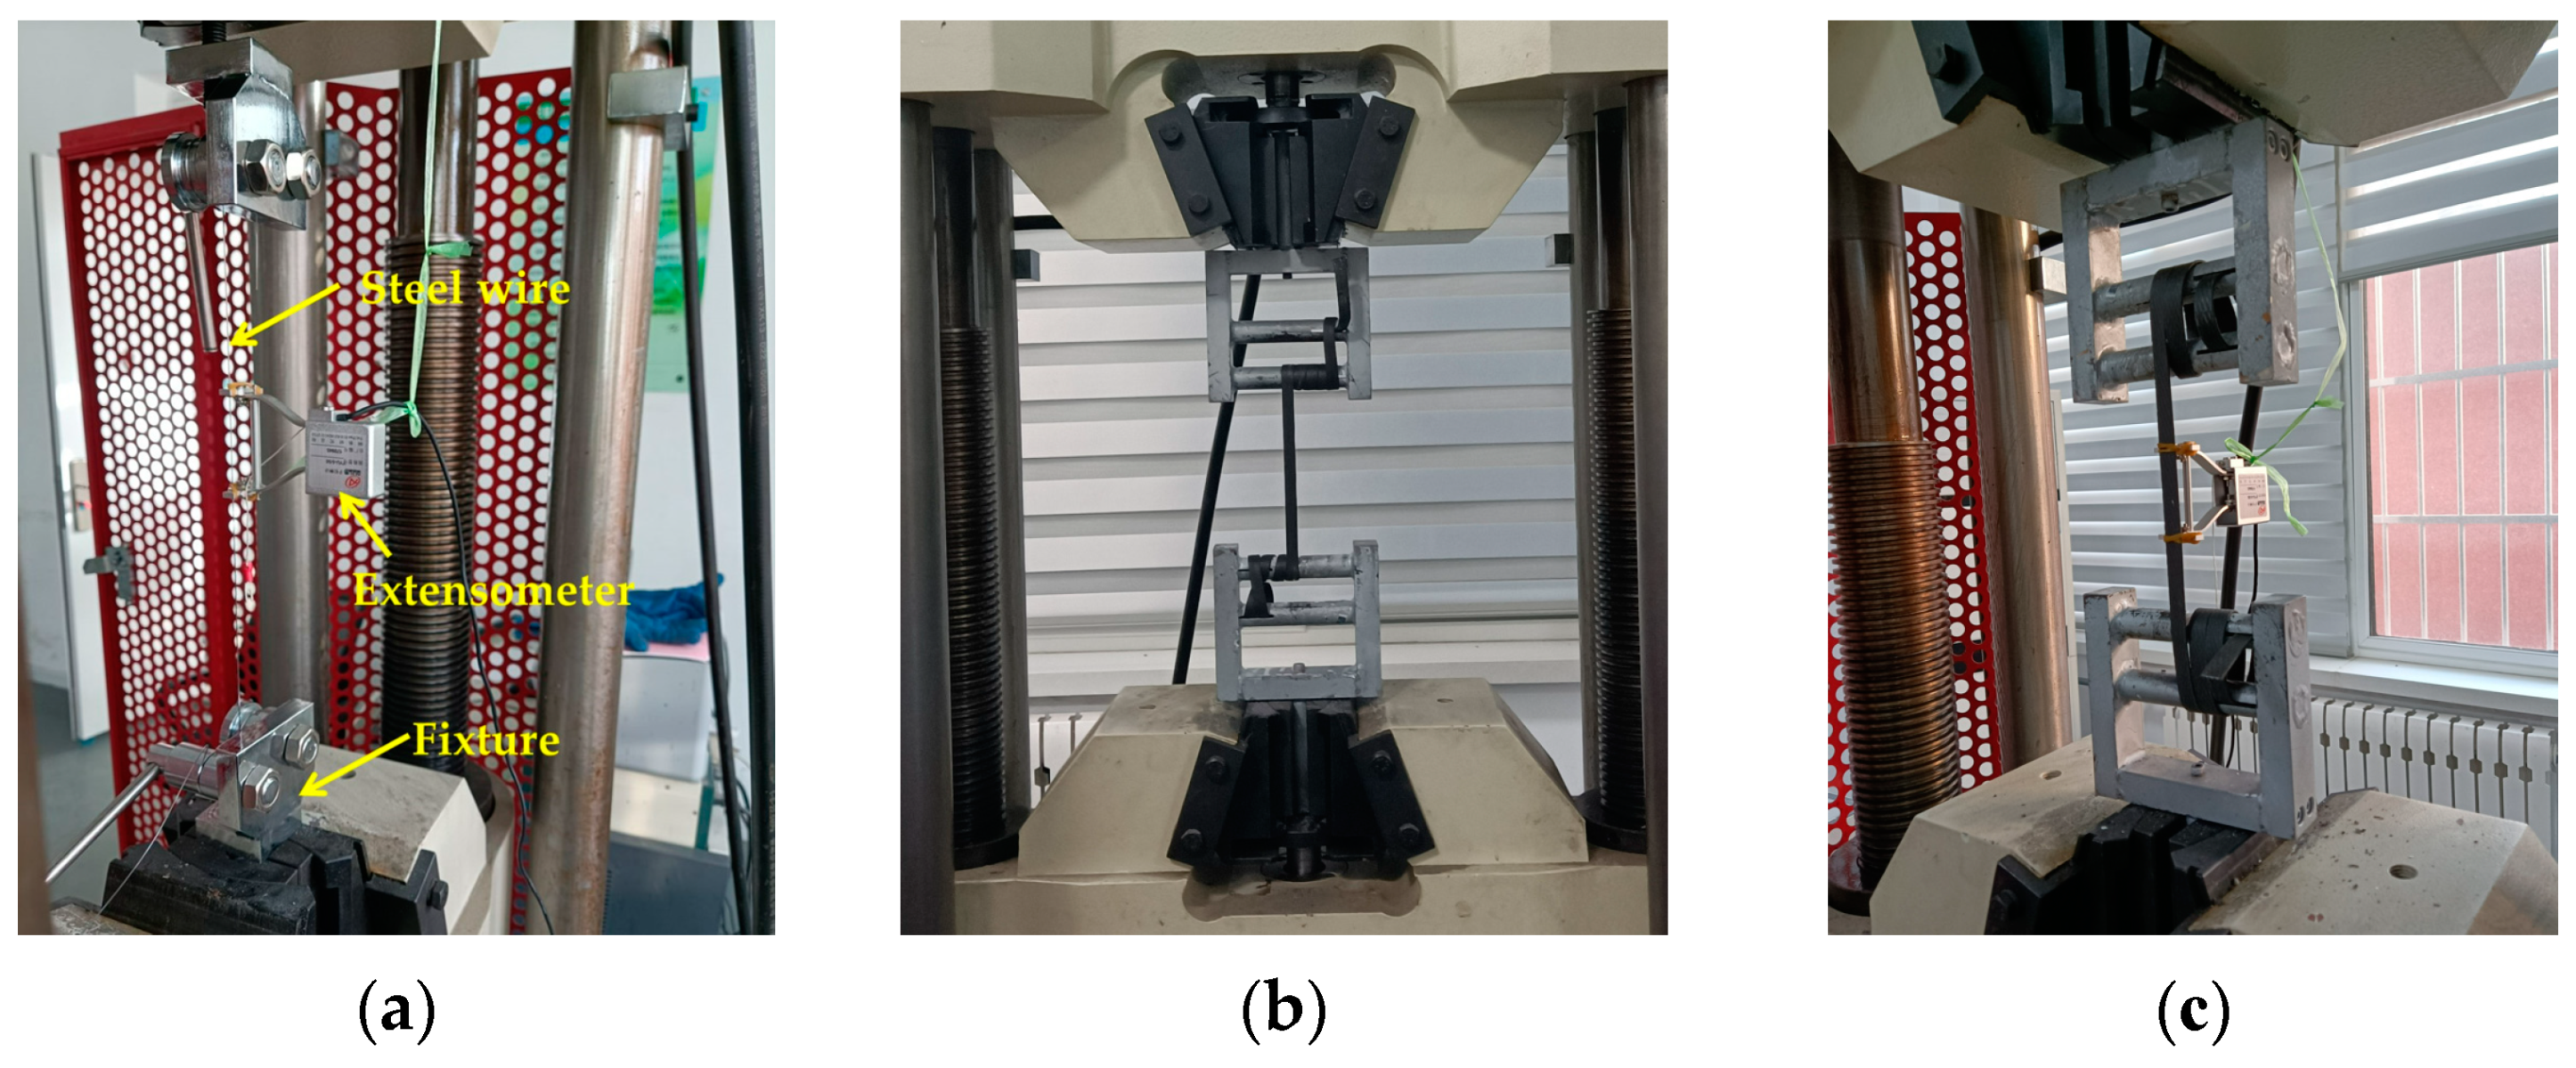
2.2.1. Test Equipment
2.2.2. Experimental Group Design
2.2.3. Test Method
- According to the standard requirements of “cold-drawn non-alloy steel wire for springs” [20], the stress, σS, of cold-drawn non-alloy steel wire for springs is approximately 2000–2400 MPa. Therefore, the pre-tension tension and force can be adjusted according to the diameter of the wire. The maximum force and pre-tension force of the steel wire are finally obtained through calculation, as shown in Table 2.
- The composition, production process, and shape characteristics of polyethylene products have a significant impact on the tensile strength. Therefore, it is essential to ensure the accuracy and rigor of the test, according to the specifications [21], before the formal tensile test of the polyethylene geogrid belt. Three groups of pre-experiments were conducted to obtain the estimated maximum force of the polyethylene geogrid belt, and the required pre-tension value was obtained, as shown in Table 3.
- The tensile force of the steel–plastic compound geogrids-reinforced belt is mainly borne by the steel wire inside the reinforced belt. Therefore, the maximum force estimation of the steel–plastic compound geogrids-reinforced belt is the resultant force of all steel wires in the reinforced belt. Subsequently, the pre-tension value of the steel–plastic compound geogrids-reinforced belt was calculated, as shown in Table 4.
3. Results
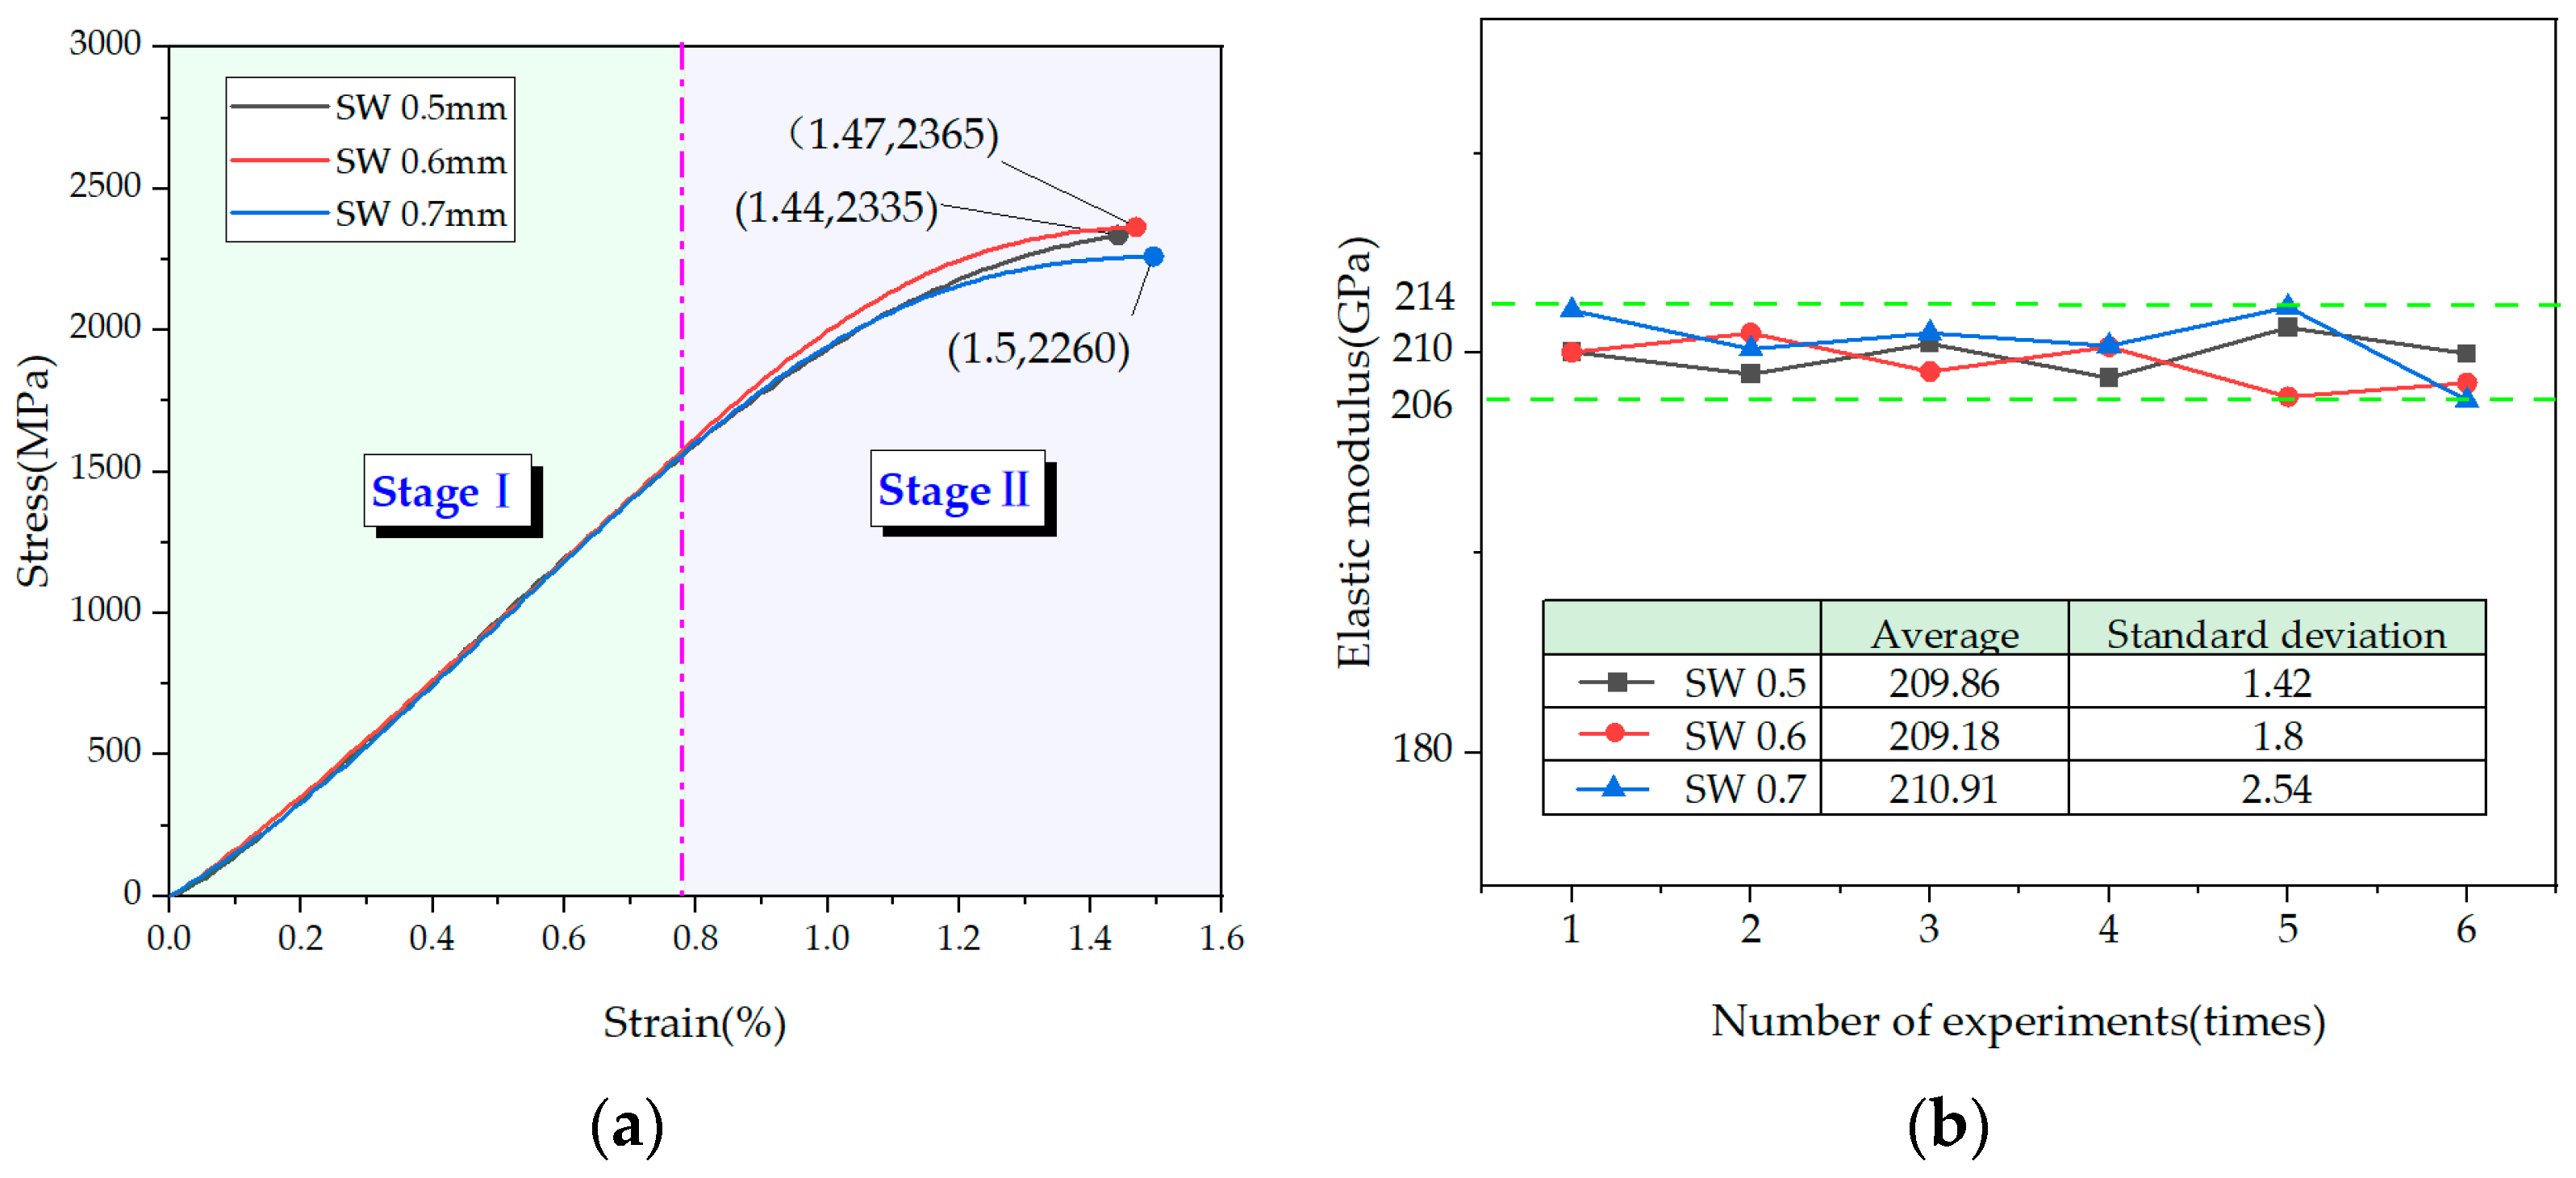
3.1. Tensile Test Results of Cold-Drawn Non-Alloy Steel Wire for Springs
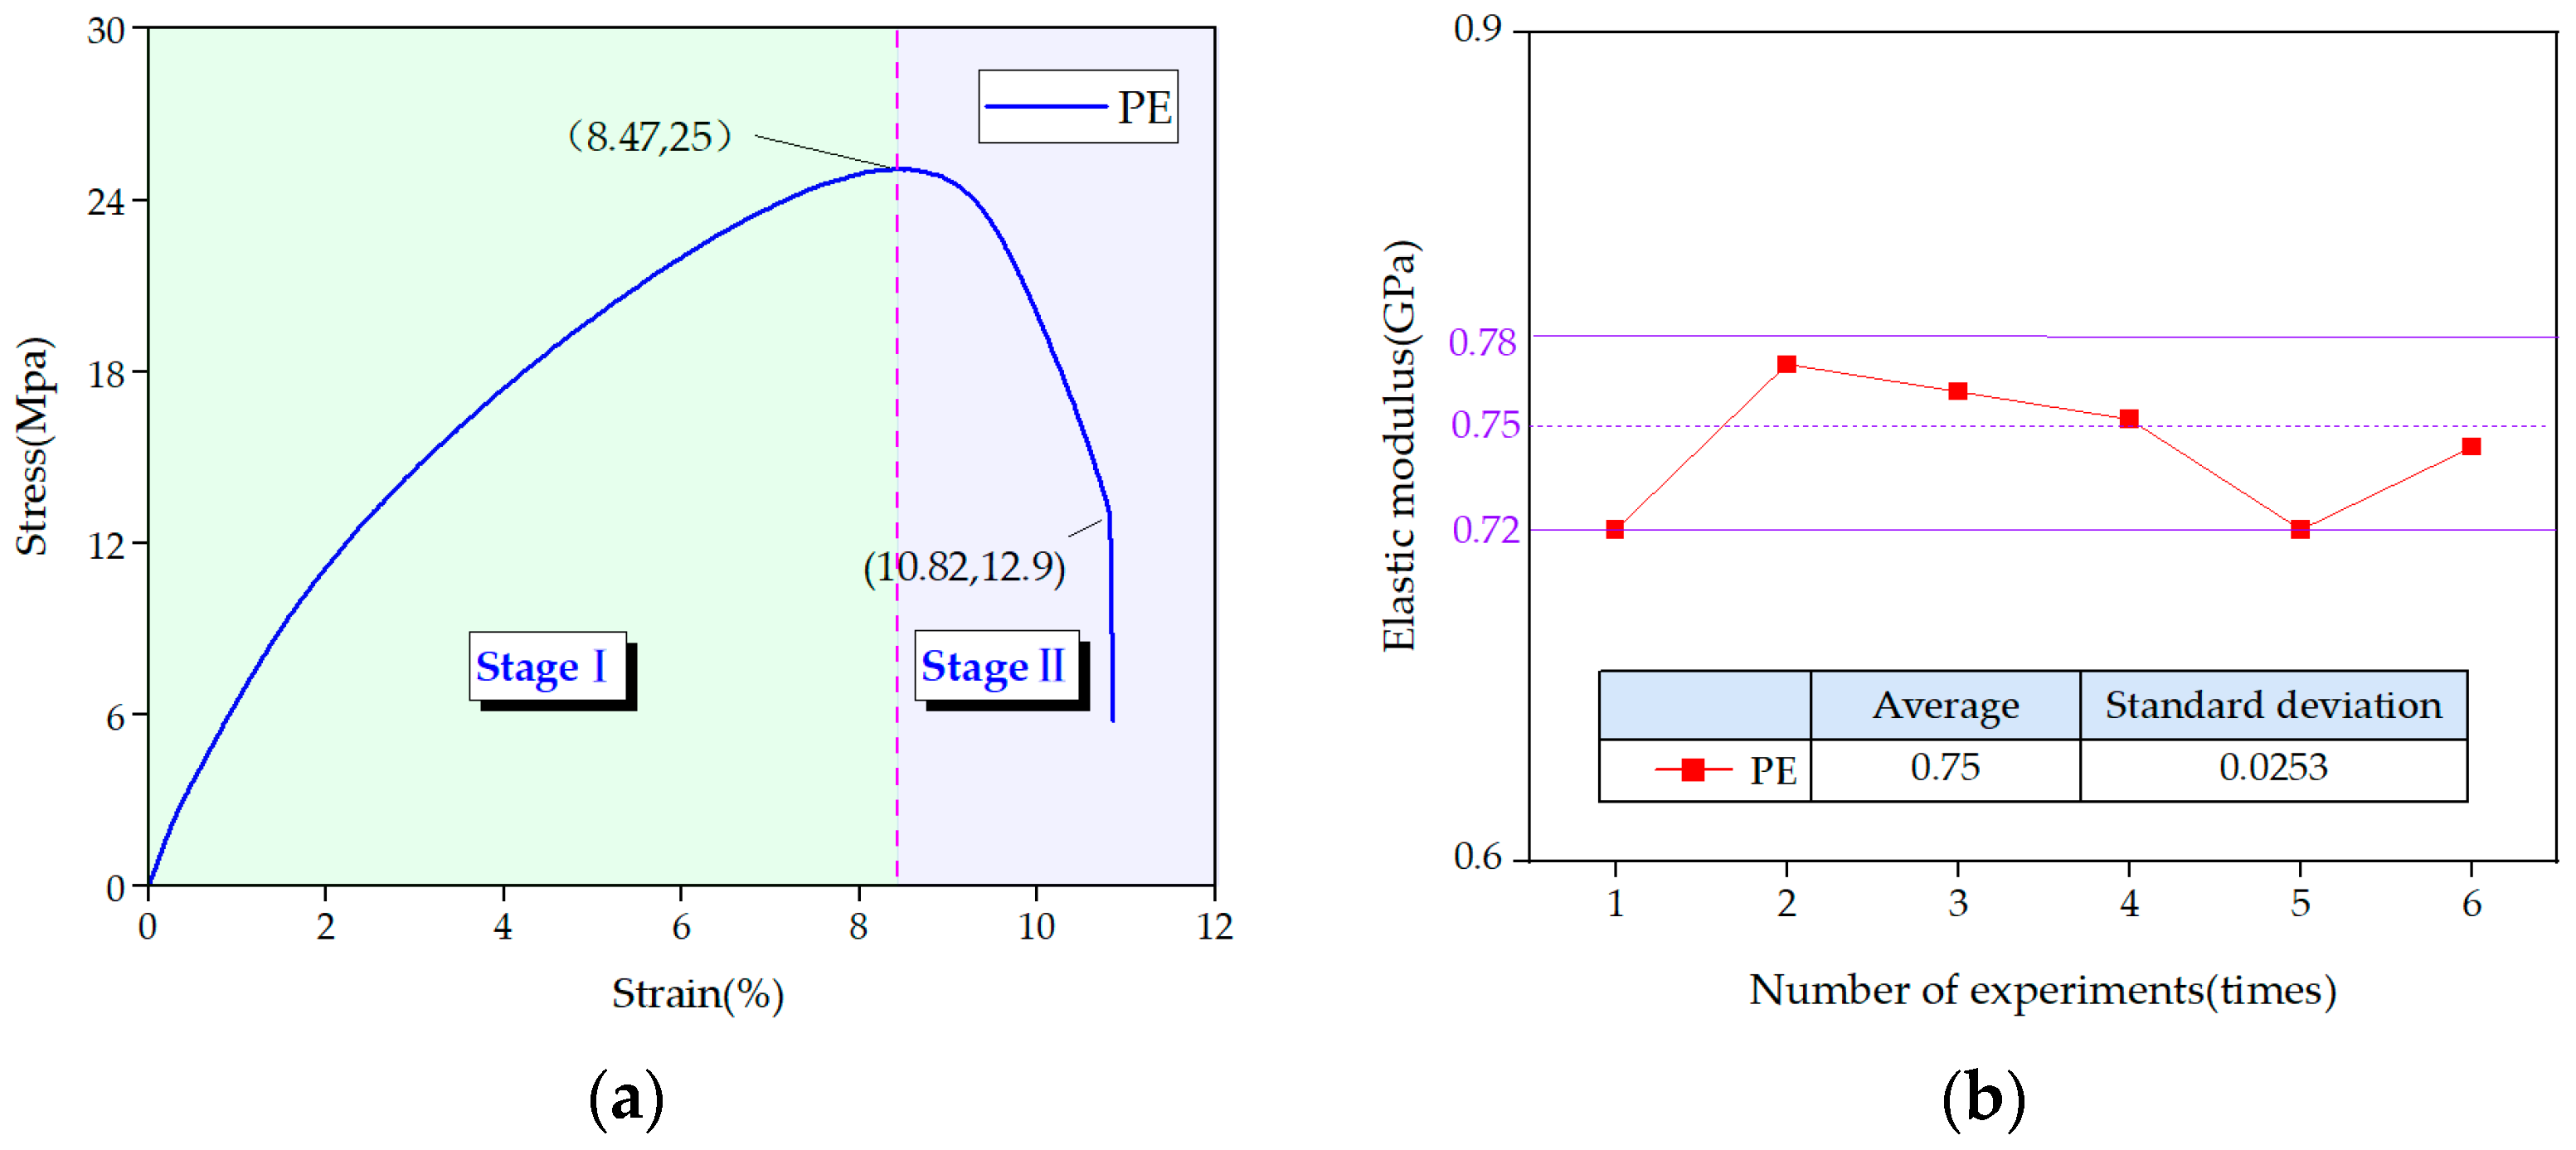
3.2. Tensile Test Results of Polyethylene Geogrid Belt
3.3. Tensile Test Results of Steel-Plastic Compound Geogrid-Reinforced Belt
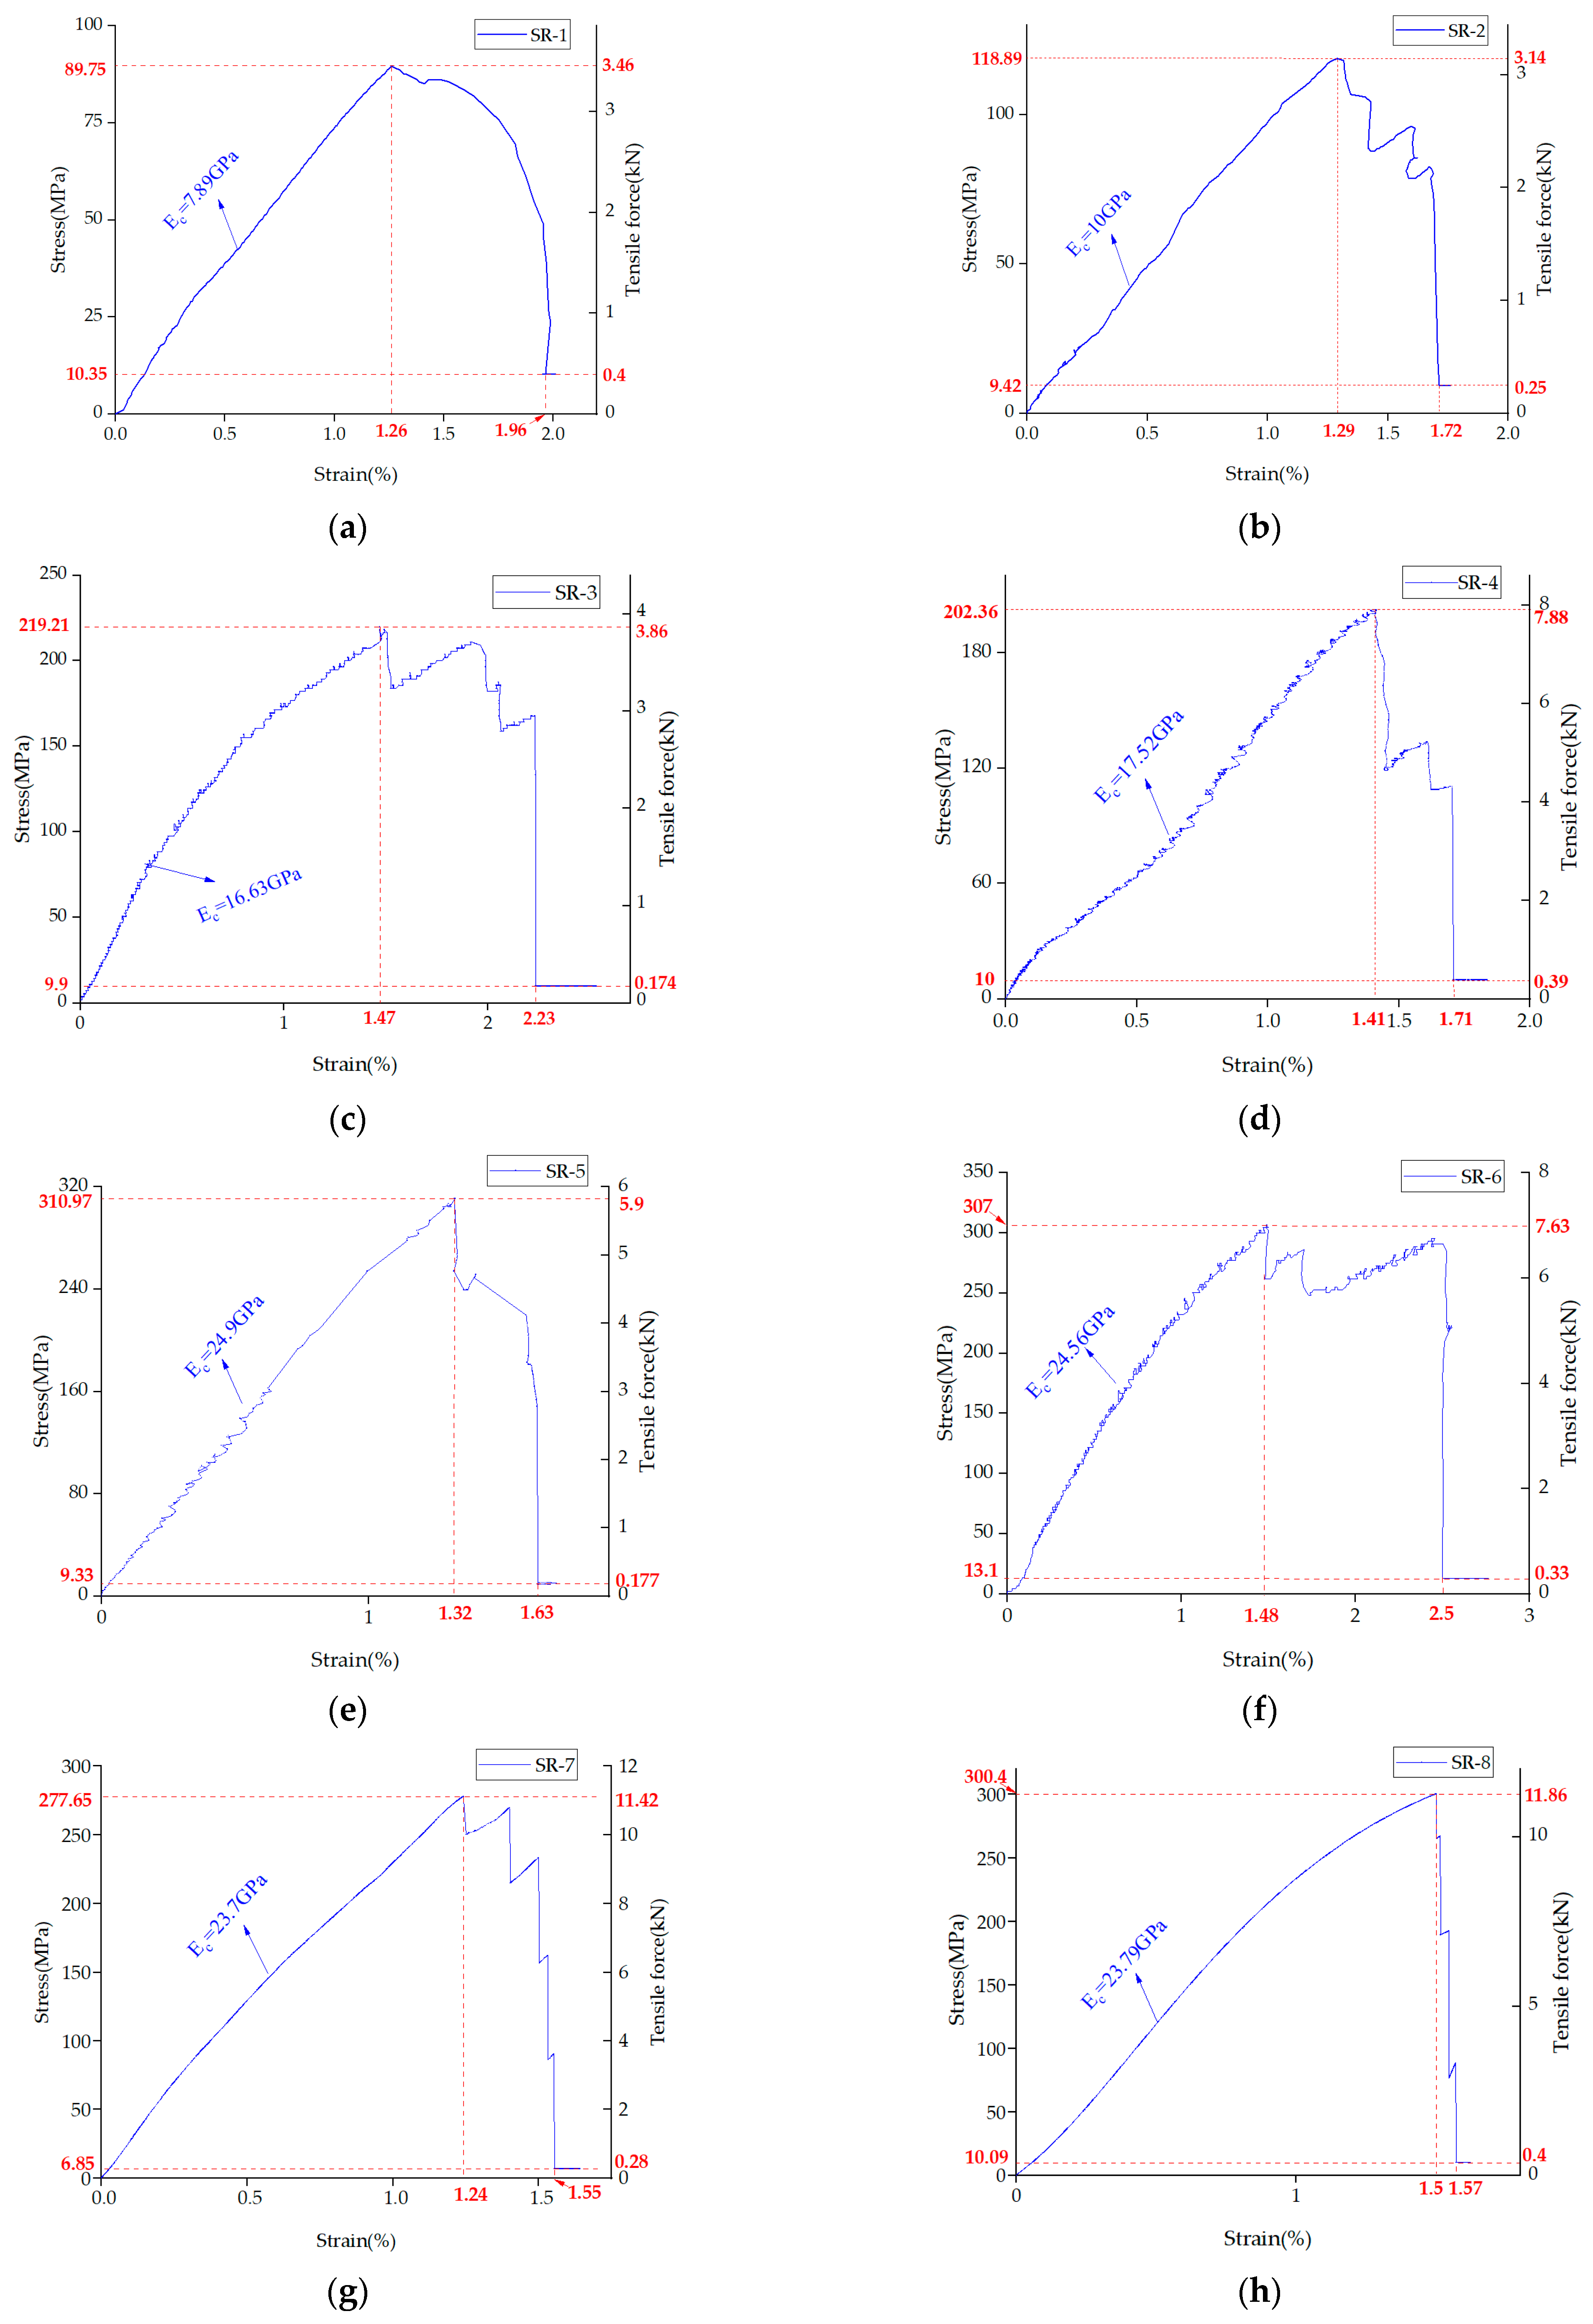
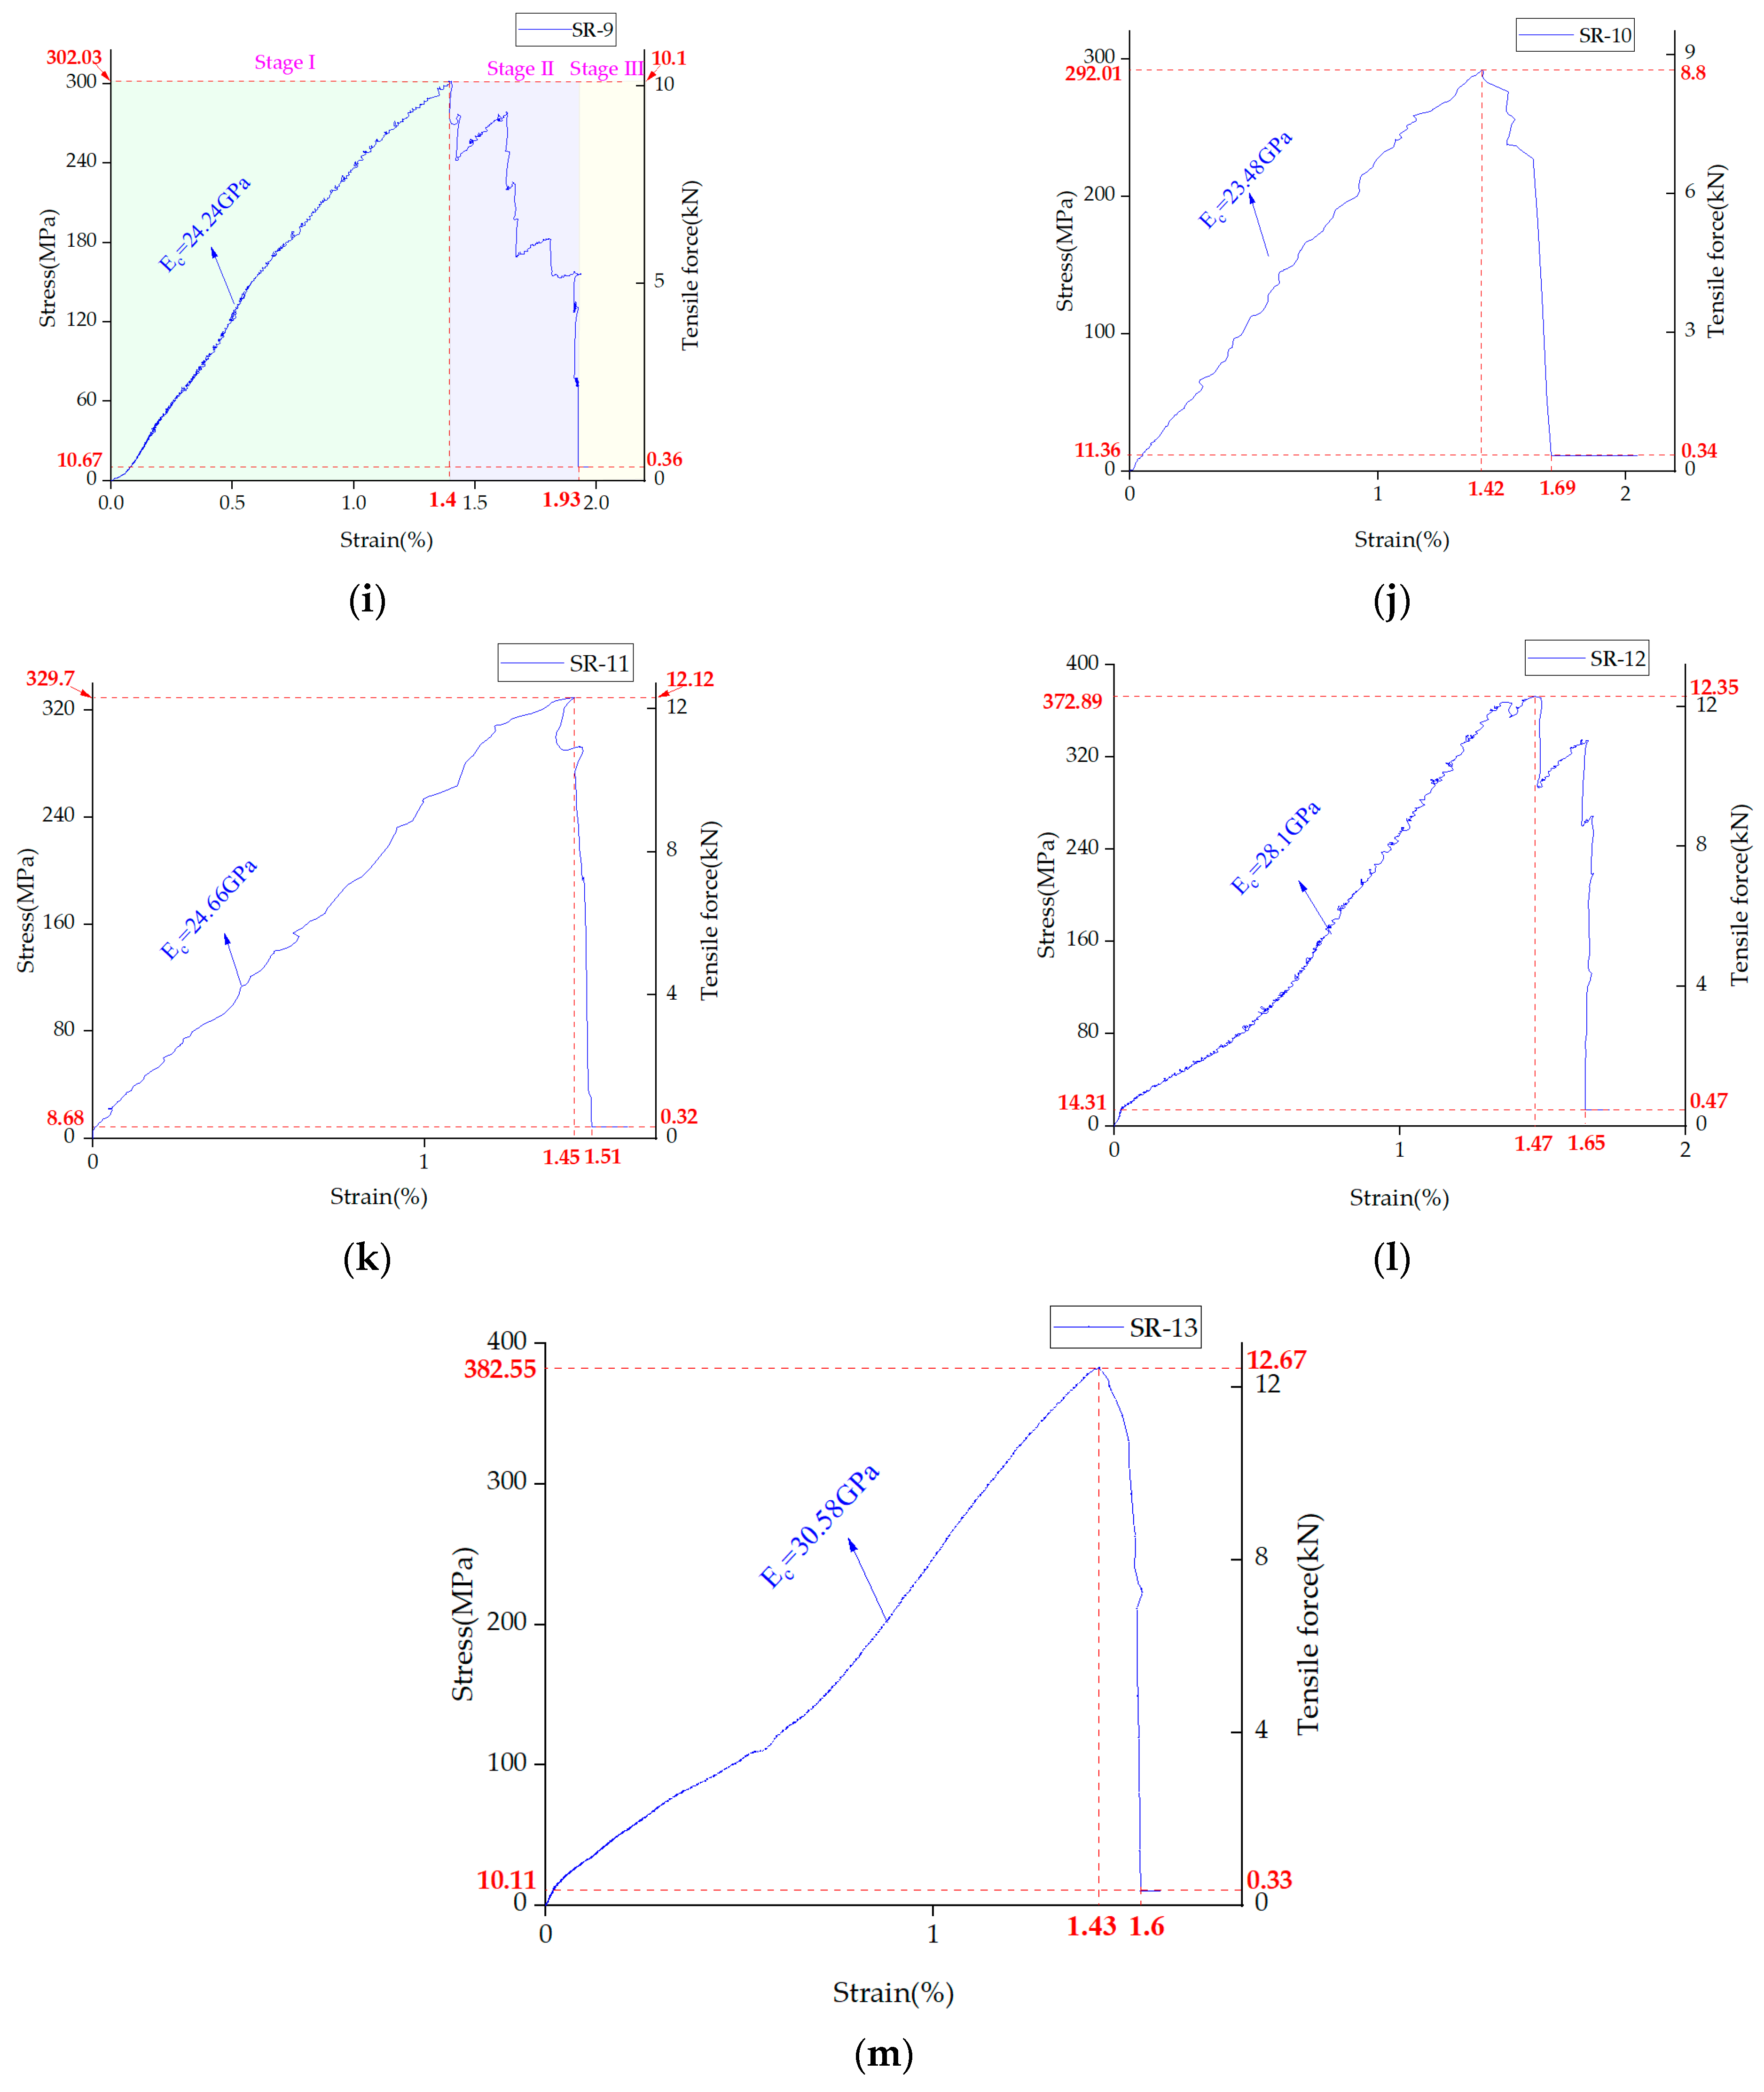
3.3.1. Relationship between Stress–Strain and Tension of the Steel–Plastic Compound Geogrid-Reinforced Belt
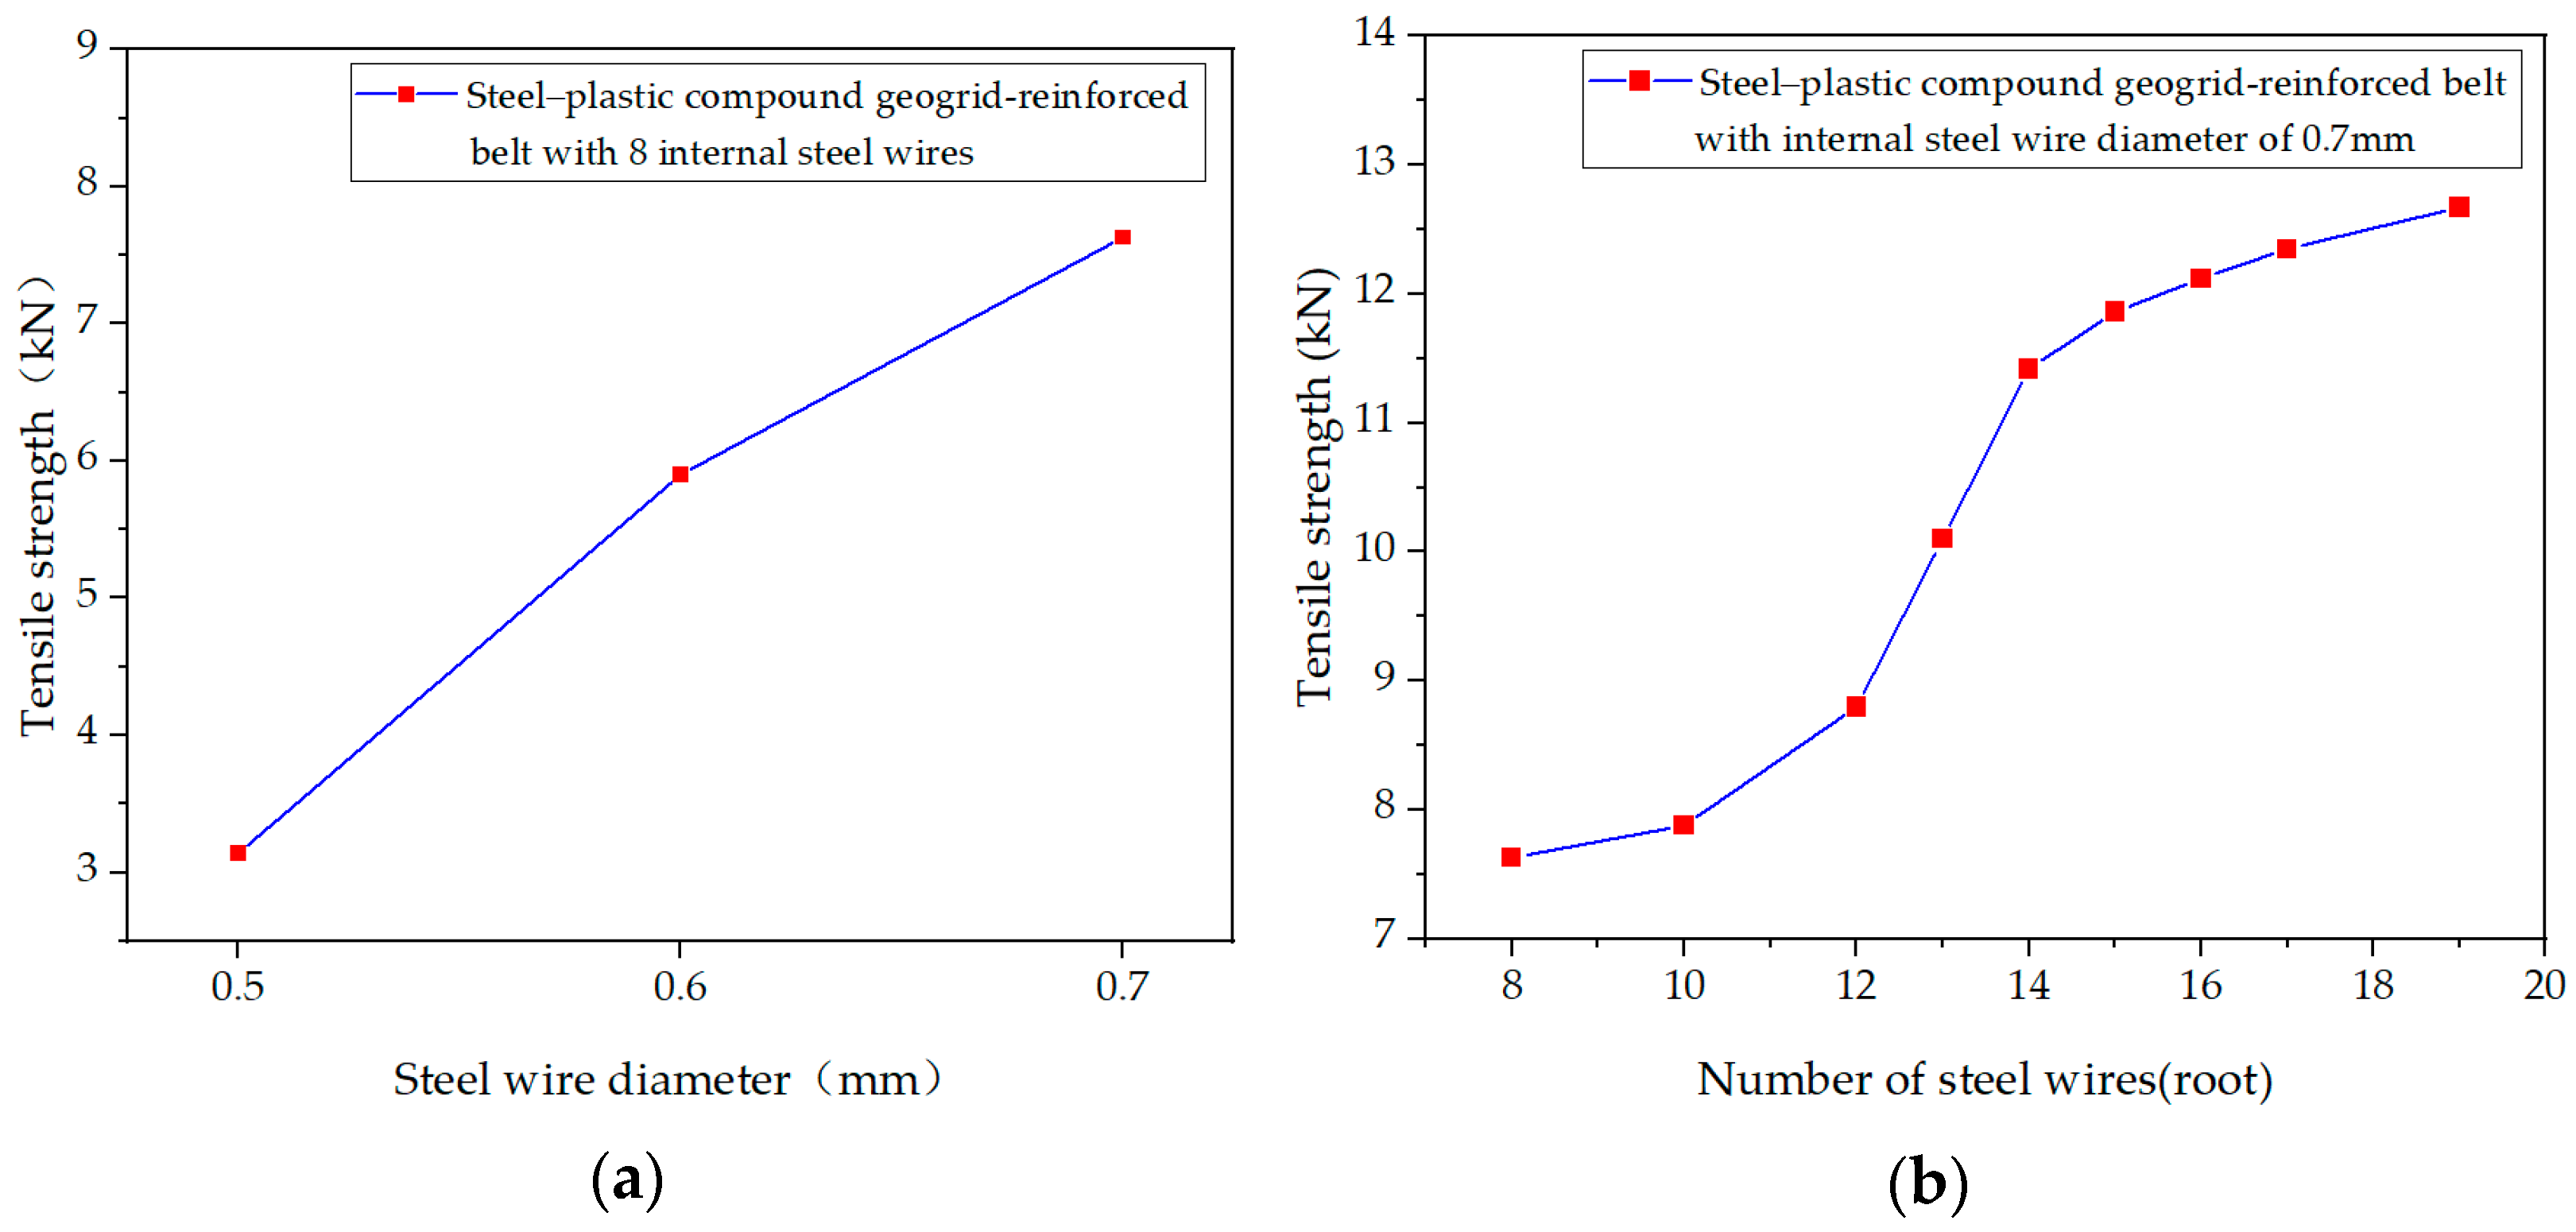
3.3.2. Influence of Steel Wire Specification and Root Number on the Tensile Strength of the Steel-Plastic Compound Geogrid-Reinforced Belt
- Effect of Steel Wire Diameter in the Steel-plastic Compound Geogrid-Reinforced Belt on its Tensile Strength
- 2.
- Effect of the Number of Steel Wire Roots in the Steel–Plastic Compound Geogrid-Reinforced Belt on its Tensile Strength
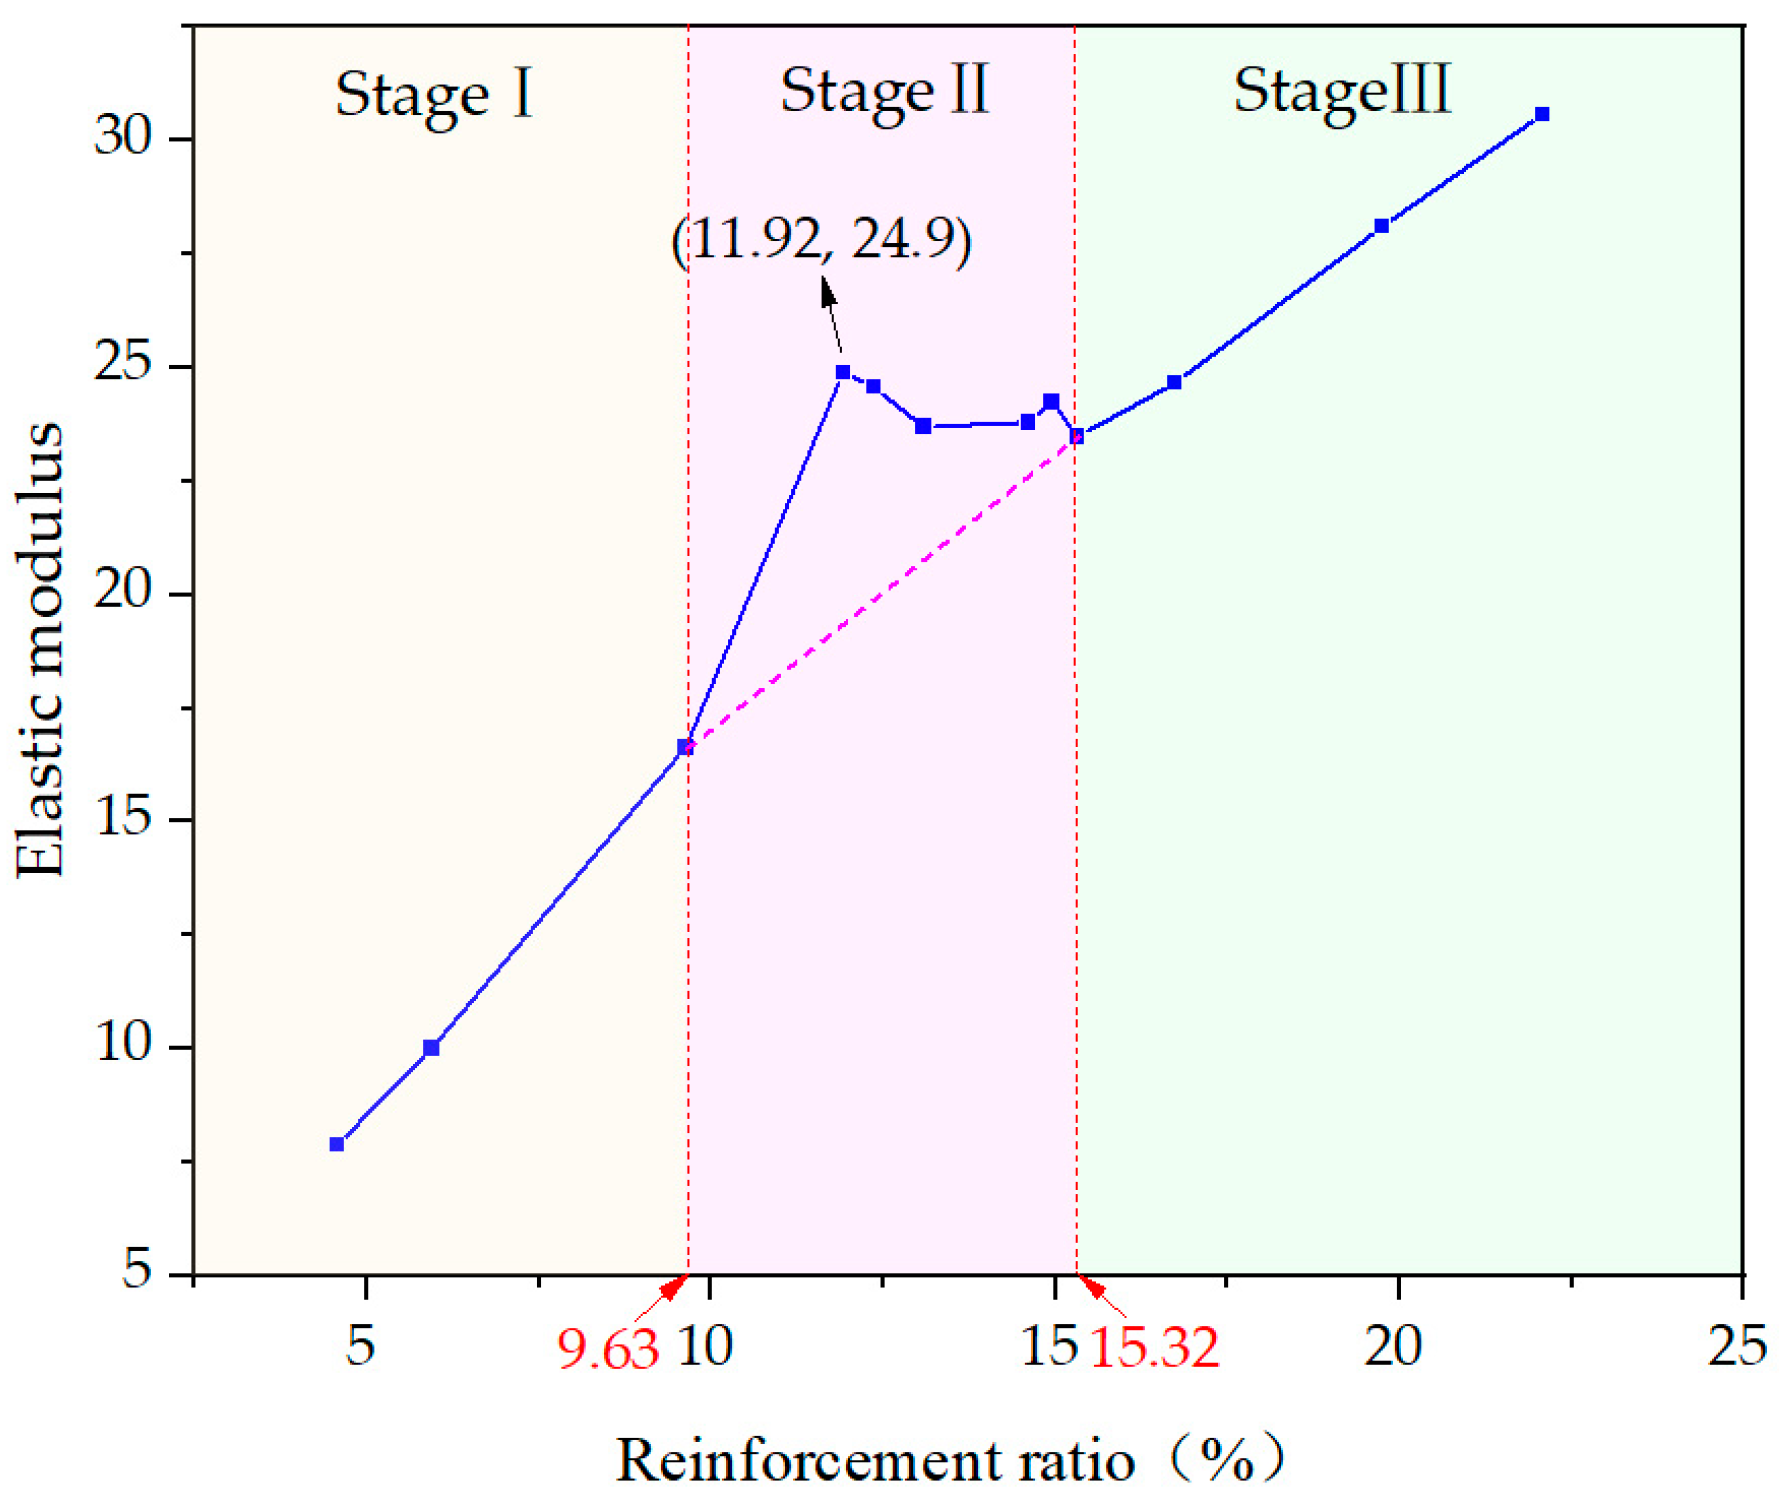
3.3.3. Elastic Modulus Analysis of Steel–Plastic Grille
4. Minimum and Optimal Reinforcement Ratios of Steel Wire in Steel–Plastic Compound Geogrid-Reinforced Belt
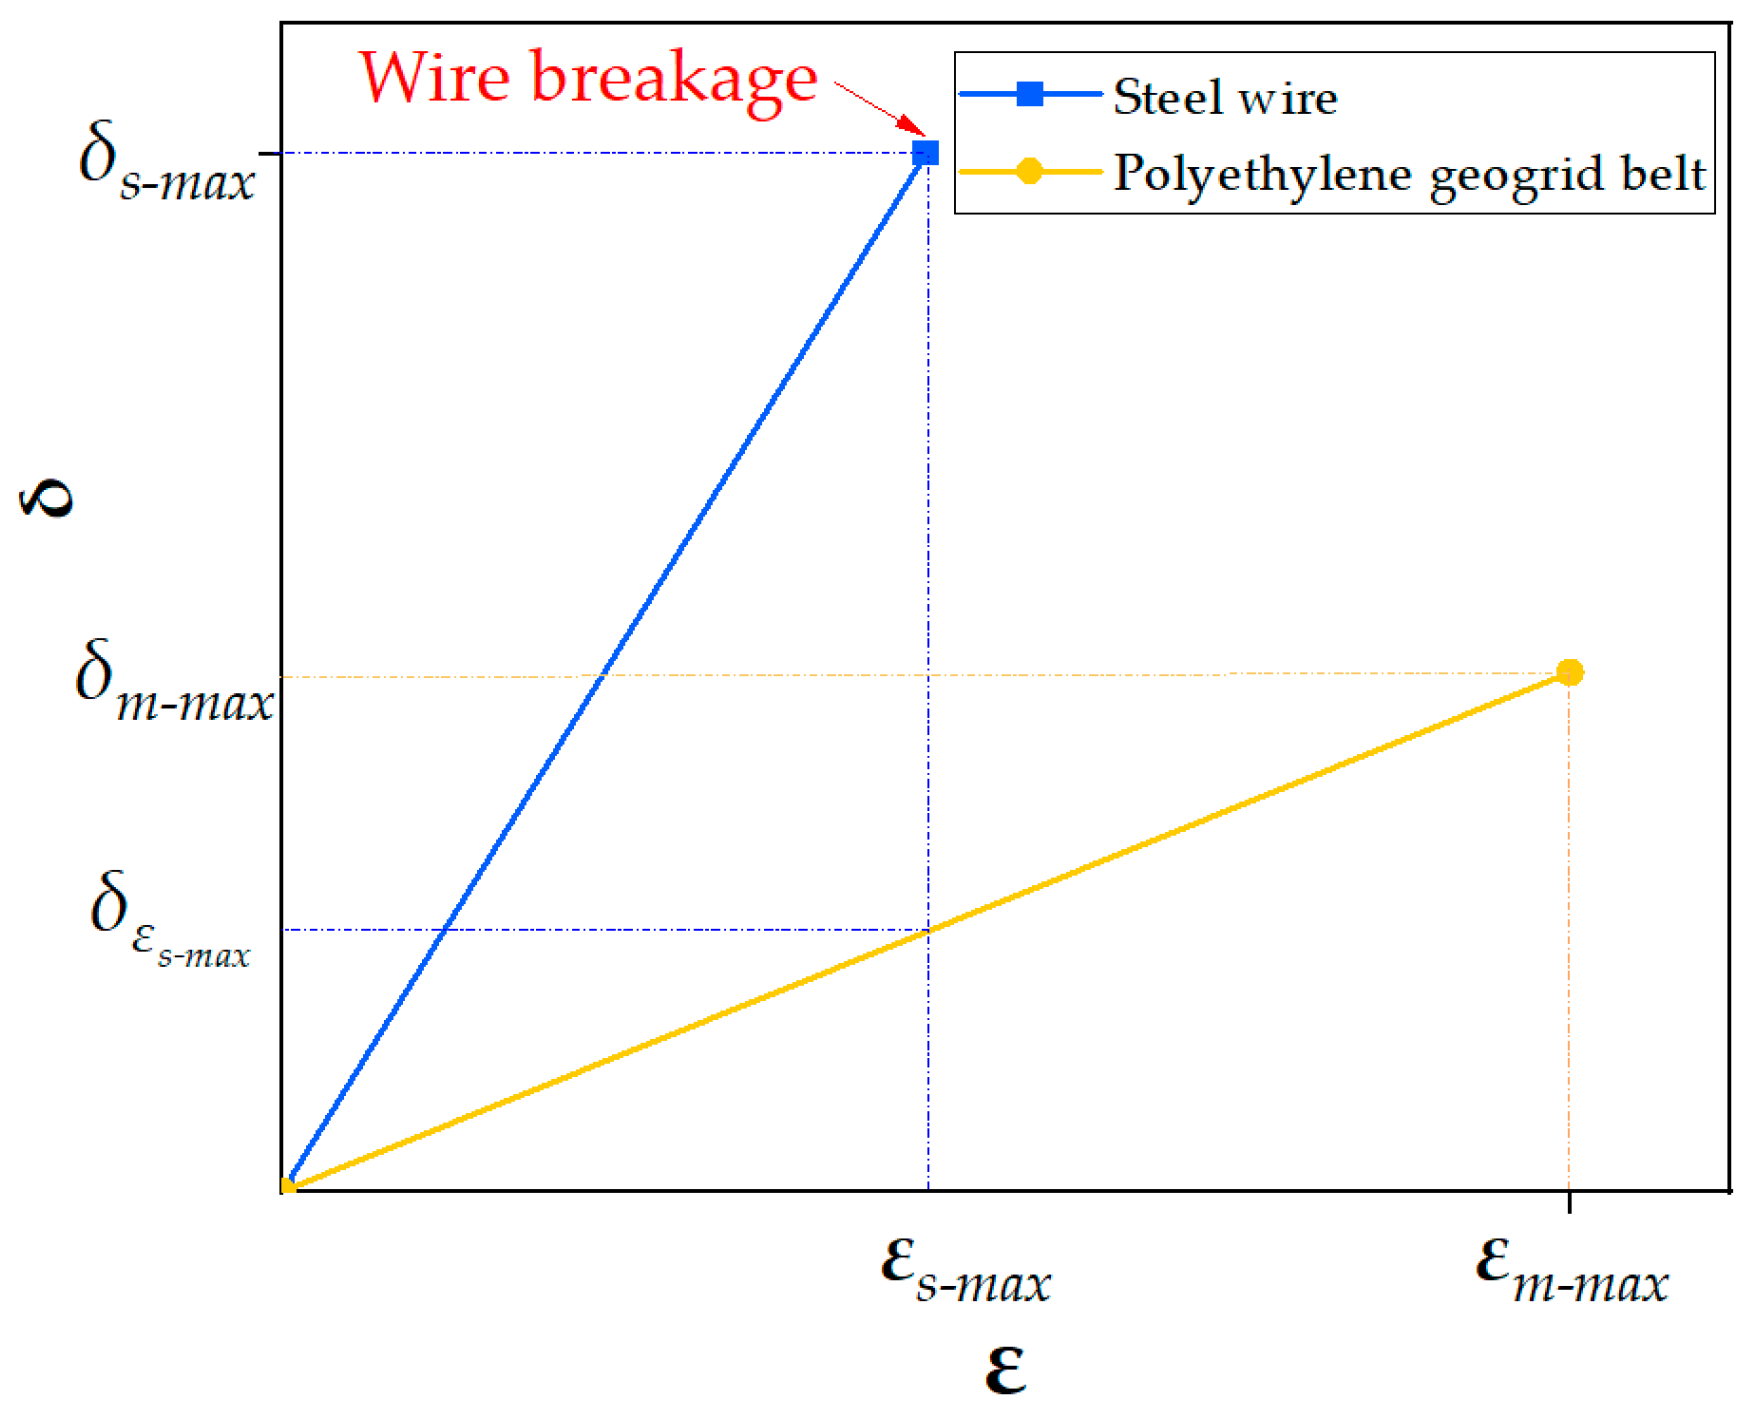
4.1. Minimum Reinforcement Ratio of Steel Wire for Steel-Plastic Compound Geogrid-Reinforced Belt
4.2. Optimal Reinforcement Ratio of Steel Wire for Steel–Plastic Compound Geogrid-Reinforced Belt
5. Conclusions
- The tensile stress–strain curve of the steel wire was divided into an elastic deformation stage and a strengthening stage. According to the tensile test data of the steel wire, the elastic modulus, maximum stress, and maximum strain of steel wires with different diameters were roughly the same. The elastic modulus of the steel wire was 210 GPa; the maximum stress and maximum strain were between 2200 and 2400 MPa, and between 1.4% and 1.5%, respectively. The tensile stress–strain curve of the polyethylene geogrid belt can be divided into the strengthening and local deformation stages. According to the tensile test data of the polyethylene geogrid belt, the elastic modulus of the polyethylene geogrid belt was 0.75 GPa; maximum stress was 25 MPa, and the maximum strain was 10.82%.
- The tensile stress–strain curve of the steel–plastic compound geogrid-reinforced belt is divided into a composite adjustment stage, steel wire breaking stage, and residual deformation stage. In the composite adjustment stage, the steel wire plays a dominant role in the force of the belt. In the fracture stage of the steel wire, the fracture form of the steel wire is progressive. The first fracture strain of steel wire in this belt generally occurs between 1.2% and 1.5%, and the final fracture strain generally occurs between 1.5% and 2.5%. In the residual deformation stage, the mechanical properties of steel–plastic compound geogrid-reinforced belts are completely attributed to the polyethylene materials. The tensile strength of this belt is proportional to the diameter and number of steel wires in the reinforced belt.
- The minimum reinforcement ratio of steel wire in a steel–plastic compound geogrid-reinforced belt is 0.63%, as determined by mathematical derivation and calculation. According to the tensile test results, the optimal reinforcement ratio of steel wire in this belt is 11.92%. The results of this study pave the way for optimizing the material properties of steel–plastic compound geogrid as well as its engineering reinforcement performance and provide a reliable scientific basis for further research.
6. Discussion
Author Contributions
Funding
Institutional Review Board Statement
Informed Consent Statement
Data Availability Statement
Conflicts of Interest
References
- Liu, Q.; Guo, J.K.; Liu, L.; Huang, K.P.; Tian, W.; Li, X.Z. Optimization Analysis of Smart Steel-Plastic Geogrid Support for Tunnel. Adv. Civ. Eng. 2020, 2020, 6661807. [Google Scholar] [CrossRef]
- Wang, Q.B.; Wen, X.K.; Jiang, J.Q.; Zhang, C.; Shi, Z.Y. Experimental Study on Performance of Multidirectional Geogrid and Its Application in Engineering of High Slope. J. Wuhan Univ. Technol. Mater. Sci. Edit. 2014, 29, 704–711. [Google Scholar] [CrossRef]
- Zhang, R.; Long, M.-X.; Lan, T.; Zheng, J.-L.; Geoff, C. Stability Analysis Method of Geogrid Reinforced Expansive Soil Slopes and Its Engineering Application. J. Cent. South Univ. 2020, 27, 1965–1980. [Google Scholar] [CrossRef]
- Sun, Y.J.; Xu, H.Z.; Gu, P.; Hu, W.J. Application of FBG Sensing Technology in Stability Analysis of Geogrid-Reinforced Slope. Sensors 2017, 17, 579. [Google Scholar] [CrossRef] [PubMed] [Green Version]
- Zhu, Q.K. Mechanism of Steel-Plastic Geogrid in Bolt-Mesh-Shotcreting Support Structure and Its Application in High Slope Engineering Structure and Its Application in High Slope Engineering. Master’s Thesis, Shandong University of Science and Technology, Qingdao, China, 2019. [Google Scholar] [CrossRef]
- Hussein, M.G.; Meguid, M.A. A Three-Dimensional Finite Element Approach for Modeling Biaxial Geogrid with Application to Geogrid-Reinforced Soils. Geotext. Geomembr. 2016, 44, 295–307. [Google Scholar] [CrossRef]
- Gao, X.-C.; Wang, Q.; Fan, K.; Xiao, Q.-C.; Hu, B.; Wang, C.-H.; Li, L. Study and Application of an Advanced Support System for Thin and Medium-thick Coal Seams with Composite Roof. J. Min. Strat. Control Eng. 2021, 3, 59–66. [Google Scholar] [CrossRef]
- Li, J.-K.; Wang, H. Ground Support of Interbedded Rock Roof in a Deep Roadway with Fully-anchored Cables. J. Min. Strat. Control Eng. 2020, 2, 14–22. [Google Scholar] [CrossRef]
- Wang, Q.-B.; Xu, L.; Zhang, J.-X.; Lv, R.-S.; Wang, T.-T.; Hu, Z.-J.; Bai, Y.; Kong, Y.-C.; Xie, F.; Tang, L.-Y. Mechanical Testing and Application of Steel-Plastic Geogrid Instead Of Metal Mesh in Supporting Engineering. J. Test. Eval. 2017, 45, 61–75. [Google Scholar] [CrossRef]
- Peng, F.-L.; Li, F.-L.; Tan, Y.; Kongkitkul, W. Effects of Loading Rate on Viscoplastic Properties of Polymer Geosynthetics and Its Constitutive Modeling. Polym. Eng. Sci. 2010, 50, 550–560. [Google Scholar] [CrossRef]
- Fan, P.F. Study on Tensile Property of the Steel-Plastic Geogrid. J. Balk. Tribol. Assoc. 2016, 22, 28–31. [Google Scholar]
- Cardile, G.; Moraci, N.; Pisano, M. Tensile Behaviour of an HDPE Geogrid Under Cyclic Loading: Experimental Results and Empirical Modelling. Geosynth. Int. 2017, 24, 95–112. [Google Scholar] [CrossRef]
- Cho, S.; Lee, K.; Oh, S. Wide-Width Tensile Strength Properties of Geogrids According to Specimen Length and Testing Speed. J. Korean Geosynth. Soc. 2007, 6, 21–26. [Google Scholar]
- Dong, Y.-L.; Han, J.; Bai, X.-H. Numerical Analysis of Tensile Behavior of Geogrids with Rectangular and Triangular Apertures. Geotext. Geomembr. 2011, 29, 83–91. [Google Scholar] [CrossRef]
- Perkins, S.W.; Haselton, H.N. Resilient Response of Geosynthetics from Cyclic and Sustained in-Air Tensile Loading. Geosynth. Int. 2019, 26, 428–435. [Google Scholar] [CrossRef]
- Han, S.H.; Yea, G.G.; Lee, K.W. Tensile Strength-Strain Relationship of Various Geogrids. J. Korean Geoenviron. Soc. 2012, 13, 83–93. [Google Scholar]
- Wang, Q.B.; Zhang, C.; Wen, X.K.; Lü, R.S.; Liang, X.M.; Lu, S.D. Development and Properties of Glass Fiber Reinforced Plastics Geogrid. J. Wuhan Univ. Technol. Mater. Sci. Edit. 2015, 30, 520–527. [Google Scholar] [CrossRef]
- Yoo, C.; Jeon, H.; Kim, S. Time-Dependent Deformation Charateristics of Geogrid Using Wide Width Tensile Test. J. Korean Geotech. Soc. 2008, 24, 71–80. [Google Scholar]
- ISO 6892-1: 2020-05. Metallic Materials-Tensile Testing-Part 1: Method of Test at Room Temperature; International Organization for Standardization: Geneva, Switzerland, 2019. [Google Scholar]
- ISO 8458-2: 2002. Steel Wire for Mechanical Springs-Part 2: Patented Cold-Drawn Non-Alloy Steel Wire; International Organization for Standardization: Geneva, Switzerland, 2002. [Google Scholar]
- ISO 527-1-2019. Plastics-Determination of Tensile Properties-Part 1. General Principles; International Organization for Standardization: Geneva, Switzerland, 2019. [Google Scholar]
- ASTM E111-2017. Standard Test Method for Young’s Modulus, Tangent Modulus, and Chord Modulus; America; American National Standards Institute: New York, NY, USA, 2017. [Google Scholar]
- Sun, X.F.; Fang, X.S.; Guan, L.T. Mechanics of Materials, 4th ed.; Higher Education Press: Beijing, China, 2004; Volume I. [Google Scholar]
- Li, Q.Y.; Zhang, D.X.; Yuan, J. FRP Compound Theory and FRC Compound Theory. J. Harbin Univ. Civ. Eng. Archit. 2002, 35, 74–78. [Google Scholar]
- Wang, Q.-B.; Song, H.-X.; Li, Y.; Wang, F.-Q.; Hu, Z.-J.; Lou, S.-M.; Shi, Z.-Y. Experimental Study on the Performance of Graded Glass Fiber Reinforced Concrete (G-GRC) Based on Engineering Application. Materials 2021, 14, 1149. [Google Scholar] [CrossRef] [PubMed]
- Shen, G.L.; Hu, G.K.; Liu, B. Composite Materials Mechanics, 2nd ed.; Tsinghua University Press: Beijing, China, 2013. [Google Scholar]

| Material Type | Experimental Group Number | Wire Diameter (mm) d | Number of Steel Wires (Root) n | Sectional Area Size of the Reinforced Belt | Reinforcement Ratio λS (%) | |
|---|---|---|---|---|---|---|
| Width (mm) b | Thickness (mm) h | |||||
| Cold-drawn non-alloy steel wire for springs | SW0.5 | 0.5 | / | / | / | / |
| SW0.6 | 0.6 | / | / | / | / | |
| SW0.7 | 0.7 | / | / | / | / | |
| Polyethylene geogrid belt | PE | / | / | 8.1 | 1.6 | / |
| Steel–plastic compound geogrid reinforced belt | SR-1 | 0.5 | 9 | 15.8 | 2.44 | 0.0458 |
| SR-2 | 0.5 | 8 | 13.9 | 1.9 | 0.0594 | |
| SR-3 | 0.6 | 6 | 10.12 | 1.74 | 0.0963 | |
| SR-4 | 0.7 | 10 | 17.7 | 2.2 | 0.0988 | |
| SR-5 | 0.6 | 8 | 10.78 | 1.76 | 0.1192 | |
| SR-6 | 0.7 | 8 | 10.92 | 2.28 | 0.1236 | |
| SR-7 | 0.7 | 14 | 19.22 | 2.14 | 0.1309 | |
| SR-8 | 0.7 | 15 | 19.94 | 1.98 | 0.1461 | |
| SR-9 | 0.7 | 13 | 15.2 | 2.2 | 0.1495 | |
| SR-10 | 0.7 | 12 | 15.22 | 1.98 | 0.1532 | |
| SR-11 | 0.7 | 16 | 17.34 | 2.12 | 0.1674 | |
| SR-12 | 0.7 | 17 | 18.4 | 1.8 | 0.1974 | |
| SR-13 | 0.7 | 19 | 18.4 | 1.8 | 0.2207 | |
| Experimental Group Number | Fracture Stress of Steel Wire (MPa) σs | Maximum Force of Steel Wire (N) Fs = σs × S1 | |
|---|---|---|---|
| SW0.5 | 2000–2400 | 390–470 | 3.90–4.70 |
| SW0.6 | 565–678 | 5.65–6.78 | |
| SW0.7 | 769–923 | 7.69–9.23 |
| Experimental Group Number | Maximum Force of Polyethylene Geogrid Belt (N) Fm | |
|---|---|---|
| PE | 280–350 | 2.8–3.5 |
| Experimental Group Number | Maximum Force of Single Steel Wire (N) Fs | Maximum Force Estimation of Reinforced Belt (N) Fc = Fs × n | Experimental Group Number | Maximum Force of Single Steel Wire (N) Fs | Maximum Force Estimation of Reinforced Belt (N) Fc = Fs × n | ||
|---|---|---|---|---|---|---|---|
| SR-1 | 390–470 | 3510–4230 | 35.10–42.30 | SR-8 | 769–923 | 11,535–13,845 | 115.35–138.45 |
| SR-2 | 390–470 | 3120–3760 | 31.20–37.60 | SR-9 | 769–923 | 9997–11,999 | 99.97–119.99 |
| SR-3 | 565–678 | 3390–4068 | 33.90–40.68 | SR-10 | 769–923 | 9228–11,076 | 92.28–110.76 |
| SR-4 | 769–923 | 7690–9230 | 76.90–92.30 | SR-11 | 769–923 | 12,304–14,768 | 123.04–147.68 |
| SR-5 | 565–678 | 4520–5424 | 45.20–54.24 | SR-12 | 769–923 | 13,073–15,691 | 130.73–156.91 |
| SR-6 | 769–923 | 6152–7384 | 61.52–73.84 | SR-13 | 769–923 | 14,611–17,537 | 146.11–175.37 |
| SR-7 | 769–923 | 10,766–12,922 | 107.66–129.22 | / | / | / | / |
| Test Group | Modulus of Elasticity (GPa) | Test Group | Modulus of Elasticity (GPa) | Test Group | Modulus of Elasticity (GPa) |
|---|---|---|---|---|---|
| SR-1 | 7.89 | SR-6 | 24.56 | SR-11 | 24.66 |
| SR-2 | 10 | SR-7 | 23.7 | SR-12 | 28.1 |
| SR-3 | 16.63 | SR-8 | 23.79 | SR-13 | 30.58 |
| SR-4 | 17.52 | SR-9 | 24.24 | / | / |
| SR-5 | 24.9 | SR-10 | 23.48 | / | / |
| Material Type | (MPa) | (%) | (MPa) | (MPa) | (%) | |
|---|---|---|---|---|---|---|
| Polyethylene geogrid belt | 25 | / | / | / | / | |
| Steel wire | 0.5 mm | / | 1.44 | 2335 | 10.30 | 0.63 |
| 0.6 mm | / | 1.47 | 2365 | 10.60 | 0.61 | |
| 0.7 mm | / | 1.5 | 2260 | 10.91 | 0.63 | |
Publisher’s Note: MDPI stays neutral with regard to jurisdictional claims in published maps and institutional affiliations. |
© 2021 by the authors. Licensee MDPI, Basel, Switzerland. This article is an open access article distributed under the terms and conditions of the Creative Commons Attribution (CC BY) license (https://creativecommons.org/licenses/by/4.0/).
Share and Cite
Wang, Q.; Li, Y.; Song, H.; Duan, J.; Hu, Z.; Wang, F.; Xu, H.; Liu, Z.; Zhang, M.; Wang, L.; et al. Experimental Study on Tensile Mechanical Properties and Reinforcement Ratio of Steel–Plastic Compound Geogrid-Reinforced Belt. Materials 2021, 14, 5963. https://doi.org/10.3390/ma14205963
Wang Q, Li Y, Song H, Duan J, Hu Z, Wang F, Xu H, Liu Z, Zhang M, Wang L, et al. Experimental Study on Tensile Mechanical Properties and Reinforcement Ratio of Steel–Plastic Compound Geogrid-Reinforced Belt. Materials. 2021; 14(20):5963. https://doi.org/10.3390/ma14205963
Chicago/Turabian StyleWang, Qingbiao, Yue Li, Hongxu Song, Jianing Duan, Zhongjing Hu, Fuqiang Wang, Haolin Xu, Zhengyin Liu, Mingjing Zhang, Liming Wang, and et al. 2021. "Experimental Study on Tensile Mechanical Properties and Reinforcement Ratio of Steel–Plastic Compound Geogrid-Reinforced Belt" Materials 14, no. 20: 5963. https://doi.org/10.3390/ma14205963