
Effect of Ammonia-Soda Residue on the Strength and Chloride-Resistance Performance of Steel Slag-Granulated Blast Furnace Slag-Based Concrete after Immersion in Artificial Seawater

Abstract
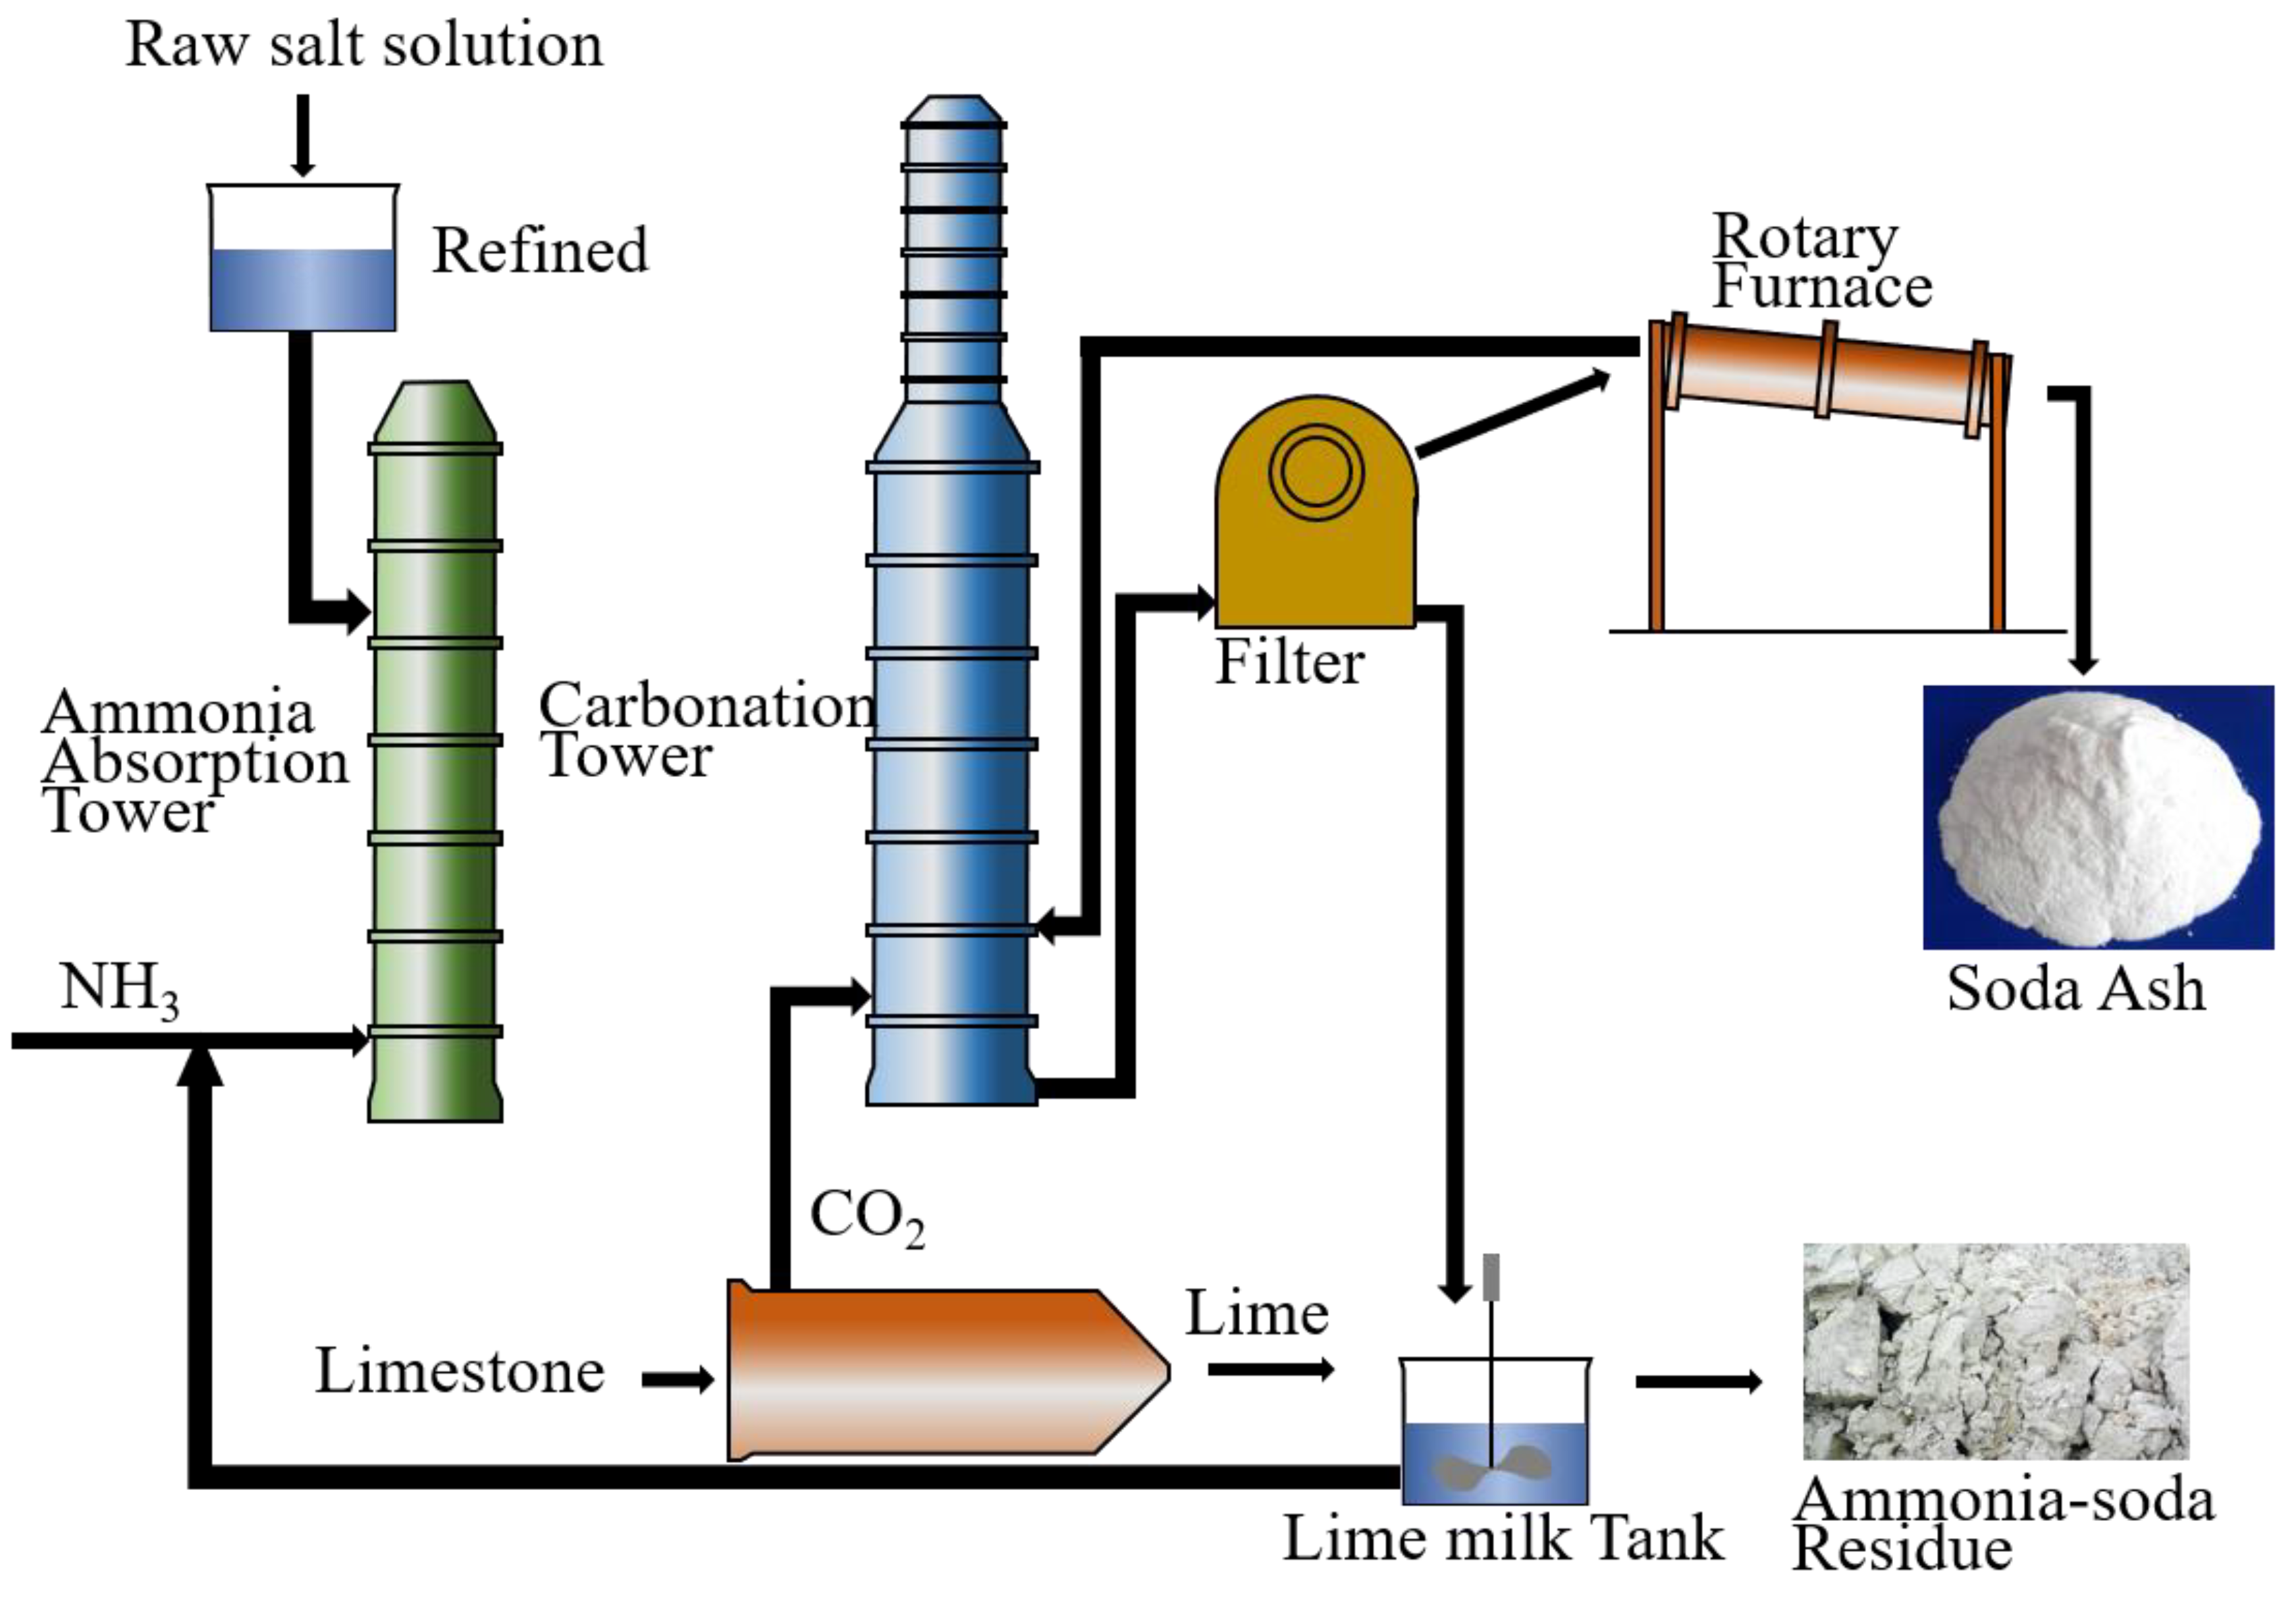
:1. Introduction
2. Materials and Methods
2.1. Materials
2.2. Sample Preparation
2.3. Methods
3. Results
3.1. Compressive Strength
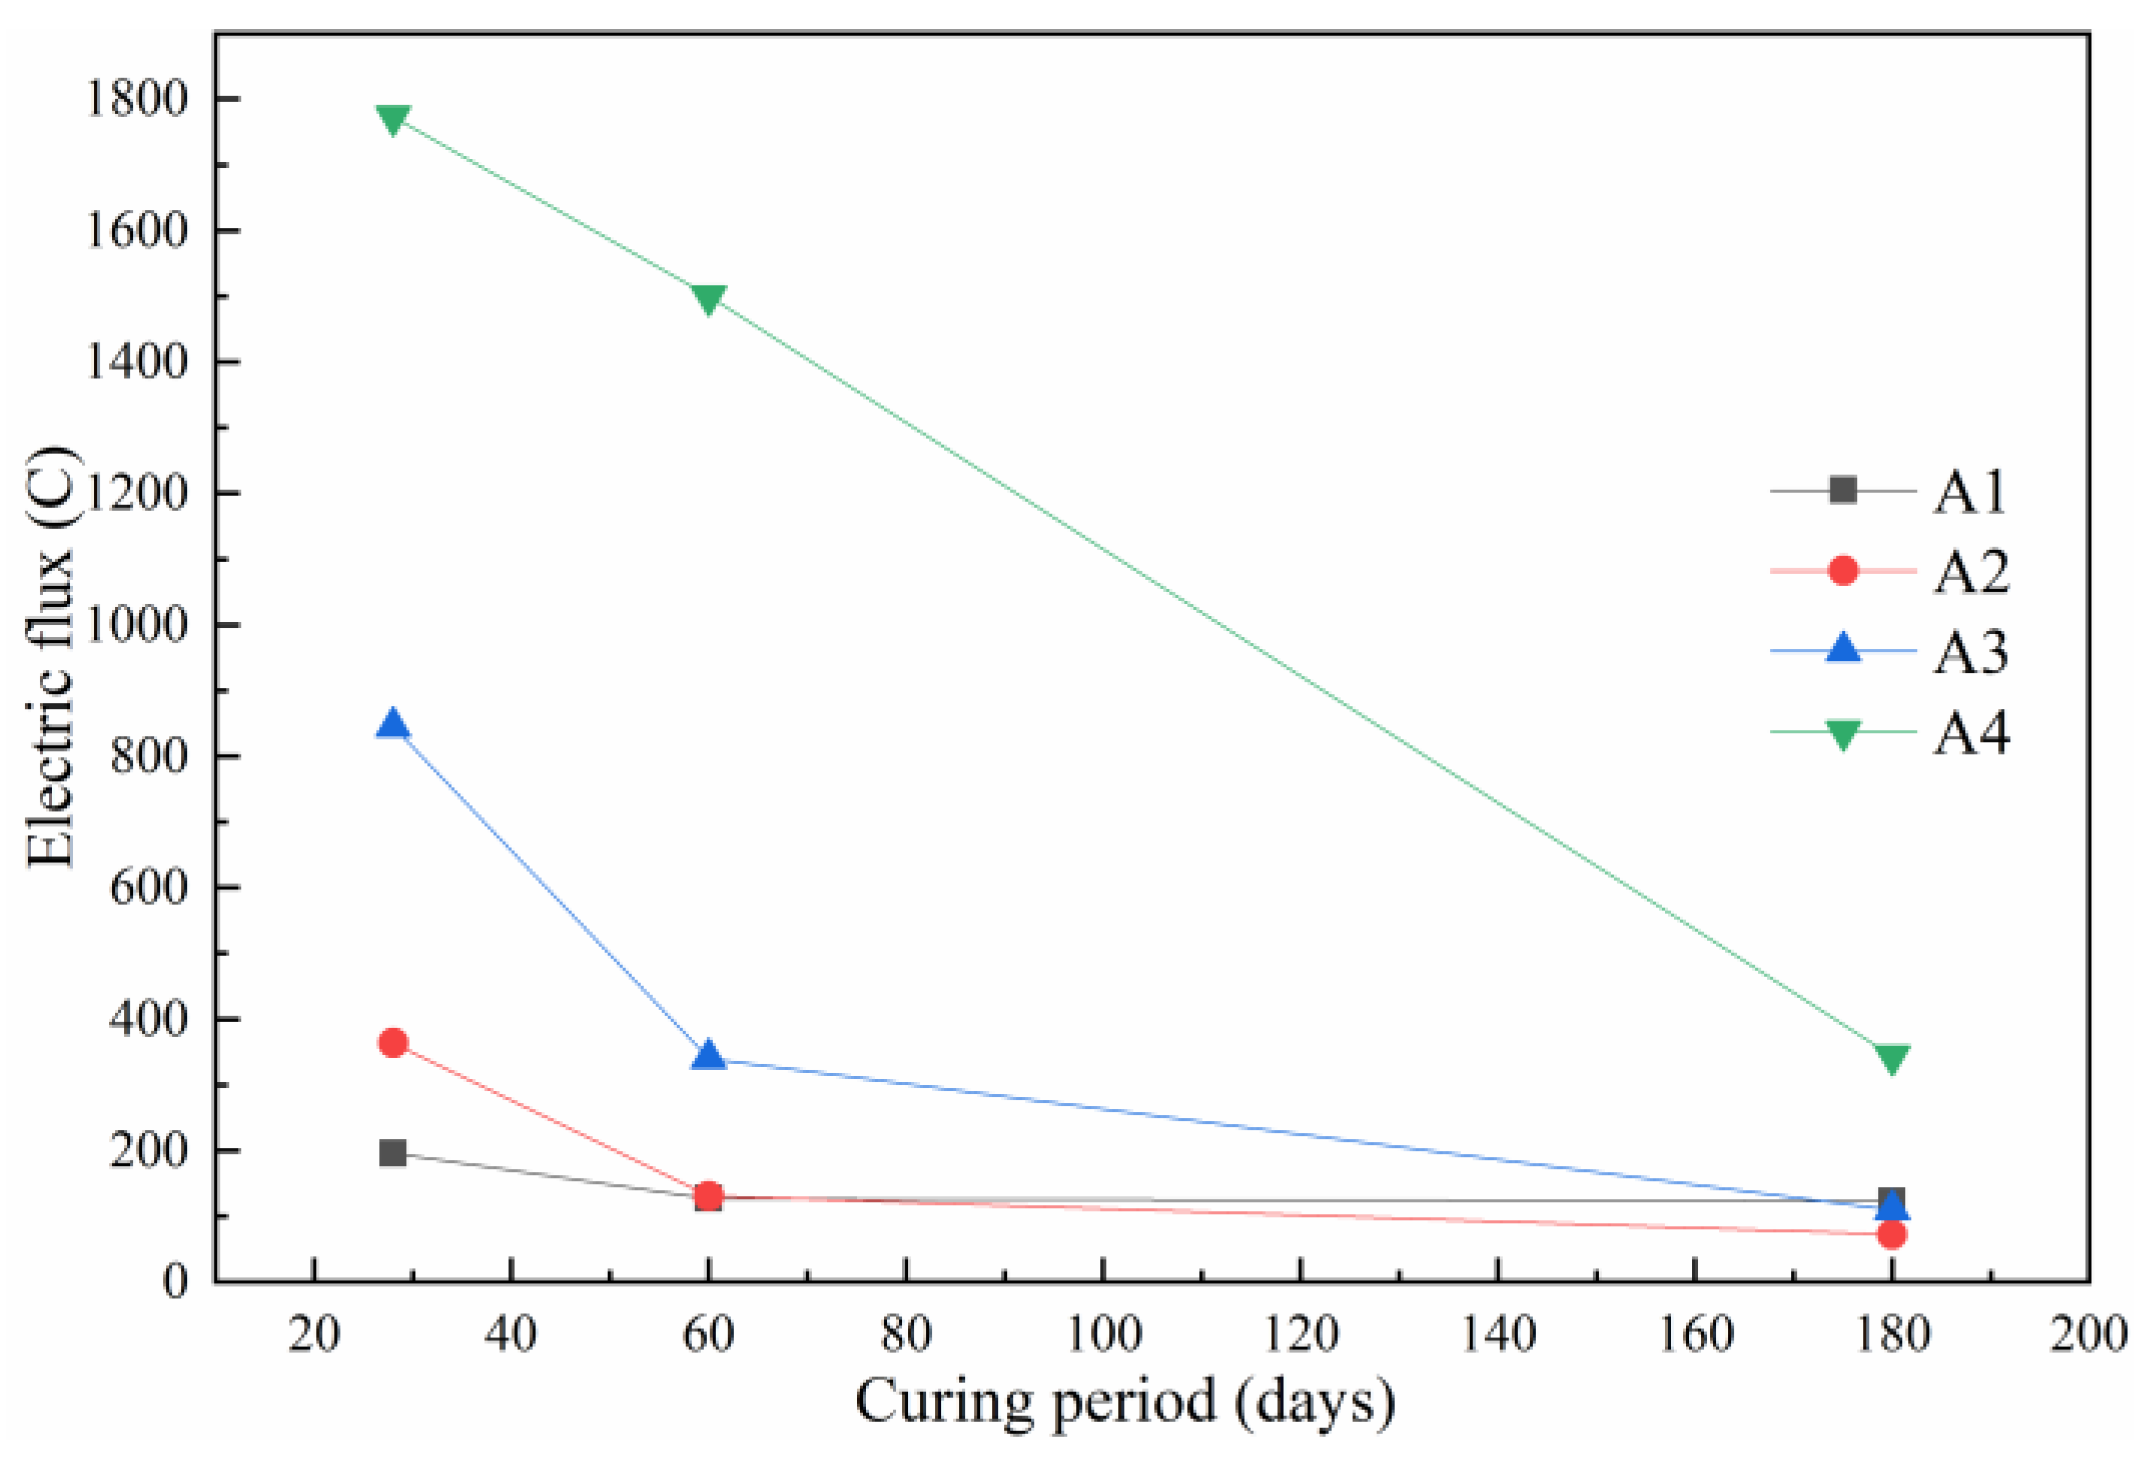
3.2. Electric Flux Analysis
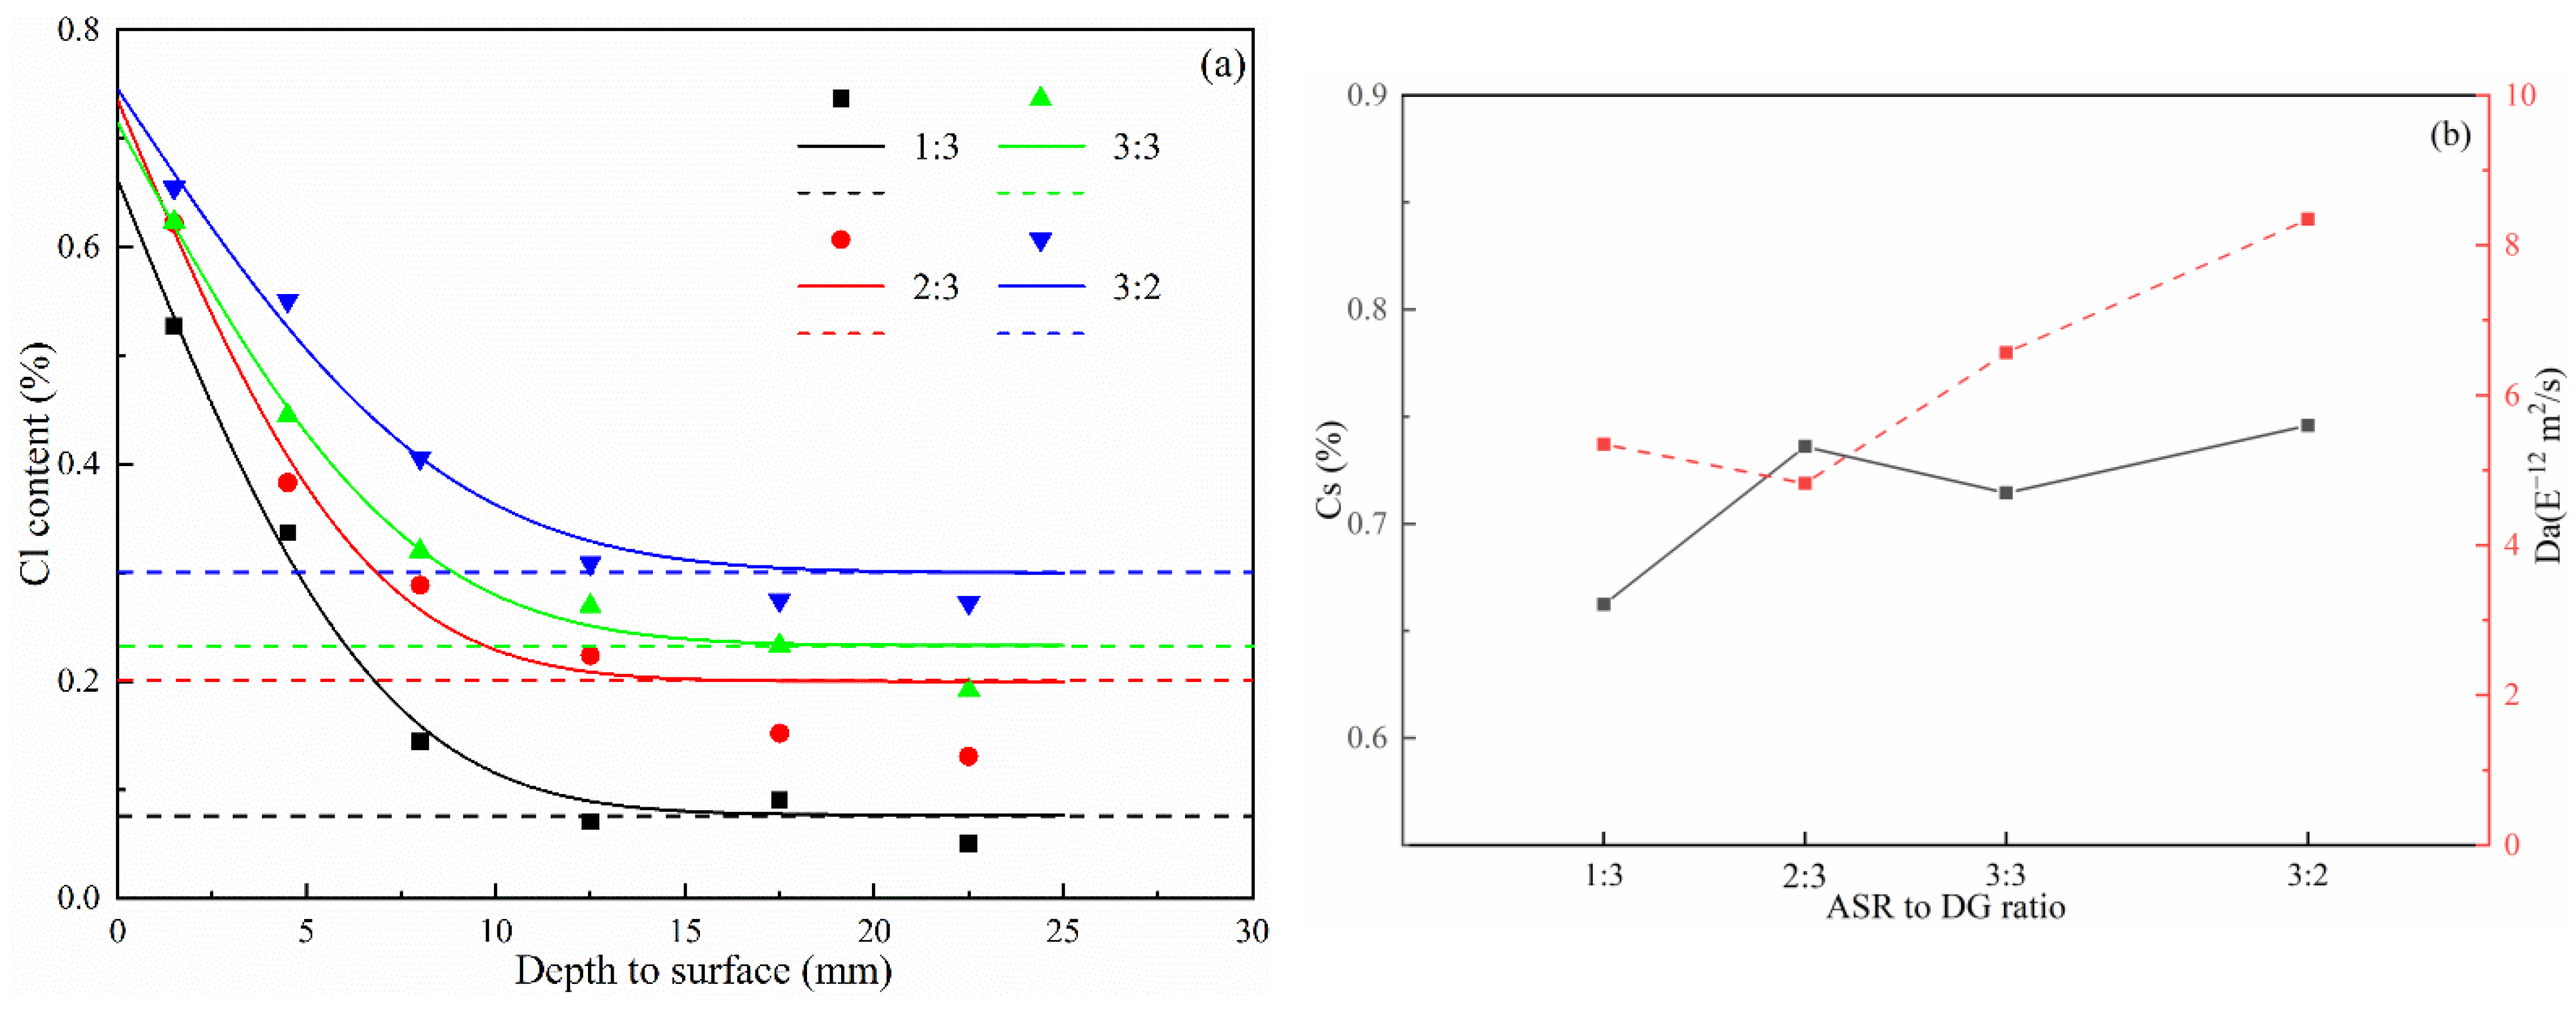
3.3. Chloride Profile Analysis
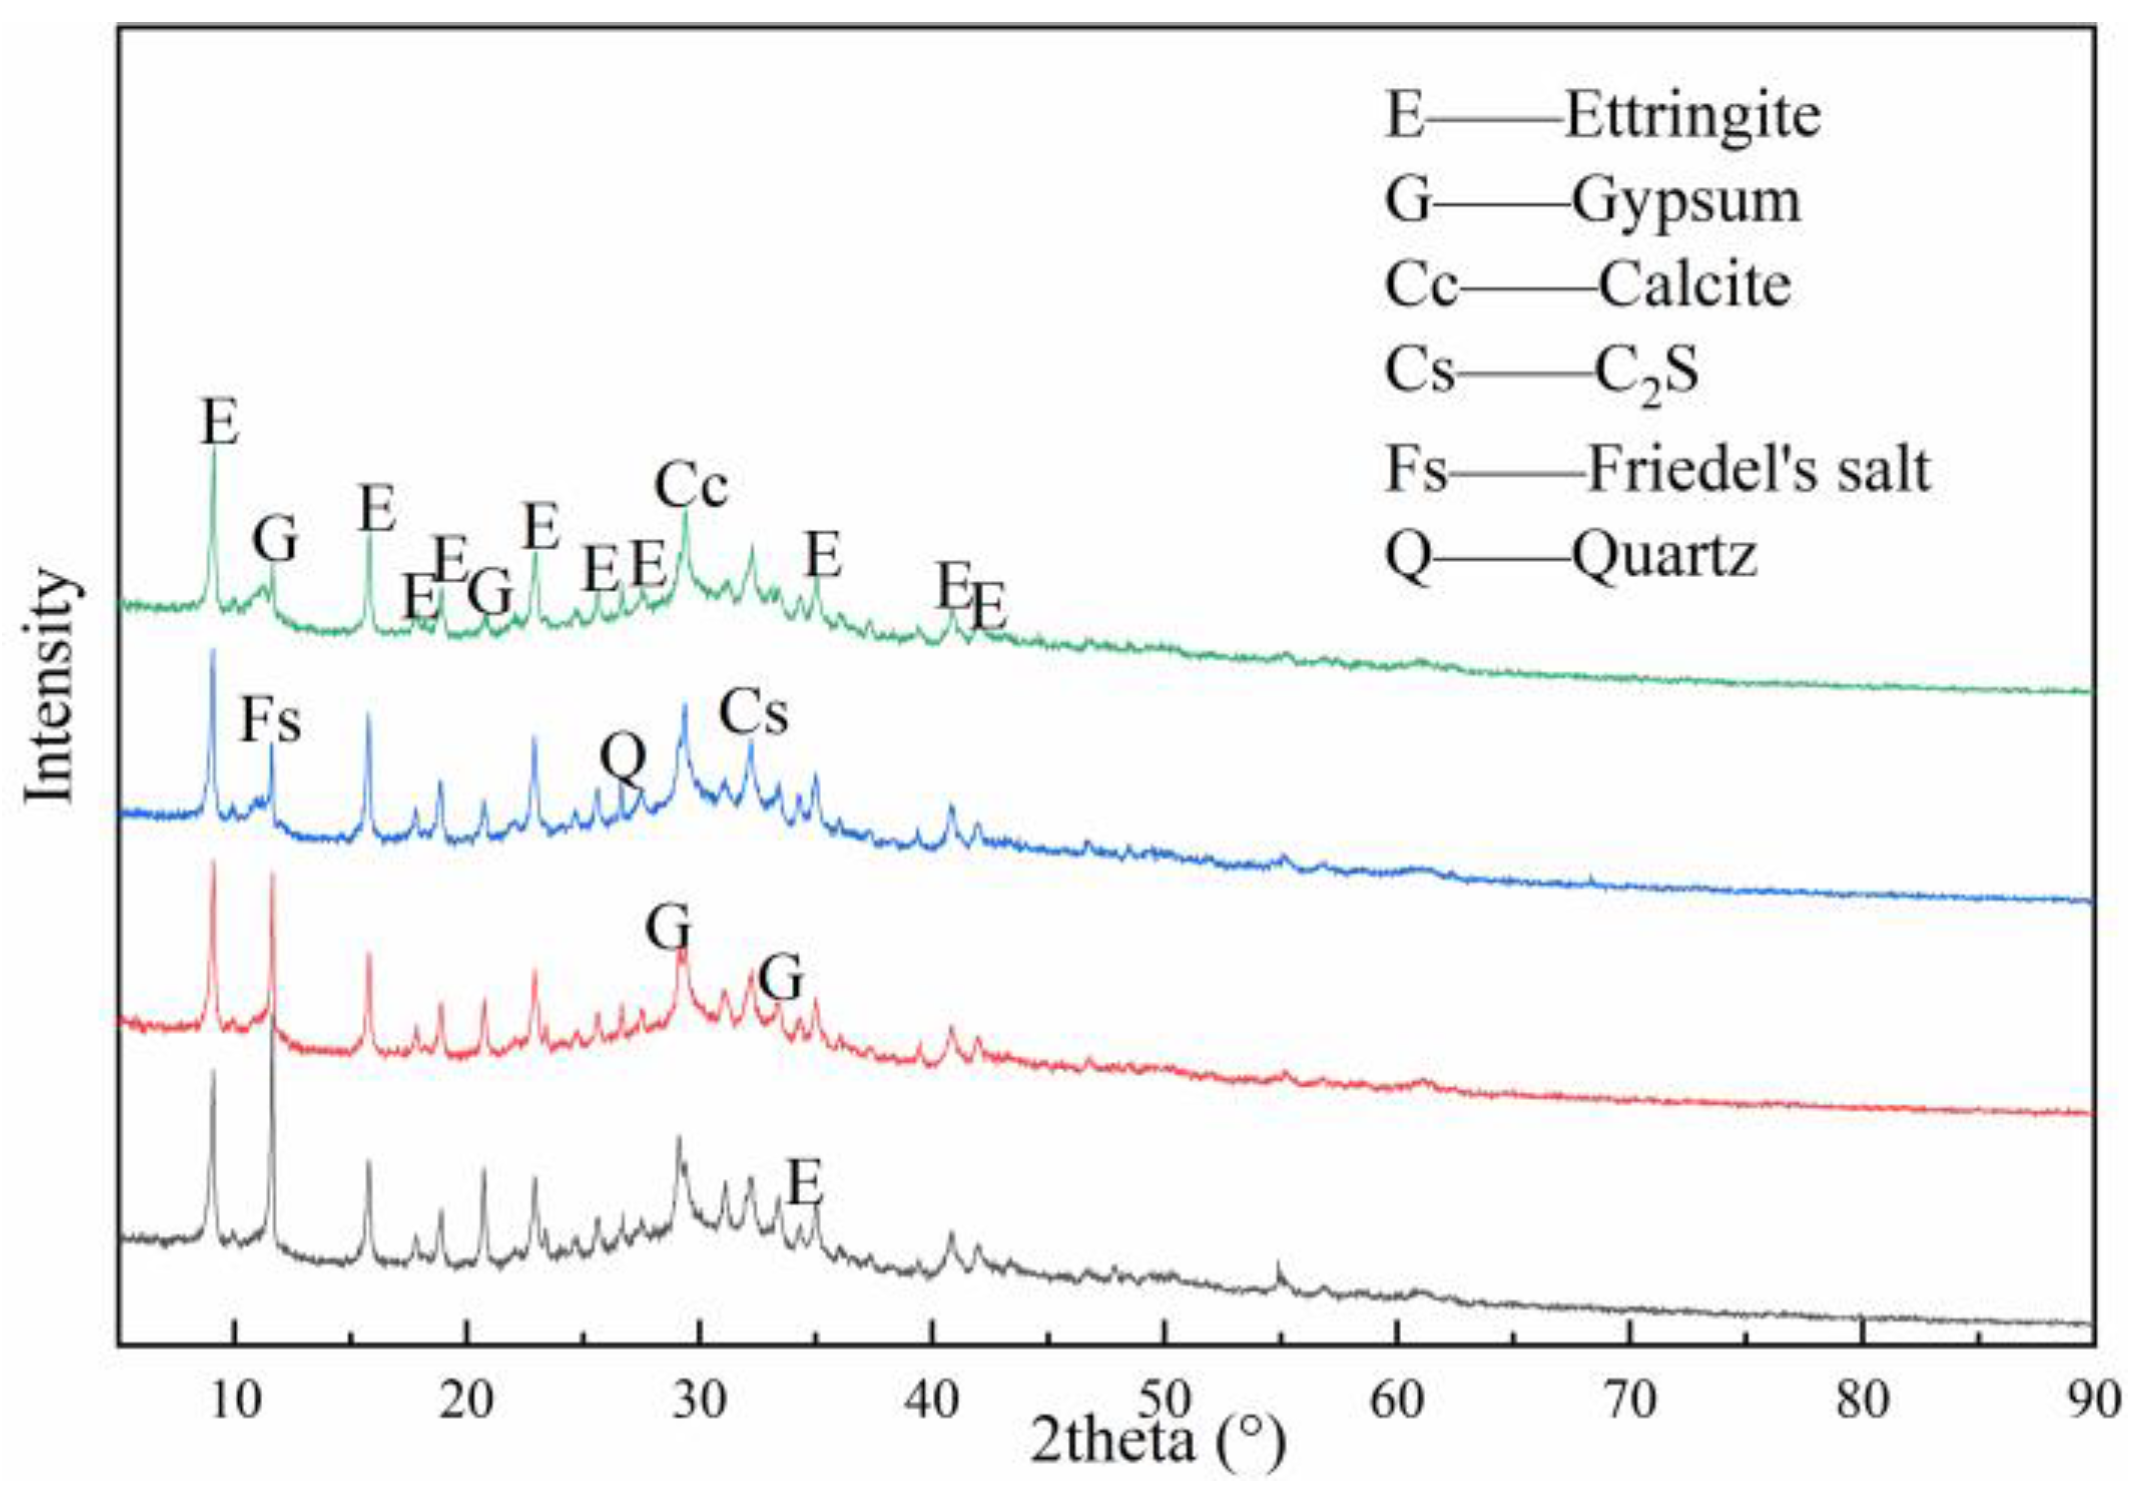
3.4. XRD Analysis
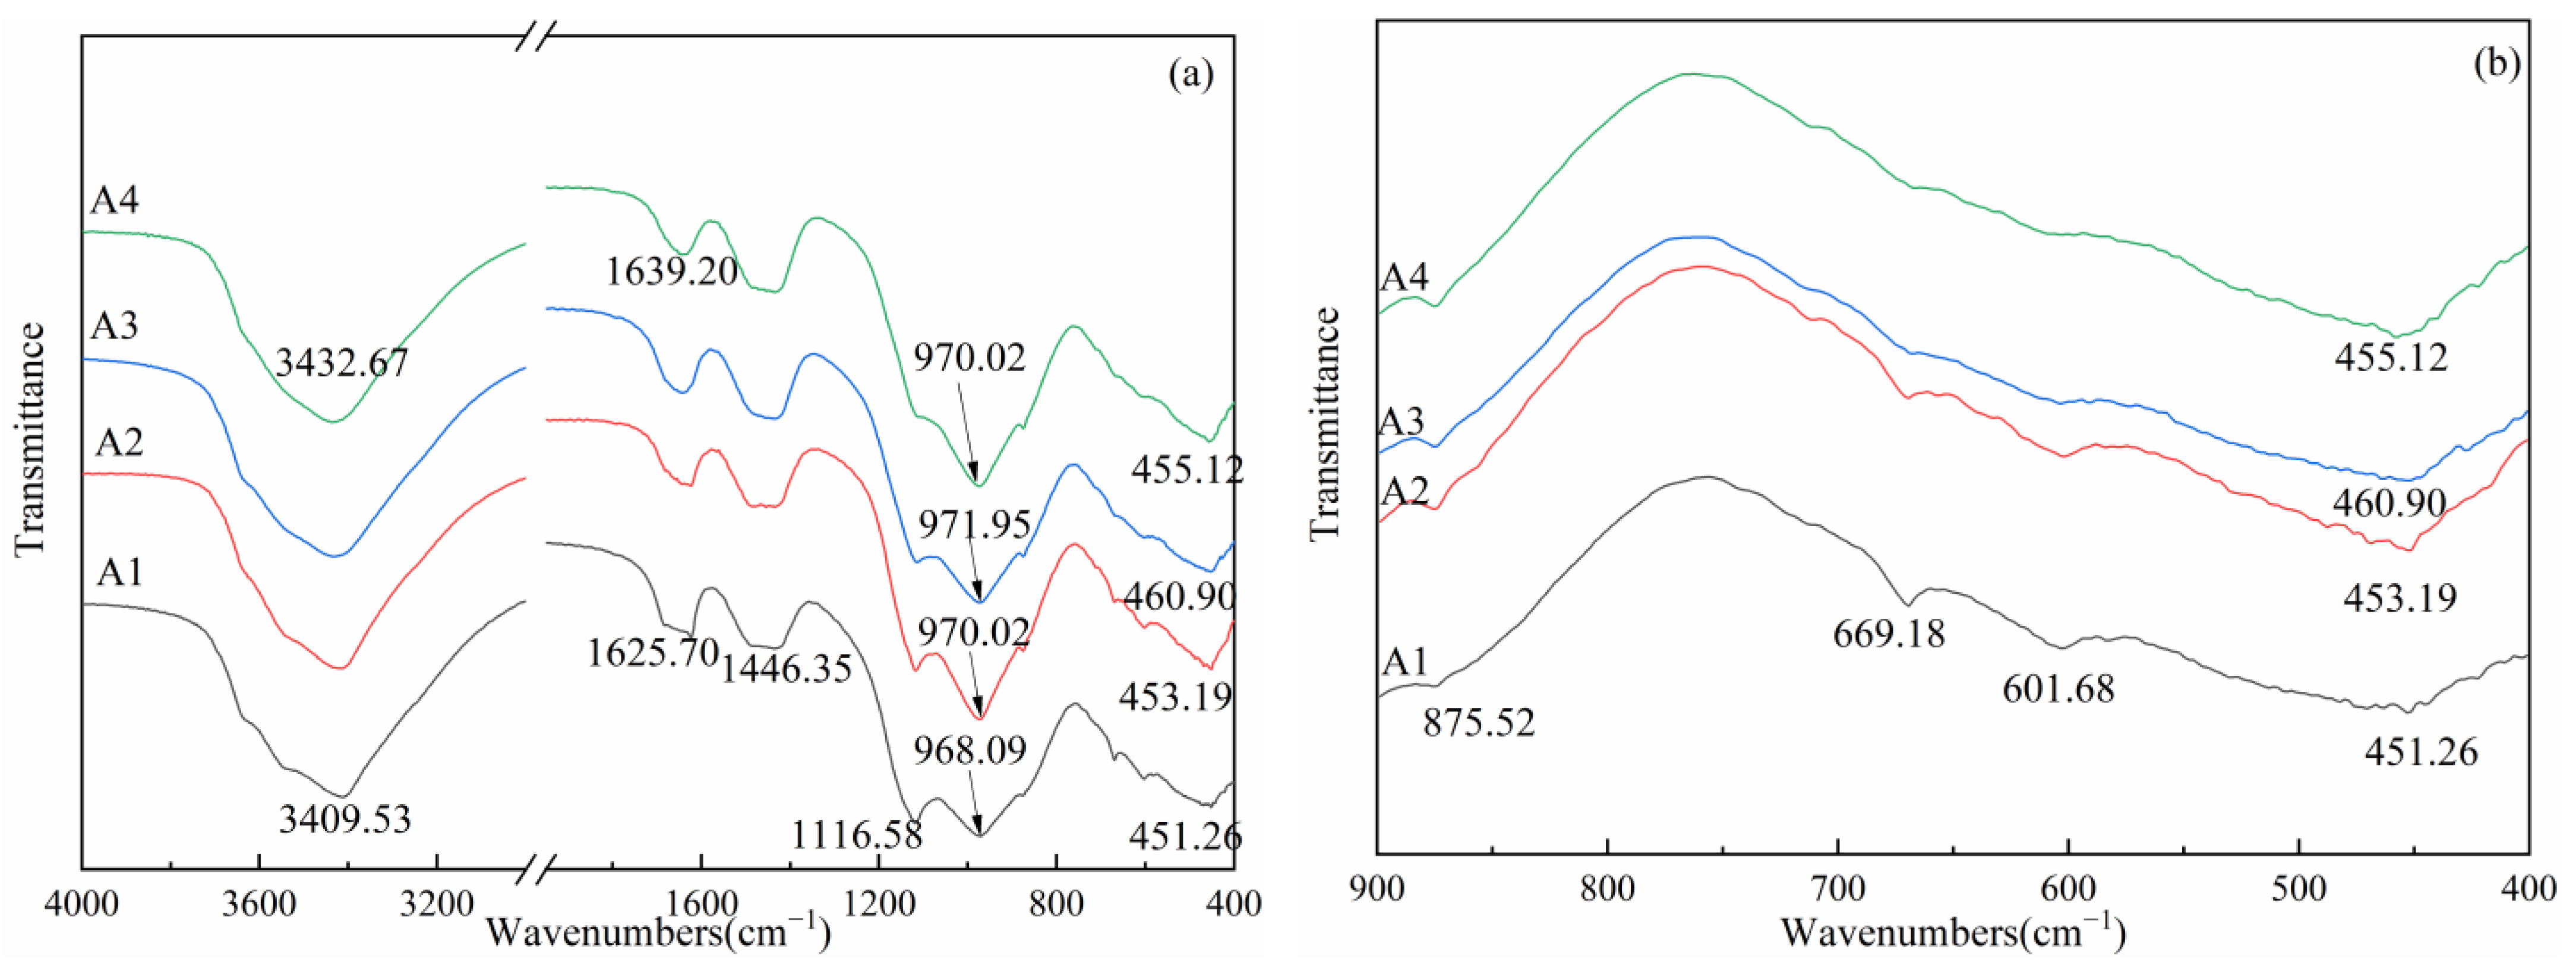
3.5. FTIR Analysis
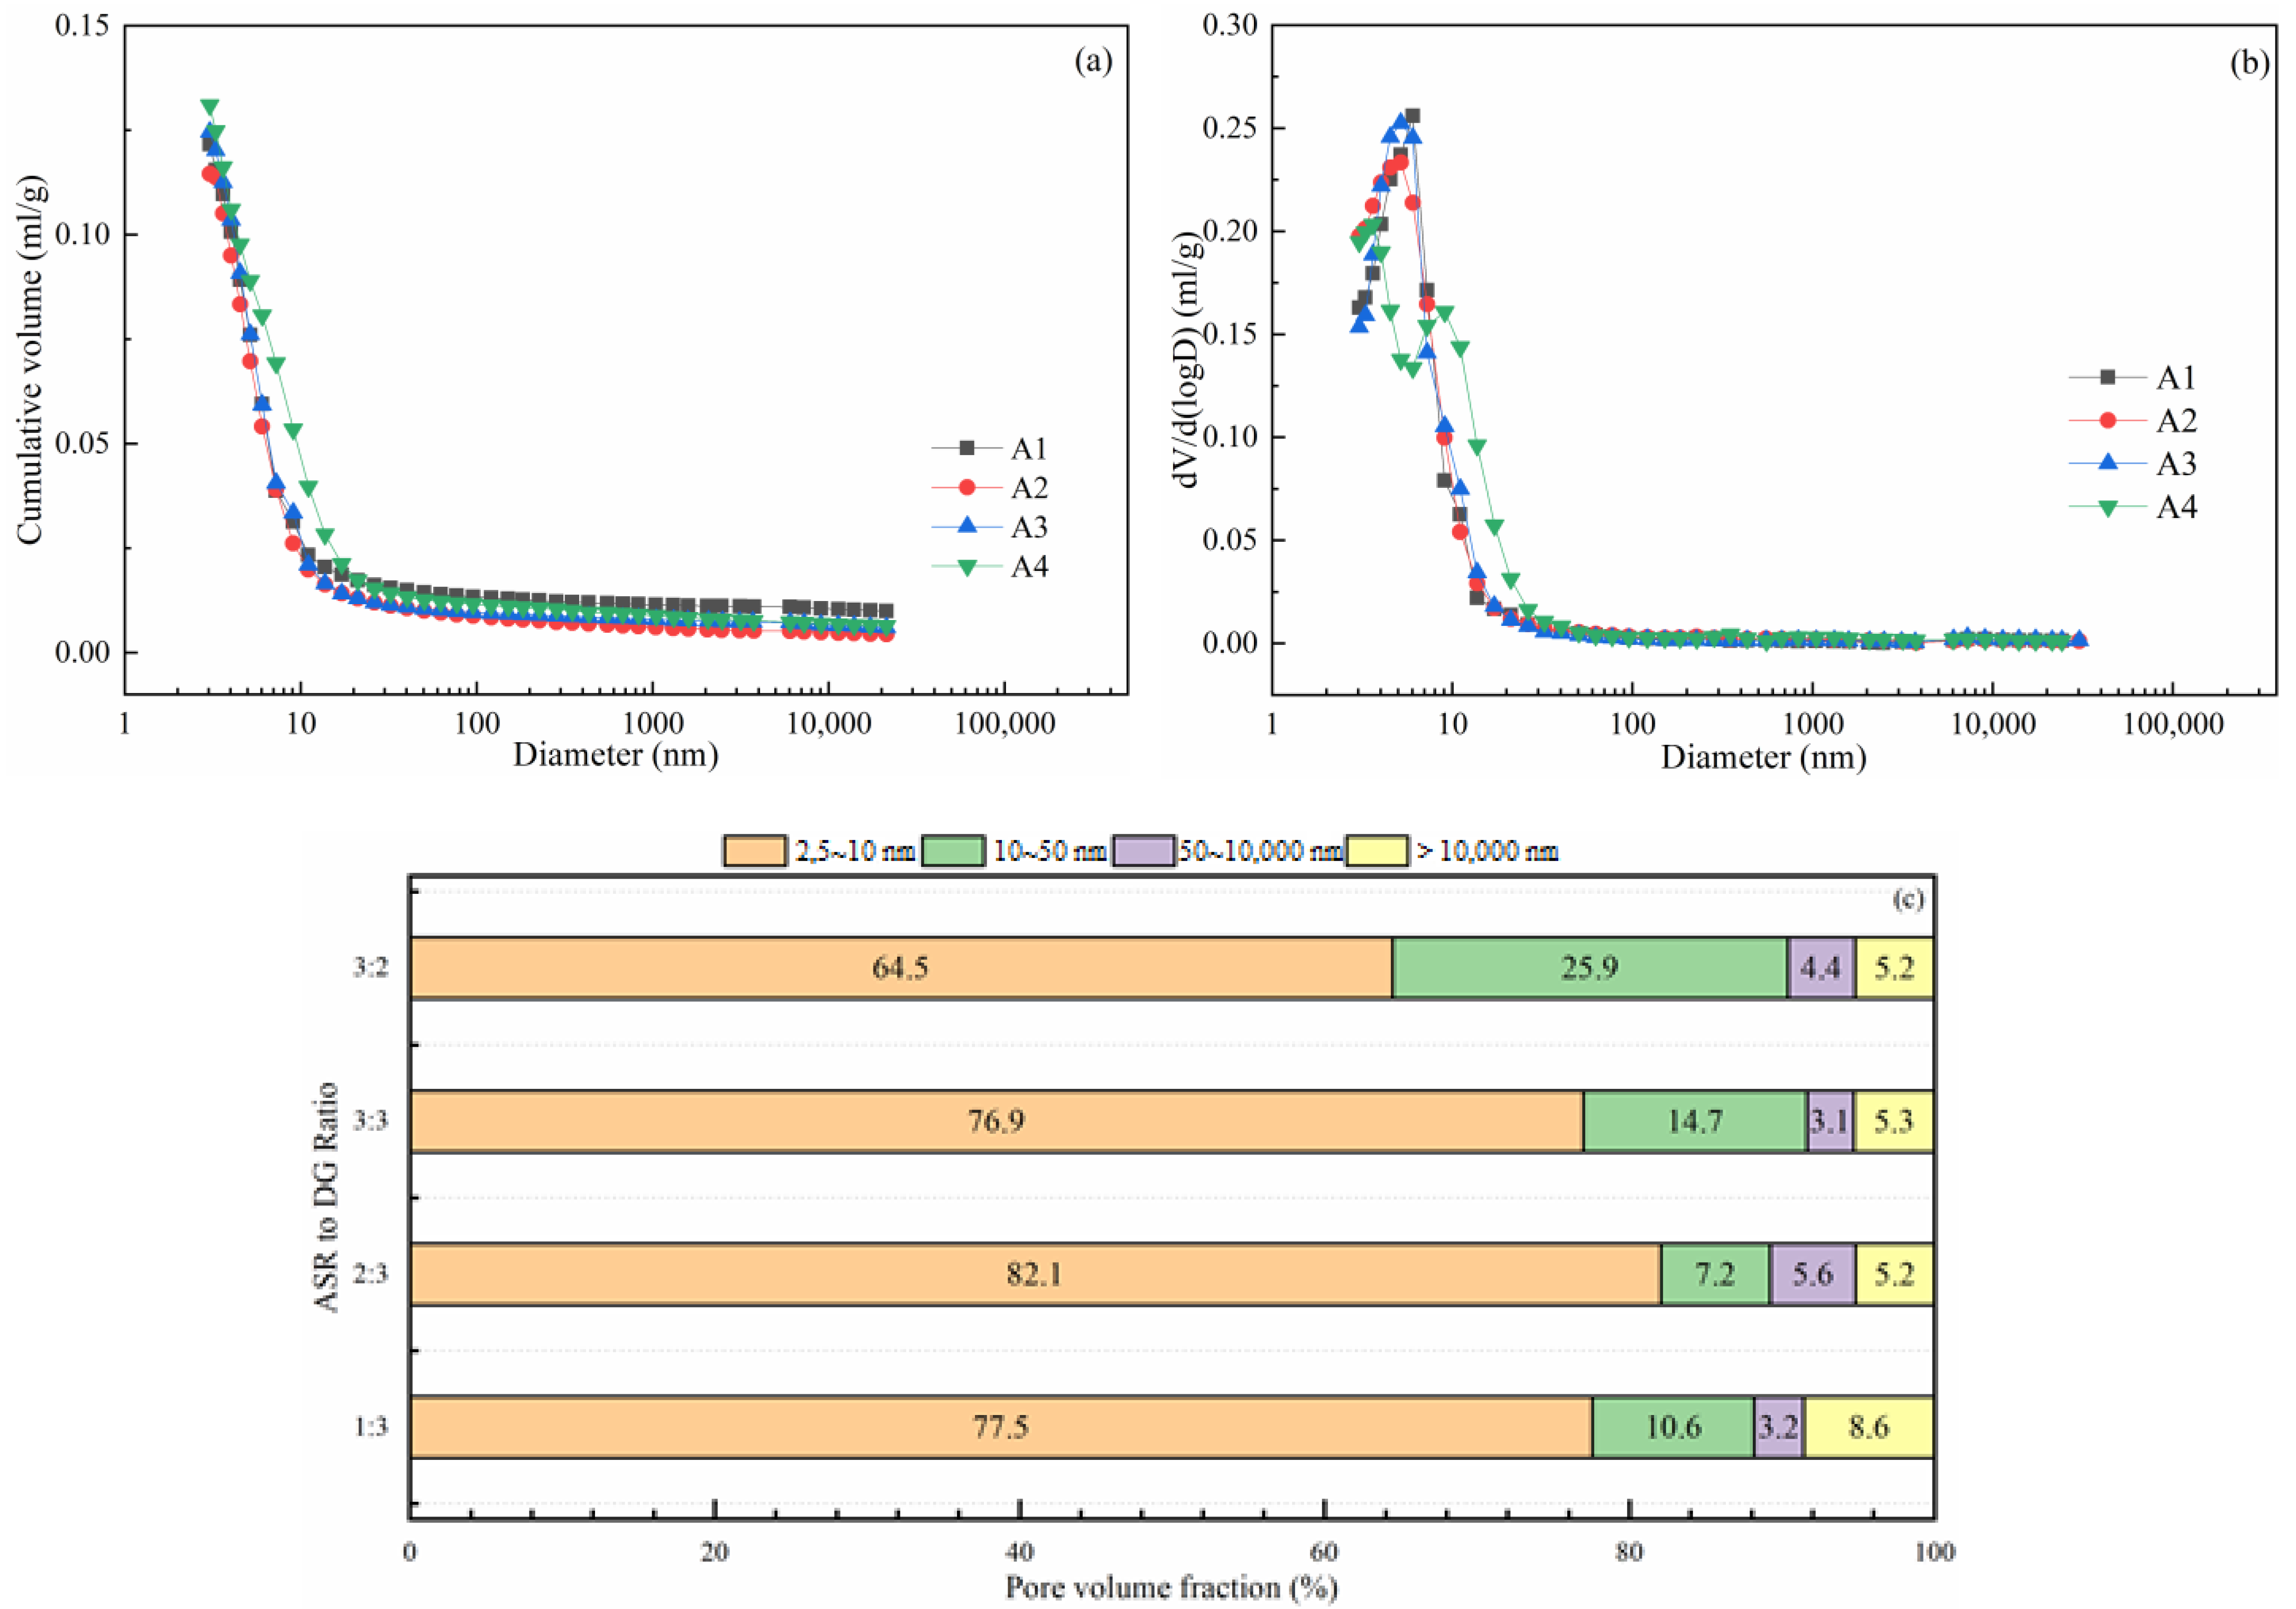
3.6. Pore Structure
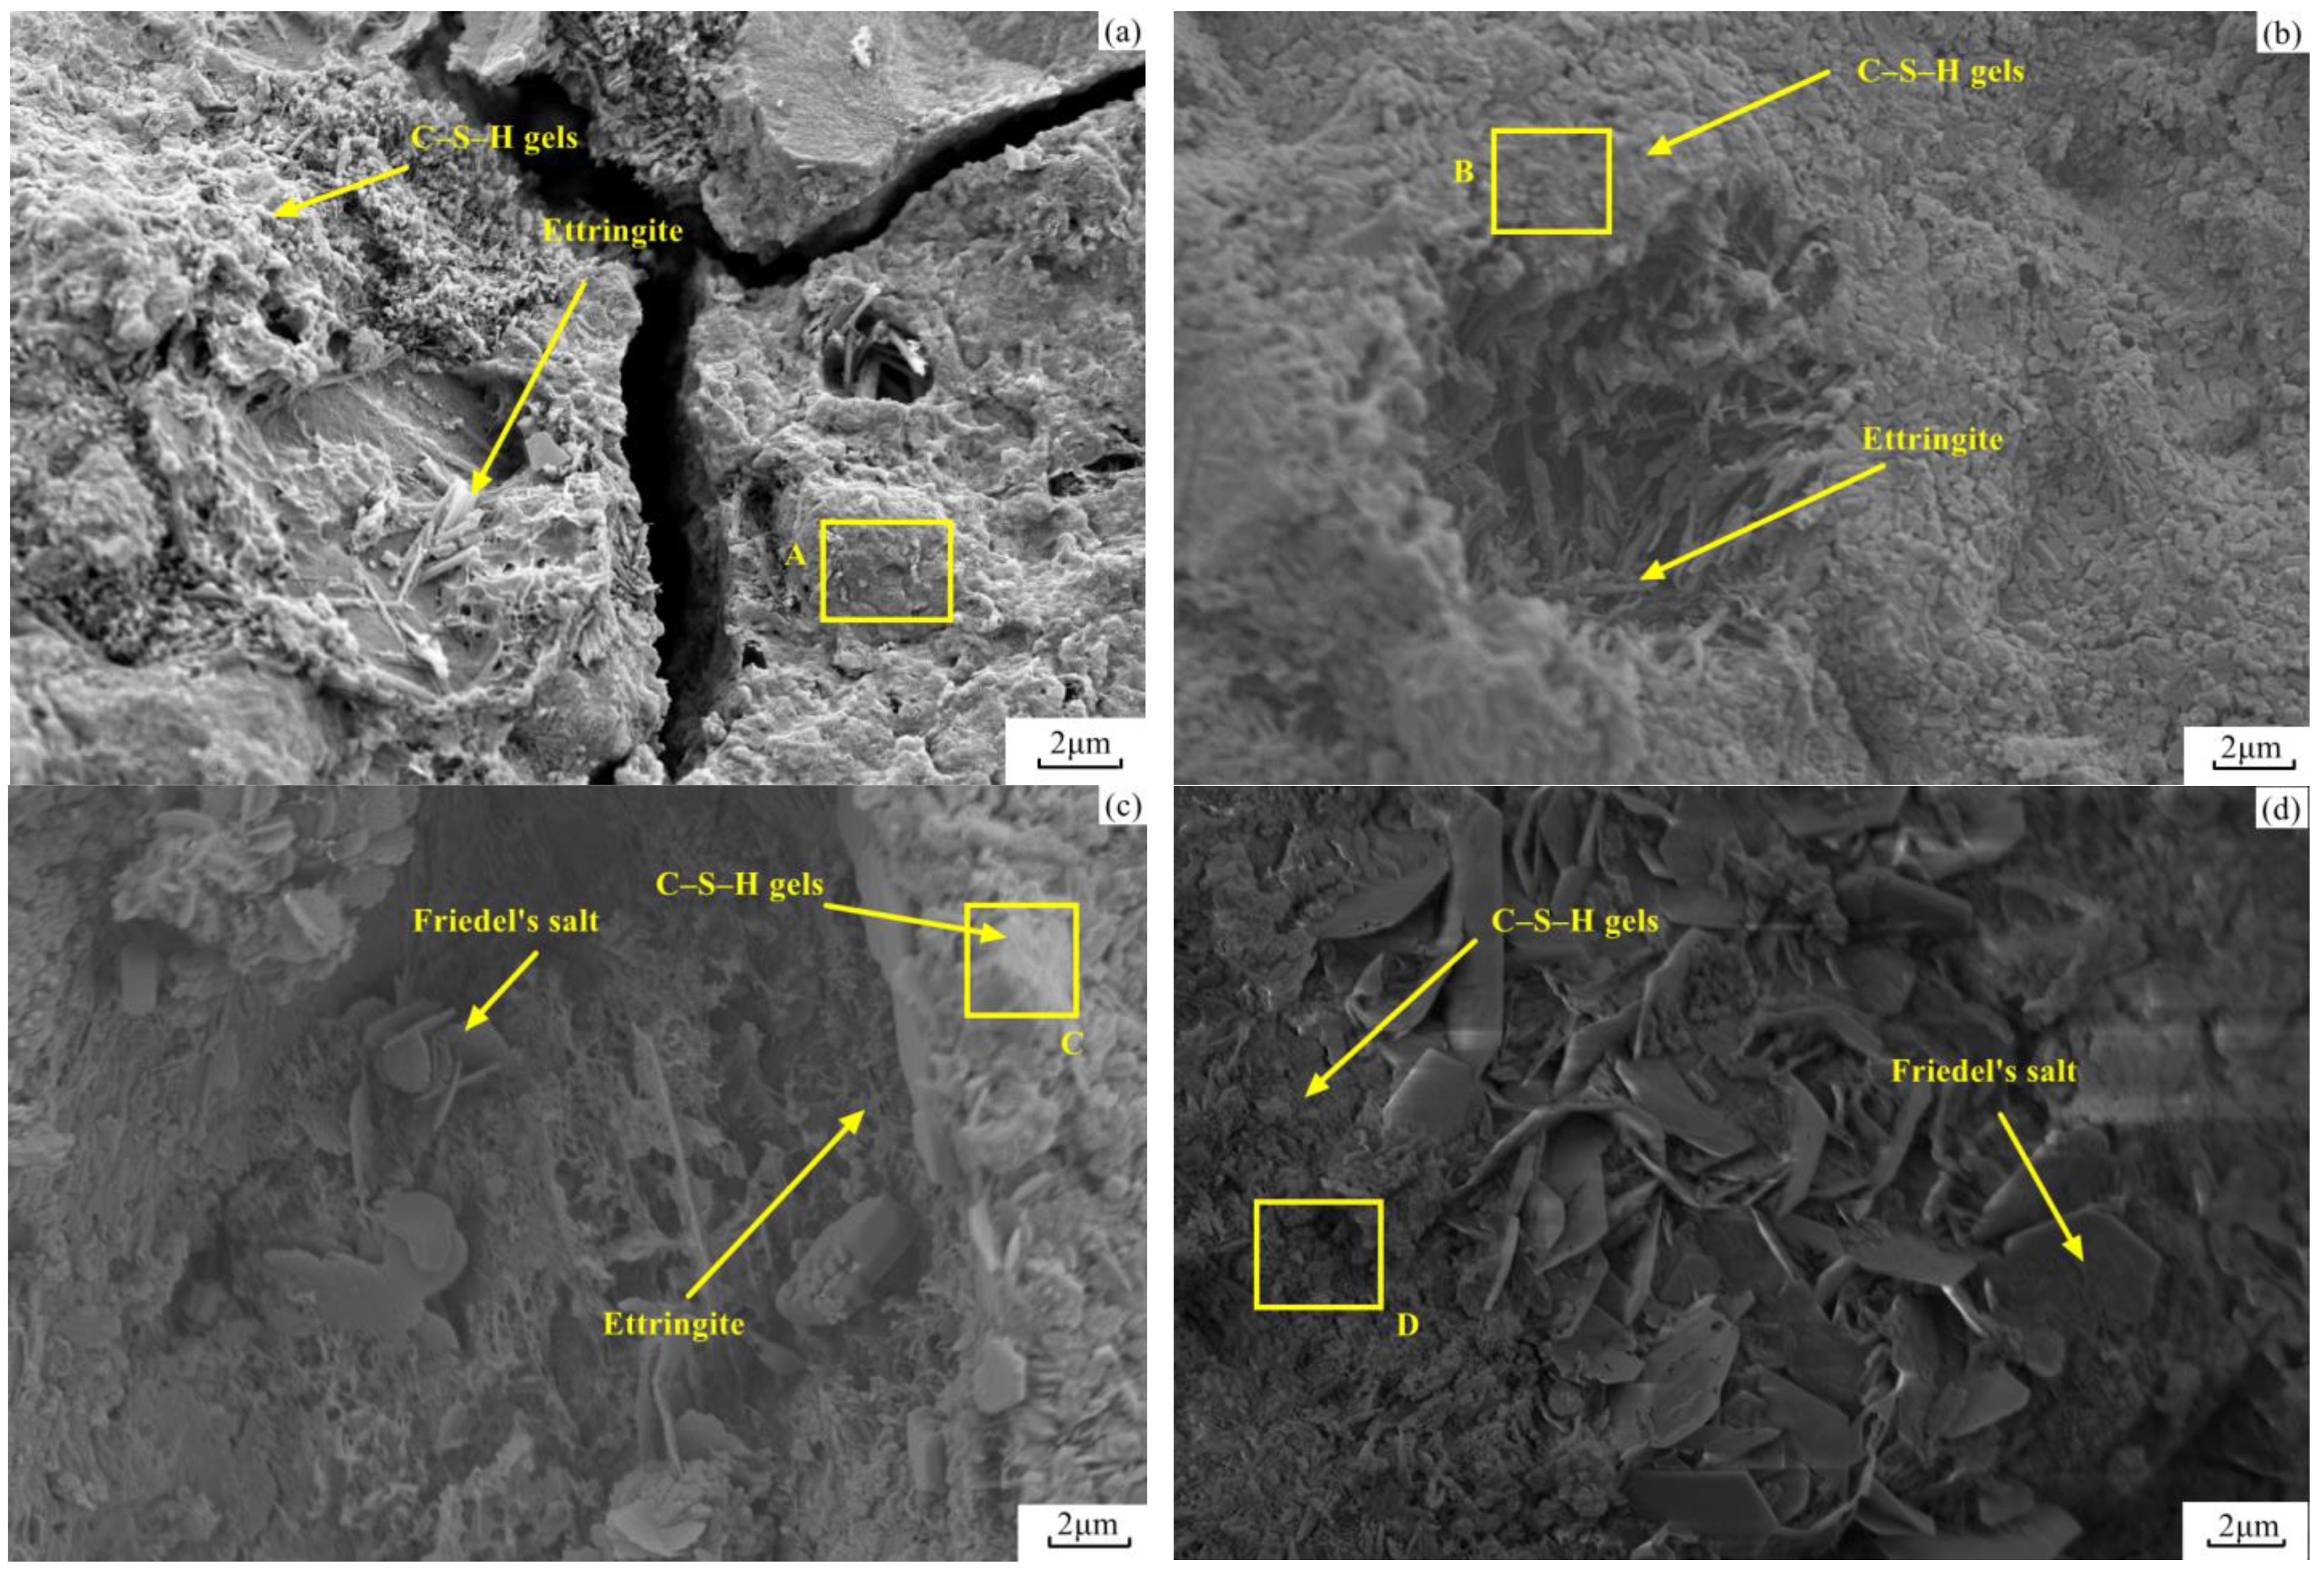
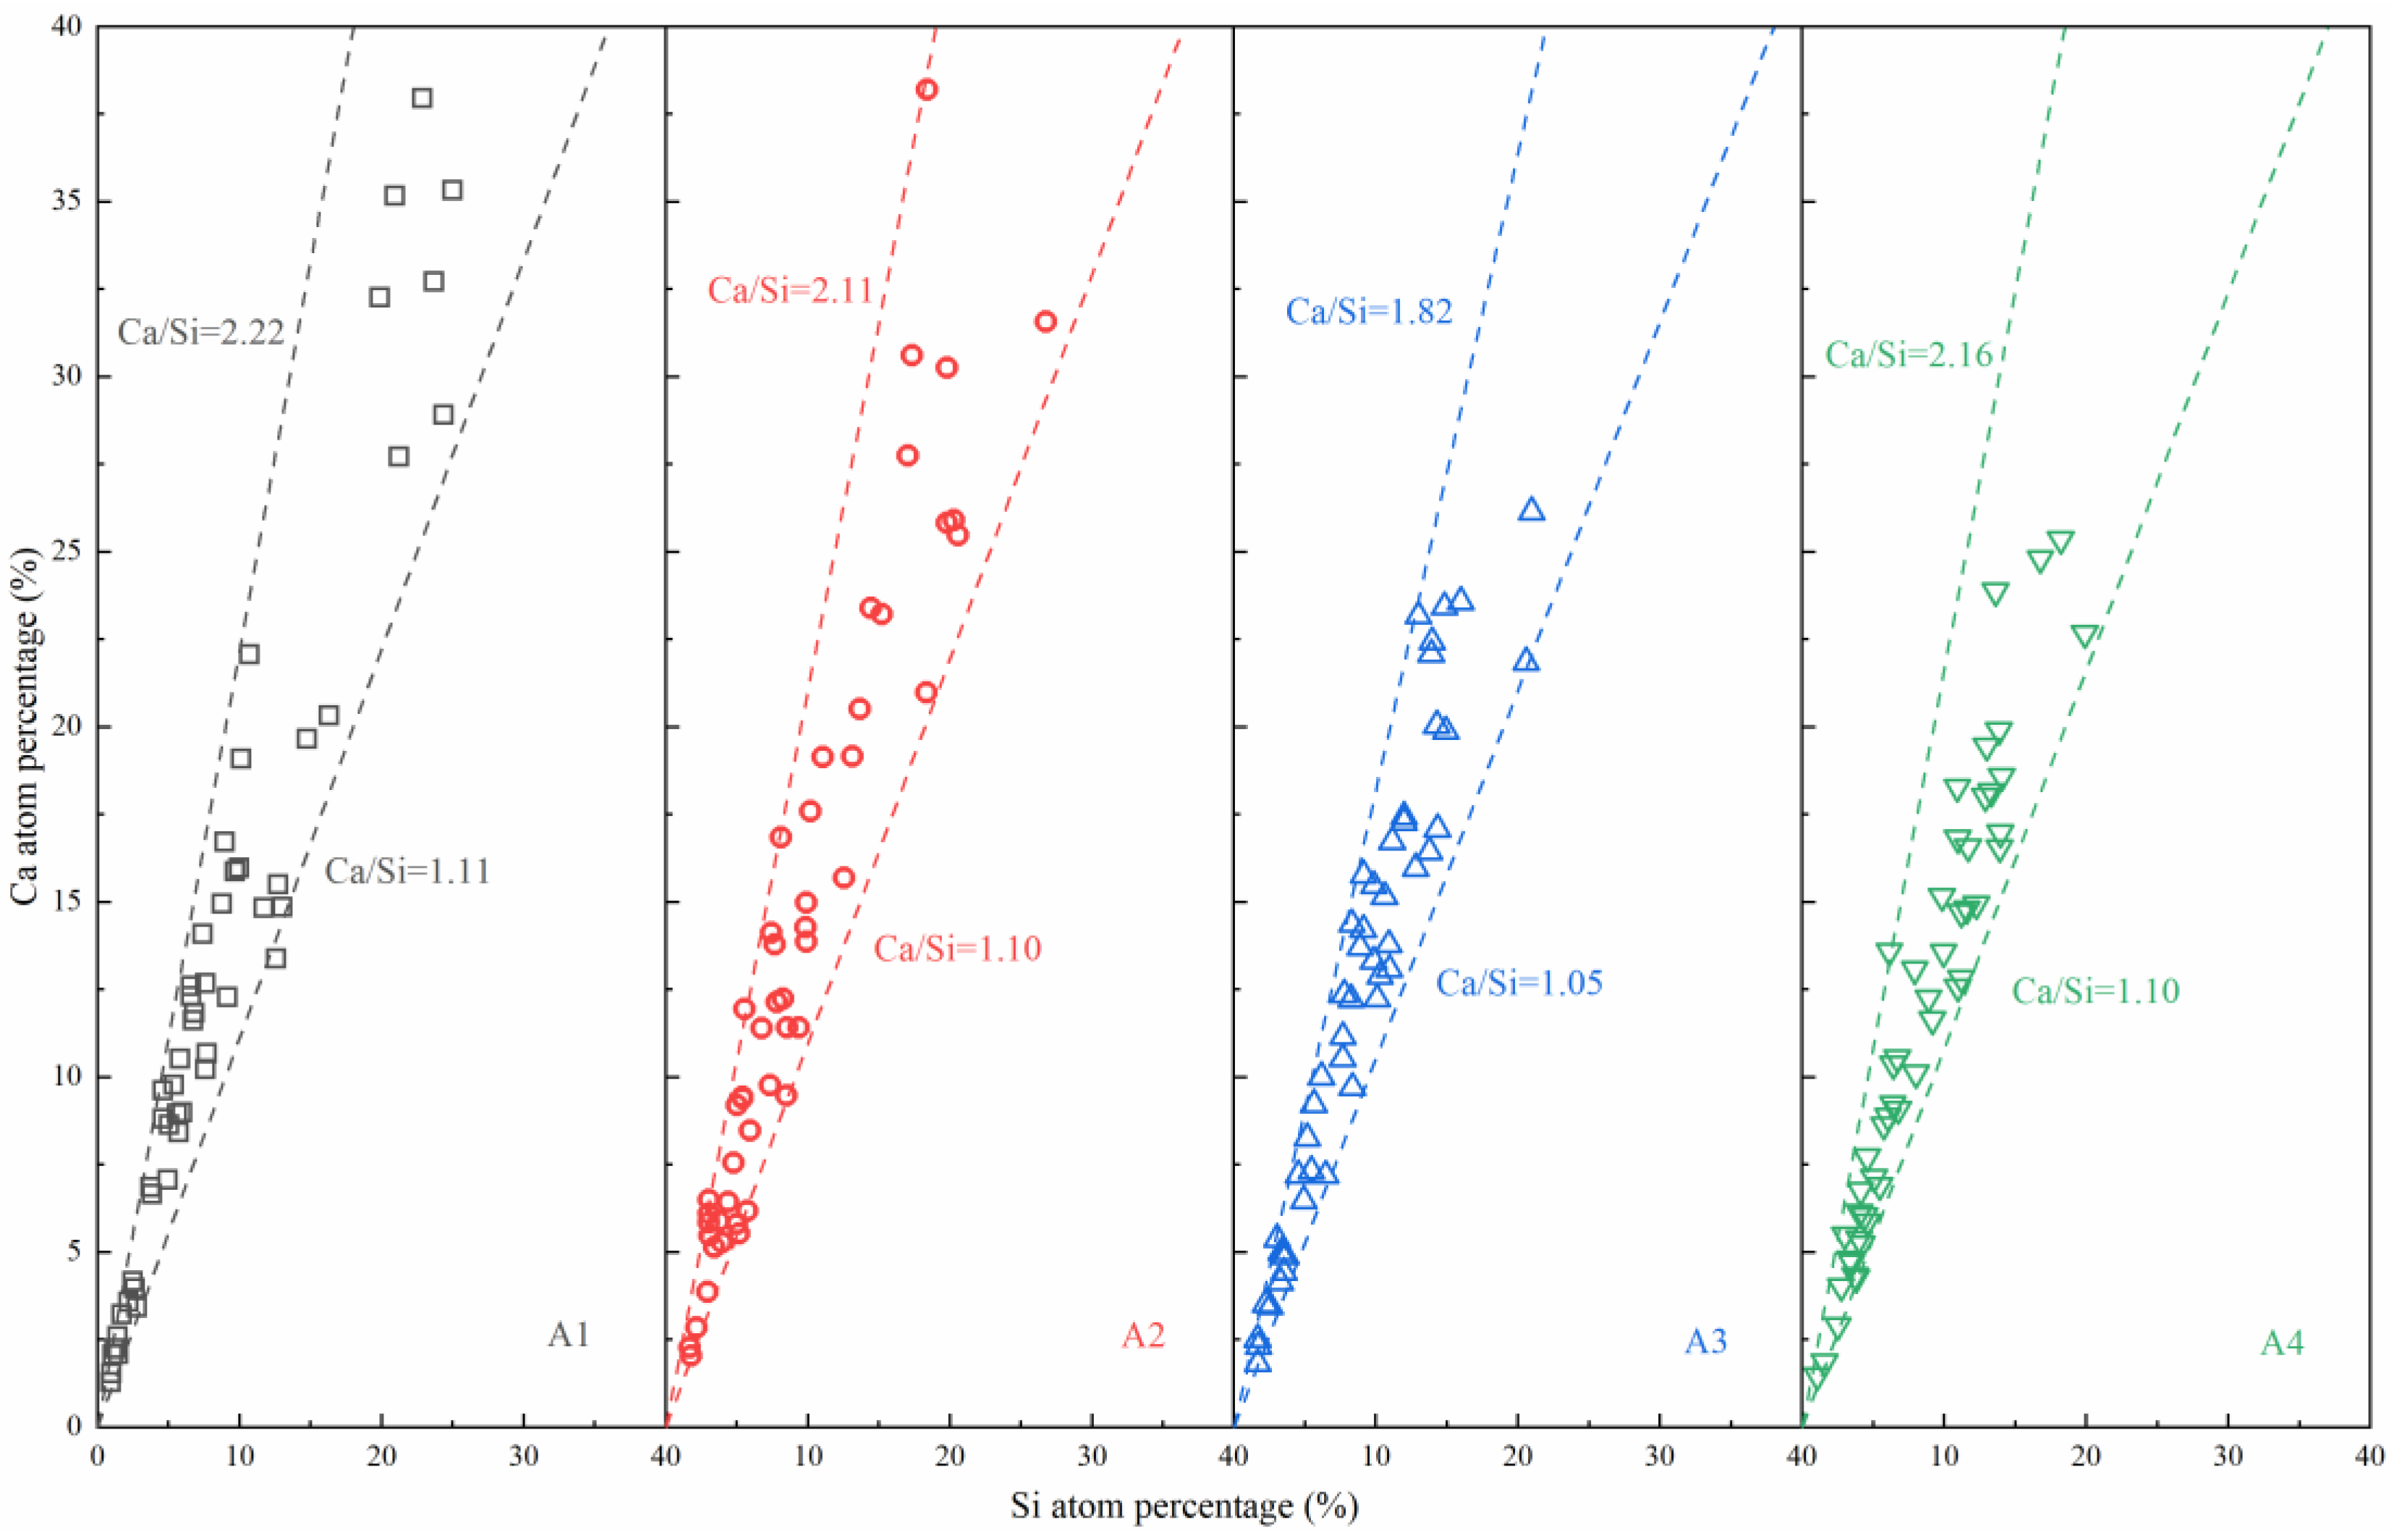
3.7. FE-SEM Analysis
4. Discussion
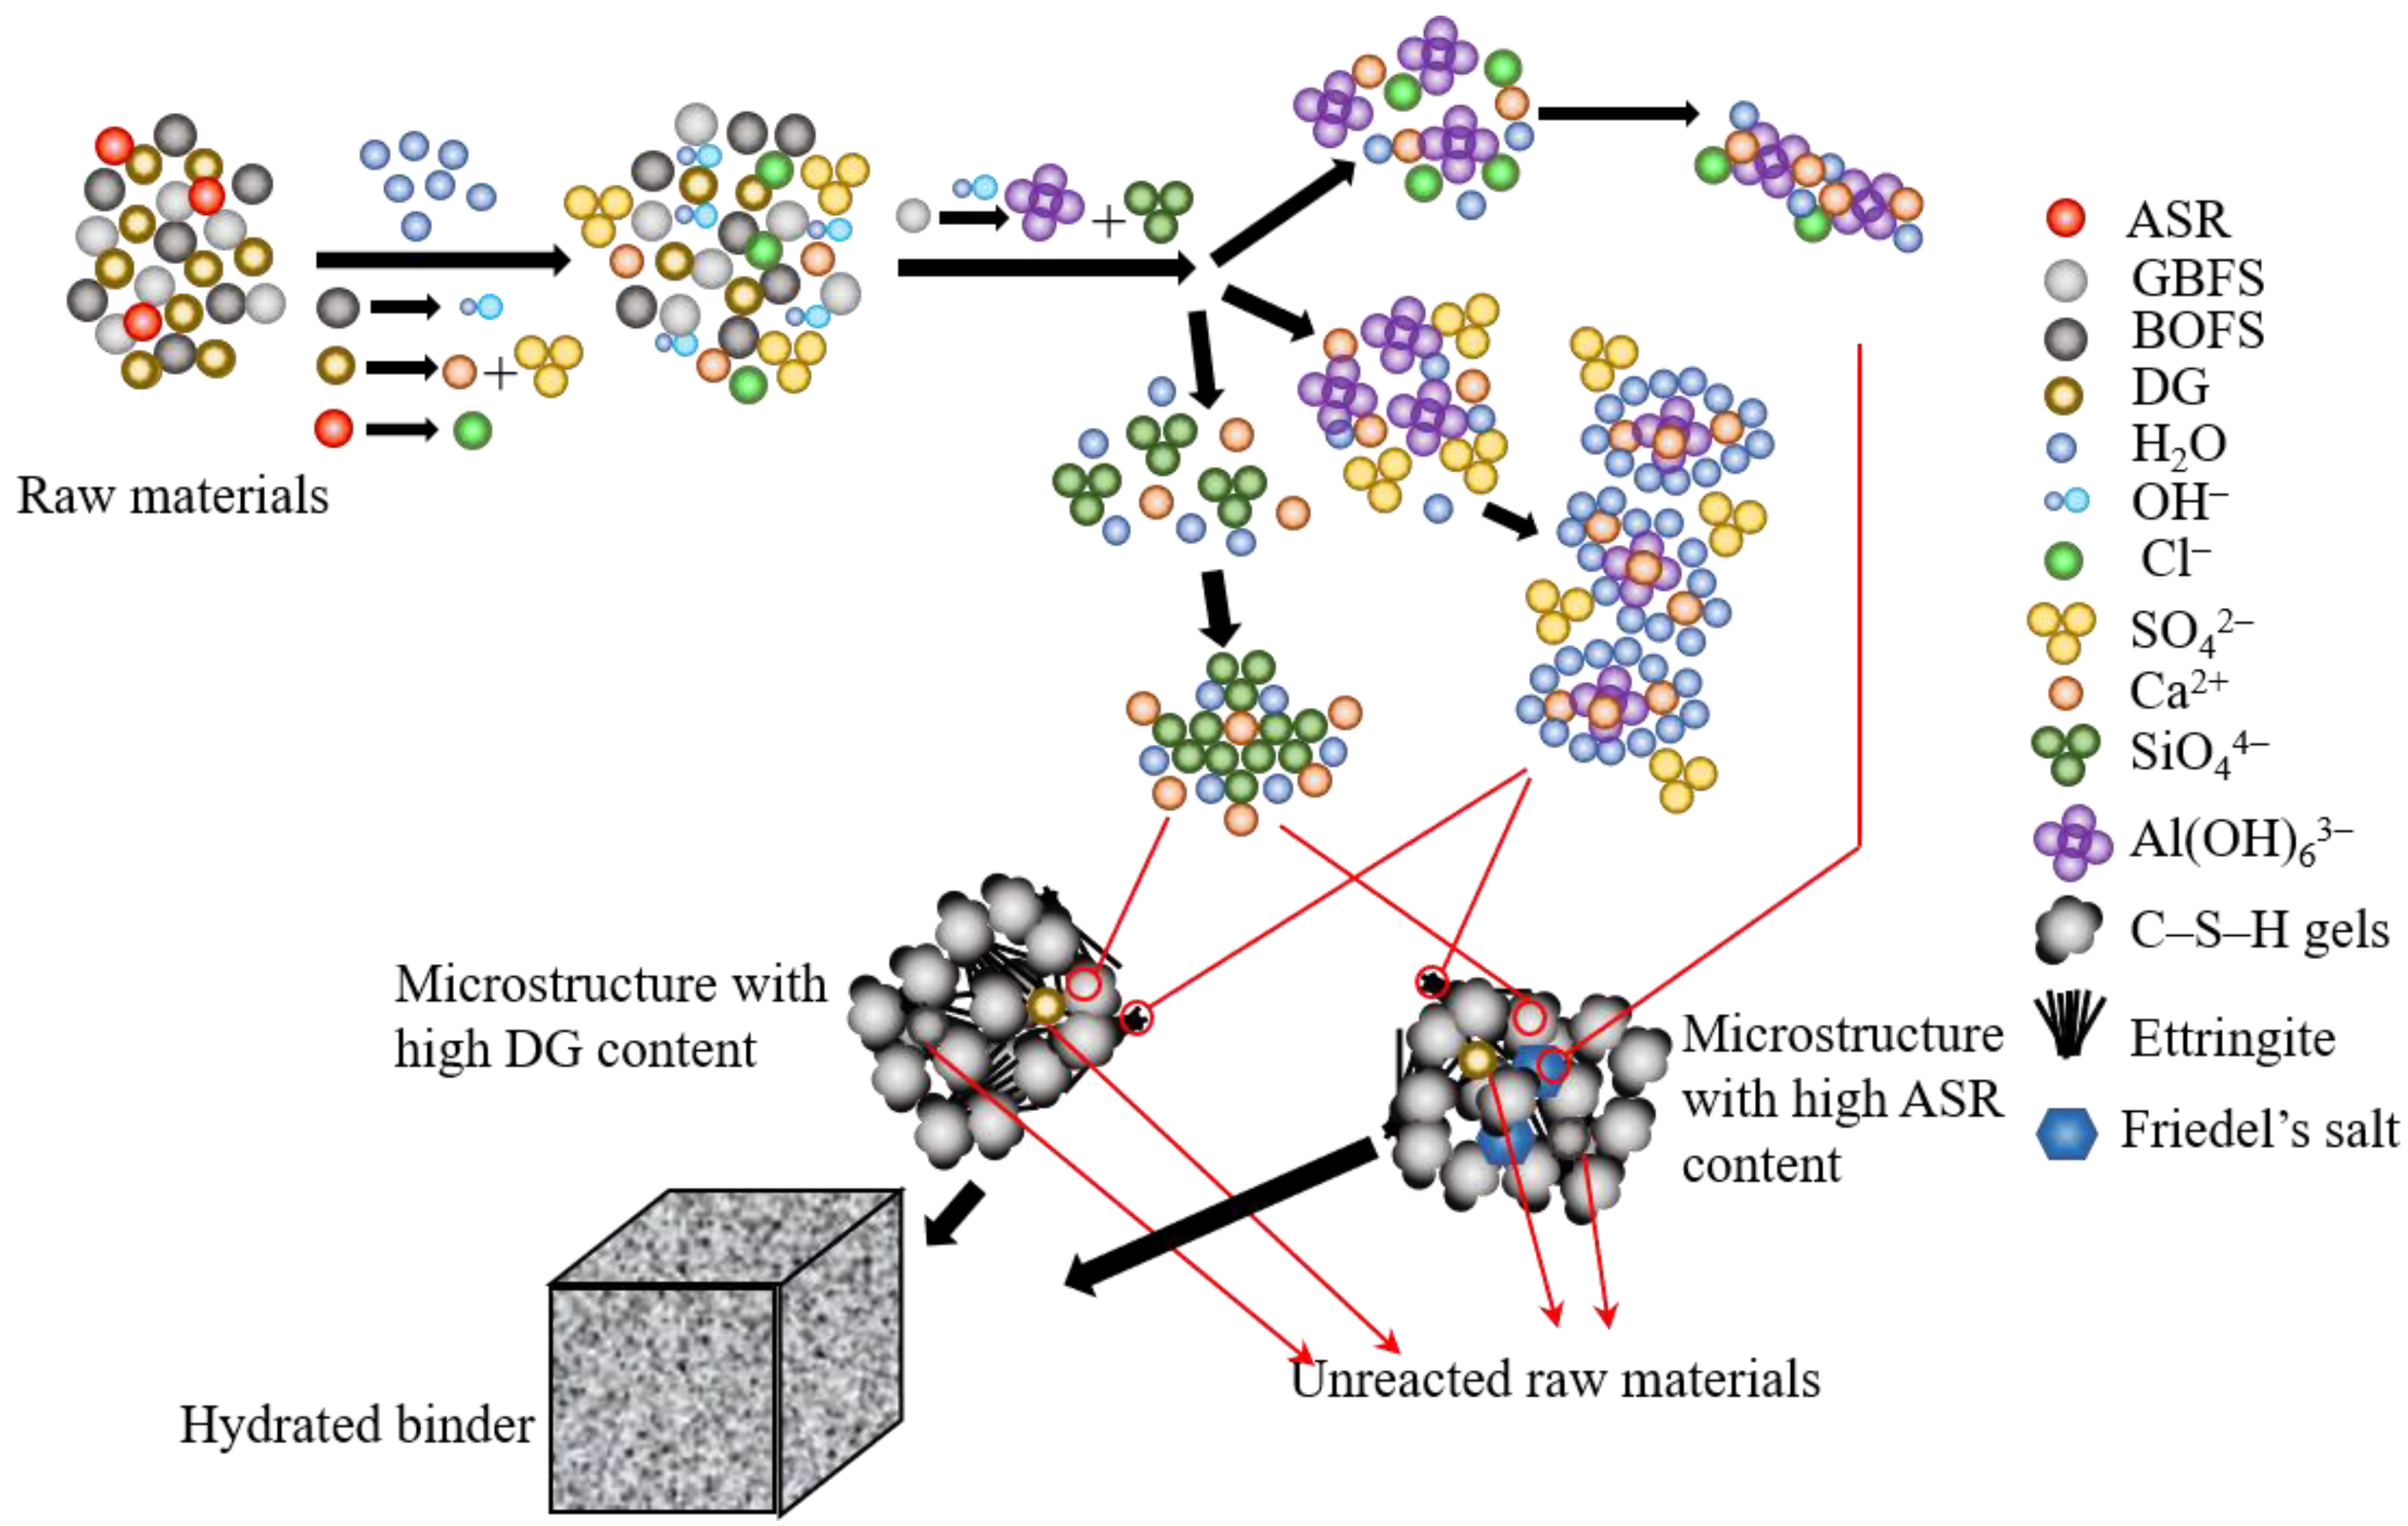
4.1. Influence of ASR Content on the Hydration Mechanism
4.2. Effect of ASR on Chloride Penetration of Concrete
4.3. Effect of ASR on the Strength Change of Concrete after Artificial Seawater Immersion
5. Conclusions
Author Contributions
Funding
Institutional Review Board Statement
Informed Consent Statement
Data Availability Statement
Acknowledgments
Conflicts of Interest
References
- National Output of Soda Ash and Ammonium Chloride. Soda Ind. 2020, 45. Available online: https://kns.cnki.net/kcms/detail/detail.aspx?dbcode=CJFD&dbname=CJFDLAST2020&filename=CJGY202004018&uniplatform=NZKPT&v=TmEW1MNvzwuokqXRTkU0qX01dJWaKkULWQg3bXmp5sKDFqiXIke4YzHdGQvRpIet (accessed on 9 September 2021). (In Chinese).
- Yang, J.; Xie, W.; Zhang, L.; He, C.; Bao, G. Study on Experimental Preparation of Cement Mortar Incorporating Fly Ash-soda Residue. Bull. Chinese Ceram. Soc. 2010, 29, 1211–1216. [Google Scholar]
- Obrenović, M.Č.; Iličković, Z.; Andrejaš, F. Utilization of Soda Ash Plant Solid Wastes in Production of Geopolymers. Int. J. Eng. Innov. Res. 2017, 6, 273–277. [Google Scholar]
- Ucal, G.O.; Mahyar, M.; Tokyay, M. Hydration of alinite cement produced from soda waste sludge. Constr. Build. Mater. 2018, 164, 178–184. [Google Scholar] [CrossRef]
- Lin, Y.; Xu, D.; Zhao, X. Effect of soda residue addition and its chemical composition on physical properties and hydration products of soda residue-activatedslag cementitious materials. Materials 2020, 13, 1789. [Google Scholar] [CrossRef] [Green Version]
- Hao, C.; Meng, W.Q.; Li, H.Y. Project Description of Ecological Reconstruction of Soda Residue Dump in Tianjin, China. In Proceedings of the Conference on Environmental Pollution and Public Health, Wuhan, China, 13–15 November 2010; Volume 1–2, pp. 542–547. [Google Scholar]
- Wang, Z.; Lyu, X.; Yao, G.; Wu, P.; Wang, J.; Wei, J. Preparation of Ca–Si–Al–Mg porous ceramics by Co-operation of Ca&Mg-contained soda residue and altered rock gold tailings. J. Clean. Prod. 2020, 262, 121345. [Google Scholar] [CrossRef]
- Wang, B.M.; Wang, L.J.; Mohd Zain, M.F.; Lai, F.C. Development of soda residue concrete expansion agent. J. Wuhan Univ. Technol. Mater. Sci. Ed. 2003, 18, 79–82. [Google Scholar] [CrossRef]
- Song, R.; Zhao, Q.; Zhang, J.; Liu, J. Microstructure and Composition of Hardened Paste of Soda Residue-Slag-Cement Binding Material System. Front. Mater. 2019, 6, 211. [Google Scholar] [CrossRef]
- Luo, R.; Cai, Y.B.; Wang, C.Y.; Huang, X.M. Study of chloride binding and diffusion in GGBS concrete. Cem. Concr. Res. 2003, 33, 1–7. [Google Scholar] [CrossRef]
- Zhao, X.; Liu, C.; Wang, L.; Zuo, L.; Zhu, Q.; Ma, W. Physical and mechanical properties and micro characteristics of fly ash-based geopolymers incorporating soda residue. Cem. Concr. Compos. 2019, 98, 125–136. [Google Scholar] [CrossRef]
- Xu, C.; Ni, W.; Li, K.; Zhang, S.; Li, Y.; Xu, D. Hydration mechanism and orthogonal optimisation of mix proportion for steel slag–slag-based clinker-free prefabricated concrete. Constr. Build. Mater. 2019, 228, 117036. [Google Scholar] [CrossRef]
- Xu, C.; Ni, W.; Li, K.; Zhang, S.; Xu, D. Activation mechanisms of three types of industrial by-product gypsums on steel slag–granulated blast furnace slag-based binders. Constr. Build. Mater. 2021, 288, 123111. [Google Scholar] [CrossRef]
- Pal, S.C.; Mukherjee, A.; Pathak, S.R. Investigation of hydraulic activity of ground granulated blast furnace slag in concrete. Cem. Concr. Res. 2003, 33, 1481–1486. [Google Scholar] [CrossRef]
- Bellmann, F.; Stark, J. Activation of blast furnace slag by a new method. Cem. Concr. Res. 2009, 39, 644–650. [Google Scholar] [CrossRef]
- Xu, D.; Ni, W.; Wang, Q.; Xu, C.; Li, K. Ammonia-soda residue and metallurgical slags from iron and steel industries as cementitious materials for clinker-free concretes. J. Clean. Prod. 2021, 307, 127262. [Google Scholar] [CrossRef]
- Dhir, R.K.; El-Mohy, M.A.K.; Dyer, T.D. Chloride Binding in GBBS Concrete. Cem. Concr. Res. 1996, 26, 1767–1773. [Google Scholar] [CrossRef]
- Cheng, A.; Huang, R.; Wu, J.-K.; Chen, C.-H. Influence of GGBS on durability and corrosion behavior of reinforced concrete. Mater. Chem. Phys. 2005, 93, 404–411. [Google Scholar] [CrossRef]
- Sato, T.; Beaudoin, J.J. Effect of nano-CaCO3 on hydration of cement containing supplementary cementitious materials. Adv. Cem. Res. 2011, 23, 33–43. [Google Scholar] [CrossRef] [Green Version]
- Tzouvalas, G.; Dermatas, N.; Tsimas, S. Alternative calcium sulfate-bearing materials as cement retarders: Part I. Anhydrite. Cem. Concr. Res. 2004, 34, 2113–2118. [Google Scholar] [CrossRef]
- China State Bureau of Technical Supervision. GB/T 50081-2002. Standard for Test Method of Mechanical Properties on Ordinary Concrete; China State Bureau of Technical Supervision: Beijing, China, 2002; p. 60.
- China State Bureau of Technical Supervision. GB/T 50082-2009. Standard for Test Methods of Long Term Performance and Durability of Ordinary Concrete; China State Bureau of Technical Supervision: Beijing, China, 2009; pp. 39–43.
- ASTM Interational. ASTM C1556. Determining the Apparent Chloride Diffusion Coefficient of Cementitious Mixtures by Bulk Diffusion; ASTM International: West Conshohocken, PA, USA, 2011; pp. 1–7. [Google Scholar]
- De Weerdt, K.; Justnes, H. The effect of sea water on the phase assemblage of hydrated cement paste. Cem. Concr. Compos. 2015, 55, 215–222. [Google Scholar] [CrossRef]
- Choudhary, H.K.; Anupama, A.V.; Kumar, R.; Panzi, M.E.; Matteppanavar, S.; Sherikar, B.N.; Sahoo, B. Observation of phase transformations in cement during hydration. Constr. Build. Mater. 2015, 101, 122–129. [Google Scholar] [CrossRef]
- Zhu, W.; Chen, X.; Struble, L.J.; Yang, E.H. Characterization of calcium-containing phases in alkali-activated municipal solid waste incineration bottom ash binder through chemical extraction and deconvoluted Fourier transform infrared spectra. J. Clean. Prod. 2018, 192, 782–789. [Google Scholar] [CrossRef]
- Wang, S.; Peng, X.; Tang, L.; Zeng, L.; Lan, C. Influence of inorganic admixtures on the 11 Å-tobermorite formation prepared from steel slags: XRD and FTIR analysis. Constr. Build. Mater. 2014, 60, 42–47. [Google Scholar] [CrossRef]
- Wu, M.; Zhang, Y.; Jia, Y.; She, W.; Liu, G.; Yang, Z.; Zhang, Y.; Zhang, W.; Sun, W. Effects of sodium sulfate on the hydration and properties of lime-based low carbon cementitious materials. J. Clean. Prod. 2019, 220, 677–687. [Google Scholar] [CrossRef]
- Criado, M.; Fernández-Jiménez, A.; Palomo, A. Alkali activation of fly ash: Effect of the SiO2/Na2O ratio. Part I: FTIR study. Microporous Mesoporous Mater. 2007, 106, 180–191. [Google Scholar] [CrossRef]
- Hajimohammadi, A.; Ngo, T.; Vongsvivut, J. Interfacial chemistry of a fly ash geopolymer and aggregates. J. Clean. Prod. 2019, 231, 980–989. [Google Scholar] [CrossRef]
- Shi, C.; Roy, D.; Krivenko, P. Alkali-Activated Cements and Concretes, 1st ed.; CRC Press: London, UK, 2003; ISBN 0419245502. [Google Scholar]
- Zeng, Q.; Chen, S.; Yang, P.; Peng, Y.; Wang, J.; Zhou, C.; Wang, Z.; Yan, D. Reassessment of mercury intrusion porosimetry for characterizing the pore structure of cement-based porous materials by monitoring the mercury entrapments with X-ray computed tomography. Cem. Concr. Compos. 2020, 113, 103726. [Google Scholar] [CrossRef]
- Sun, M.; Zou, C.; Xin, D. Pore structure evolution mechanism of cement mortar containing diatomite subjected to freeze-thaw cycles by multifractal analysis. Cem. Concr. Compos. 2020, 114, 103731. [Google Scholar] [CrossRef]
- Pelisser, F.; Gleize, P.J.P.; Mikowski, A. Effect of the Ca/Si molar ratio on the micro/nanomechanical properties of synthetic C-S-H measured by nanoindentation. J. Phys. Chem. C 2012, 116, 17219–17227. [Google Scholar] [CrossRef]
- Fan, D.; Yang, S. Mechanical properties of C-S-H globules and interfaces by molecular dynamics simulation. Constr. Build. Mater. 2018, 176, 573–582. [Google Scholar] [CrossRef] [Green Version]
- Li, Y.; Qiao, C.; Ni, W. Green concrete with ground granulated blast-furnace slag activated by desulfurization gypsum and electric arc furnace reducing slag. J. Clean. Prod. 2020, 269, 122212. [Google Scholar] [CrossRef]
- Bullard, J.W.; Jennings, H.M.; Livingston, R.A.; Nonat, A.; Scherer, G.W.; Schweitzer, J.S.; Scrivener, K.L.; Thomas, J.J. Mechanisms of cement hydration. Cem. Concr. Res. 2011, 41, 1208–1223. [Google Scholar] [CrossRef]
- Quennoz, A.; Scrivener, K.L. Interactions between alite and C3A-gypsum hydrations in model cements. Cem. Concr. Res. 2013, 44, 46–54. [Google Scholar] [CrossRef]
- Shi, Z.; Geiker, M.R.; Lothenbach, B.; De Weerdt, K.; Garzón, S.F.; Enemark-Rasmussen, K.; Skibsted, J. Friedel’s salt profiles from thermogravimetric analysis and thermodynamic modelling of Portland cement-based mortars exposed to sodium chloride solution. Cem. Concr. Compos. 2017, 78, 73–83. [Google Scholar] [CrossRef]
- Loser, R.; Lothenbach, B.; Leemann, A.; Tuchschmid, M. Chloride resistance of concrete and its binding capacity—Comparison between experimental results and thermodynamic modeling. Cem. Concr. Compos. 2010, 32, 34–42. [Google Scholar] [CrossRef]
- Sun, G.; Zhang, Y.; Sun, W.; Liu, Z.; Wang, C. Multi-scale prediction of the effective chloride diffusion coefficient of concrete. Constr. Build. Mater. 2011, 25, 3820–3831. [Google Scholar] [CrossRef]
- Qiao, C.; Suraneni, P.; Weiss, J. Damage in cement pastes exposed to NaCl solutions. Constr. Build. Mater. 2018, 171, 120–127. [Google Scholar] [CrossRef]


| GBFS | BOFS | DG | ASR | |
|---|---|---|---|---|
| Chemical composition (%) | - | - | - | - |
| SiO2 | 35.03 | 14.17 | 1.58 | 12.99 |
| Al2O3 | 15.73 | 4.30 | 0.53 | 3.25 |
| Fe2O3 | 1.07 | 26.32 | 0.38 | 1.17 |
| CaO | 36.61 | 39.96 | 39.15 | 44.92 |
| MgO | 8.59 | 8.22 | 0.32 | 7.96 |
| SO3 | 0.09 | 0.18 | 36.22 | 5.67 |
| K2O | 0.01 | 0.01 | - | 0.38 |
| Na2O | 0.30 | 0.07 | - | 4.20 |
| P2O5 | - | 1.29 | - | - |
| Cl− | - | - | - | 19.11 |
| The specific surface area (m2/kg) | 560 | 450 | 420 | - |
| Group | Cementitious Materials | Aggregates | Water | Plasticizer | ||||
|---|---|---|---|---|---|---|---|---|
| GBFS | BOFS | DG | ASR | Fine | Course | |||
| A1 | 320 | 80 | 75 | 25 | 880 | 880 | 140 | 1.92 |
| A2 | 320 | 80 | 60 | 40 | 880 | 880 | 140 | 1.92 |
| A3 | 320 | 80 | 50 | 50 | 880 | 880 | 140 | 1.92 |
| A4 | 320 | 80 | 40 | 60 | 880 | 880 | 140 | 1.92 |
| Compound | NaCl | MgCl2 | CaCl2 | Na2SO4 | NaHCO3 | KCl |
|---|---|---|---|---|---|---|
| Concentration | 122.65 | 26.00 | 5.80 | 20.45 | 1.01 | 3.48 |
| Group | ASR-to-DG Ratio | Porosity (%) |
|---|---|---|
| A1 | 1:3 | 21.34 |
| A2 | 2:3 | 21.06 |
| A3 | 3:3 | 22.03 |
| A4 | 3:2 | 22.75 |
Publisher’s Note: MDPI stays neutral with regard to jurisdictional claims in published maps and institutional affiliations. |
© 2021 by the authors. Licensee MDPI, Basel, Switzerland. This article is an open access article distributed under the terms and conditions of the Creative Commons Attribution (CC BY) license (https://creativecommons.org/licenses/by/4.0/).
Share and Cite
Xu, C.; Ni, W.; Li, K. Effect of Ammonia-Soda Residue on the Strength and Chloride-Resistance Performance of Steel Slag-Granulated Blast Furnace Slag-Based Concrete after Immersion in Artificial Seawater. Materials 2021, 14, 6048. https://doi.org/10.3390/ma14206048
Xu C, Ni W, Li K. Effect of Ammonia-Soda Residue on the Strength and Chloride-Resistance Performance of Steel Slag-Granulated Blast Furnace Slag-Based Concrete after Immersion in Artificial Seawater. Materials. 2021; 14(20):6048. https://doi.org/10.3390/ma14206048
Chicago/Turabian StyleXu, Chengwen, Wen Ni, and Keqing Li. 2021. "Effect of Ammonia-Soda Residue on the Strength and Chloride-Resistance Performance of Steel Slag-Granulated Blast Furnace Slag-Based Concrete after Immersion in Artificial Seawater" Materials 14, no. 20: 6048. https://doi.org/10.3390/ma14206048
APA StyleXu, C., Ni, W., & Li, K. (2021). Effect of Ammonia-Soda Residue on the Strength and Chloride-Resistance Performance of Steel Slag-Granulated Blast Furnace Slag-Based Concrete after Immersion in Artificial Seawater. Materials, 14(20), 6048. https://doi.org/10.3390/ma14206048