
High-Fluidization, Early Strength Cement Grouting Material Enhanced by Nano-SiO2: Formula and Mechanisms

Abstract
:1. Introduction
2. Materials and Methods
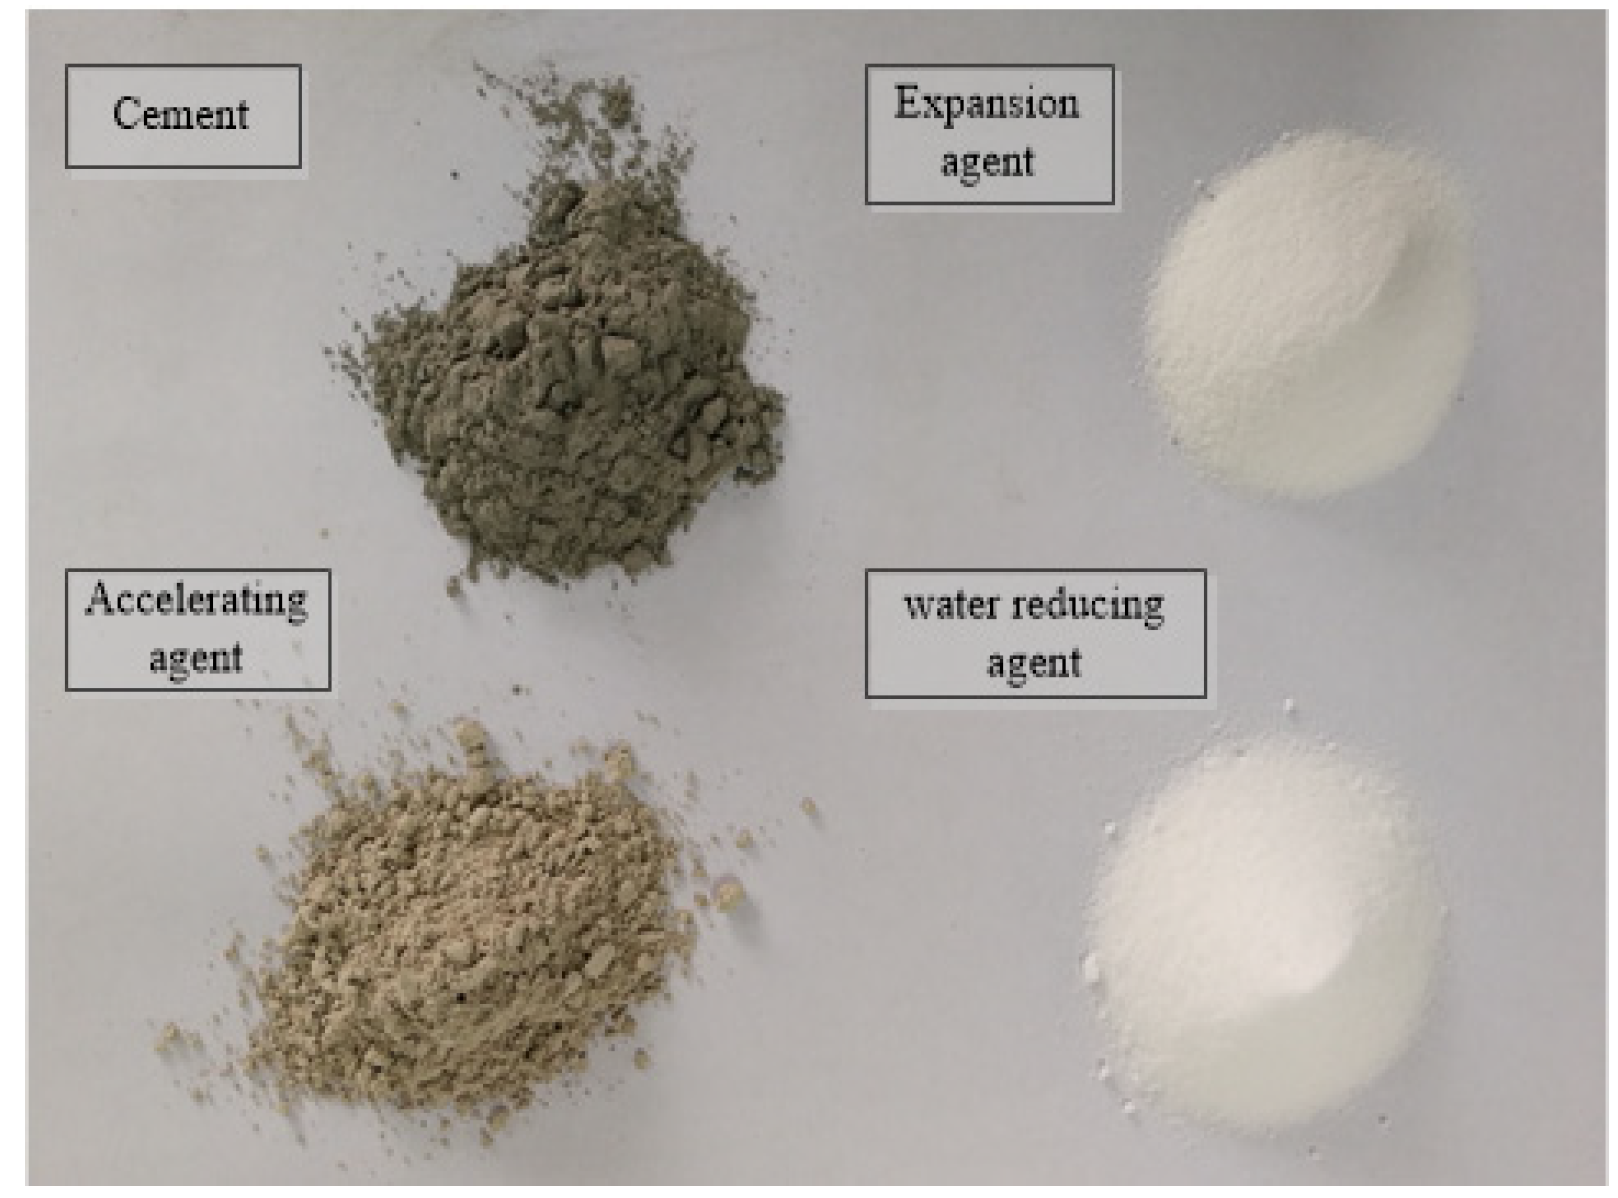
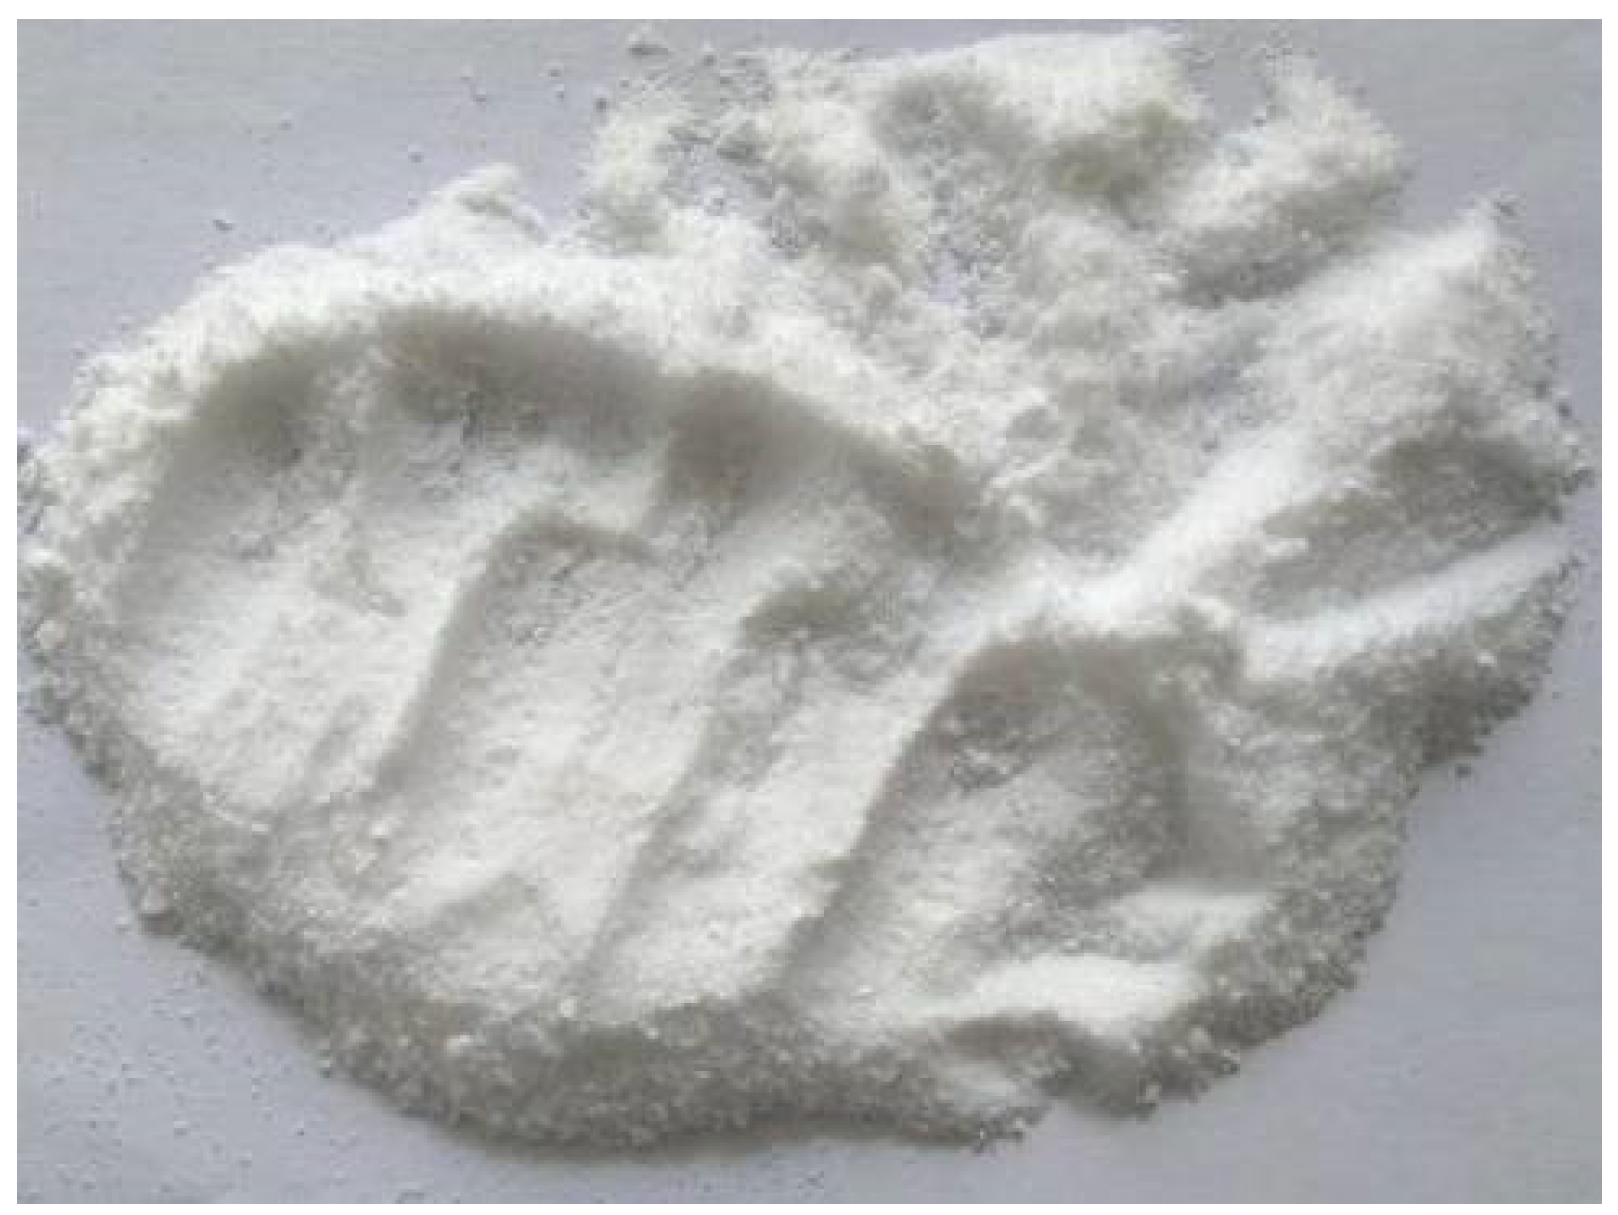
2.1. Materials
2.2. Methods
- According to the standard method [34], the beam samples with a size of 4 cm × 4 cm × 16 cm are prepared by curing the target age (1 day, 3 days, or 7 days).
- The sheet samples with a size of 2 cm × 2 cm × 1 cm are prepared by cutting the beam samples, and are put into absolute ethyl alcohol for seven days (the absolute ethyl alcohol must be replaced everyday).
- The treated sheet samples are prepared to cubic blocks with an approximate size of 1 cm × 1 cm × 1 cm after drying at 40 °C for 24 h.
- The SEM samples can be obtained via drying the cubic blocks at 40 °C for 48 h.
- The XRD, DSC, and FTIR samples can be obtained via drying the powder-grinded cubic blocks at 40 °C for 48 h. It should be noted that the powder must be passed through 80 μm, 150 μm, and 80 μm square sieves for the XRD, DSC, and FTIR tests, respectively.
3. Optimal Formula of High-Fluidization, Early Strength Cement Grouting Materials
3.1. Design of the Orthogonal Experiments
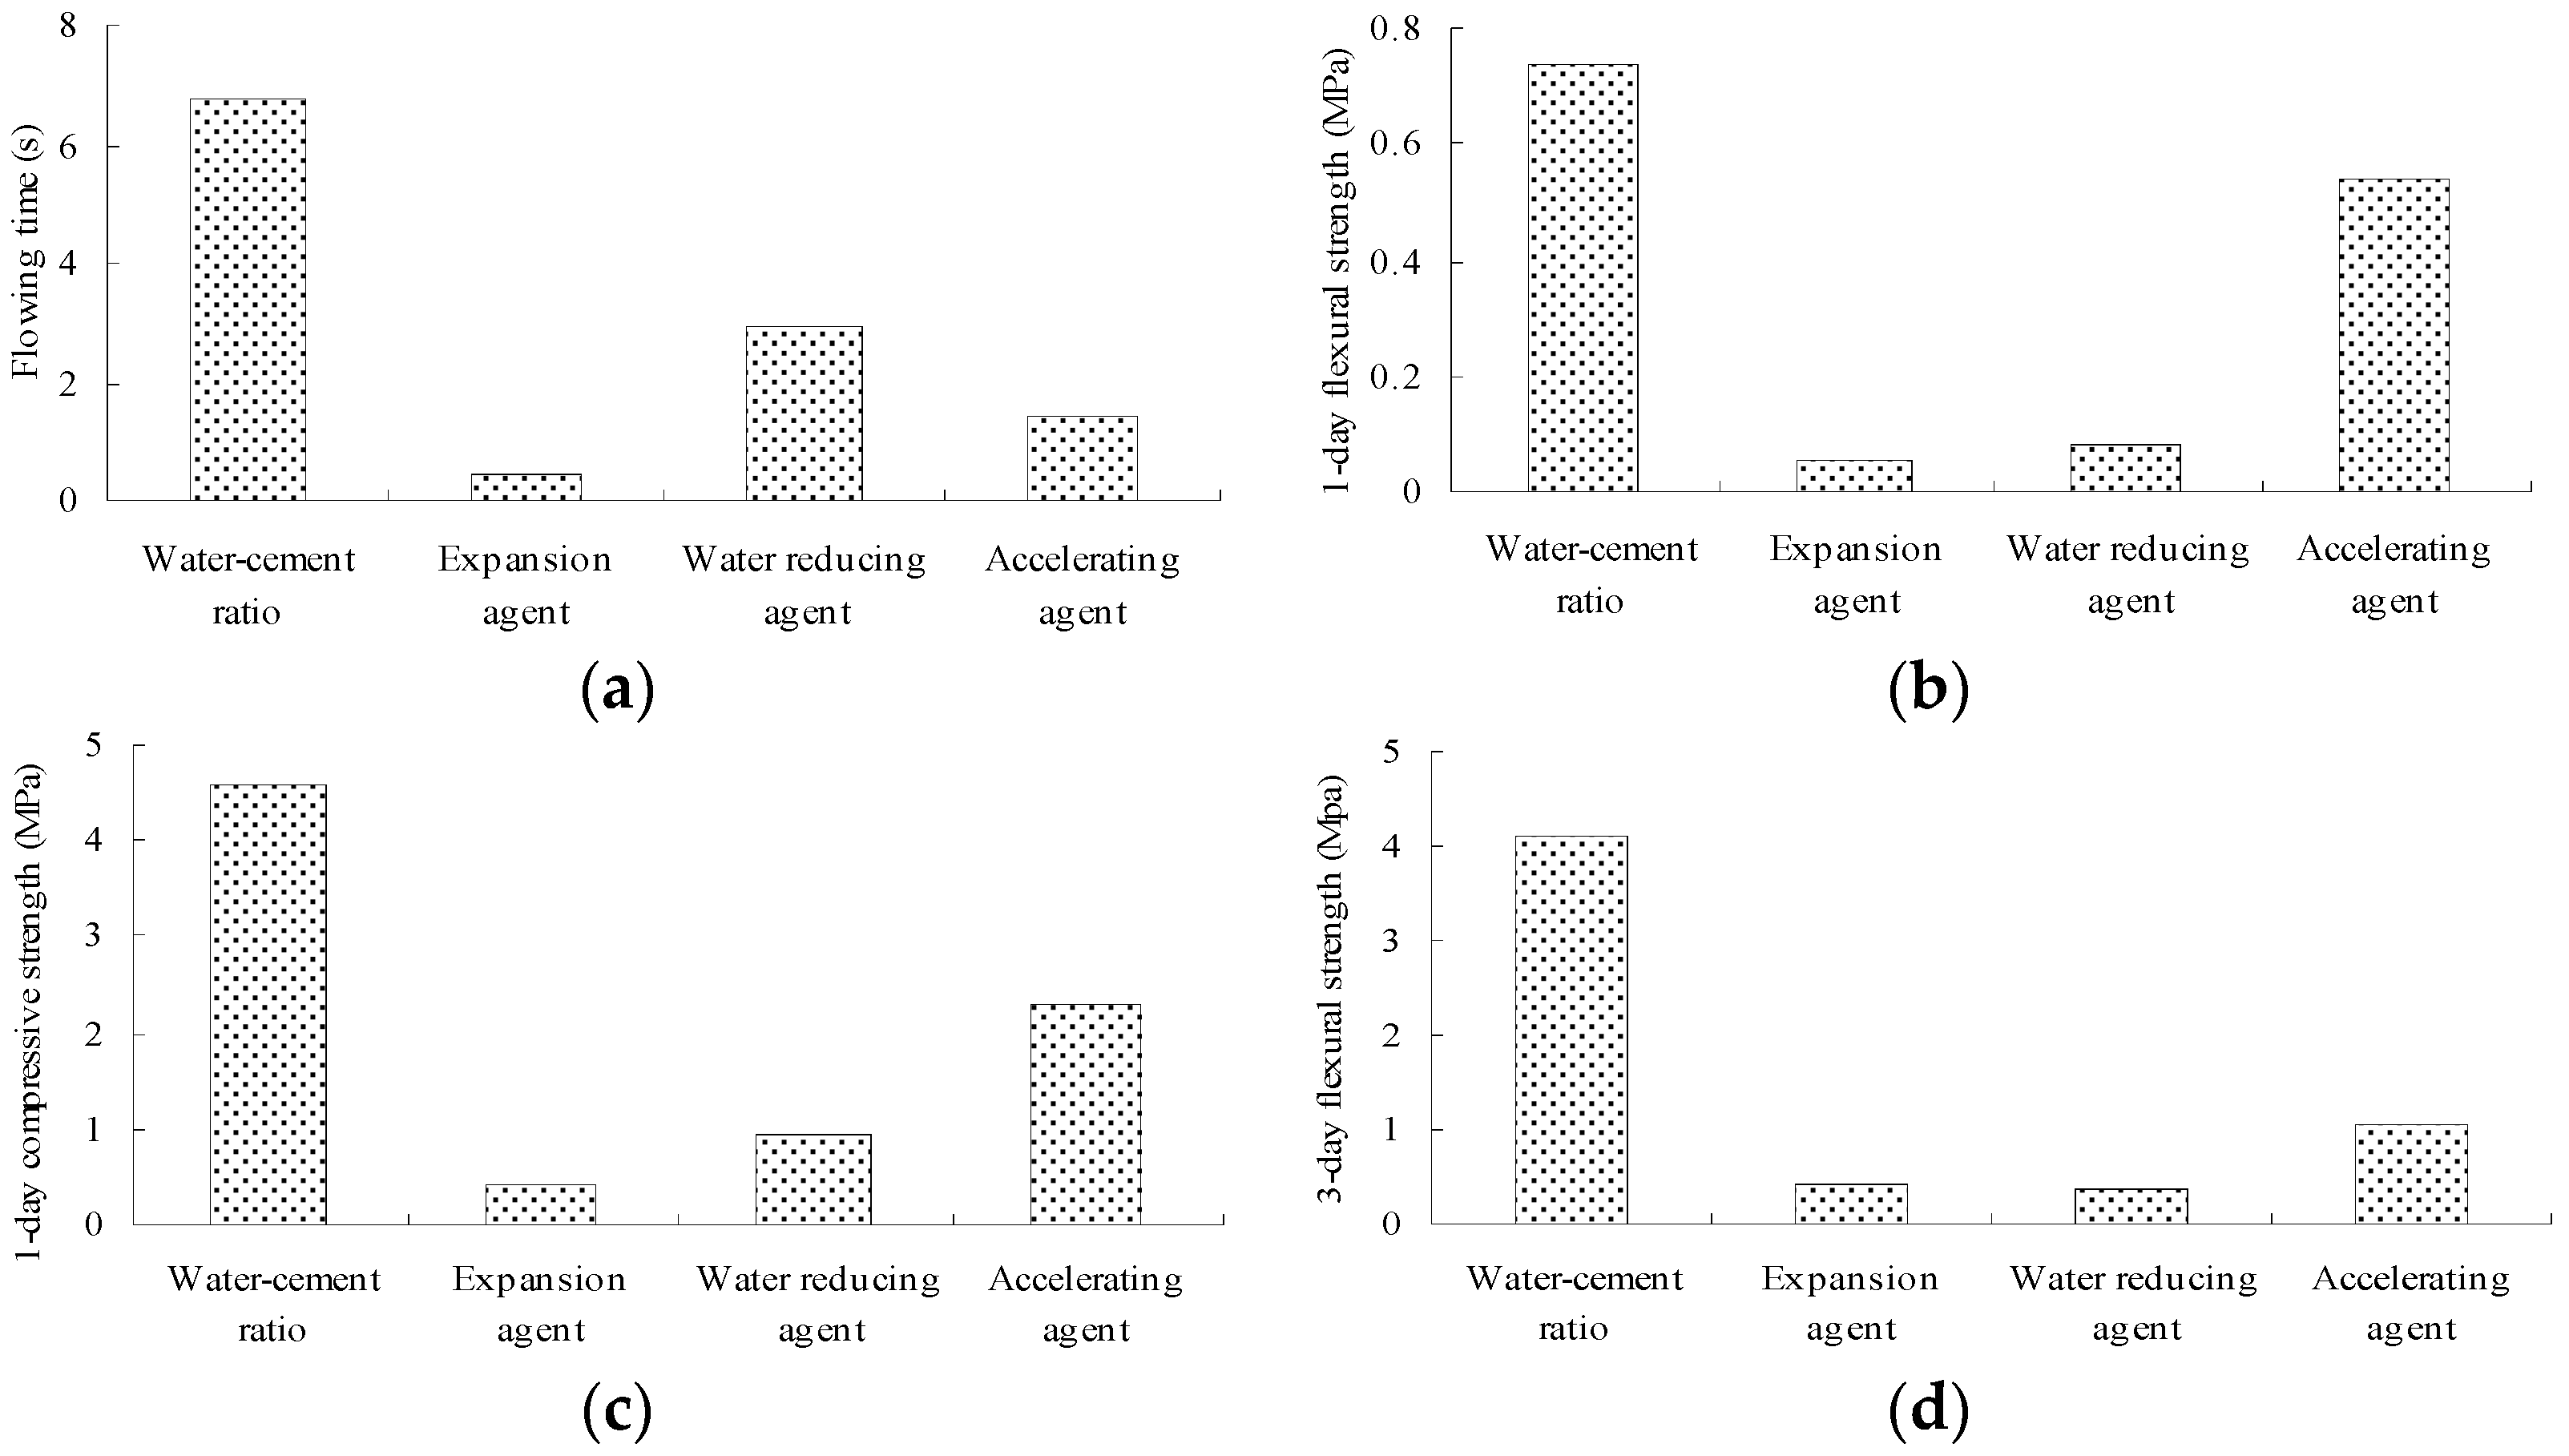
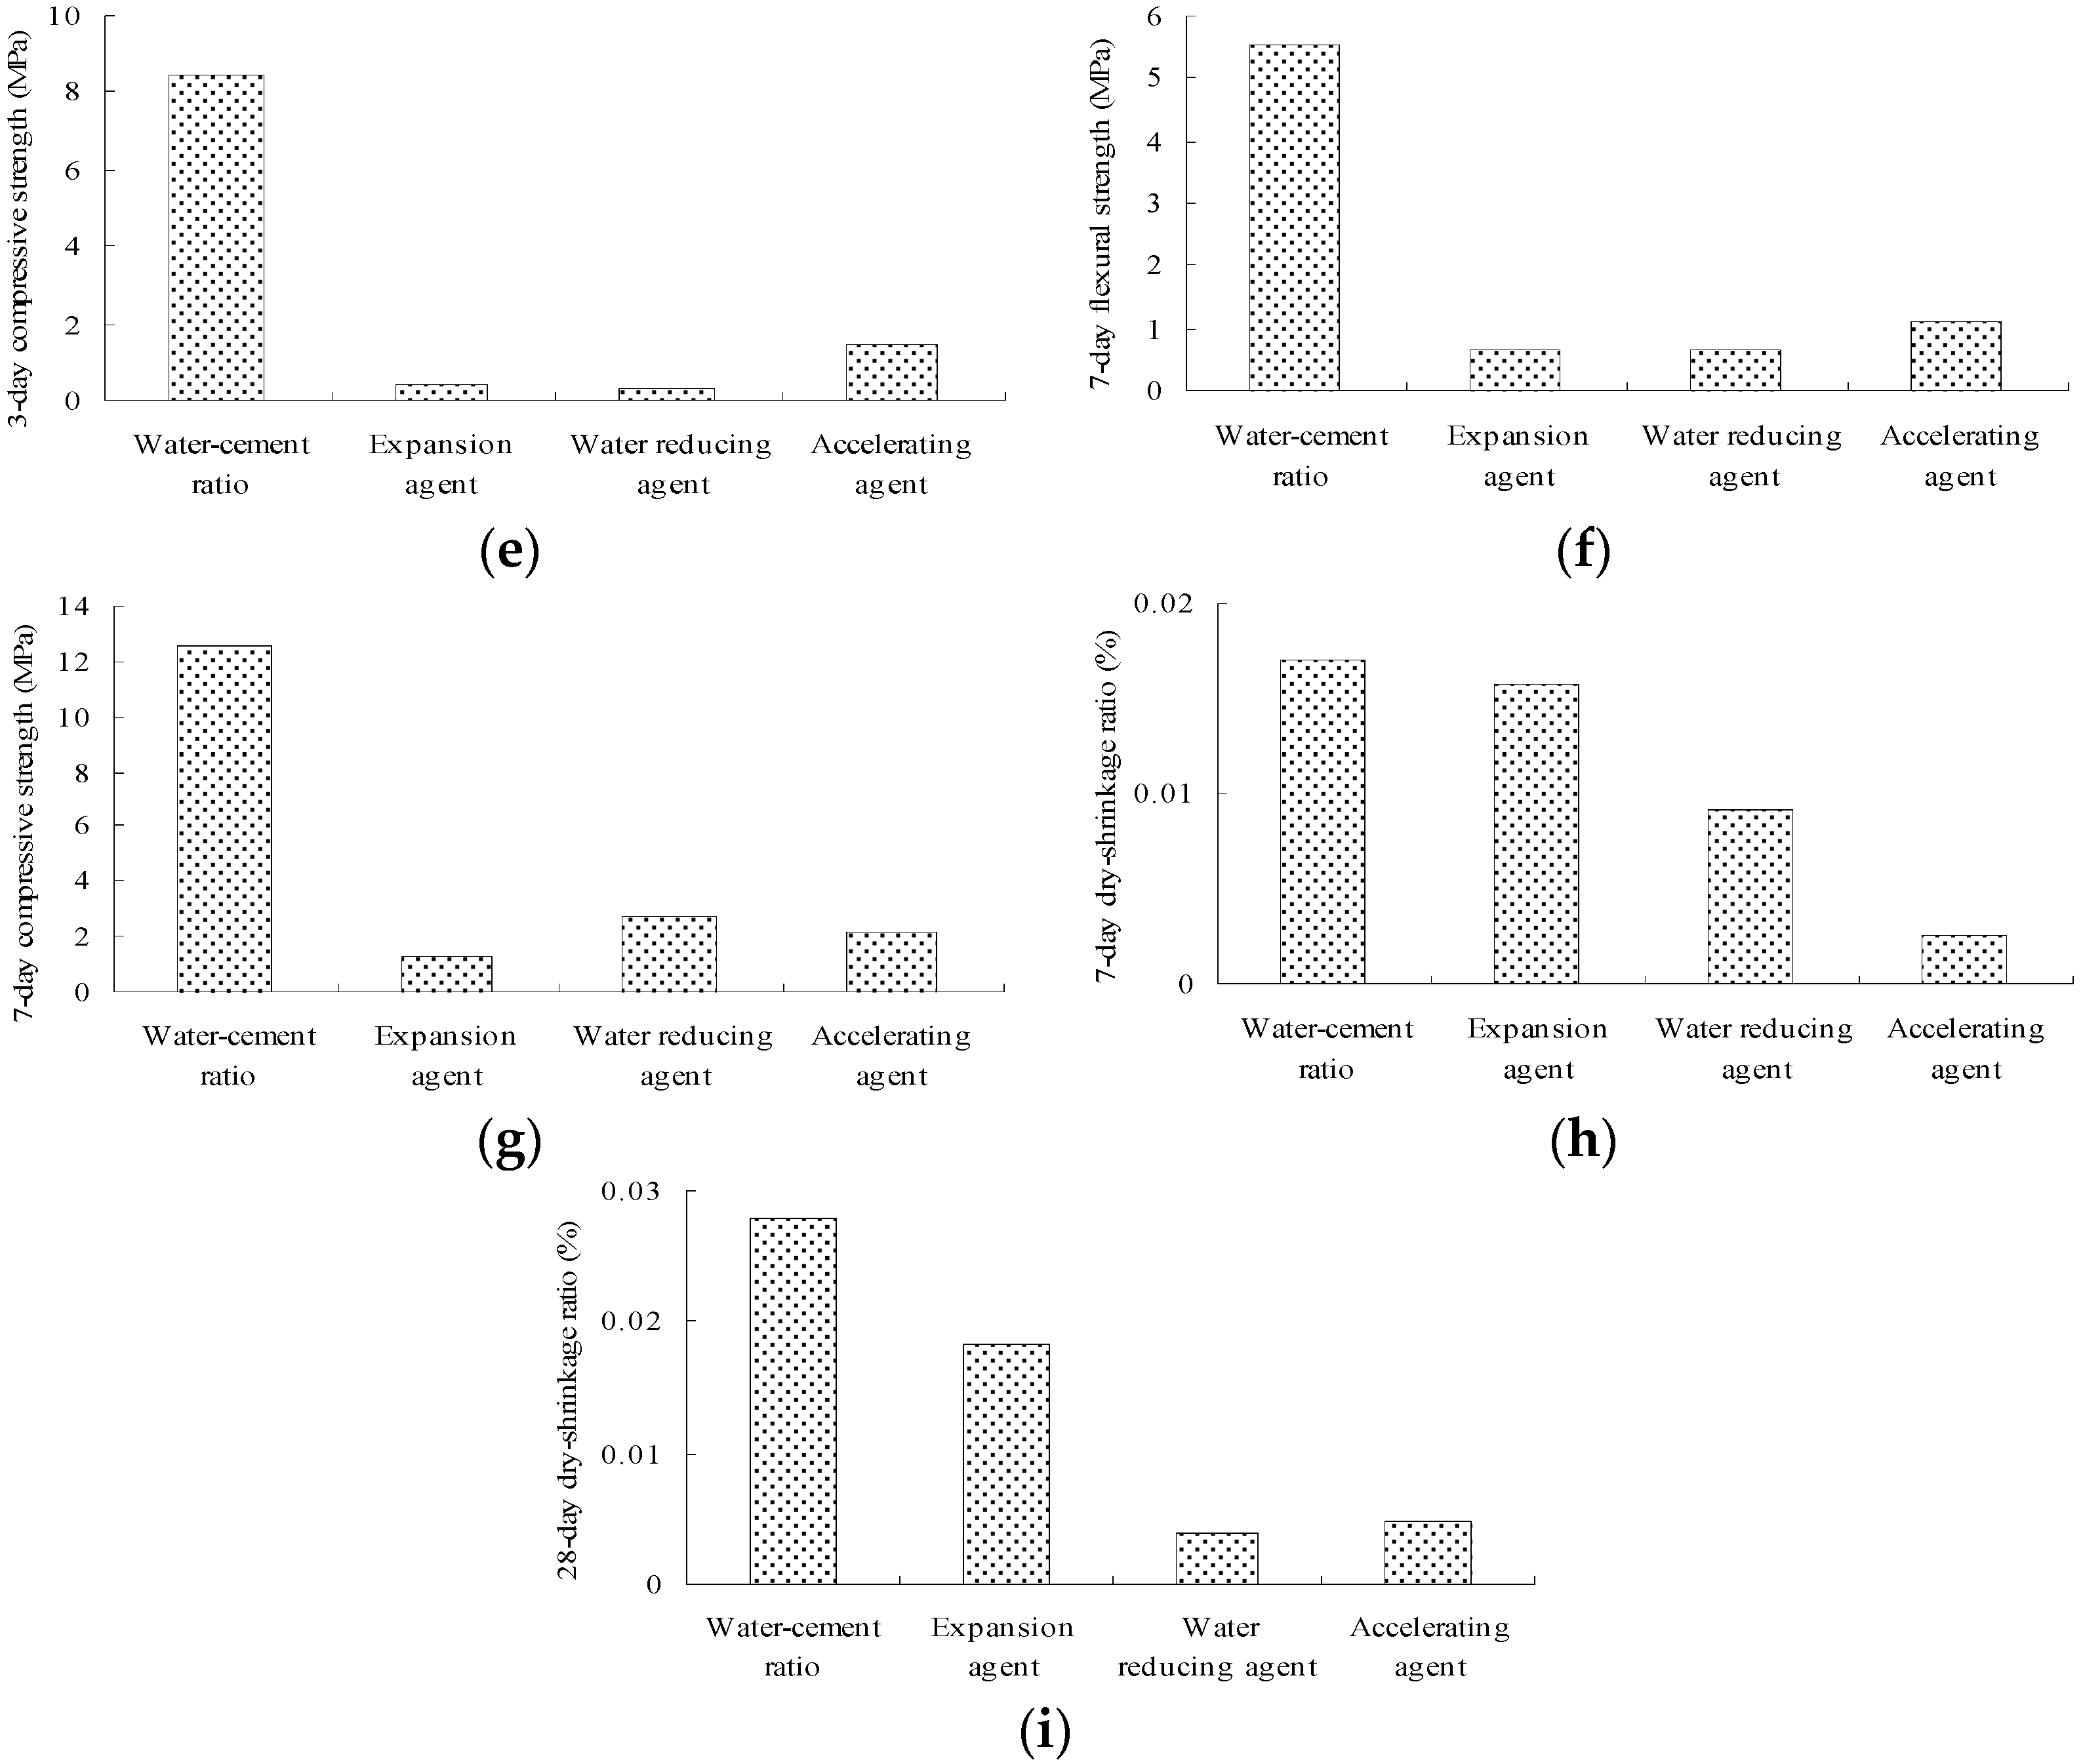
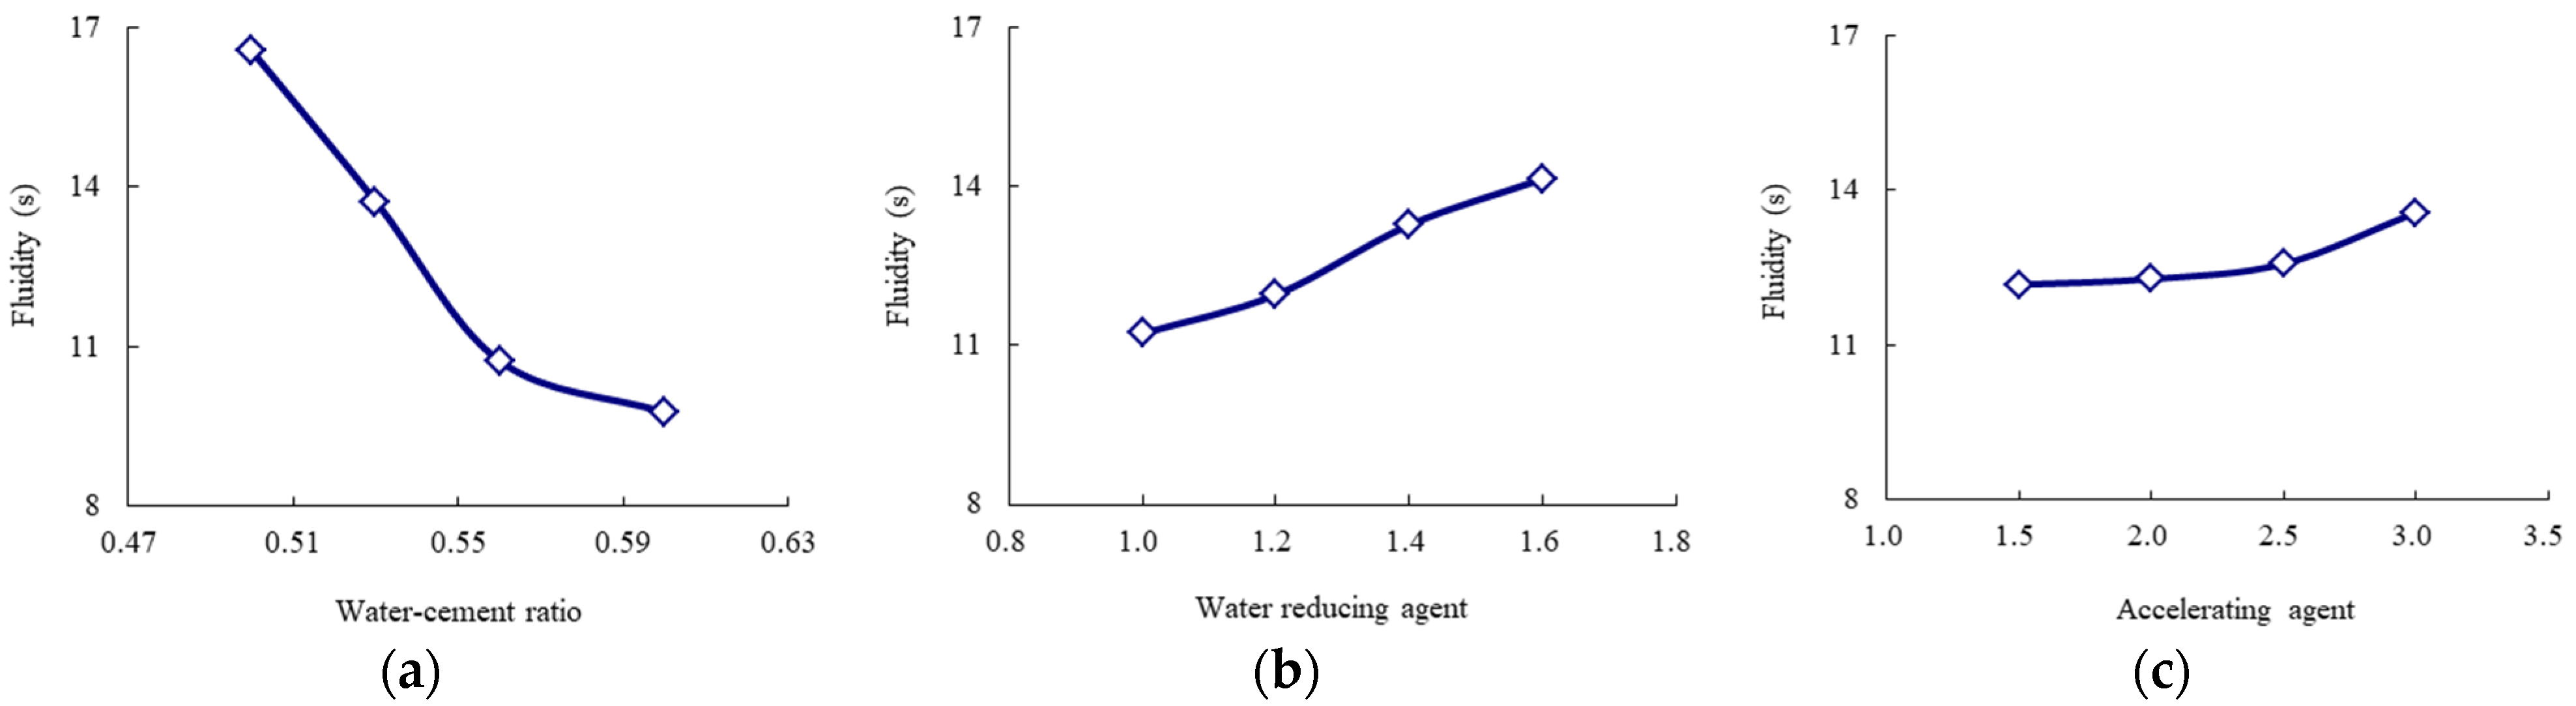
3.2. Orthogonal Experiment Analysis
3.3. The High-Fluidization, Early Strength Cement Grouting Enhanced by Nano-SiO2
4. Hydration Mechanisms of HCGA
4.1. Microstructure of HCGA
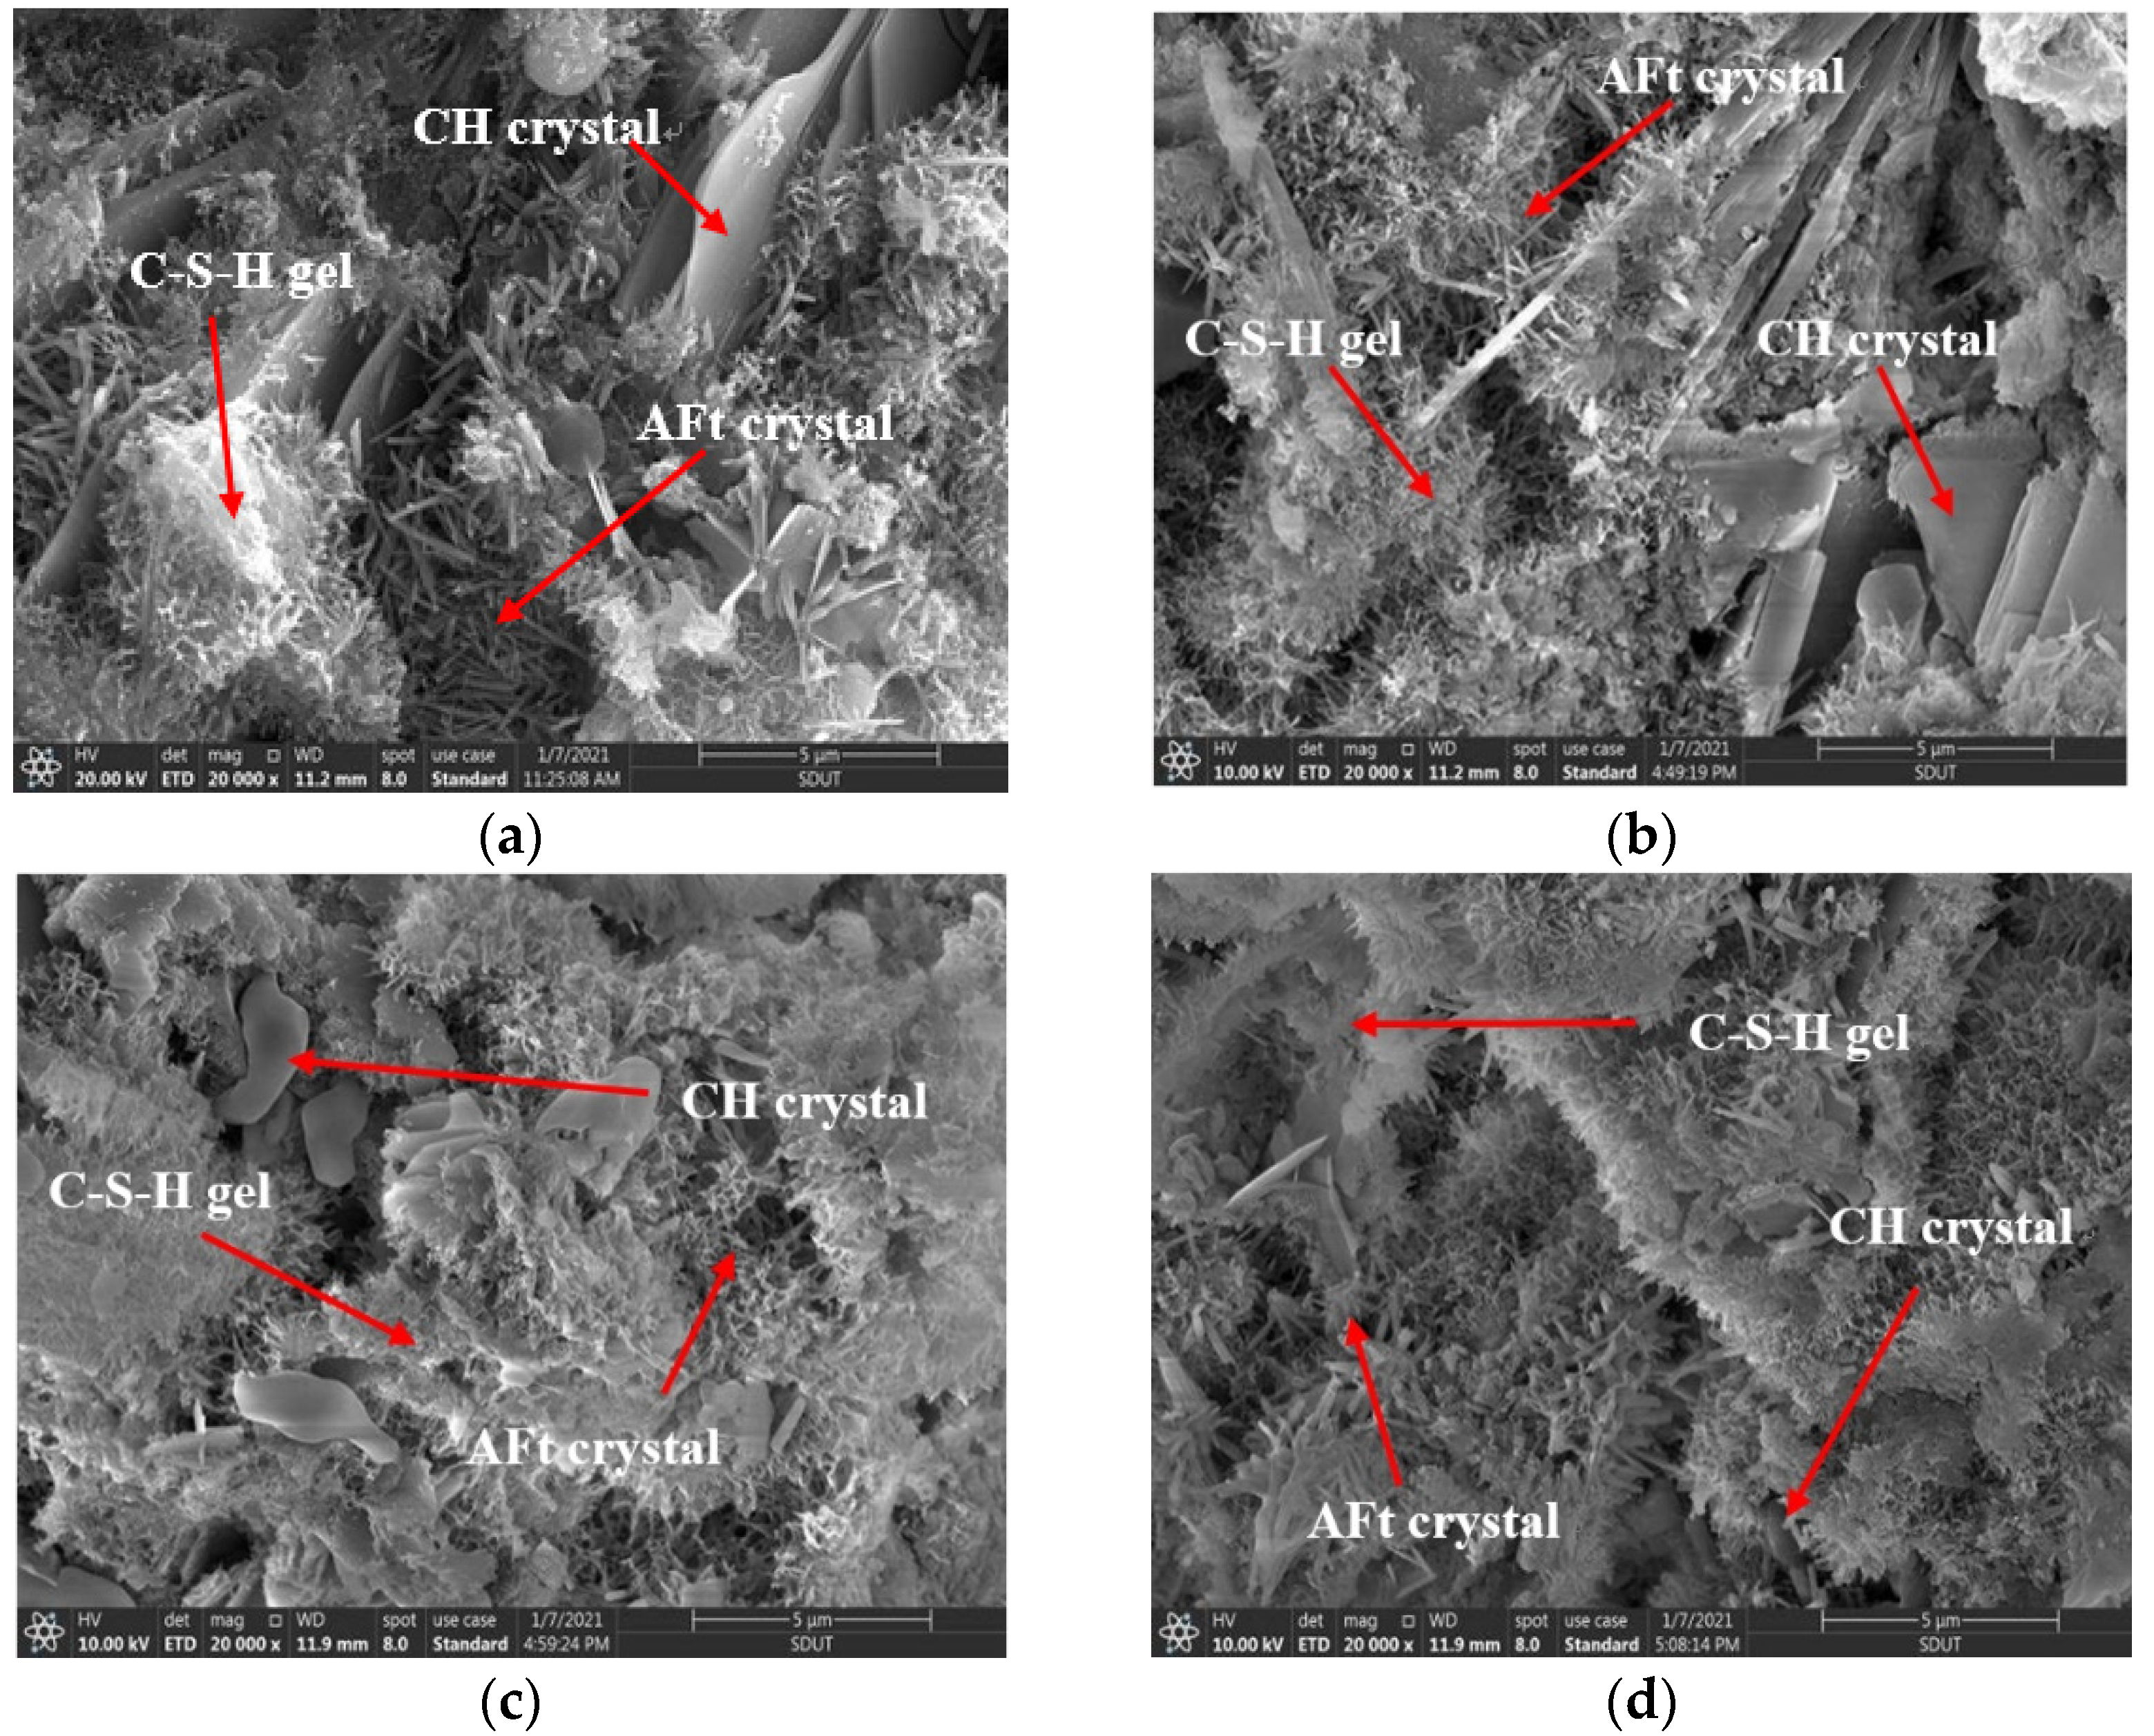
4.1.1. The Curing Age of 1-Day
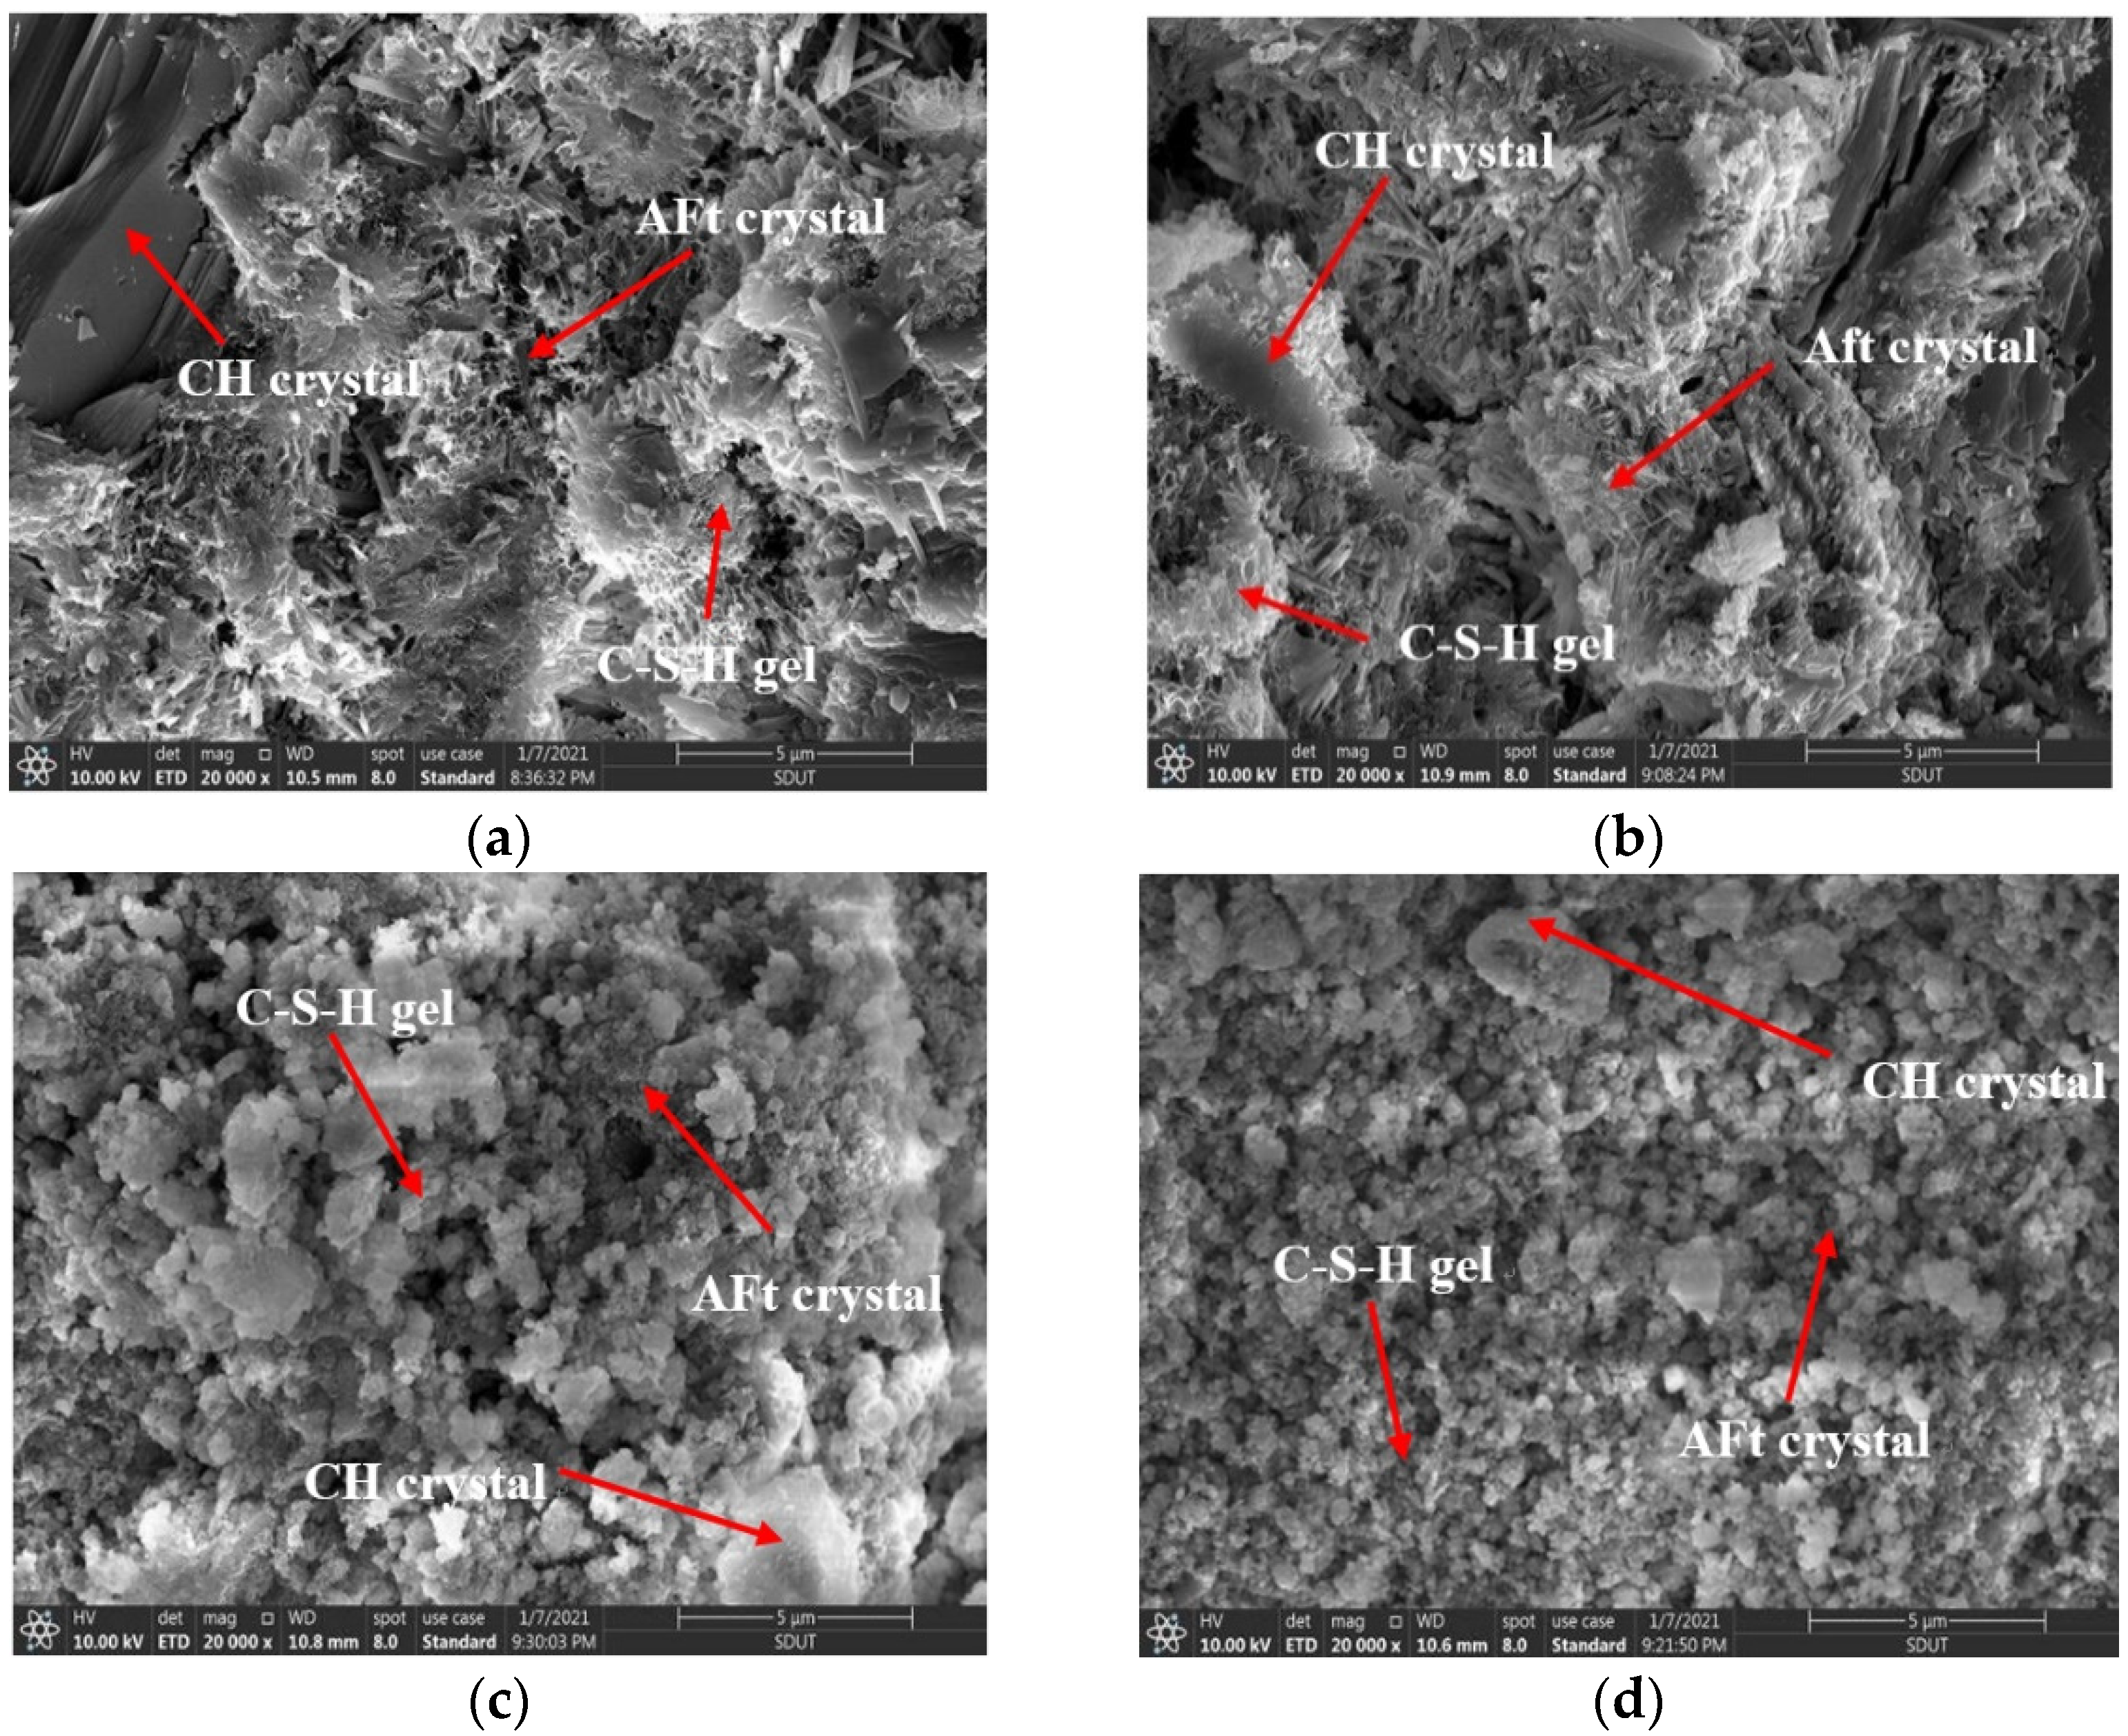
4.1.2. The Curing Age of 3-Day
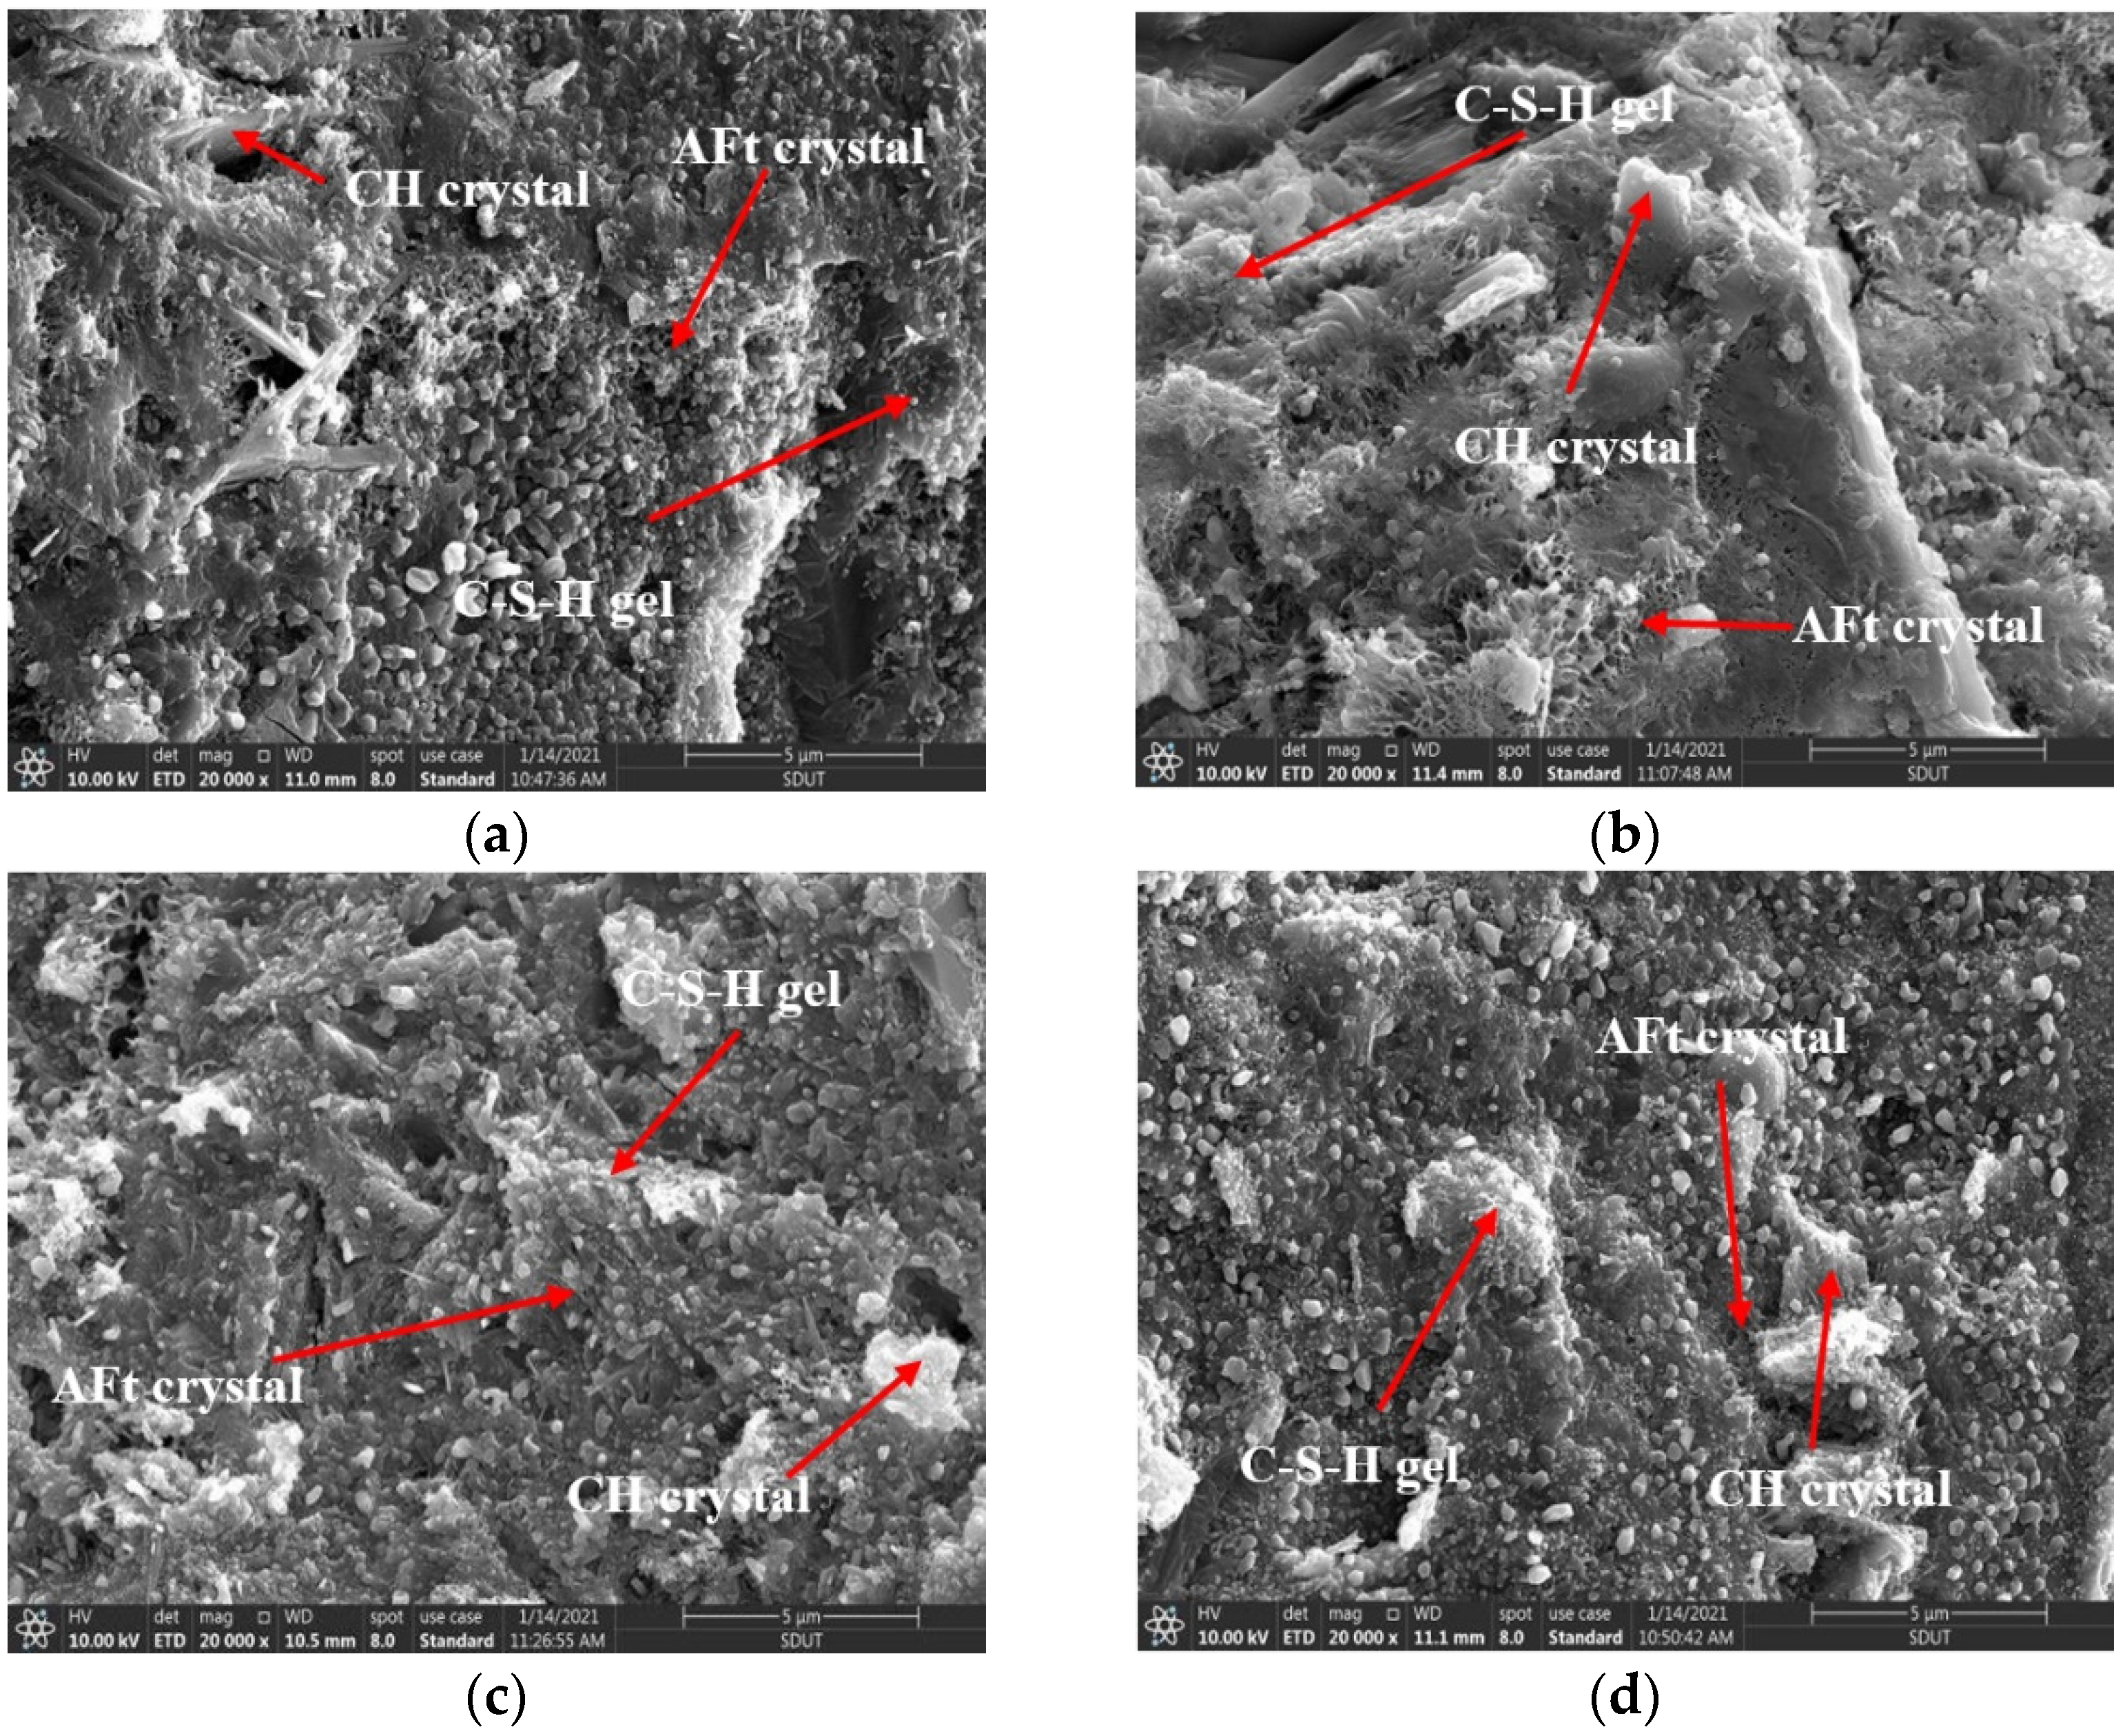
4.1.3. The Curing Age of 7-Day
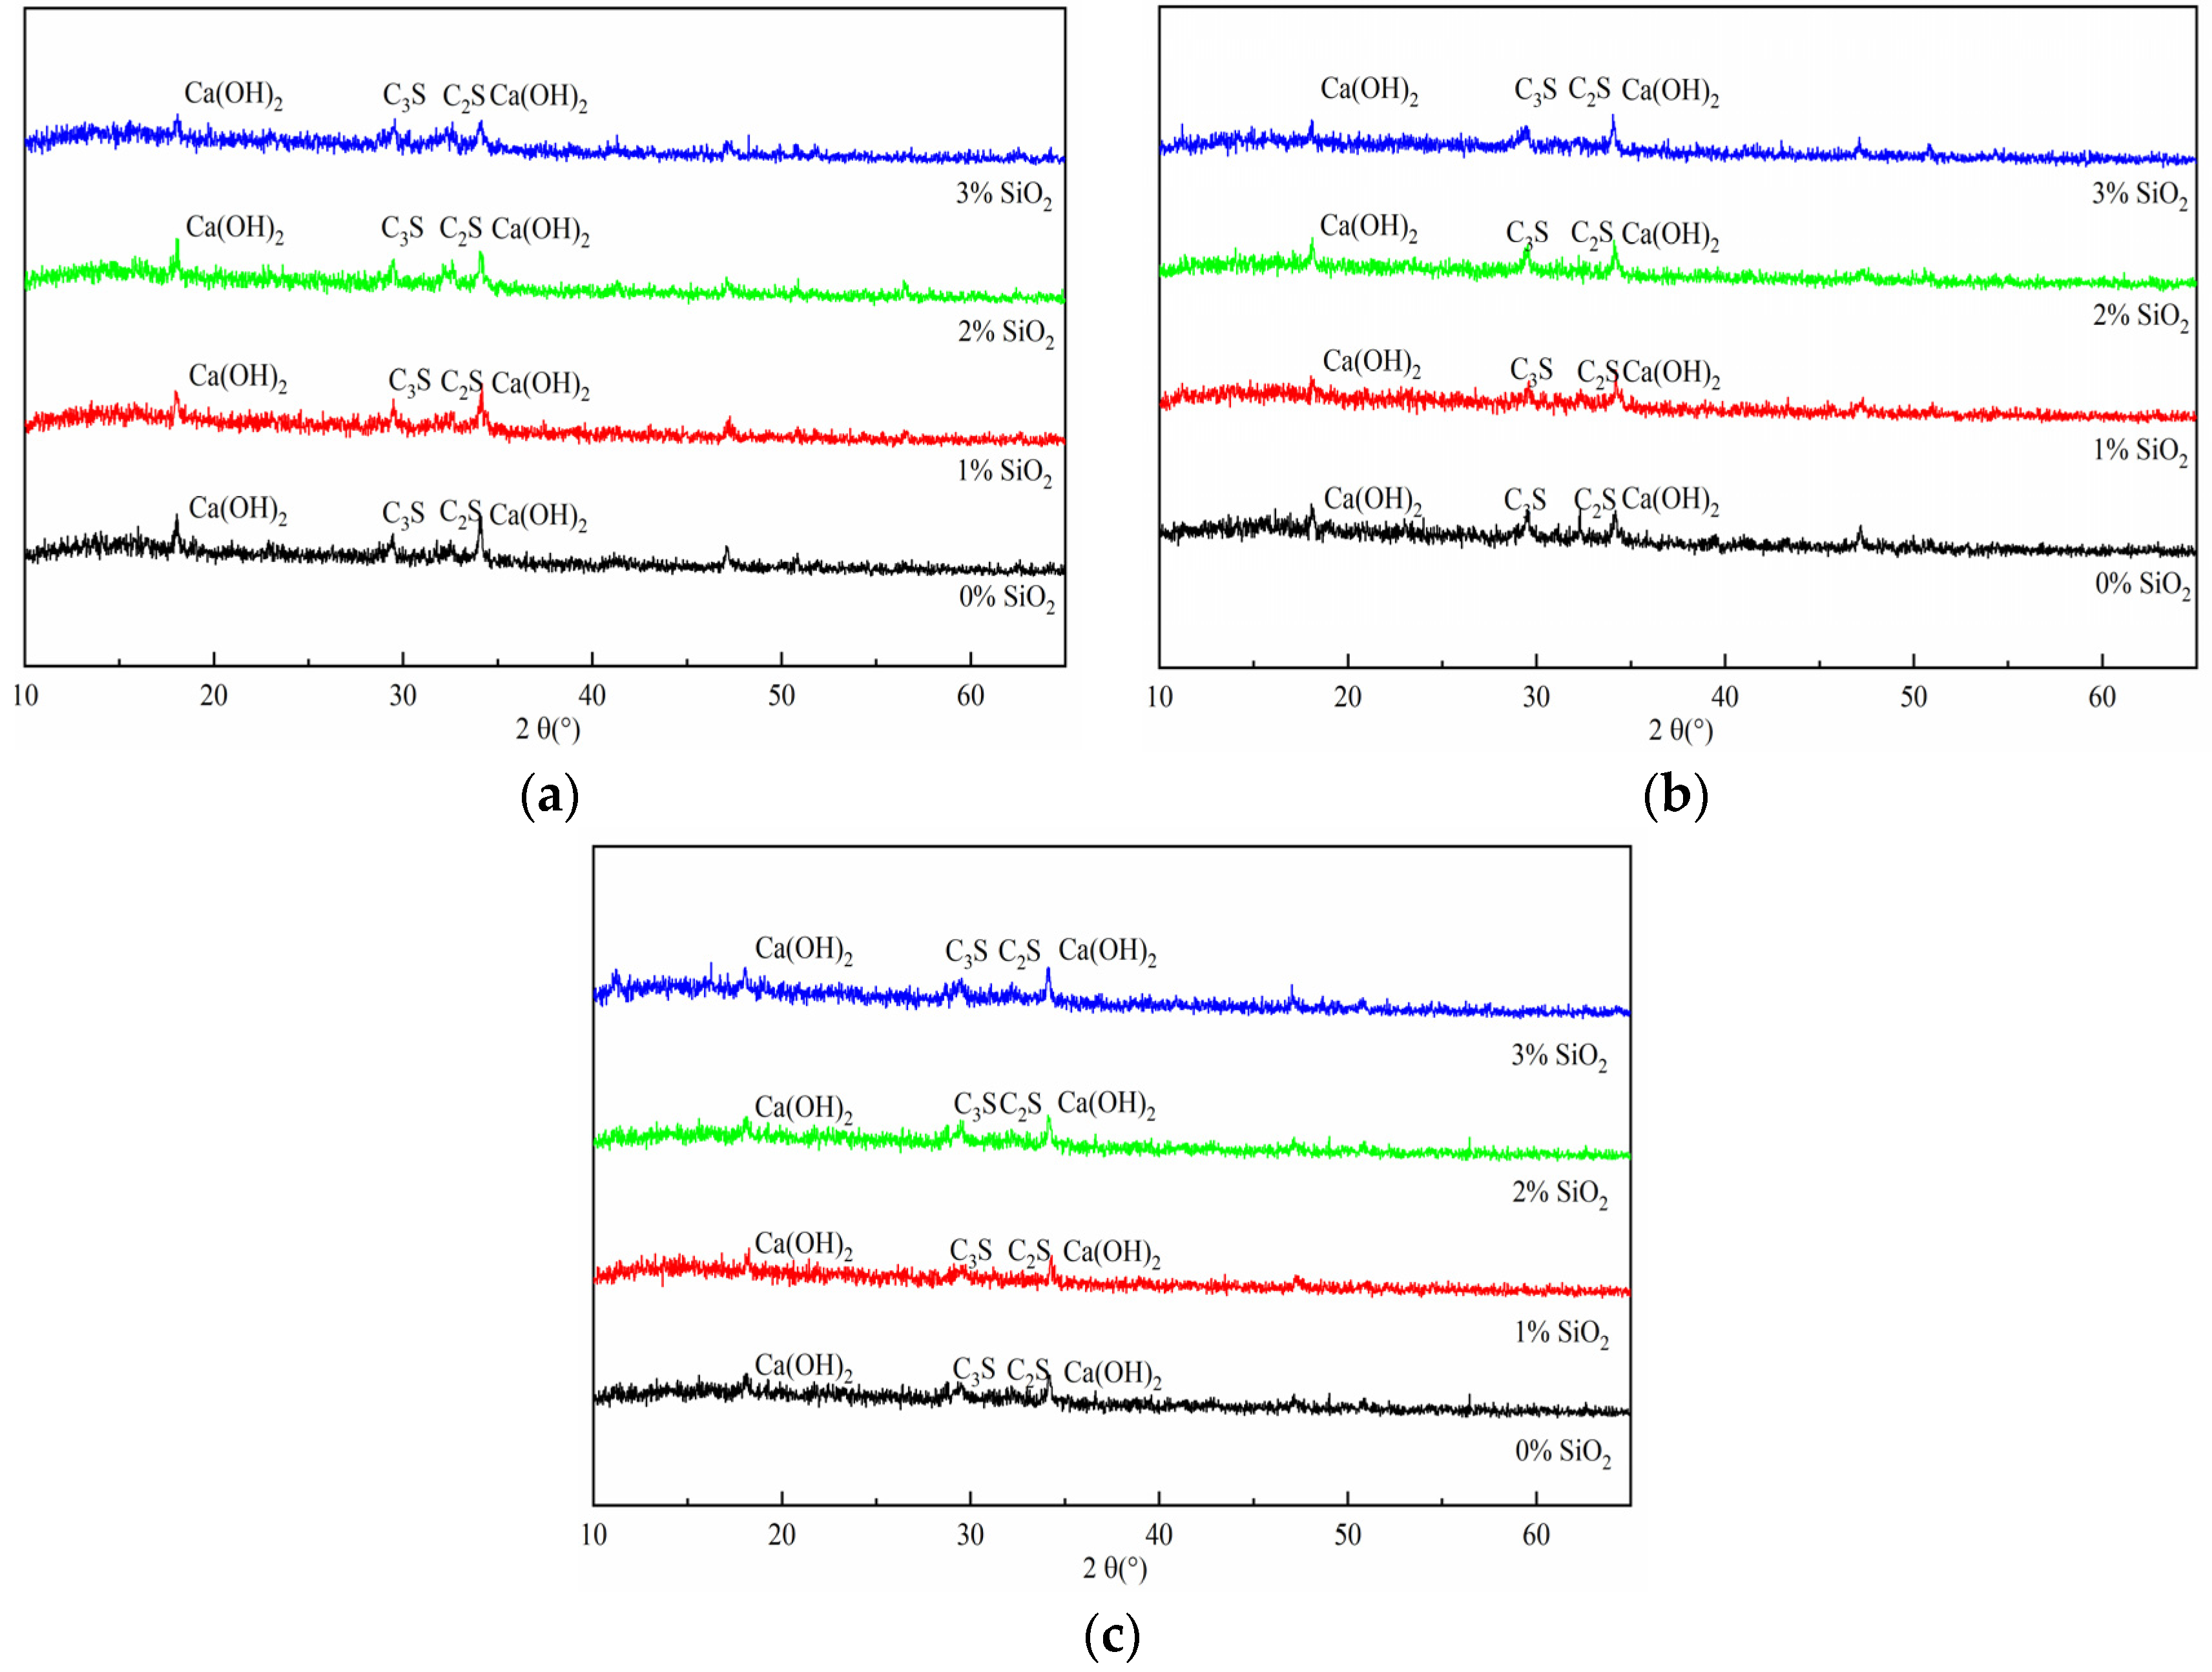
4.2. X-ray Diffraction Analysis
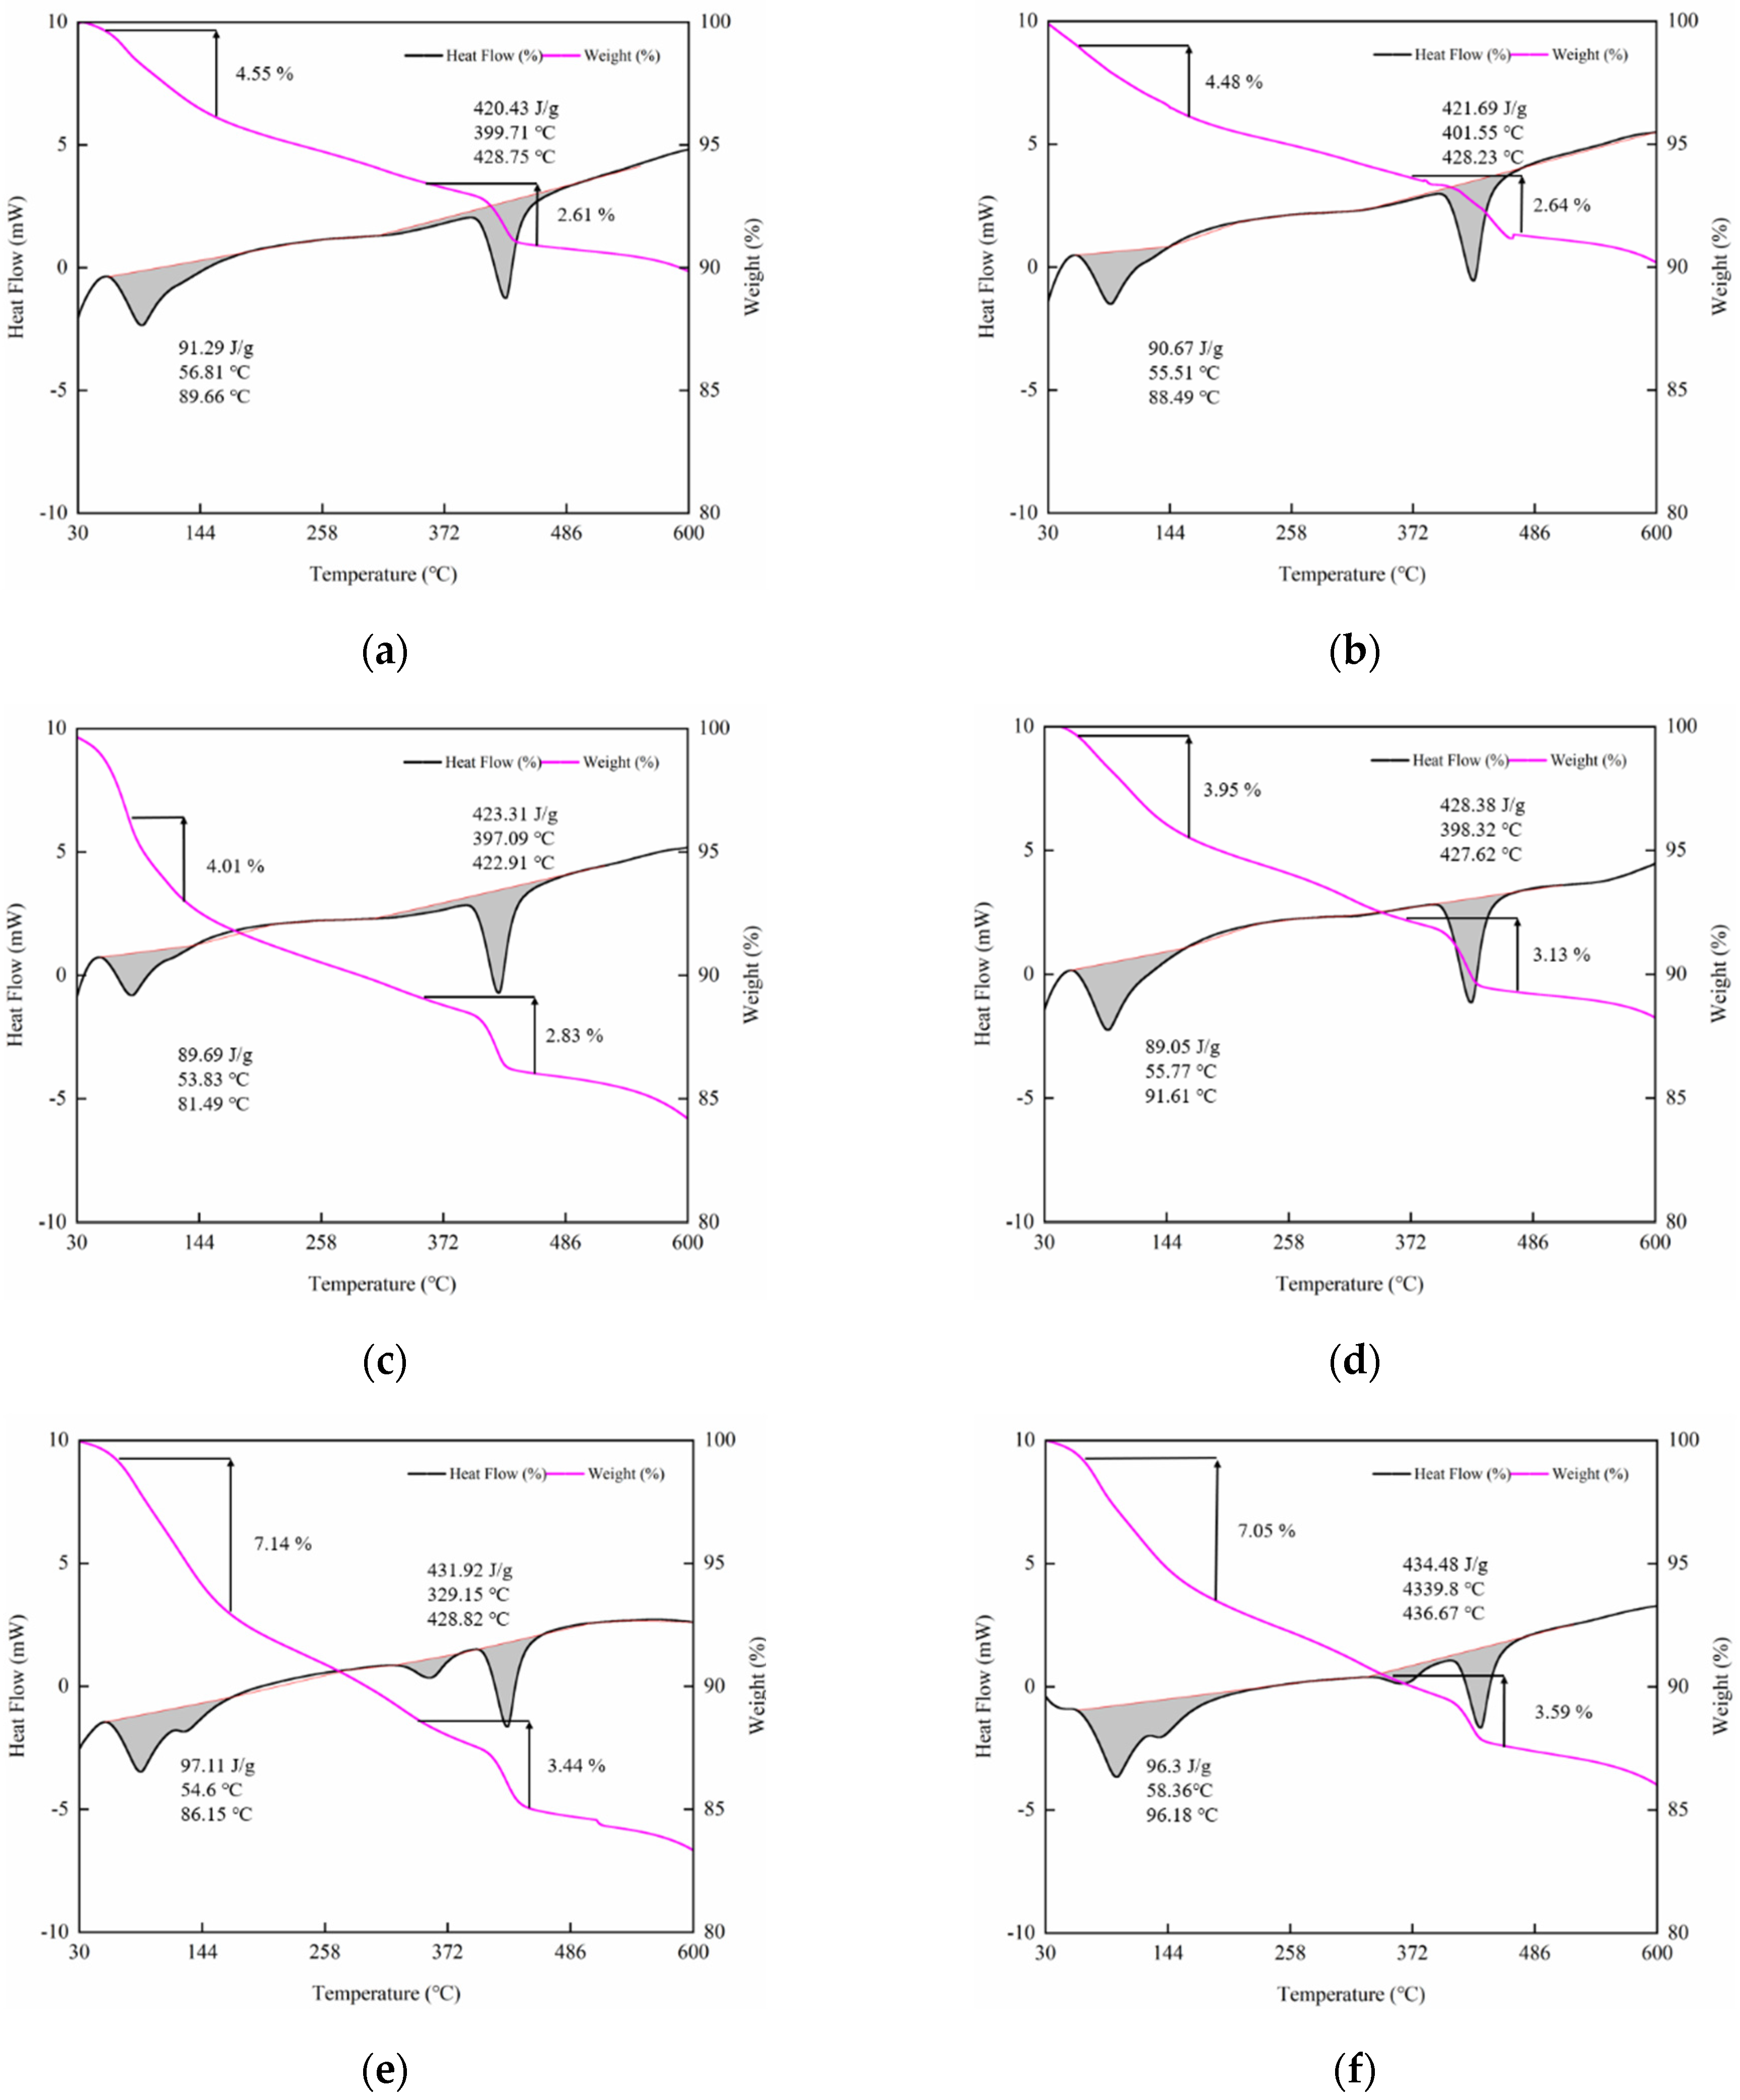
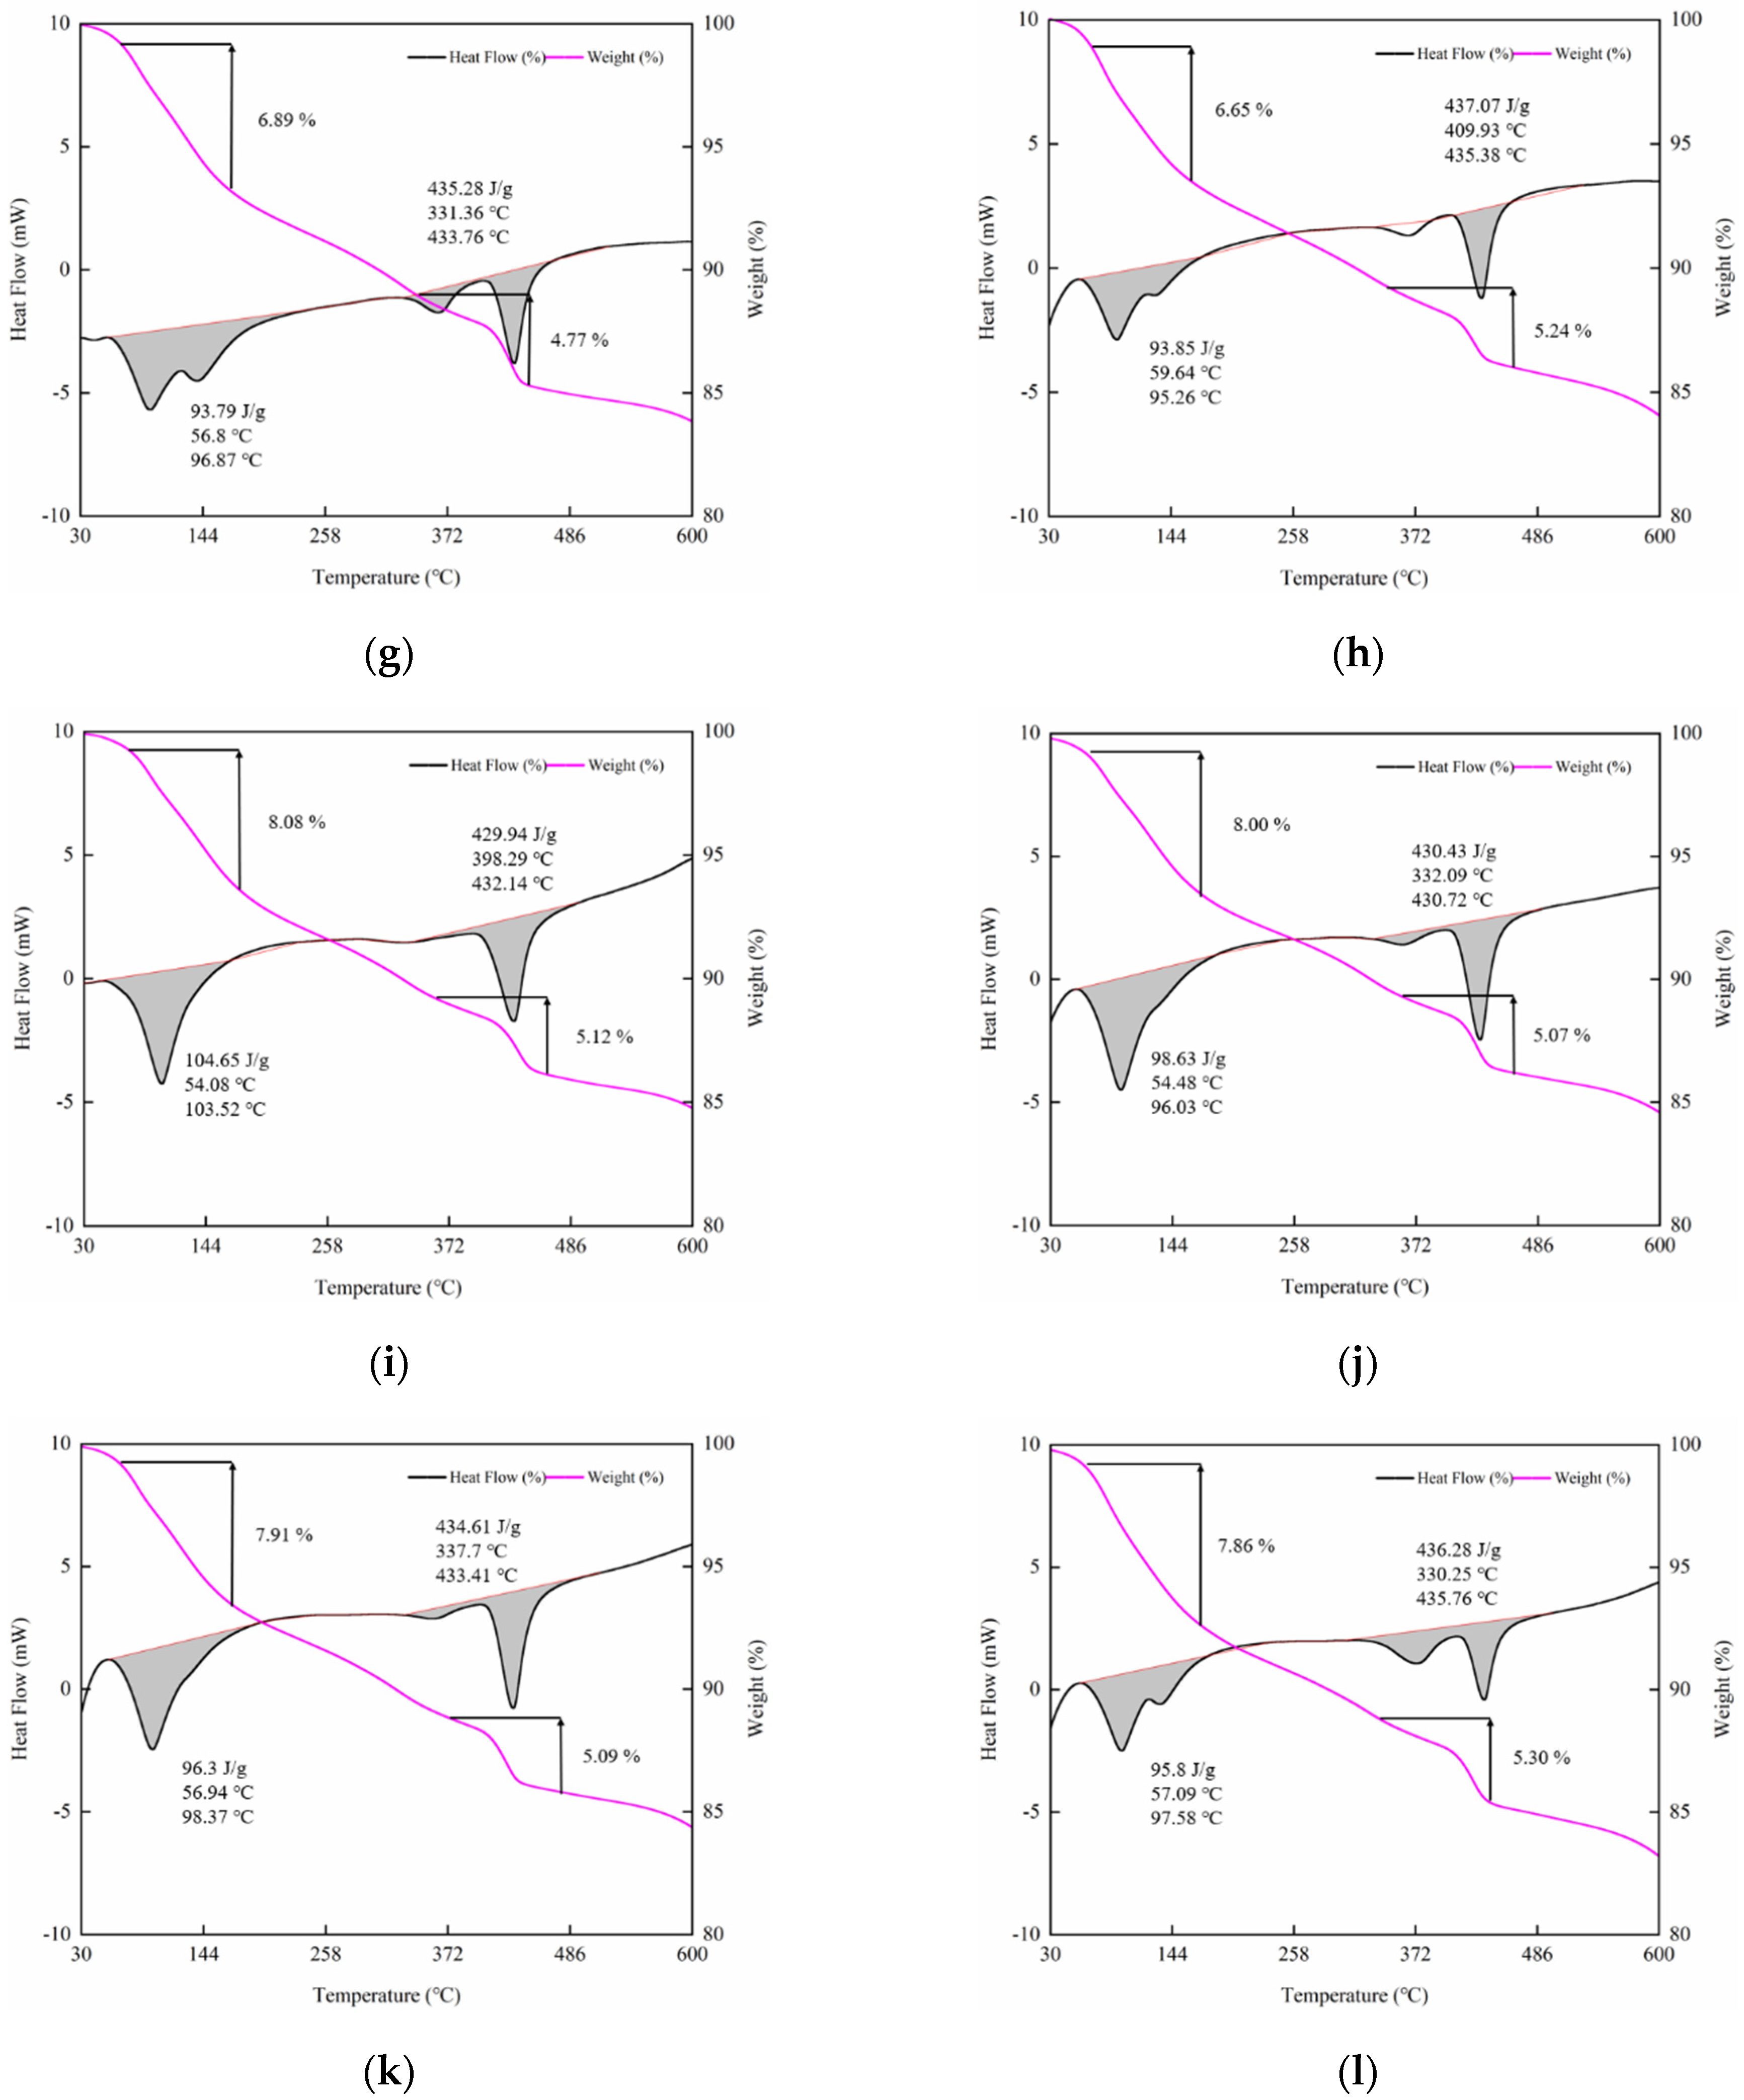
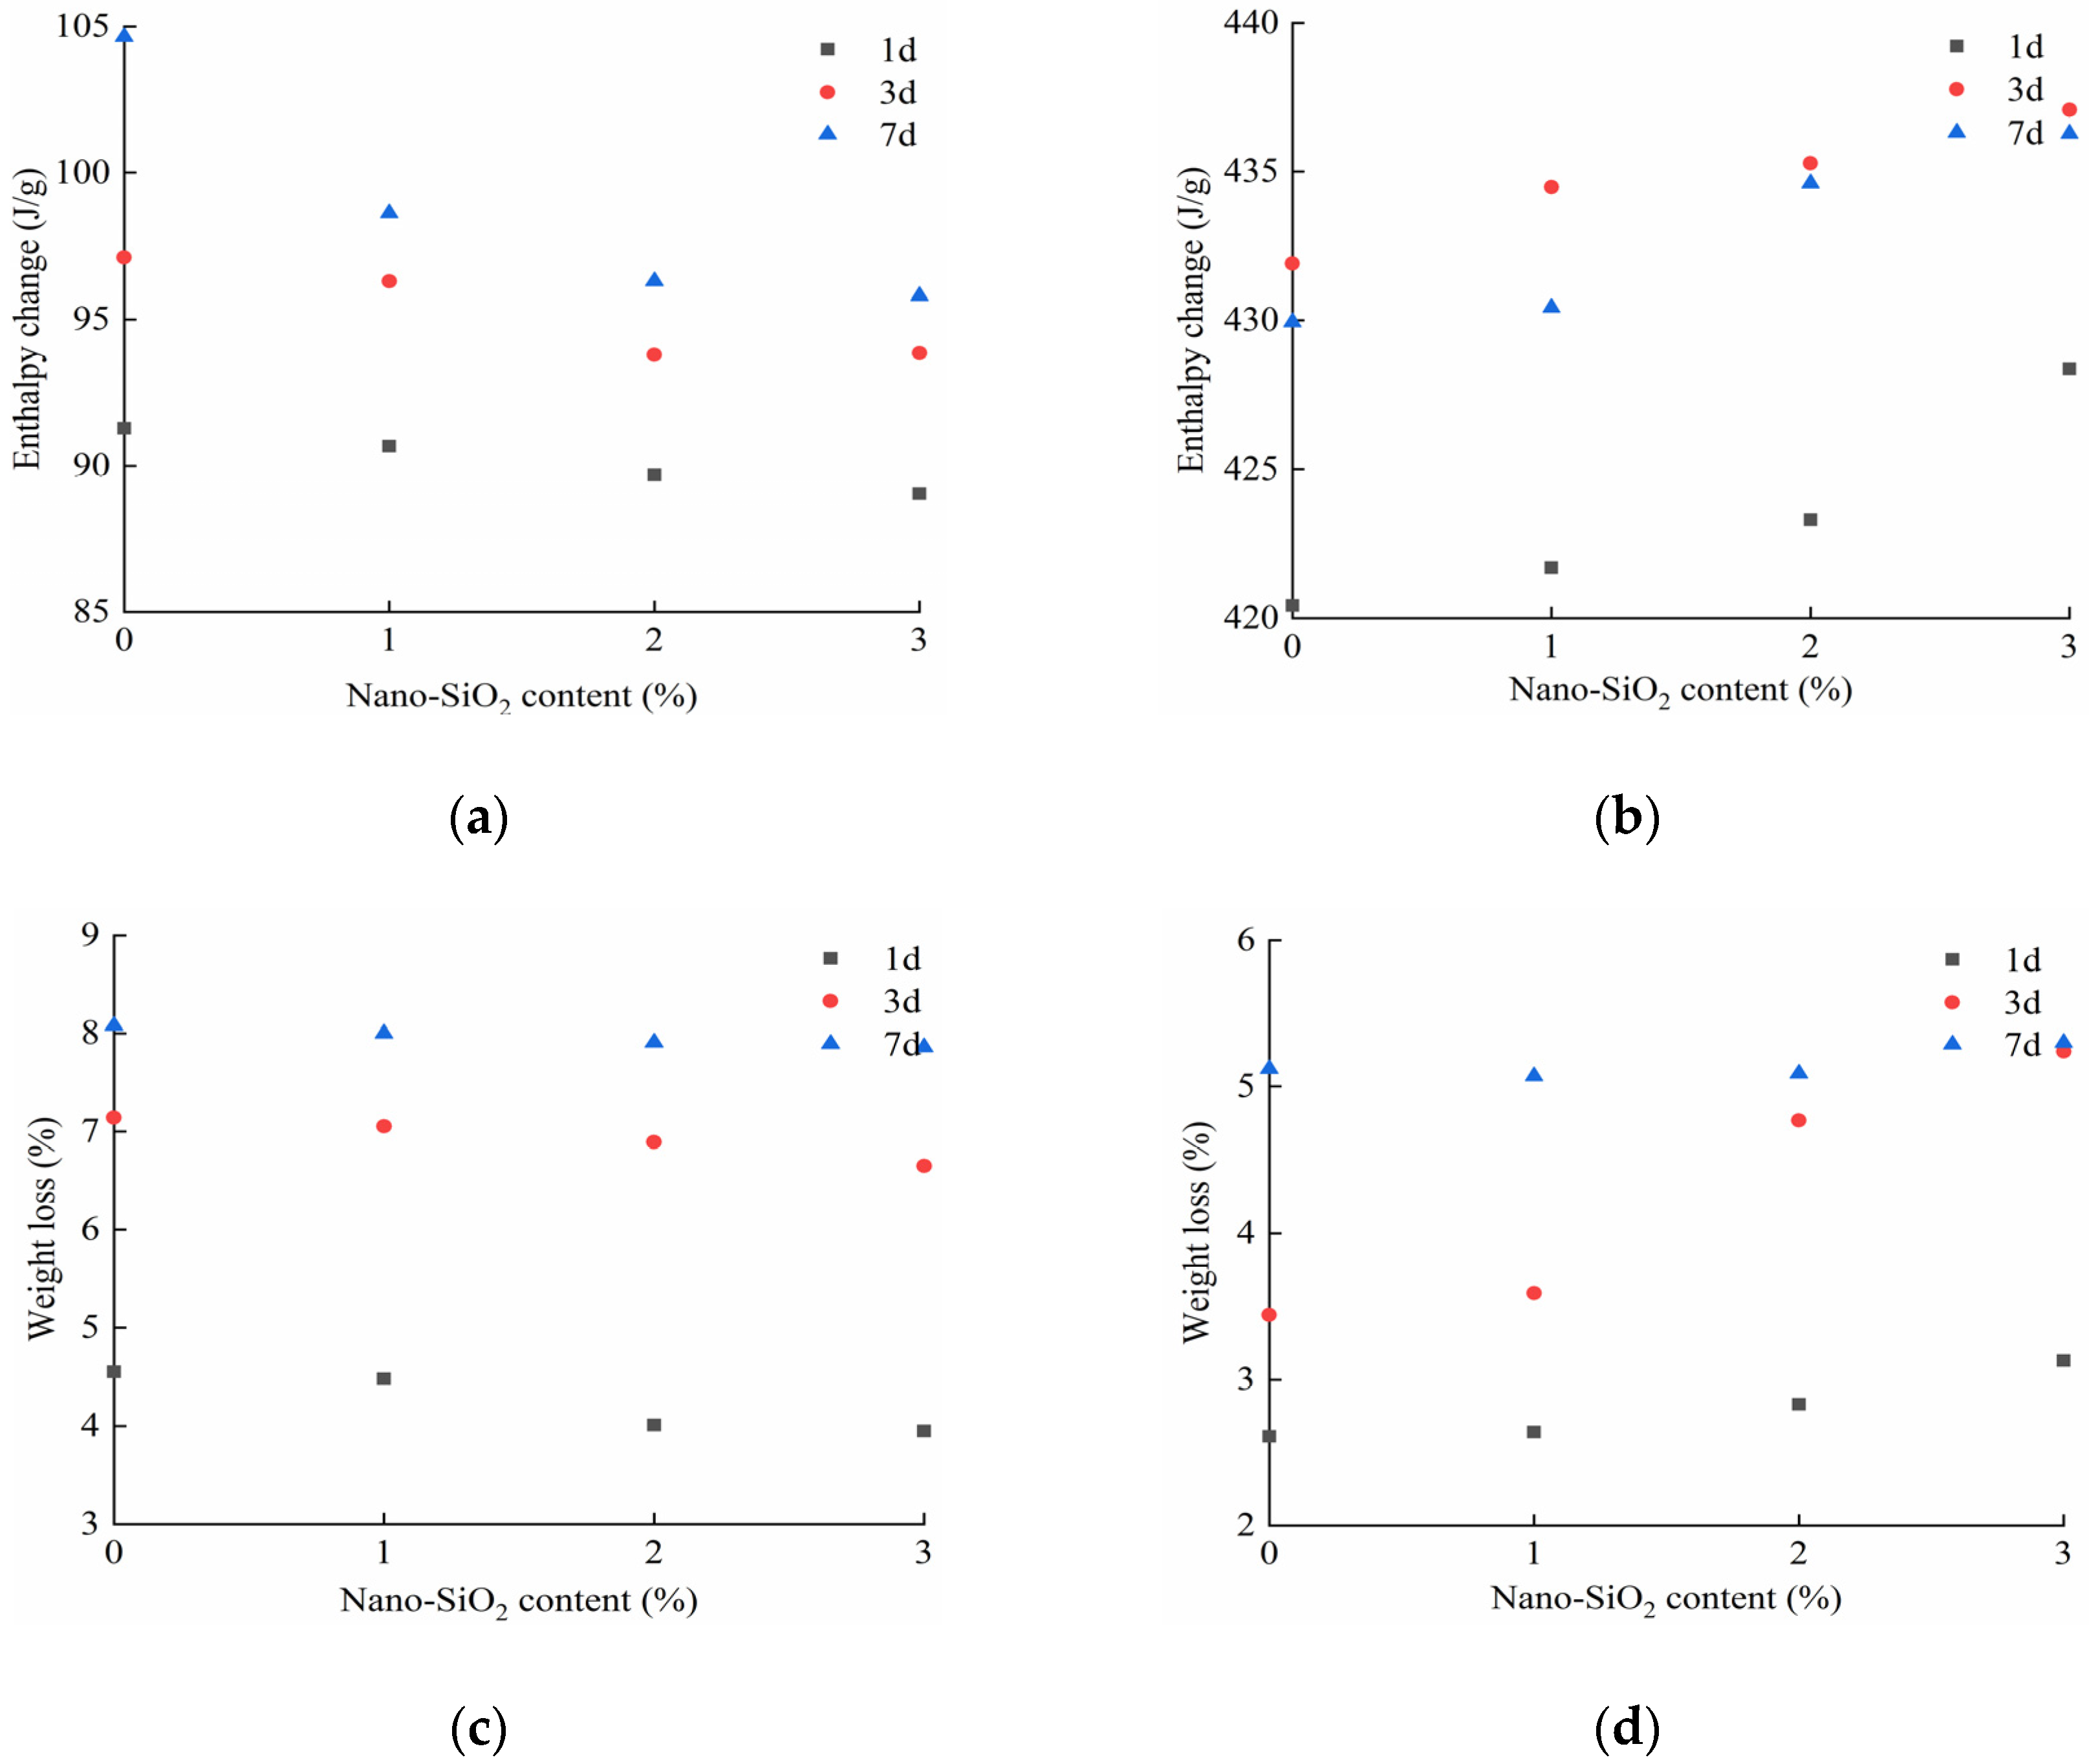
4.3. Differential Scanning Calorimetry
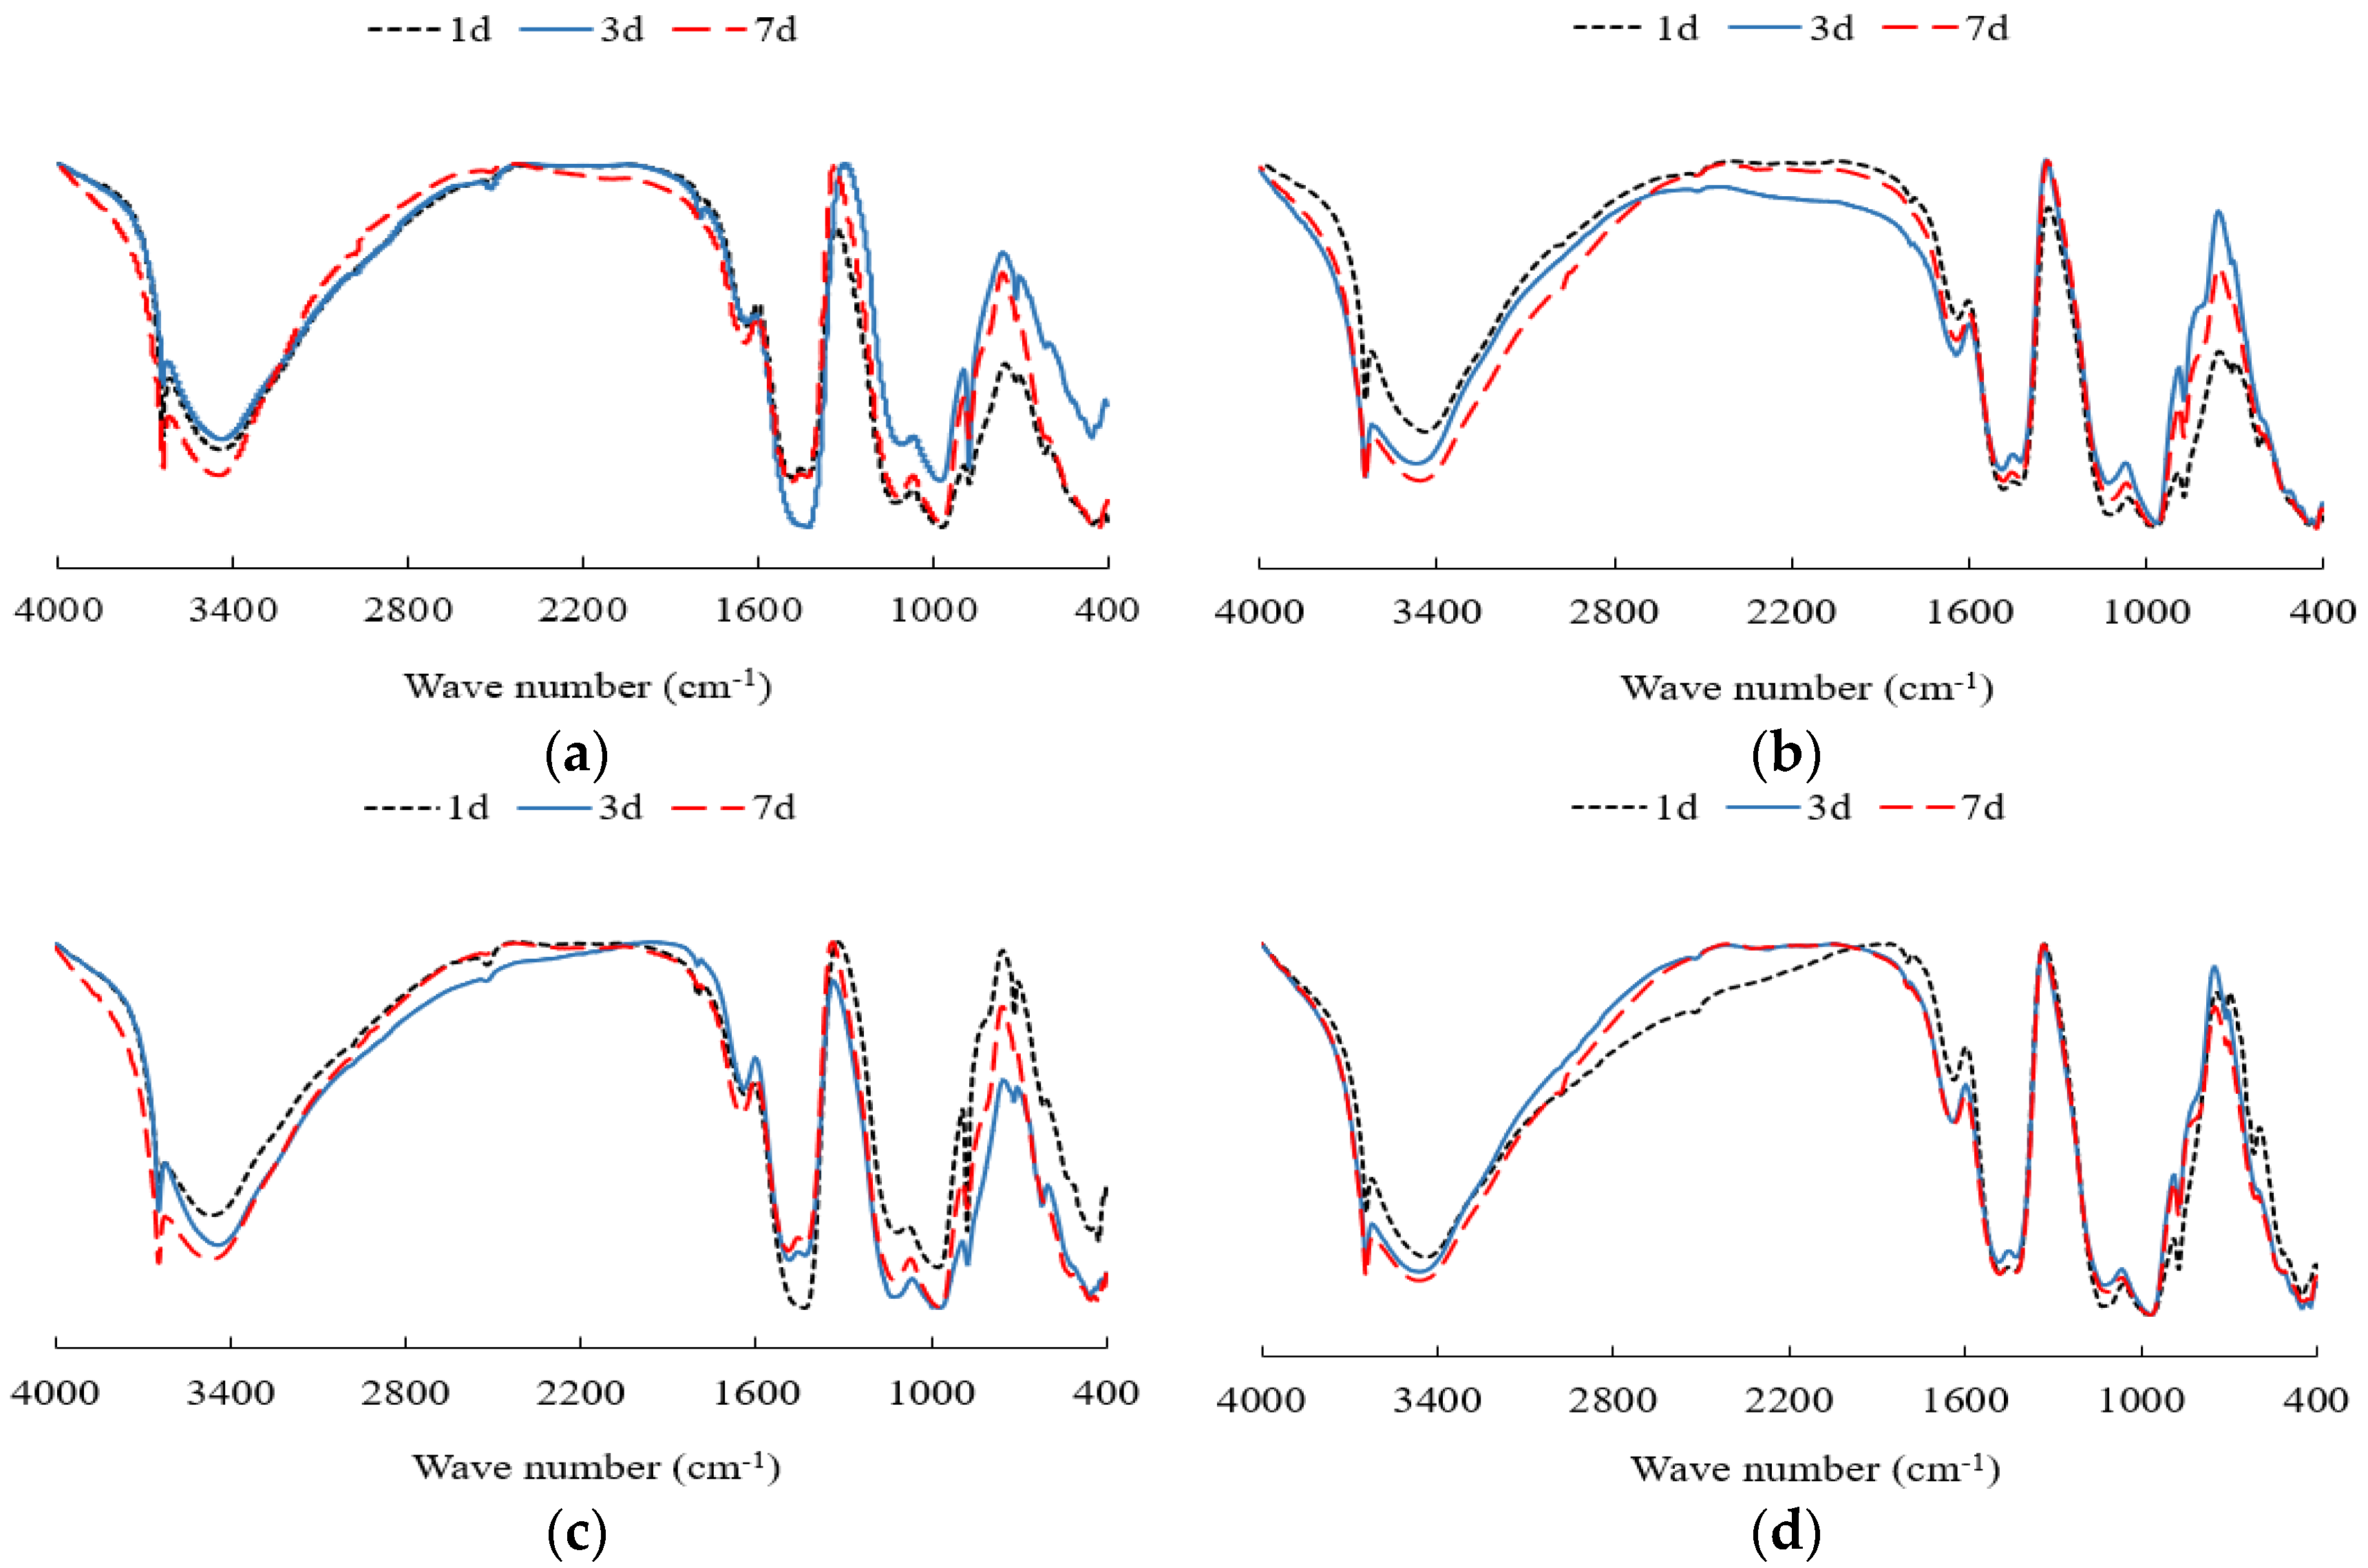
4.4. Fourier Transform Infrared Spectroscopy
5. Conclusions
- The formula of the HCGA is water–cement ratio = 0.56, water-reducing agent = 1.2%, accelerating agent = 2.5%, expansion agent = 8%, and nano-SiO2 = 1%. The flexural and compressive strength of the HCGA at the curing age of 1 day is higher than 3.5 MPa and 12 MPa, respectively, while the fluidity and shrinkage rate is less than 11 s and 0.15%, respectively;
- Nano-SiO2 can significantly improve the flexural and compressive strength of the HCGA at an early curing age, while it will slightly weaken the fluidity. The enhancement of nano-SiO2 on the strength becomes weak when the content of nano-SiO2 exceeds 1%. Hence, considering economic costs, it is recommended that the recommended content of nano-SiO2 is 2%. In addition, the effects of nano-SiO2 decrease as the curing age increases, which has little significance at the curing age of 7 days. The mechanism of nano-SiO2 on the early strength of the HCGA is to accelerate the generation of CH crystals, to reach saturation at a faster rate and urge the CHS gels to generate early, while it is irrelevant to the AFt crystals;
- The types of hydration products of the HCGA are almost the same in the case of different curing ages and nano-SiO2 contents. Nano-SiO2 mainly takes part in the hydration reaction of tricalcium silicate, to improve the early strength in the HCGA, while it is irrelevant to the dicalcium silicate. The reaction period of nano-SiO2 is not fixed, which is related to the hydration rate. Compared to common cement-based materials, the effect of nano-SiO2 on the strength will occur ahead, as the hydration rate quickens in the HCGA (early strength materials).
Author Contributions
Funding
Institutional Review Board Statement
Informed Consent Statement
Data Availability Statement
Conflicts of Interest
References
- Ren, J.; Xu, Y.; Huang, J.; Wang, Y.; Jia, Z. Gradation optimization and strength mechanism of aggregate structure considering macroscopic and mesoscopic aggregate mechanical behaviour in porous asphalt mixture. Constr. Build. Mater. 2021, 300, 124262. [Google Scholar] [CrossRef]
- Ren, J.; Yin, C. Investigating mechanical characteristics of aggregate structure for road materials. Int. J. Pavement Eng. 2020, 1–15. [Google Scholar] [CrossRef] [Green Version]
- Zhao, Z.; Wang, S.; Ren, J.; Wang, Y.; Wang, C. Fatigue characteristics and prediction of cement-stabilized cold recycled mixture with road-milling materials considering recycled aggregate composition. Constr. Build. Mater. 2021, 301, 124122. [Google Scholar] [CrossRef]
- Liu, Y.; Chen, B. Research on the preparation and properties of a novel grouting material based on magnesium phosphate cement. Constr. Build. Mater. 2019, 214, 516–526. [Google Scholar] [CrossRef]
- Li, H.; Wang, X.; Guan, X.; Zou, D. Properties of calcium sulfoaluminate cement-based grouting materials with lial-layered double hydroxides slurries. Adv. Compos. Lett. 2020, 29, 2633366. [Google Scholar] [CrossRef]
- Li, X.; Hao, J. New preparation of super-early-strength grouting materials by ternary complex system. Adv. Cem. Res. 2018, 30, 139–147. [Google Scholar] [CrossRef]
- Wu, Q.; Zou, Y.; Gu, J.; Xu, J.; Ji, R.; Wang, G. The Influence and Action Mechanization of Mineral Mixed Material on High Fluidity Potassium Magnesium Phosphate Cement (MKPC). J. Compos. Sci. 2020, 4, 29. [Google Scholar] [CrossRef] [Green Version]
- Zhang, H.; Zhou, R.; Liu, S.; Zhu, Y.; Wang, S.; Wang, J.; Guan, X. Enhanced toughness of ultra-fine sulphoaluminate cement-based hybrid grouting materials by incorporating in-situ polymerization of acrylamide. Constr. Build. Mater. 2021, 292, 123421. [Google Scholar] [CrossRef]
- Zhou, Y.; Wang, G.H.; Yuan, Y.F. Basic Properties and Engineering Application of Bentonite-Cement-Water Glass Grouting. KSCE J. Civ. Eng. 2020, 24, 2742–2750. [Google Scholar] [CrossRef]
- Celik, F.; Akcuru, O. Rheological and workability effects of bottom ash usage as a mineral additive on the cement based permeation grouting method. Constr. Build. Mater. 2020, 263, 120186. [Google Scholar] [CrossRef]
- Zhang, S.; Qiao, W.; Wu, Y.; Fan, Z.; Zhang, L. Optimization of microfine-cement-based slurry containing microfine fly ash and nano-CacO3 for microfracture grouting. Bull. Eng. Geol. Environ. 2021, 80, 4821–4839. [Google Scholar] [CrossRef]
- Guo, X.; Xue, S.; Zheng, C.; Li, Y. Experimental Research on Performance of New Gas Drainage Borehole Sealing Material with High Fluidity. Adv. Mater. Sci. Eng. 2021, 2021, 1–12. [Google Scholar] [CrossRef]
- Lu, J.; Ling, S.; Wang, X.; Li, X.; Liu, D. Research on Portland Cement Grouting Material in Sandy Pebble Soil. Sci. Adv. Mater. 2019, 11, 1027–1036. [Google Scholar] [CrossRef]
- Shi, Z.; Wang, Q.; Xu, L. Experimental Study of Cement Alkali-Resistant Glass Fiber (C-ARGF) Grouting Material. Materials 2020, 13, 605. [Google Scholar] [CrossRef] [PubMed] [Green Version]
- Zhang, C.; Shuai, B.; Jia, S.; Lv, X.; Yang, T.; Chen, T.; Yang, Z. Plasma-functionalized graphene fiber reinforced sulphoaluminate cement-based grouting materials. Ceram. Int. 2021, 47, 15392–15399. [Google Scholar] [CrossRef]
- Singh, L.; Karade, S.; Bhattacharyya, S.; Yousuf, M.M.; Ahalawat, S. Beneficial role of nanosilica in cement based materials—A review. Constr. Build. Mater. 2013, 47, 1069–1077. [Google Scholar] [CrossRef]
- Feng, P.; Chang, H.; Liu, X.; Ye, S.; Shu, X.; Ran, Q. The significance of dispersion of nano-SiO2 on early age hydration of cement pastes. Mater. Des. 2020, 186, 108320. [Google Scholar] [CrossRef]
- Qiu, X.; Jiang, H.; Zhang, G. Modification effects of nanl-CaCO3 on engineering performance of cement grouts. J. Nanosci. Nanotechnol. 2020, 20, 5043–5048. [Google Scholar] [CrossRef]
- Jiao, D.; Lesage, K.; Yardimci, M.Y.; El Cheikh, K.; Shi, C.; De Schutter, G. Structural evolution of cement paste with nano-Fe3O4 under magnetic field—Effect of concentration and particle size of nano-Fe3O4. Cem. Concr. Compos. 2021, 120, 104036. [Google Scholar] [CrossRef]
- Zhang, M.-H.; Islam, J. Use of nano-silica to reduce setting time and increase early strength of concretes with high volumes of fly ash or slag. Constr. Build. Mater. 2012, 29, 573–580. [Google Scholar] [CrossRef]
- Akono, A.T. Effect of nano-TiO2 on C–S–H phase distribution within Portland cement paste. J. Mater. Sci. 2020, 55, 11106–11119. [Google Scholar] [CrossRef]
- Liu, Y.-H.; Yang, P.; Ku, T.; Gao, S.-W. Effect of different nanoparticles on the grouting performance of cement-based grouts in dynamic water condition. Constr. Build. Mater. 2020, 248, 118663. [Google Scholar] [CrossRef]
- Lang, L.; Chen, B.; Duan, H. Modification of nanoparticles for the strength enhancing of cement-stabilized dredged sludge. J. Rock Mech. Geotech. Eng. 2021, 13, 694–704. [Google Scholar] [CrossRef]
- Sargam, Y.; Wang, K. Hydration kinetics and activation energy of cement pastes containing various nanoparticles. Compos. Part B Eng. 2021, 216, 108836. [Google Scholar] [CrossRef]
- Ikotun, B.D.; Raheem, A.A. Characteristics of wood ash cement mortar incorporating green-synthesized nano-TiO2. Int. J. Concr. Struct. Mater. 2021, 15, 19. [Google Scholar] [CrossRef]
- Ren, Z.; Liu, Y.; Yuan, L.; Luan, C.; Wang, J.; Cheng, X.; Zhou, Z. Optimizing the content of nano-SiO2, nano-TiO2 and nano-CaCO3 in Portland cement paste by response surface methodology. J. Build. Eng. 2021, 35, 102073. [Google Scholar] [CrossRef]
- Zhang, X.; Gao, J.; Fan, H.; Li, X.; Gao, Z.; Xue, L.; Sun, S. Study on the mechanism of nano-SiO2 for improving the properties of cement-based soil stabilizer. Nanomaterials 2020, 10, 405. [Google Scholar] [CrossRef] [PubMed] [Green Version]
- Liu, R.; Xiao, H.; Li, H.; Sun, L.; Pi, Z.; Waqar, G.Q.; Du, T.; Yu, L. Effects of nano-SiO2 on the permeability-related properties of cement-based composites with different water/cement ratios. J. Mater. Sci. 2018, 53, 4974–4986. [Google Scholar] [CrossRef]
- Sonebi, M.; Bassuoni, M.T.; Kwasny, J.; Amanuddin, A.K. Effect of Nanosilica on Rheology, Fresh Properties, and Strength of Cement-Based Grouts. J. Mater. Civ. Eng. 2015, 27, 04014145. [Google Scholar] [CrossRef]
- Zhou, F.; Sun, W.; Shao, J.; Kong, L. Experimental study on nano silica modified cement base grouting reinforcement materials. Geomech. Eng. 2020, 20, 67–73. [Google Scholar]
- Zhang, S.; Qiao, W.-G.; Chen, P.-C.; Xi, K. Rheological and mechanical properties of microfine-cement-based grouts mixed with microfine fly ash, colloidal nanosilica and superplasticizer. Constr. Build. Mater. 2019, 212, 10–18. [Google Scholar] [CrossRef]
- Liu, S.; Li, Z.; Li, Y.; Cao, W. Strength properties of Bayer red mud stabilized by lime-fly ash using orthogonal experiments. Constr. Build. Mater. 2018, 166, 554–563. [Google Scholar] [CrossRef]
- Liu, Y.; Li, Y.; Jiang, G. Orthogonal experiment on performance of mortar made with dune sand. Constr. Build. Mater. 2020, 264, 120254. [Google Scholar] [CrossRef]
- Ministry of Transport of the People’s Public of China. Test Methods of Cement and Concrete for Highway Engineering (JTG E30-2005); Ministry of Transport of the People’s Public of China: Beijing, China, 2005.
- China Association for Engineering Construction Standardization. Technical Specification for Road Semi-Flexible Pavement (T\CECS G: D51-01-2019); China Association for Engineering Construction Standardization: Beijing, China, 2019. [Google Scholar]
- Goergens, J.; Manninger, T.; Goetz-Neunhoeffer, F. In-situ XRD study of the temperature-dependent early hydration of calcium aluminate cement in a mix with calcite. Cem. Concr. Res. 2020, 136, 106160. [Google Scholar] [CrossRef]
- Gastaldi, D.; Paul, G.; Marchese, L.; Irico, S.; Boccaleri, E.; Mutke, S.; Buzzi, L.; Canonico, F. Hydration products in sulfoaluminate cements: Evaluation of amorphous phases by XRD/solid-state NMR. Cem. Concr. Res. 2016, 90, 162–173. [Google Scholar] [CrossRef]
- Tang, S.; He, Z.; Cai, X.; Cai, R.; Zhou, W.; Li, Z.; Shao, H.; Wu, T.; Chen, E. Volume and surface fractal dimensions of pore structure by NAD and LT-DSC in calcium sulfoaluminate cement pastes. Constr. Build. Mater. 2017, 143, 395–418. [Google Scholar] [CrossRef]
- Beddoe, R.; Setzer, M. Phase transformations of water in hardened cement paste a low-temperature DSC investigation. Cem. Concr. Res. 1990, 20, 236–242. [Google Scholar] [CrossRef]
- Jose, A.; Nivitha, M.; Krishnan, M.; Robinson, R. Characterization of cement stabilized pond ash using FTIR spectroscopy. Constr. Build. Mater. 2020, 263, 120136. [Google Scholar] [CrossRef]
- Sureshkumar, M.S.; Filippi, S.; Polacco, G.; Kazatchkov, I.; Stastna, J.; Zanzotto, L. Internal structure and linear viscoelastic properties of EVA/asphalt nano-composites. Eur. Polym. J. 2010, 46, 621–633. [Google Scholar] [CrossRef] [Green Version]


| Stability | Setting Time (Min) | Flexural Strength (MPa) | Compressive Strength (MPa) | |||
|---|---|---|---|---|---|---|
| Initial Setting | Permanent Setting | 3d | 28d | 3d | 28d | |
| Qualification | 170 | 210 | 5.7 | 8.9 | 30 | 53.6 |
| Water Reduction (%) | Density (g/cm3) | Chloride Ion Content (%) | Alkali Content (%) | Bleeding Rate (%) | Compressive Strength Ratio (%) | |
|---|---|---|---|---|---|---|
| 7d | 28d | |||||
| 21.2 | 1.031 | 0.21 | 3.5 | 30 | 150 | 135 |
| Setting Time (Min) | Fineness (%) | Water Content (%) | 28d Compressive Strength Ratio (%) | 1d Compressive Strength (MPa) | |
|---|---|---|---|---|---|
| Initial Setting | Permanent Setting | ||||
| 2–3 | 8–10 | 11.6 | 1.7 | 75 | 9 |
| Chemical Composition | Fineness | |||||
|---|---|---|---|---|---|---|
| Magnesium Oxide (%) | Water Content (%) | Total Alkali Content (%) | Chloride Ion (%) | Specific Surface Area (m2·kg−1) | 0.08 mm Material Retained (%) | 1.25 mm Material Retained (%) |
| 2.661 | 0.80 | 0.15 | 0.01 | 333 | 7.0 | 0.31 |
| Particle Size (nm) | Specific Surface Area (m2/g) | Bulk Density (g/cm3) | Purity (%) | Appearance |
|---|---|---|---|---|
| 15 | 600 | 0.21 | 99.8 | White grainy |
| Level | Water–Cement Ratio | Expansion Agent (%) | Water-Reducing Agent (%) | Accelerating Agent (%) |
|---|---|---|---|---|
| I | 0.50 | 6 | 1.0 | 1.5 |
| II | 0.53 | 7 | 1.2 | 2.0 |
| III | 0.56 | 8 | 1.4 | 2.5 |
| IV | 0.60 | 9 | 1.6 | 3.0 |
| No. | Water–Cement Ratio | Expansion Agent (%) | Water-Reducing Agent (%) | Accelerating Agent (%) |
|---|---|---|---|---|
| 1 | 0.50 | 6 | 1.0 | 1.5 |
| 2 | 0.50 | 7 | 1.2 | 2.0 |
| 3 | 0.50 | 8 | 1.4 | 2.5 |
| 4 | 0.50 | 9 | 1.6 | 3.0 |
| 5 | 0.53 | 8 | 1.0 | 2.0 |
| 6 | 0.53 | 9 | 1.2 | 1.5 |
| 7 | 0.53 | 6 | 1.4 | 3.0 |
| 8 | 0.53 | 7 | 1.6 | 2.5 |
| 9 | 0.56 | 9 | 1.0 | 2.5 |
| 10 | 0.56 | 8 | 1.2 | 3.0 |
| 11 | 0.56 | 7 | 1.4 | 1.5 |
| 12 | 0.56 | 6 | 1.6 | 2.0 |
| 13 | 0.60 | 7 | 1.0 | 3.0 |
| 14 | 0.60 | 6 | 1.2 | 2.5 |
| 15 | 0.60 | 9 | 1.4 | 2.0 |
| 16 | 0.60 | 8 | 1.6 | 1.5 |
| No. | Flowing Time (s) | Flexural Strength (MPa) | Compressive Strength (MPa) | Shrinkage Rate (%) | |||||
|---|---|---|---|---|---|---|---|---|---|
| 1-Day | 3-Day | 7-Day | 1-Day | 3-Day | 7-Day | 7-Day | 28-Day | ||
| 1 | 14.07 | 2.46 | 9.12 | 12.99 | 10.31 | 28.97 | 40.01 | 0.047 | 0.138 |
| 2 | 14.68 | 2.61 | 9.37 | 11.64 | 10.88 | 29.25 | 38.62 | 0.038 | 0.133 |
| 3 | 17.46 | 2.79 | 9.73 | 12.64 | 12.65 | 30.14 | 38.97 | 0.030 | 0.127 |
| 4 | 19.98 | 2.88 | 10.01 | 13.73 | 12.61 | 30.39 | 43.87 | 0.024 | 0.121 |
| 5 | 12.82 | 2.72 | 8.55 | 10.70 | 11.13 | 27.58 | 34.88 | 0.035 | 0.117 |
| 6 | 13.06 | 2.61 | 7.79 | 10.68 | 9.62 | 26.23 | 35.67 | 0.027 | 0.111 |
| 7 | 14.67 | 3.05 | 8.89 | 11.62 | 12.05 | 28.59 | 36.02 | 0.041 | 0.139 |
| 8 | 14.34 | 2.81 | 8.17 | 11.31 | 10.11 | 27.26 | 37.00 | 0.030 | 0.126 |
| 9 | 9.22 | 3.11 | 8.07 | 10.86 | 11.01 | 26.19 | 34.91 | 0.021 | 0.101 |
| 10 | 10.84 | 3.40 | 8.21 | 10.01 | 10.46 | 26.67 | 34.39 | 0.017 | 0.107 |
| 11 | 11.09 | 2.76 | 7.21 | 9.12 | 9.29 | 25.68 | 31.4 | 0.022 | 0.112 |
| 12 | 11.76 | 2.91 | 7.28 | 9.96 | 9.38 | 26.01 | 35.39 | 0.031 | 0.119 |
| 13 | 8.78 | 2.67 | 6.17 | 8.24 | 8.97 | 21.76 | 28.76 | 0.027 | 0.109 |
| 14 | 9.96 | 2.31 | 5.48 | 7.06 | 7.29 | 21.75 | 28.70 | 0.026 | 0.106 |
| 15 | 9.85 | 2.21 | 5.25 | 6.94 | 6.11 | 20.69 | 26.54 | 0.010 | 0.096 |
| 16 | 10.46 | 2.03 | 5.01 | 6.54 | 5.68 | 20.67 | 27.4 | 0.008 | 0.096 |
| Index | Water–Cement Ratio | Water-Reducing Agent | Accelerating Agent | Expansion Agent | ||
|---|---|---|---|---|---|---|
| Fluidity (Flowing time) (s) | Average value | level I | 16.55 | 11.22 | 12.17 | 12.62 |
| level II | 13.72 | 11.95 | 12.28 | 13.09 | ||
| level III | 10.73 | 13.27 | 12.57 | 12.90 | ||
| level IV | 9.76 | 14.14 | 13.58 | 13.03 | ||
| Range | 6.79 | 2.91 | 1.40 | 0.47 | ||
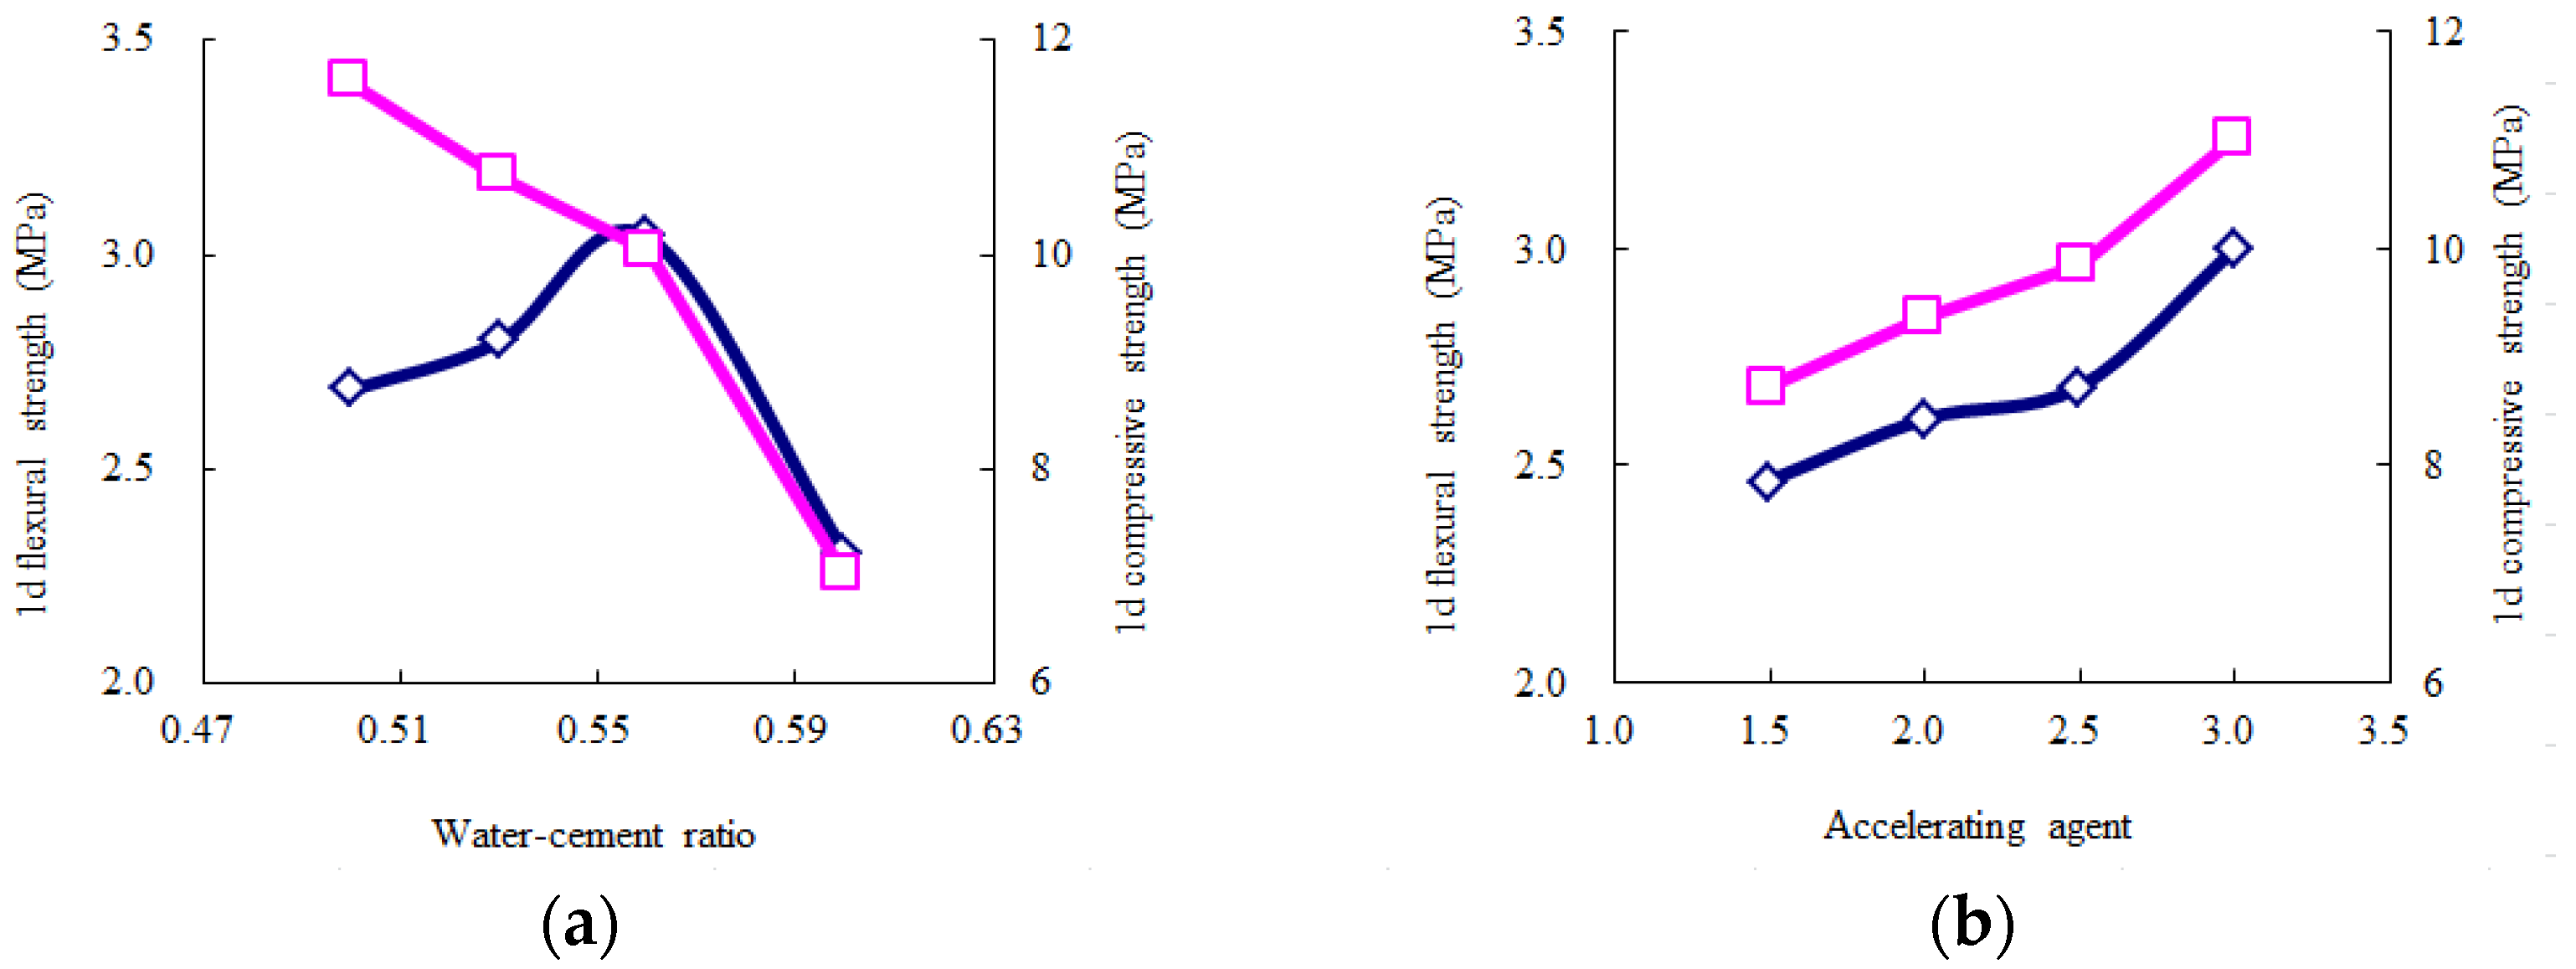
| 1-day flexural strength (MPa) | Average value | level I | 2.69 | 2.74 | 2.47 | 2.68 |
| level II | 2.80 | 2.73 | 2.61 | 2.71 | ||
| level III | 3.04 | 2.70 | 2.68 | 2.74 | ||
| level IV | 2.30 | 2.66 | 3.00 | 2.70 | ||
| Range | 0.74 | 0.09 | 0.54 | 0.06 | ||
| 1-day compressive strength (MPa) | Average value | level I | 11.61 | 10.36 | 8.73 | 9.76 |
| level II | 10.73 | 9.72 | 9.37 | 10.17 | ||
| level III | 10.04 | 10.02 | 9.86 | 9.98 | ||
| level IV | 7.01 | 9.44 | 11.02 | 9.83 | ||
| Range | 4.60 | 0.91 | 2.30 | 0.41 | ||
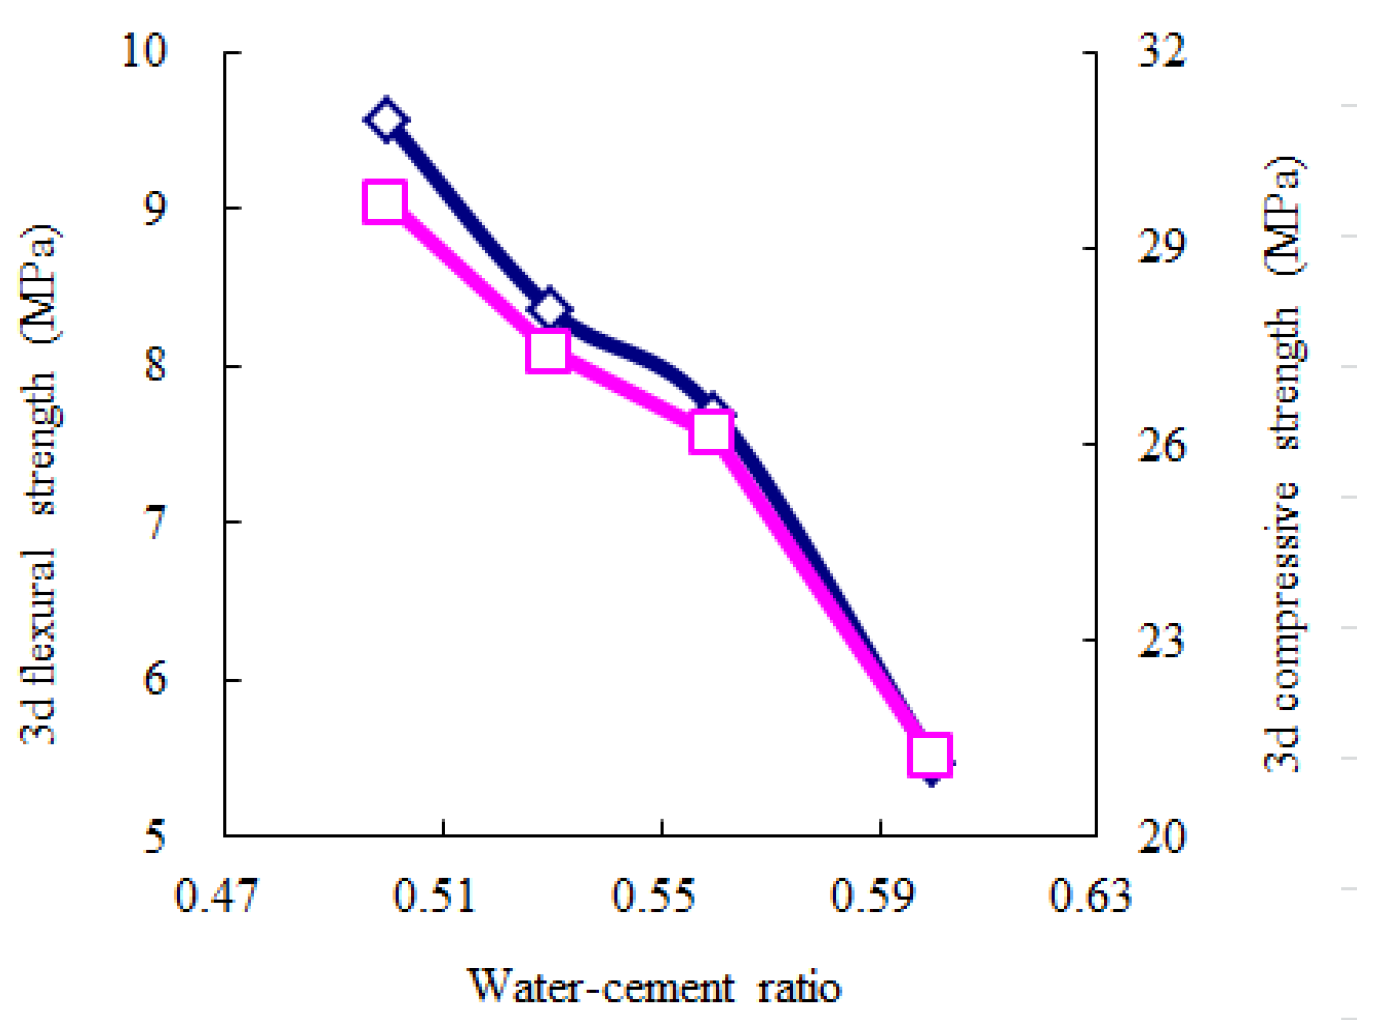
| 3-day flexural strength (MPa) | Average value | level I | 9.56 | 7.98 | 7.28 | 7.69 |
| level II | 8.35 | 7.77 | 7.61 | 8.10 | ||
| level III | 7.69 | 7.77 | 7.72 | 7.88 | ||
| level IV | 5.48 | 7.62 | 8.32 | 7.78 | ||
| Range | 4.08 | 0.36 | 1.04 | 0.40 | ||
| 3-day compressive strength (MPa) | Average value | level I | 29.69 | 26.13 | 25.39 | 26.33 |
| level II | 27.41 | 26.01 | 25.88 | 25.99 | ||
| level III | 26.13 | 26.28 | 26.10 | 26.27 | ||
| level IV | 21.22 | 26.08 | 26.85 | 25.88 | ||
| Range | 8.47 | 0.27 | 1.47 | 0.46 | ||
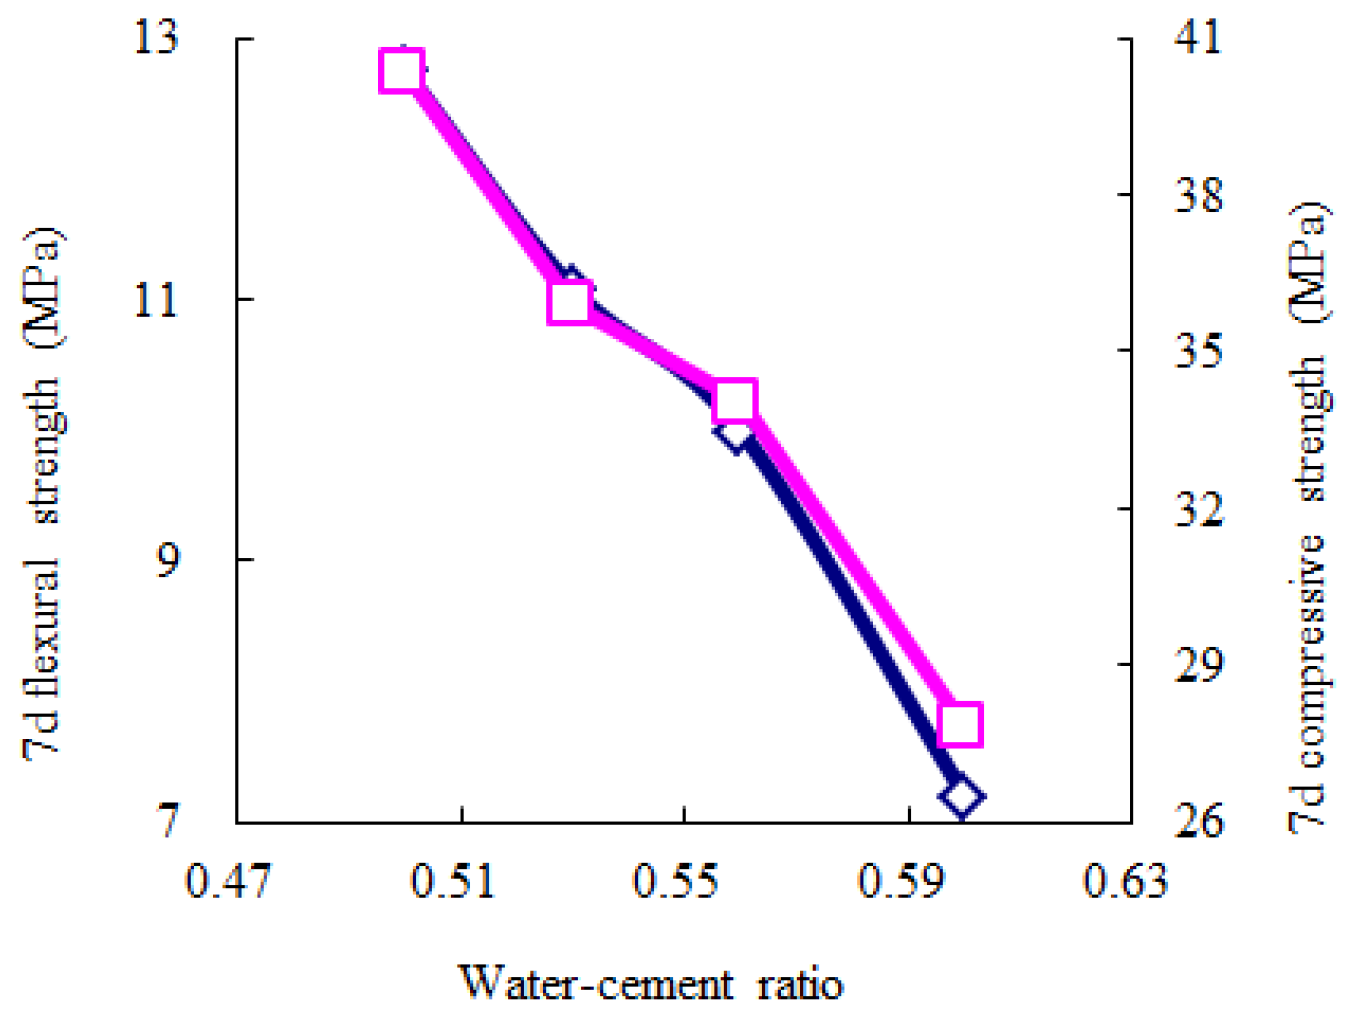
| 7-day flexural strength (MPa) | Average value | level I | 12.75 | 10.70 | 9.83 | 10.41 |
| level II | 11.08 | 10.02 | 9.81 | 10.61 | ||
| level III | 9.99 | 10.08 | 10.25 | 9.97 | ||
| level IV | 7.20 | 10.39 | 10.90 | 10.55 | ||
| Range | 5.56 | 0.68 | 1.09 | 0.64 | ||
| 7-day compressive strength (MPa) | Average value | level I | 40.37 | 34.64 | 33.62 | 35.03 |
| level II | 35.89 | 34.40 | 33.86 | 35.23 | ||
| level III | 34.02 | 33.23 | 34.51 | 33.91 | ||
| level IV | 27.85 | 35.92 | 35.76 | 35.25 | ||
| Range | 12.51 | 2.68 | 2.14 | 1.34 | ||
| 7-day shrinkage rate (%) | Average value | level I | 0.035 | 0.033 | 0.026 | 0.036 |
| level II | 0.033 | 0.028 | 0.029 | 0.030 | ||
| level III | 0.023 | 0.026 | 0.027 | 0.023 | ||
| level IV | 0.018 | 0.023 | 0.027 | 0.021 | ||
| Range | 0.017 | 0.009 | 0.003 | 0.016 | ||
| 28-day shrinkage rate (%) | Average value | level I | 0.130 | 0.116 | 0.114 | 0.126 |
| level II | 0.123 | 0.115 | 0.116 | 0.122 | ||
| level III | 0.110 | 0.119 | 0.115 | 0.112 | ||
| level IV | 0.102 | 0.116 | 0.119 | 0.107 | ||
| Range | 0.028 | 0.004 | 0.005 | 0.018 | ||
| Property Index | Water–Cement Ratio | Expansion Agent | Water-Reducing Agent | Accelerating Agent |
|---|---|---|---|---|
| Fluidity (flow time) | ✔✔ | ✔ | ✔ | |
| 1-day flexural strength | ✔✔ | ✔ | ||
| 1-day compressive strength | ✔✔ | ✔ | ||
| 3-day flexural strength | ✔✔ | |||
| 3-day compressive strength | ✔✔ | |||
| 7-day flexural strength | ✔✔ | |||
| 7-day compressive strength | ✔✔ | |||
| 7-day dry-shrinkage ratio | ✔✔ | ✔✔ | ✔ | |
| 28-day dry-shrinkage ratio | ✔✔ | ✔ |
| No. | Water–Cement Ratio | Water-Reducing Agent | Accelerating Agent | Expansion Agent |
|---|---|---|---|---|
| Y-1 | 0.53 | 1.0% | 2.0% | 9% |
| Y-2 | 0.53 | 1.0% | 2.5% | 9% |
| Y-3 | 0.56 | 1.2% | 2.0% | 8% |
| Y-4 | 0.56 | 1.2% | 2.5% | 8% |
| No. | Fluidity (s) | Flexural Strength (MPa) | Compressive Strength (MPa) | Shrinkage Rate (%) | |||||
|---|---|---|---|---|---|---|---|---|---|
| 1-Day | 3-Day | 7-Day | 1-Day | 3-Day | 7-Day | 7-Day | 28-Day | ||
| Y-1 | 12.86 | 2.69 | 8.35 | 11.10 | 10.82 | 27.11 | 35.89 | 0.018 | 0.121 |
| Y-2 | 13.11 | 2.89 | 8.46 | 11.21 | 11.39 | 27.29 | 35.91 | 0.027 | 0.118 |
| Y-3 | 10.01 | 3.13 | 8.06 | 10.35 | 10.29 | 25.86 | 34.17 | 0.019 | 0.101 |
| Y-4 | 10.38 | 3.43 | 8.18 | 10.66 | 10.91 | 26.02 | 34.38 | 0.021 | 0.108 |
| Requirement | 9–13 | -- | -- | ≥ 2 | -- | -- | 10–30 | -- | <0.5 |
| Nona-SiO2 Content | Fluidity (s) | Flexural Strength (MPa) | Compressive Strength (MPa) | Shrinkage Rate (%) | |||||
|---|---|---|---|---|---|---|---|---|---|
| 1-Day | 3-Day | 7-Day | 1-Day | 3-Day | 7-Day | 7-Day | 28-Day | ||
| 0% | 10.38 | 3.43 | 8.18 | 10.66 | 10.91 | 26.02 | 34.38 | 0.019 | 0.108 |
| 1% | 10.61 | 3.77 | 8.46 | 10.68 | 12.18 | 27.16 | 35.01 | 0.017 | 0.111 |
| 2% | 11.29 | 3.98 | 8.59 | 10.76 | 13.01 | 28.38 | 34.69 | 0.021 | 0.108 |
| 3% | 12.89 | 4.11 | 8.68 | 10.61 | 14.68 | 29.02 | 34.61 | 0.019 | 0.113 |
| Standard | 9–13 | -- | -- | ≥ 2 | -- | -- | 10–30 | -- | <0.5 |
| Nona-SiO2 Content | COV (%) | ||||||||
|---|---|---|---|---|---|---|---|---|---|
| Fluidity | Flexural Strength | Compressive Strength | Shrinkage Rate | ||||||
| 1-Day | 3-Day | 7-Day | 1-Day | 3-Day | 7-Day | 7-Day | 28-Day | ||
| 0% | 5.29 | 8.63 | 3.31 | 4.38 | 7.48 | 4.88 | 3.29 | 7.38 | 2.31 |
| 1% | 7.31 | 3.52 | 4.87 | 3.45 | 4.62 | 6.20 | 5.13 | 10.89 | 4.98 |
| 2% | 4.26 | 5.96 | 6.66 | 2.96 | 9.04 | 6.34 | 5.67 | 5.02 | 3.70 |
| 3% | 8.60 | 7.29 | 5.88 | 3.77 | 5.11 | 3.07 | 4.74 | 9.97 | 2.11 |
| Requirement | <10 | <10 | <15 | ||||||
Publisher’s Note: MDPI stays neutral with regard to jurisdictional claims in published maps and institutional affiliations. |
© 2021 by the authors. Licensee MDPI, Basel, Switzerland. This article is an open access article distributed under the terms and conditions of the Creative Commons Attribution (CC BY) license (https://creativecommons.org/licenses/by/4.0/).
Share and Cite
Ren, J.; Zhao, Z.; Xu, Y.; Wang, S.; Chen, H.; Huang, J.; Xue, B.; Wang, J.; Chen, J.; Yang, C. High-Fluidization, Early Strength Cement Grouting Material Enhanced by Nano-SiO2: Formula and Mechanisms. Materials 2021, 14, 6144. https://doi.org/10.3390/ma14206144
Ren J, Zhao Z, Xu Y, Wang S, Chen H, Huang J, Xue B, Wang J, Chen J, Yang C. High-Fluidization, Early Strength Cement Grouting Material Enhanced by Nano-SiO2: Formula and Mechanisms. Materials. 2021; 14(20):6144. https://doi.org/10.3390/ma14206144
Chicago/Turabian StyleRen, Jiaolong, Zedong Zhao, Yinshan Xu, Siyuan Wang, Haiwei Chen, Jiandong Huang, Boxin Xue, Jian Wang, Jingchun Chen, and Chengxu Yang. 2021. "High-Fluidization, Early Strength Cement Grouting Material Enhanced by Nano-SiO2: Formula and Mechanisms" Materials 14, no. 20: 6144. https://doi.org/10.3390/ma14206144