Abstract
Cr-doped UO2 as a modern nuclear fuel type has been demonstrated to increase the in-reactor fuel performance compared to conventional nuclear fuels. Little is known about the long-term stability of spent Cr-doped UO2 nuclear fuels in a deep geological disposal facility. The investigation of suitable model materials in a step wise bottom-up approach can provide insights into the corrosion behavior of spent Cr-doped nuclear fuels. Here, we present new wet chemical approaches providing the basis for such model systems, namely co-precipitation and wet coating. Both were successfully tested and optimized, based on detailed analyses of all synthesis steps and parameters: Cr-doping method, thermal treatment, reduction of U3O8 to UO2, green body production, and pellet sintering. Both methods enable the production of suitable model systems with a similar microstructure and density as a reference sample from AREVA. In comparison with results from the classical powder route, similar trends upon grain size and lattice parameter were determined. The results of this investigation highlight the significance of subtly different synthesis routes on the properties of Cr-doped UO2 ceramics. They enable a reproducible tailor-made well-defined microstructure, a homogeneous doping, for example, with lanthanides or alpha sources, the introduction of metallic particles, and a dust-free preparation.
Keywords:
UO2; doping; wet chemical preparation; chromium; spent nuclear fuel; ceramics; model systems 1. Introduction
The introduction of modern nuclear fuels such as those including Cr-, Al-, and Si- doped types [1,2,3] has led to a significant improvement in the performance of conventional light water reactors (LWR) over traditional non-doped forms. Specifically, modern fuels provide a reduction in fuel swelling and amelioration in heat transfer, leading to higher burn up and power output [4,5,6,7]. The physical origin behind these enhanced properties, in the case of the Cr-doped fuels, is due to the induced coarse-grained microstructure with a narrow grain size distribution. This increases the retention of gaseous fission products inside the fuel during operation due to improved diffusion behavior compared to conventional LWR fuels [8]. During the production of Cr-doped fuels, the UO2 matrix can only incorporate Cr in trace amounts of up to approximately 1500 ppm [9,10]. Concurrently, some of the Cr precipitates as a separate phase typically located at the grain boundaries of the UO2 matrix [8,11]. The introduction of modern, Cr-doped, nuclear fuels at present, is still a relatively recent addition to current reactor fleets. Subsequently, key questions remain regarding their properties and behavior, making them a topical focus of recent fuel investigations.
Similar to conventional UO2-based LWR fuels, spent modern fuels are likely to be disposed of in deep geological repositories, which are considered the most appropriate disposal option for high level nuclear waste [12,13,14]. However, knowledge gaps still exist on the stability of the spent modern fuels at conditions of a deep geological waste repository. Spent modern fuels, like all UO2 based spent fuels, are complex multi-phase ceramics that are associated with high beta- and gamma-radiation fields. This makes unravelling the various concurring dissolution mechanisms directly from experiments with spent modern fuels challenging.
Model systems like SIMFUEL were first developed to mimic all aspects of certain spent nuclear fuel types except for the radiation fields [15,16]. However, it became apparent that the sheer complexity of SNF varieties could not be simplistically captured in multi-component systems like SIMFUEL. This led to the utilization of specific-component model system studies that focused on single effects tailored to conditions relevant to a certain SNF type/variety [17,18,19,20]. When combined systematically, such studies allow for a greater in-depth understanding that can create a near holistic viewpoint of a specific SNF type under certain relevant conditions. Critical to such an approach is the development of accurate model systems that use reliable and replicable methods. These are well established for traditional UO2 fuels, but less so for modern fuels such as Cr doped UO2. Recent studies [9,21,22] on Cr doped UO2 have typically utilized powder-milling methods involving UO2 and Cr2O3 powders. Although these are more time-efficient in execution than methods such as sol-gel or co-precipitation, they often result in less homogeneous samples. In terms of data interpretation and analysis, this is a critical issue since the addition of ppm levels of Cr will result in subtle measurable effects occurring that will not be representative under inhomogeneous conditions. Accordingly, to follow a systematic approach in the investigation of modern fuels from simple to multi-component systems, consistent and more efficient preparation routes need to be developed, other than that of powder mixing, for example [23]. By design, such methods should be transferable to other homogeneous additions in UO2 ceramics, for instance, Pu or lanthanides in the context of MOX and SNF studies, respectively.
Interest in the incorporation of Cr into UO2 has recently expanded from that of applied SNF related to a more general inorganic structural-chemical related, as the mechanism for incorporation has been called into question by Sun et al. (2020) [24]. It has been typically presumed that the use of Cr2O3 coupled with its stable electronic configuration ([Ar]3d3) results in the trivalent state solely entering the ceramic, akin to the behavior of Ln3+ in UO2. However, a recent investigation by [24] using ab initio simulations and re-evaluated XANES measurements by Mieszczynski et al. (2014) [25] argued that instead of Cr3+ within the UO2 fuel matrix, Cr exists as Cr2+ with U5+ and an oxygen vacancy surrounding it. Further calculations by Cooper et al. (2018) argue that under high temperatures, Cr can exist monovalently with excess oxygen vacancies facilitating this [26]. Several investigations have attempted to resolve the issue through X-ray absorption spectroscopy (XAS) on bulk samples. However, the low solubility of Cr results in variable amounts of Cr2O3 precipitates forming along the grain boundary intersections. This results in convoluted measurements of which true observation of Cr inclusion in the UO2 matrix and not grain boundary and precipitate regions becomes difficult. Although [25] argued that Cr2+ is observable, it is not clear whether it is from the matrix and/or the grain boundary/Cr precipitate regions. Notably and relevant to the present investigation, is that the aforementioned experimental studies have typically relied upon powder-milling produced Cr doped UO2 samples. Nevertheless, the chemical state of Cr within the UO2 lattice experimentally can still be considered an open question and for it to be answered, appropriate and representative model systems are required. Therefore, the usage of the term “Cr2O3” for structurally incorporated chromium within this work is only for the purpose of consistency with the previous literature.
The transformation of ammonium di-uranate ((NH4)2U2O7, ADU) to U3O8 and finally to UO2 is a well-established wet chemical route leading to good sinterability of UO2 pellets. In addition, earlier studies by Hung et al. (2001) [27] showed that the route can be optimized to avoid lubricants (e.g., Zn-stearate) or sintering aids during compaction and sintering, providing the potential for single effect studies, even when only trace amounts of additional elements are used. Here, we present two new, wet chemical approaches for the preparation of Cr-doped UO2 based model systems for single effect dissolution studies related to modern fuels. A parameter variation study was carried out including optimization of powder synthesis, green body compaction, and variation of the oxygen potential. Detailed investigations were carried out on the effects of the individual parameters on the microstructure, density, grain growth of the ceramics, and the structural uptake of Cr into UO2 as well as the formation of separate Cr-rich precipitates. The effect of adding chromium nitrate at different stages of the synthesis route to UO2 was tested and compared to results of the common powder syntheses. Finally, the results were compared to pure UO2 pellets, produced within the framework of this work, used as reference for the single effect studies and to an industrially produced, chromium doped UO2 pellet made by AREVA used as the reference material for fresh nuclear fuel.
2. Materials and Methods
2.1. Preparation of a Cr-Doped UO2 Based Ceramic
The preparation was adapted from the general procedure of [28] for the wet chemical preparation of ammonium di-uranate ((NH4)2U2O7, ADU) from uranyl nitrate solution. The main steps: (1) powder preparation; (2) Cr-doping; and (3) preparation of ceramic pellets and their optimization, are described in detail below. Two different methods for the chromium doping of the pellets were applied: (1) a co-precipitation method (CPM) and (2) a wet coating method (WCM) as adapted from [29,30,31].
2.1.1. Preparation of Pure UO2-Powder
The precursor powders for all pellets presented in this work were produced by precipitation of ADU from an aqueous solution containing 2 M uranyl nitrate (UO2(NO3)2, Merck, p.a.) using a 16.5 M ammonia solution (Merck). The reaction was carried out with an excess of ammonia of at least 300% to adjust the equilibrium to the side of the products, according to:
2 UO2(NO3)2 + 6 NH3 + 3 H2O → (NH4)2U2O7 + 4 (NH4)NO3
The uranyl nitrate solution was stepwise pipetted into the ammonia solution, which was constantly mixed by a magnetic stirrer. After complete addition of the solution, the mixture was stirred for 2 h. This led to the formation of ADU as a yellow precipitate, which was then separated from the solution by centrifuging for 5 min and afterward decanting the solution. The precipitate was then washed three times with high purity water to remove excess (NH4)NO3 and NH3. During the final washing step, water was replaced with ethanol and the powder was left to dry. ICP-MS measurements of the supernatant solution showed that about 99% of the uranium from the stock solution was precipitated as ADU.
The dried ADU powder was calcined under air for denitrification, dehydration, and transformation to U3O8 using a box furnace (Carbolite CWF 13/5, Neuhausen, Germany). In order to optimize the influence of the temperature on the decomposition, a series of ADU-powders was prepared and calcined at temperatures of 450, 600, 700, 800, and 900 °C, respectively, for 5 h. The uncertainties of the temperature determination for this step of thermal treatment are ±5° C, based on the manufacturer’s information.
The resulting U3O8 powder was reduced to stoichiometric UO2 via a 5 h thermal treatment in a tube furnace (ENTECH ESTF 50-18-SP-VK, Ängelholm, Sweden) under a 4% H2—96% Ar mixture (HYTEC). The completeness of the reduction as well as the effect of temperature on the final density of the sintered pellets was investigated by performing the reduction at three different temperatures, namely 600, 800, and 900 °C. Uncertainties for the temperature determination of both steps are ±5° C each, based on the manufacturer’s information.
2.1.2. Cr Doping
Depending on the doping method, chromium was added at different stages of the ceramic’s preparation. For the powders produced via the CPM approach, the desired amount of chromium was added to the uranyl nitrate solution as 0.02 M chromium(III) nitrate nonahydrate solution (EMSURE®, M-Clarity™ quality level = MQ300). During the precipitation of ADU (Equation (1)), chromium is quantitatively precipitated as Cr(OH)3 according to
Cr(NO3)3 + 3 NH3 + 3 H2O → 3 (NH4)NO3 + Cr(OH)3
Materials with doping levels of 1000 and 2500 ppm Cr2O3 were precipitated and thermally treated in the same way as the pure ADU at 600 °C for calcination and reduction, respectively.
For the WCM preparation, a pure UO2 from the wet chemical route according to Section 2.1.1. was used after a complete thermal treatment at 600 °C for both steps. The UO2 was wet coated with a chromium nitrate nonahydrate solution (0.02 M) in appropriate amounts corresponding to initial doping levels of 1000, 1500, and 2500 ppm Cr2O3. The uncertainty of the initial doping level was derived from the errors of the balance and pipetting devices as below 2%.
In order to distribute the Cr homogeneously on the grain surfaces, suprapure water was admixed until the complete powder was covered with liquid. After intensive stirring, this mixture was dried and subjected to the same thermal treatment as the original pure UO2. Earlier studies showed that about 20 to 40% of the chromium initially added was lost to the furnace atmosphere during sintering, so all data described here are related to the initial doping level [9].
2.1.3. Preparation of Ceramic Pellets
In order to obtain disk shaped green bodies 10 mm diameter, about 1 g of the calcined powders were compacted for 10 s with a tungsten carbide piston of an uniaxial press (Hahn & Kolb, MP12, Stuttgart, Germany), without any addition of a binder or lubricant. The optimum preparation of the green body was tested according to an approach of Bukaemskiy et al. (2009) and Babelot et al. (2017) [32,33], who in detail tested the compressibility and sinterability of oxide ceramic powders synthesized by different wet chemical methods. Within a log unit (compaction) pressure versus relative green density plot, they identified three linear regions, the low, intermediate, and high pressure region and an optimal pressure corresponding to the highest sintered density, located in the upper part of the intermediate-pressure region. In the present work, the compressibility and sinterability of the studied powders were tested in the compaction pressure region from 190 to 760 MPa to identify the optimum compaction pressure. Uncertainty of the pressure during compaction was estimated due to the setup of the press to be 0.1 MPa. After pressure release, the green body was carefully pressed out of the die-plate using the lower piston of the uniaxial press and placed in a corundum crucible for subsequent sintering. The density of an ideal UO2 crystal as directly calculated from lattice parameters (10.958 g/cm3), the mass of UO2 of the green body, and its height were used for the calculation of the green density [34]. Due to the low doping levels, all green densities and sintered densities refer to an ideal pure UO2 crystal.
For the sintering of the pellets, the crucibles with the green bodies were placed in the hot zone of a horizontal tube furnace (ENTECH ESTF 50-18-SP-VK, Ängelholm, Sweden). The pellets were sintered at 1700 ± 5 °C for 10 h. Heating rates were 4 °C/min, and cooling rates were 6 °C/min. During the sintering process, the furnace was flushed with 1600 mL/min of a 4% H2–96% Ar mixture, or with the less reducing mixture resulting from mixing 1567 mL/min of 4% H2–96% Ar and 33 mL/min of 1% H2–99% Ar. This leads to two different values of oxygen partial pressure during the sintering process. The required proportions of the gas mixtures were calculated beforehand to achieve the desired oxygen partial pressures. In addition, the oxygen partial pressure was monitored during the sintering process using a yttrium stabilized ZrO2 oxygen sensor.
Oxygen partial pressure (pO2) can also be expressed as relative partial molar Gibbs free energy of oxygen, or oxygen potential, PO2:
where G° is the standard free energy of O2; PO2 is the (pO2/p°); and p° is the standard pressure.
ΔG° = RT ln PO2
The oxygen potential for the 4% H2–96% Ar mixture was −510 kJ/mol O2, the less reducing mixture was prepared by mixing certain amounts of 4% H2–96% Ar with 1% H2–99% Ar to achieve an oxygen potential of −420 kJ/mol O2. As high purity gases were used, the uncertainty of the oxygen potential was less than 1%.
2.2. Characterization
2.2.1. Physical Properties
The densities of the pellets were determined by the geometrical method for the green bodies. The density of the sintered pellets and the closed porosity were measured by the hydrostatic weighing method in water. The open porosity was estimated via a penetration-immersion method [35,36] with hot paraffin (150 °C) as the impregnation fluid. The measurements were performed with a Mettler Toledo density determination kit in combination with a Mettler Toledo AT261 (Giessen, Germany) precision balance. The theoretical densities of the materials (ρT) were calculated from the results of the X-ray diffraction (XRD) measurements as described in [37]. All densities described later are relative densities, provided in percent of the theoretical density. Uncertainties of all determined densities are 2 sigma deviations and are provided in Table S1.
2.2.2. Crystal Structure
XRD analyses were performed with a D4 Endeavor diffractometer in Bragg–Brentano geometry (Bruker AXS GmbH, Karlsruhe, Germany) using Cu radiation (λ CuKα1 = 1.5405 Å) at a power setting of 40 kV and 40 mA. A linear silicon strip LynxEye detector (Bruker-AXS, Karlsruhe, Germany) was used to determine the crystal structure of the powder and pellet samples. The aperture of the motorized divergence slit was set to 0.3 mm and the receiving slit to 8.0 mm, respectively. XRD patterns were collected from the final pellets at ambient conditions in the 2Θ range from 10 to 120° using a step size of 0.01°/2Θ and a counting time of 2 s per step.
The structure of UO2 in different pellets was refined by the Rietveld method as implemented in the GSAS2 software [38,39]. The peak shapes were modeled using a pseudo-Voigt function and the background was estimated using a 12–18 term shifted Chebyschev function. The scale factor, detector zero-point, and lattice parameters were refined together with the peak profile parameters.
2.2.3. Microstructure
Surfaces of the sintered pellets were carefully polished with a Struers Rotopol 22/Struers Roto Force 4 polishing device (Ballerup, Denmark) using diamond pastes (up to 1 µm) and finally a colloidal Si-suspension (OP-S, 0.25 µm, Struers, Ballerup, Denmark) for further investigations of the pellets’ microstructure.
Microstructural observations on powders and ceramic pellets were carried out with an environmental scanning electron microscope (SEM, Quanta 200F, FEI, Eindhoven, The Netherlands) in low vacuum mode at a pressure of 60 Pa. Energy-dispersive X-ray spectroscopy (EDS) employing an Apollo X detector system (EDAX, Weiterstadt, Germany) was used to determine the chemical composition of the synthesized solids and to assess their chemical homogeneity. EDS spot analyses as well as EDS elemental mappings, to determine the spatial distribution of Cr, were carried out at 20 kV and a working distance of 10 mm. Image analyses of EDS mappings were applied using the software package Fiji (ImageJ, Bethesda, USA). To assess possible variations in the average grain size across the pellets, SEM images were taken along the diameter of the pellets in three fields: edge, midway, and center. The grain size was determined using the intercept method ASTM-E112-13 as described in the ASTM standards [40]. Uncertainties of the grain sizes are 2 sigma deviations and listed in Table S1 in supplementary materials.
3. Results
In the following, first, the optimization of the important steps for the preparation of Cr-doped UO2 ceramics is addressed. In the second part of the results section, a detailed parameter study of the consequences of Cr-doping upon the physical properties, crystal structure, and microstructure of the UO2 based ceramics is presented.
3.1. Optimisation of the Synthesis Route
3.1.1. Powder Preparation and Pellet Density: Pure UO2
Two important aspects of the powder preparation route were examined: (1) temperature, and (2) the corresponding powder reactivity during the production of the green body of the UO2 based ceramic including a variation of the pressure applied during green pellet preparation.
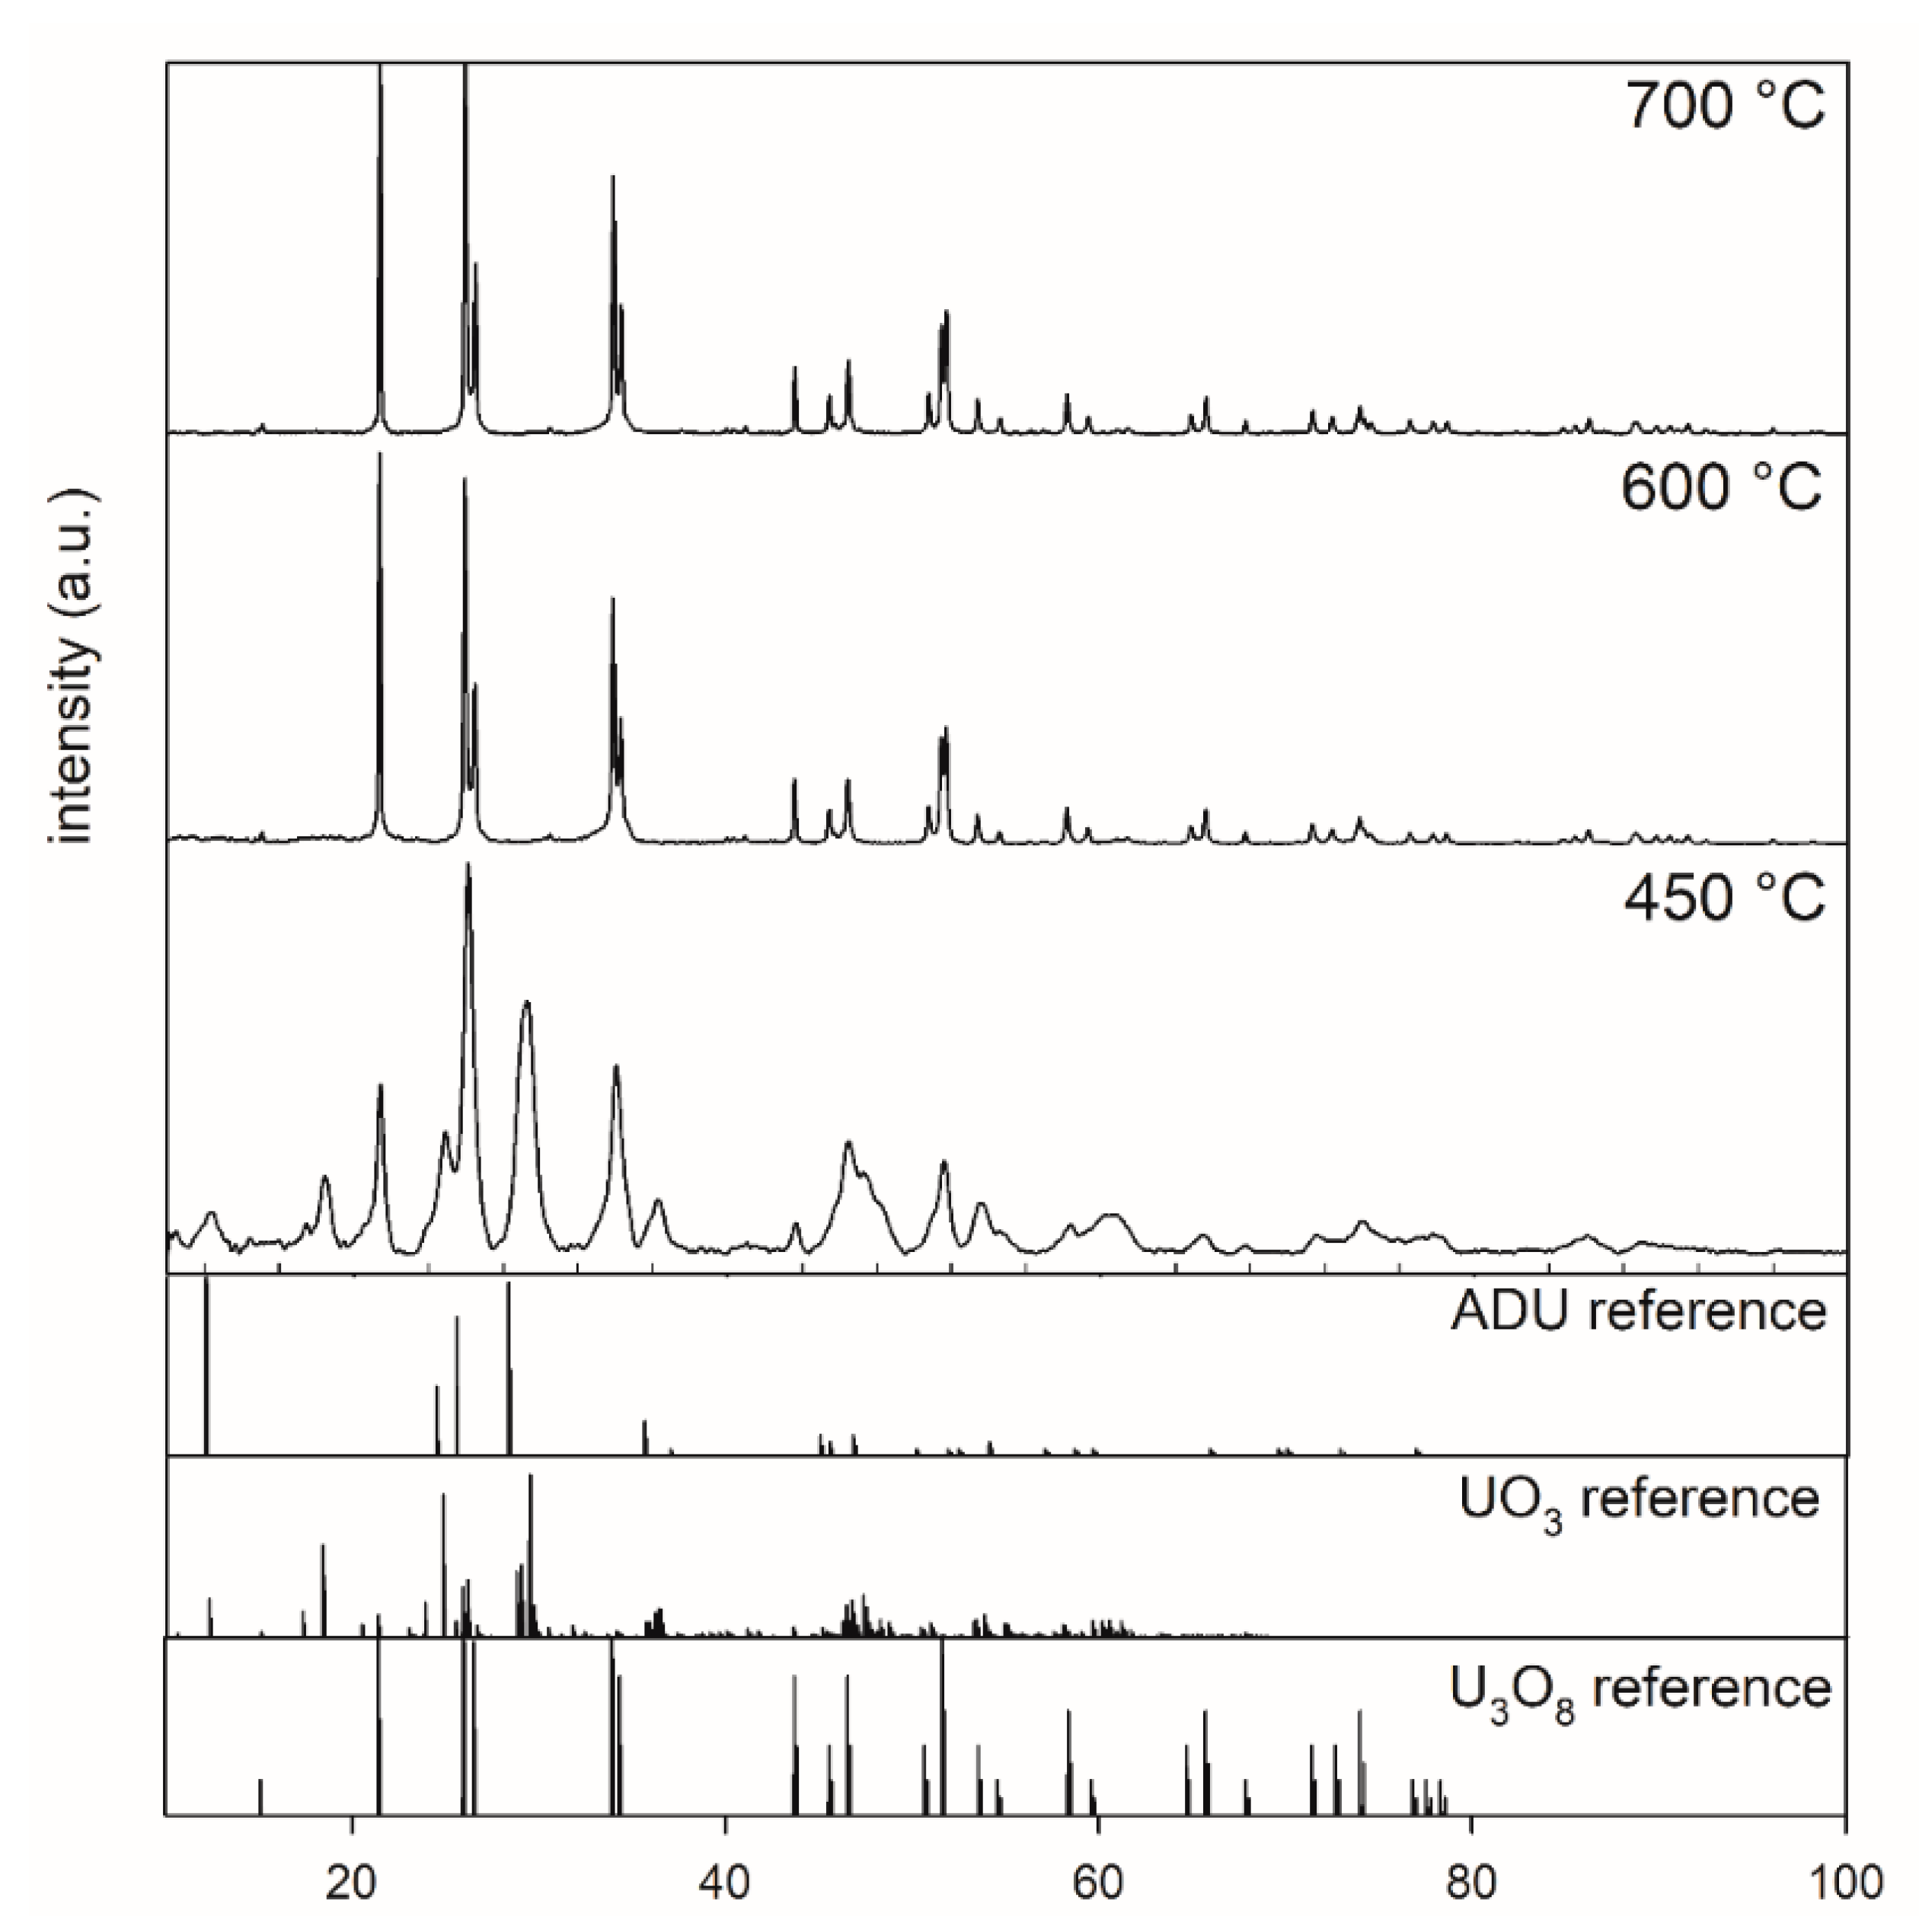
Figure 1 shows the XRD patterns of ADU powders after thermal treatment at 450, 600, and 700 °C for 5 h. Inspection of the XRD pattern for the 450 °C sample indicated that the sample did not completely transform to U3O8. Phase analysis indicated that this sample contained a mixture of U3O8, ADU, and UO3. The XRD patterns of powders calcined at temperatures higher than or equal to 600 °C showed a complete transformation from ADU to U3O8.
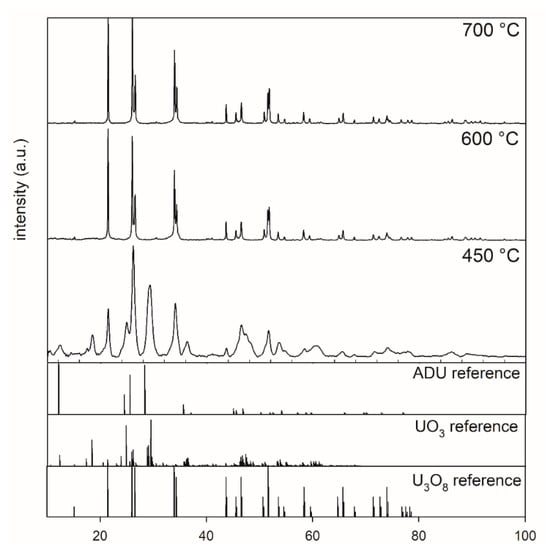
Figure 1.
XRD patterns of powders after calcination at 450 °C, 600 °C, and 700 °C collected between 10° and 100° 2 theta, highlighting the effect of calcination of ADU (5 h, air) at different temperatures.
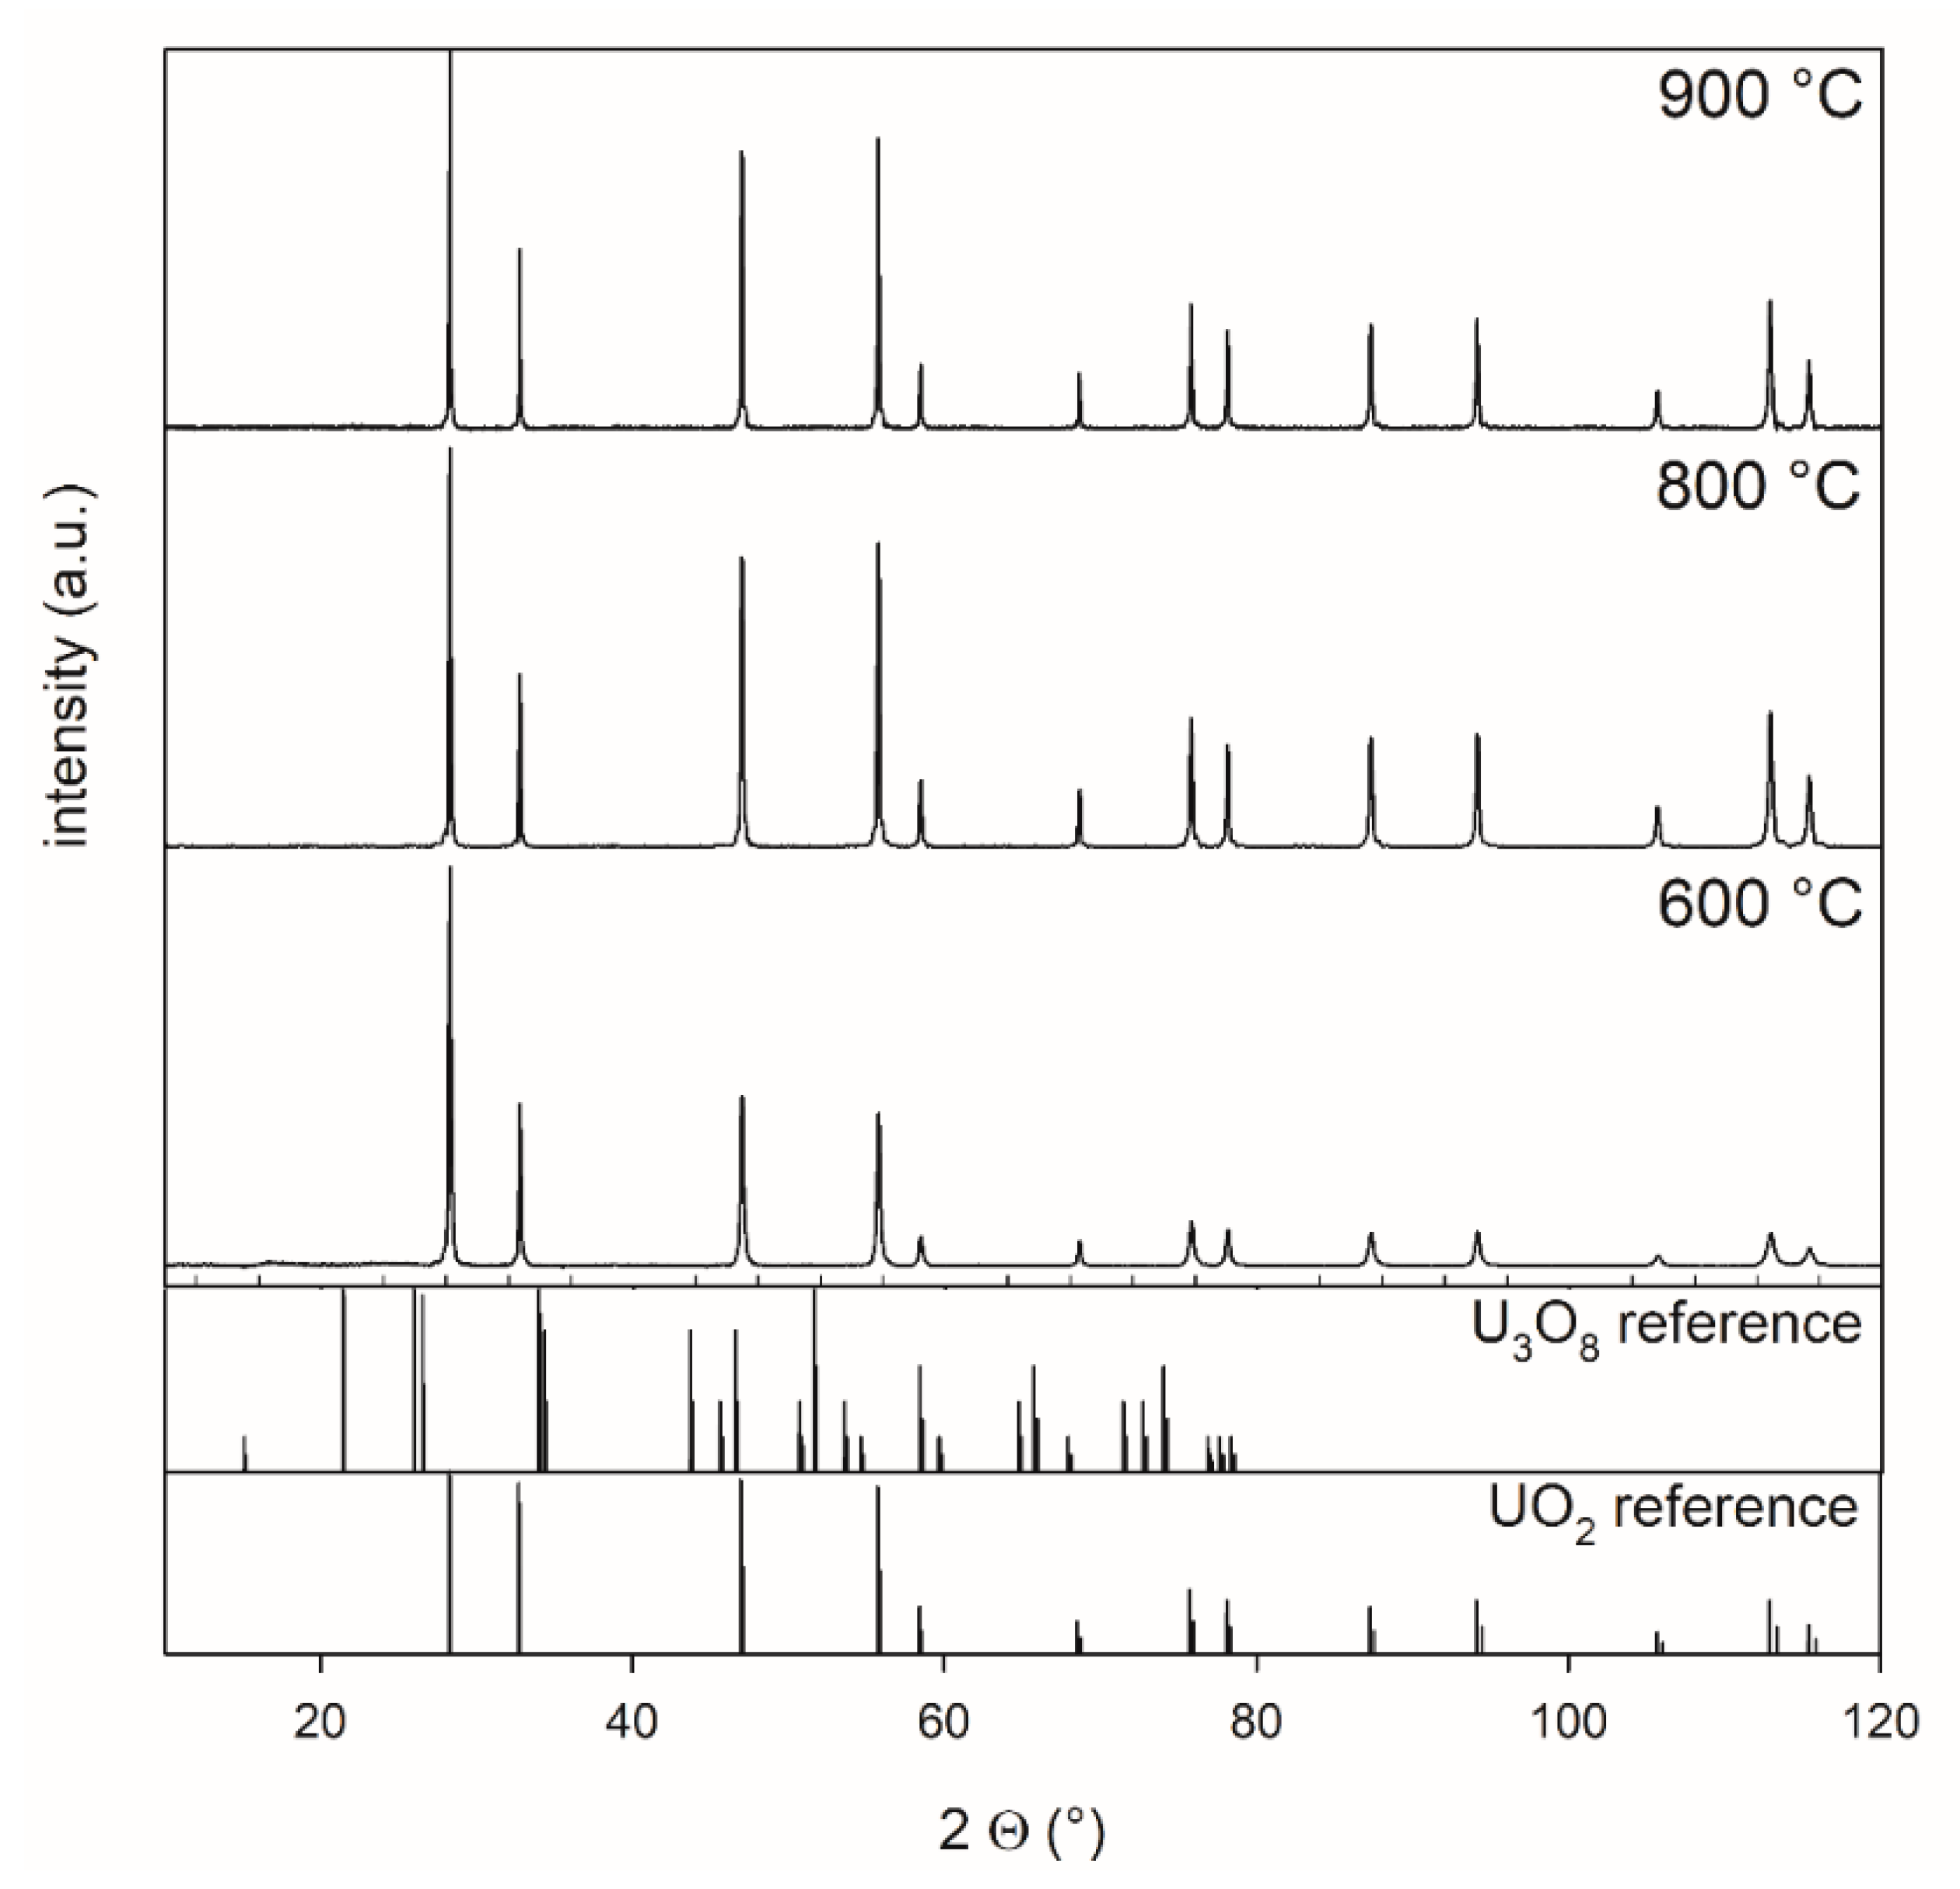
The XRD patterns of the products after the second, reducing, thermal treatment are shown in
Figure 2. U3O8 powder, which was synthesized from ADU at 800 °C, was treated at 600, 800, and 900 °C for 5 h in a 4% H2–96% Ar mixture. The measurements showed that a complete transformation from U3O8 to UO2 occurred at all temperatures.
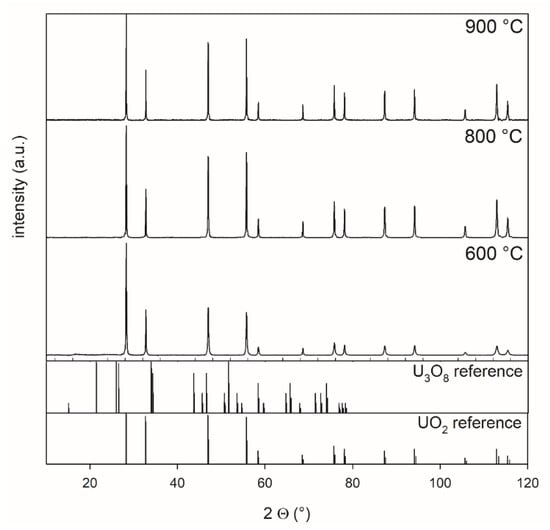
Figure 2.
XRD patterns of powders reduced at 600 °C, 800 °C, and 900 °C collected between 10° and 120° 2 theta, highlighting the effect of the reduction of U3O8 for 5 h in a 4% H2–96 % Ar mixture at different temperatures. Oxygen potential is −510 kJ/mol O2.
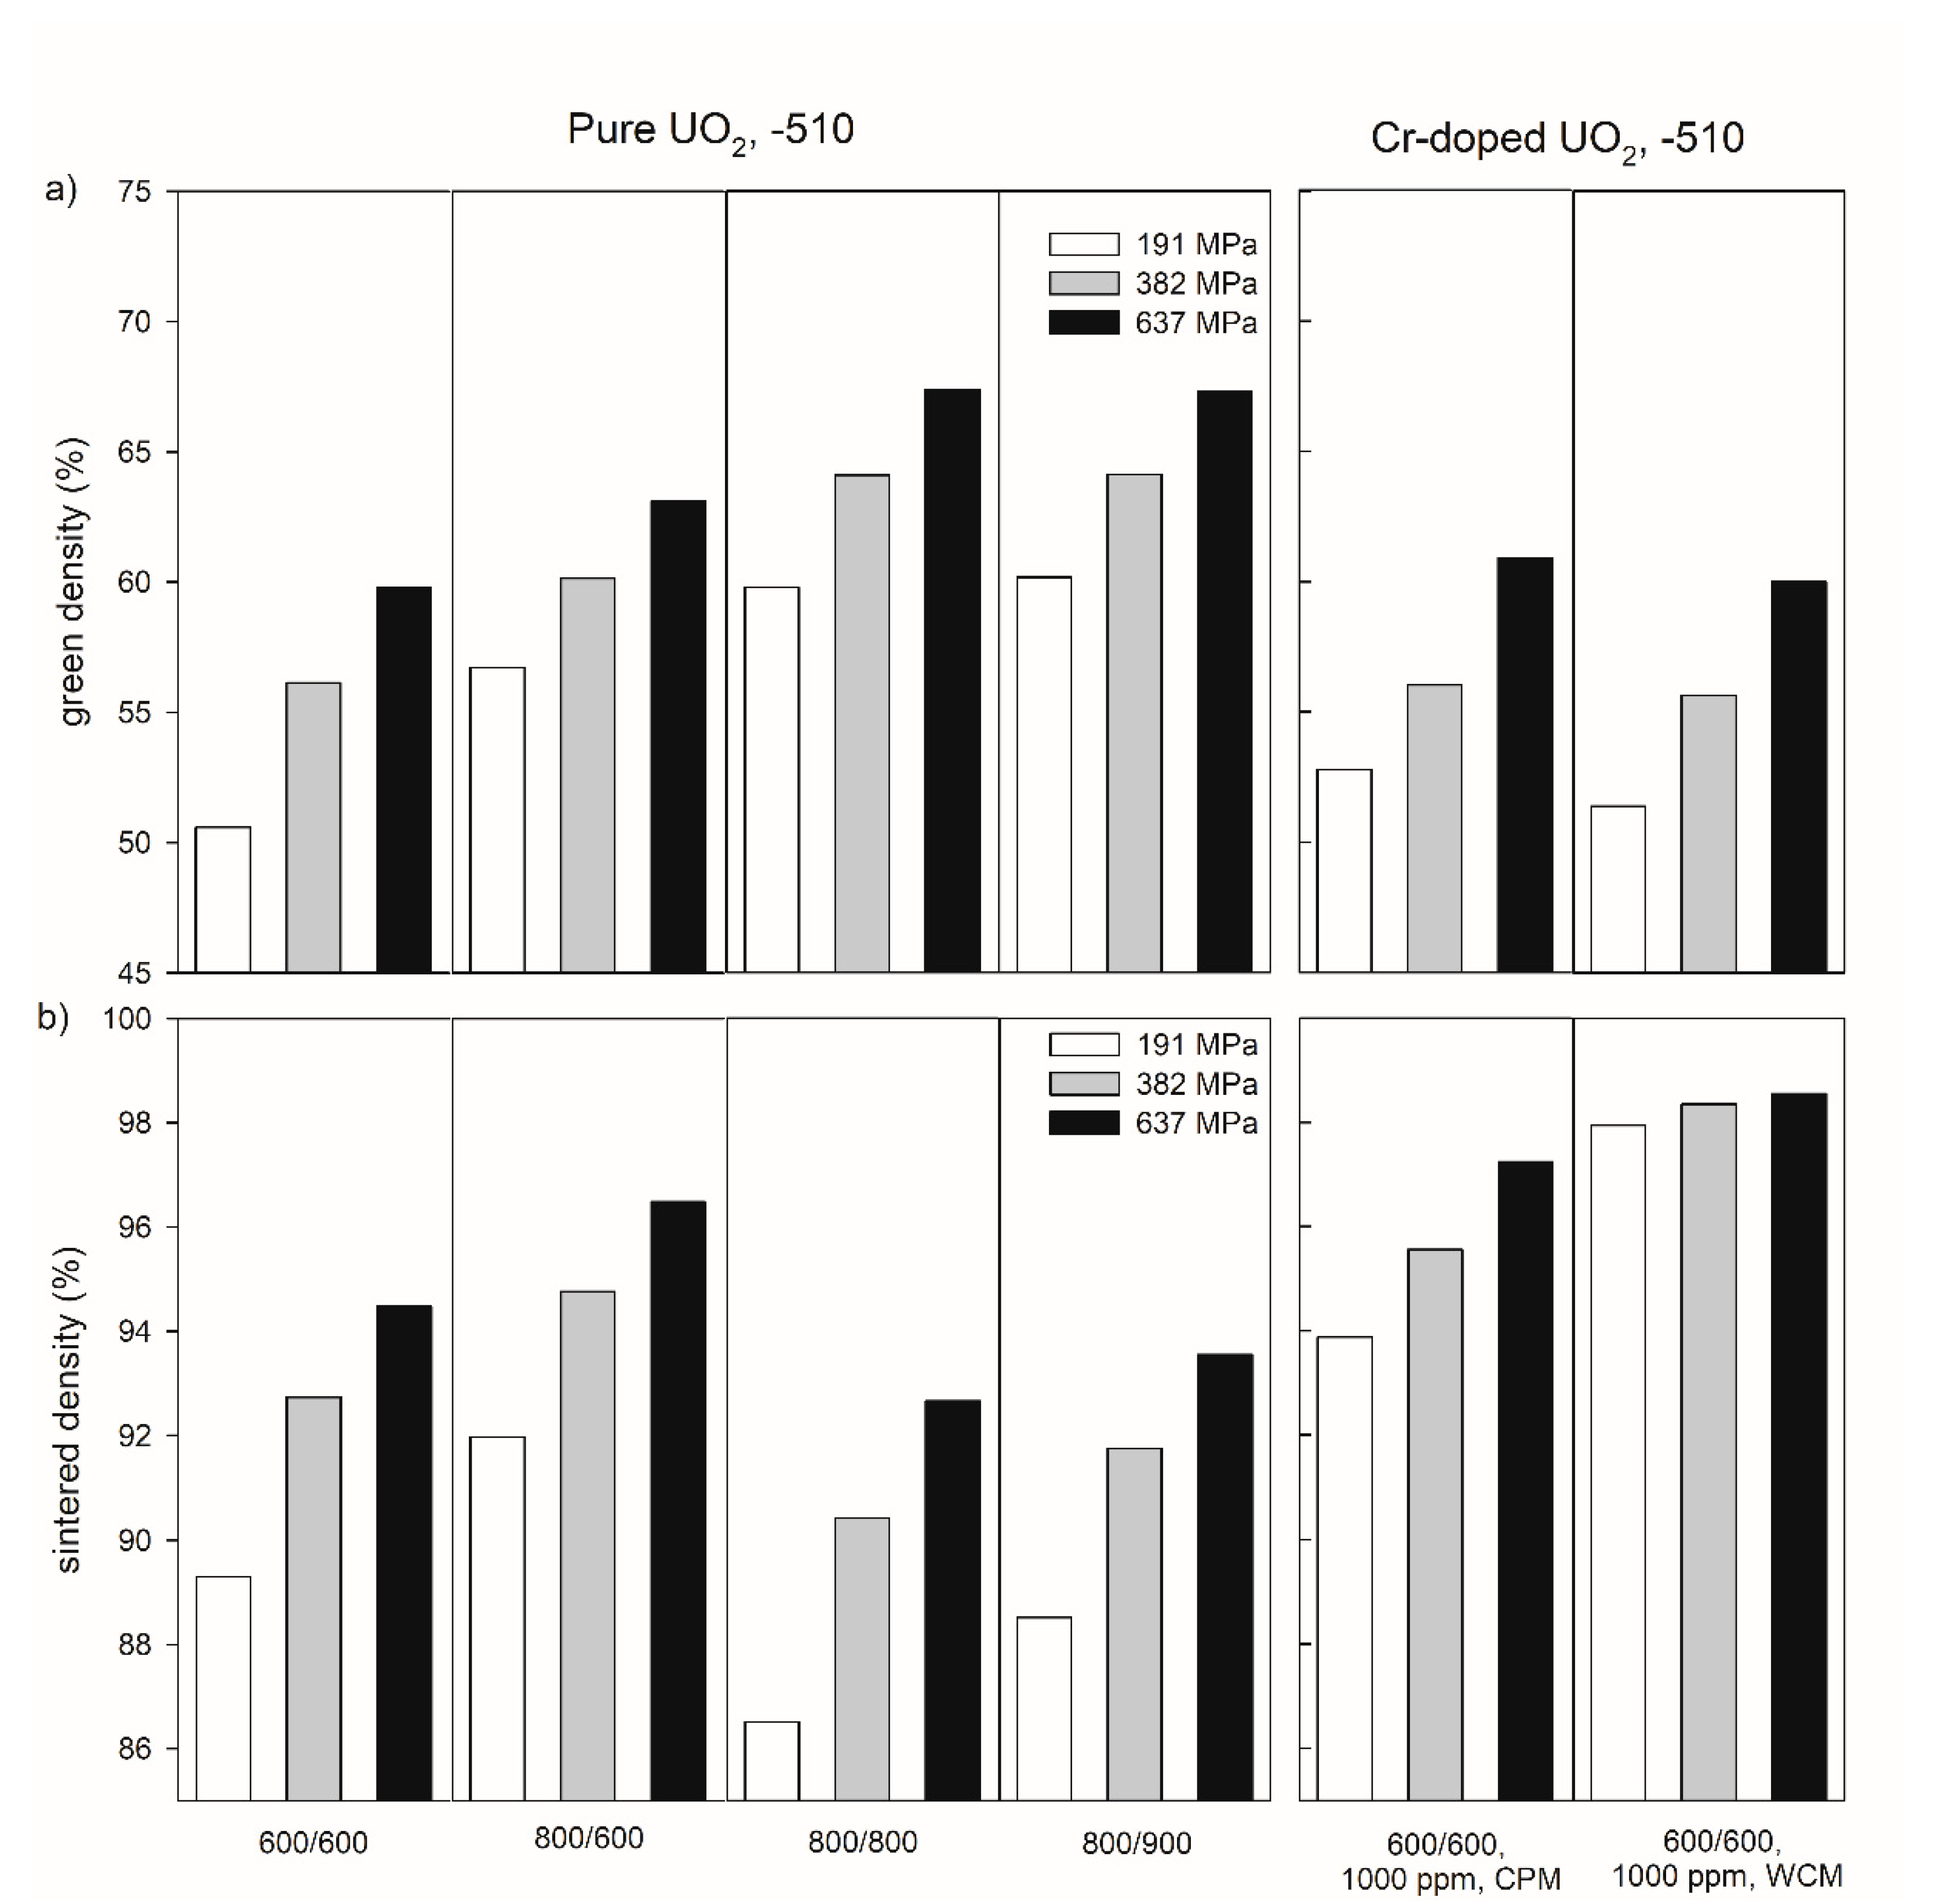
Figure 3 exemplarily shows the influence of temperature during the thermal treatment of the precursor materials on the density of the green bodies and pellets sintered at −510 kJ/mol O2 for both pure and Cr-doped materials for three compaction pressures (191, 382, and 637 MPa). In the pressure range investigated in this work, a compaction pressure increase led to an increasing green and sintered density (see also Table S1 in the supplementary information). Reducing the temperature of the first thermal treatment from 800 °C to 600 °C led to a significant decrease in green density. For example, at a compacting pressure of 637 MPa, the values of the green densities were 63.1% for 800 °C and 59.8% for 600 °C, respectively (Figure 3a, Table S1 in supplementary materials). After the subsequent sintering, the sintered density was lower for the sample with the lower green density (Figure 3b). Increasing the second step of thermal treatment from 600 °C to 800 °C led to an increase in the green density (Figure 3a), but to a decrease in the sintered density (Figure 3b).
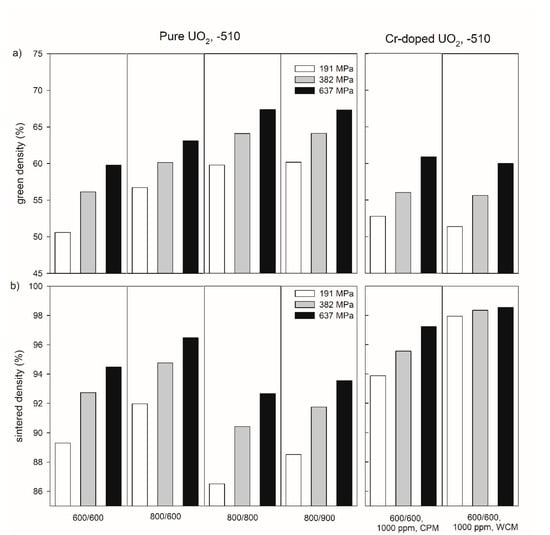
Figure 3.
Green density (a) and sintered density of pure and Cr-doped UO2 pellets (b) produced at compaction pressures of 191, 382, and 637 MPa with different thermal history of the precursor materials. The numbers under the samples refer to the temperatures (°C) during the oxidative and reducing steps of the thermal treatment of the precursors. CPM = co-precipitation method, WCM = wet coating method. All pellets were sintered at an oxygen potential of −510 kJ/mol O2.
Chromium doping led to green densities similar to those of pure UO2 treated at the same temperatures (600 °C/600 °C,
Figure 3
a), but to much higher sintered densities (e.g., 97.24% for CPM and 98.55% for WCM at 637 MPa,
Figure 3
b). Additionally, WCM Cr-doping results in a less pronounced pressure dependence compared to pure UO2 and material doped by CPM.
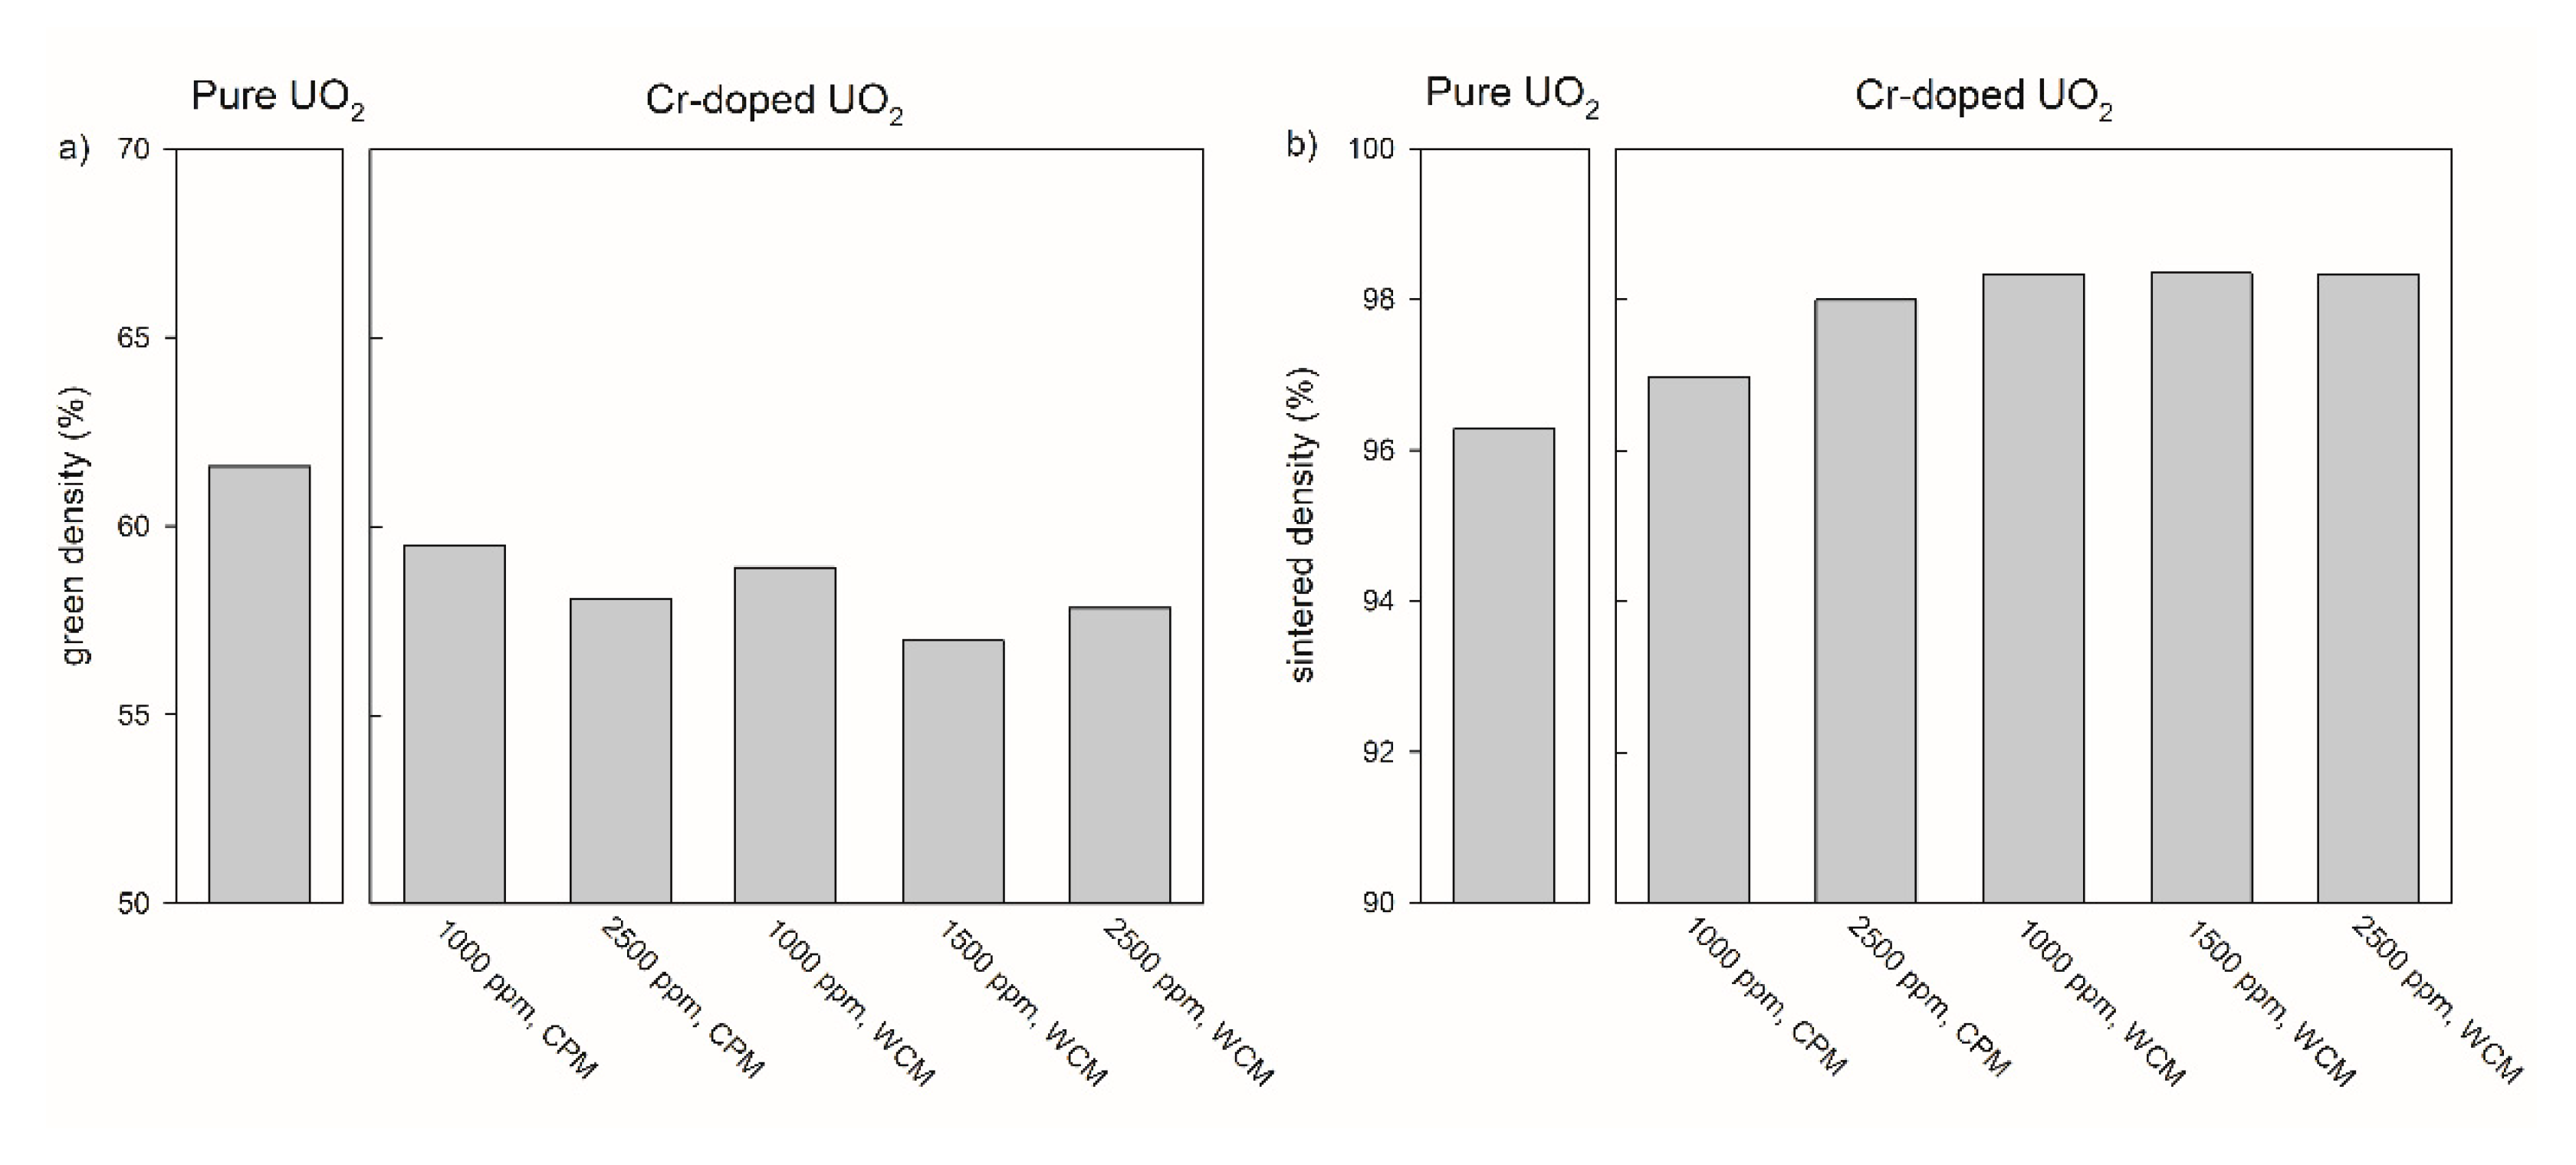
In addition to the sintering temperature and the compaction pressure, the sintered density of pure UO2 pellets depends on the oxygen potential in the sintering atmosphere (Figure 4). In case of the pure UO2 samples after the pre-treatment at 600 °C for both calcination steps, an increasing sintered density was observed with increasing oxygen potential from 94.5 % at −510 kJ/mol O2 to 96.3% at −420 kJ/mol O2.
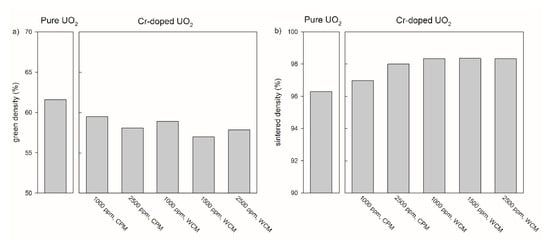
Figure 4.
Green density (a) and sintered density (b) of pure and chromium doped UO2 pellets produced at a compaction pressure of 637 MPa with different doping methods and doping levels. The numbers under the sample refer to the (nominal) amount of Cr-doping. CPM = co-precipitation method, WCM = wet coating method. All pellets were sintered at an oxygen potential of −420 kJ/mol O2.
3.1.2. Adaption of Green Body Preparation and Pellet Density for Cr2O3 Doped UO2
The relationship between compaction pressure and sintered density was similar for the samples doped with 1000 ppm Cr2O3 obtained by the co-precipitation method and for pure UO2 (Figure 3). However, the relative densities of the 1000 ppm Cr2O3-doped UO2 increased on average by 3% compared to pure UO2. An increase in the Cr2O3-doping level from 1000 to 2500 ppm raised the sintered density from 97.3 to 98.1 % at P = 637 MPa (Figure 4). For the samples doped with 1000 ppm Cr2O3 by CPM, the sintered densities of the pellets were slightly dependent on the compaction pressure, but densities were significantly higher than for pure UO2 and reached 98.6% at P = 637 MPa. All samples doped by WCM, independently on the doping level (1000, 1500, and 2500 ppm), showed similar sintered densities of nearly 98.4%. The sintering at different oxygen potentials (−510 or −420 kJ/mol O2) was found to have very little effect on the density of Cr2O3-doped pellets, independent of the doping level and the synthesis route (Figure 4).
Figure 3b and Figure 4b demonstrate that the highest sintered densities are achievable using pre-treatment at 600 °C for both calcination steps, via the WCM approach and with an oxygen potential of −420 kJ/mol O2. The effect of the oxygen potential on microstructural features other than the density will be described in the following sections.
3.2. Cr2O3—UO2 Solid Solution Formation: Consequences on Lattice Parameters and Microstructure
3.2.1. Microstructure and Grain Size
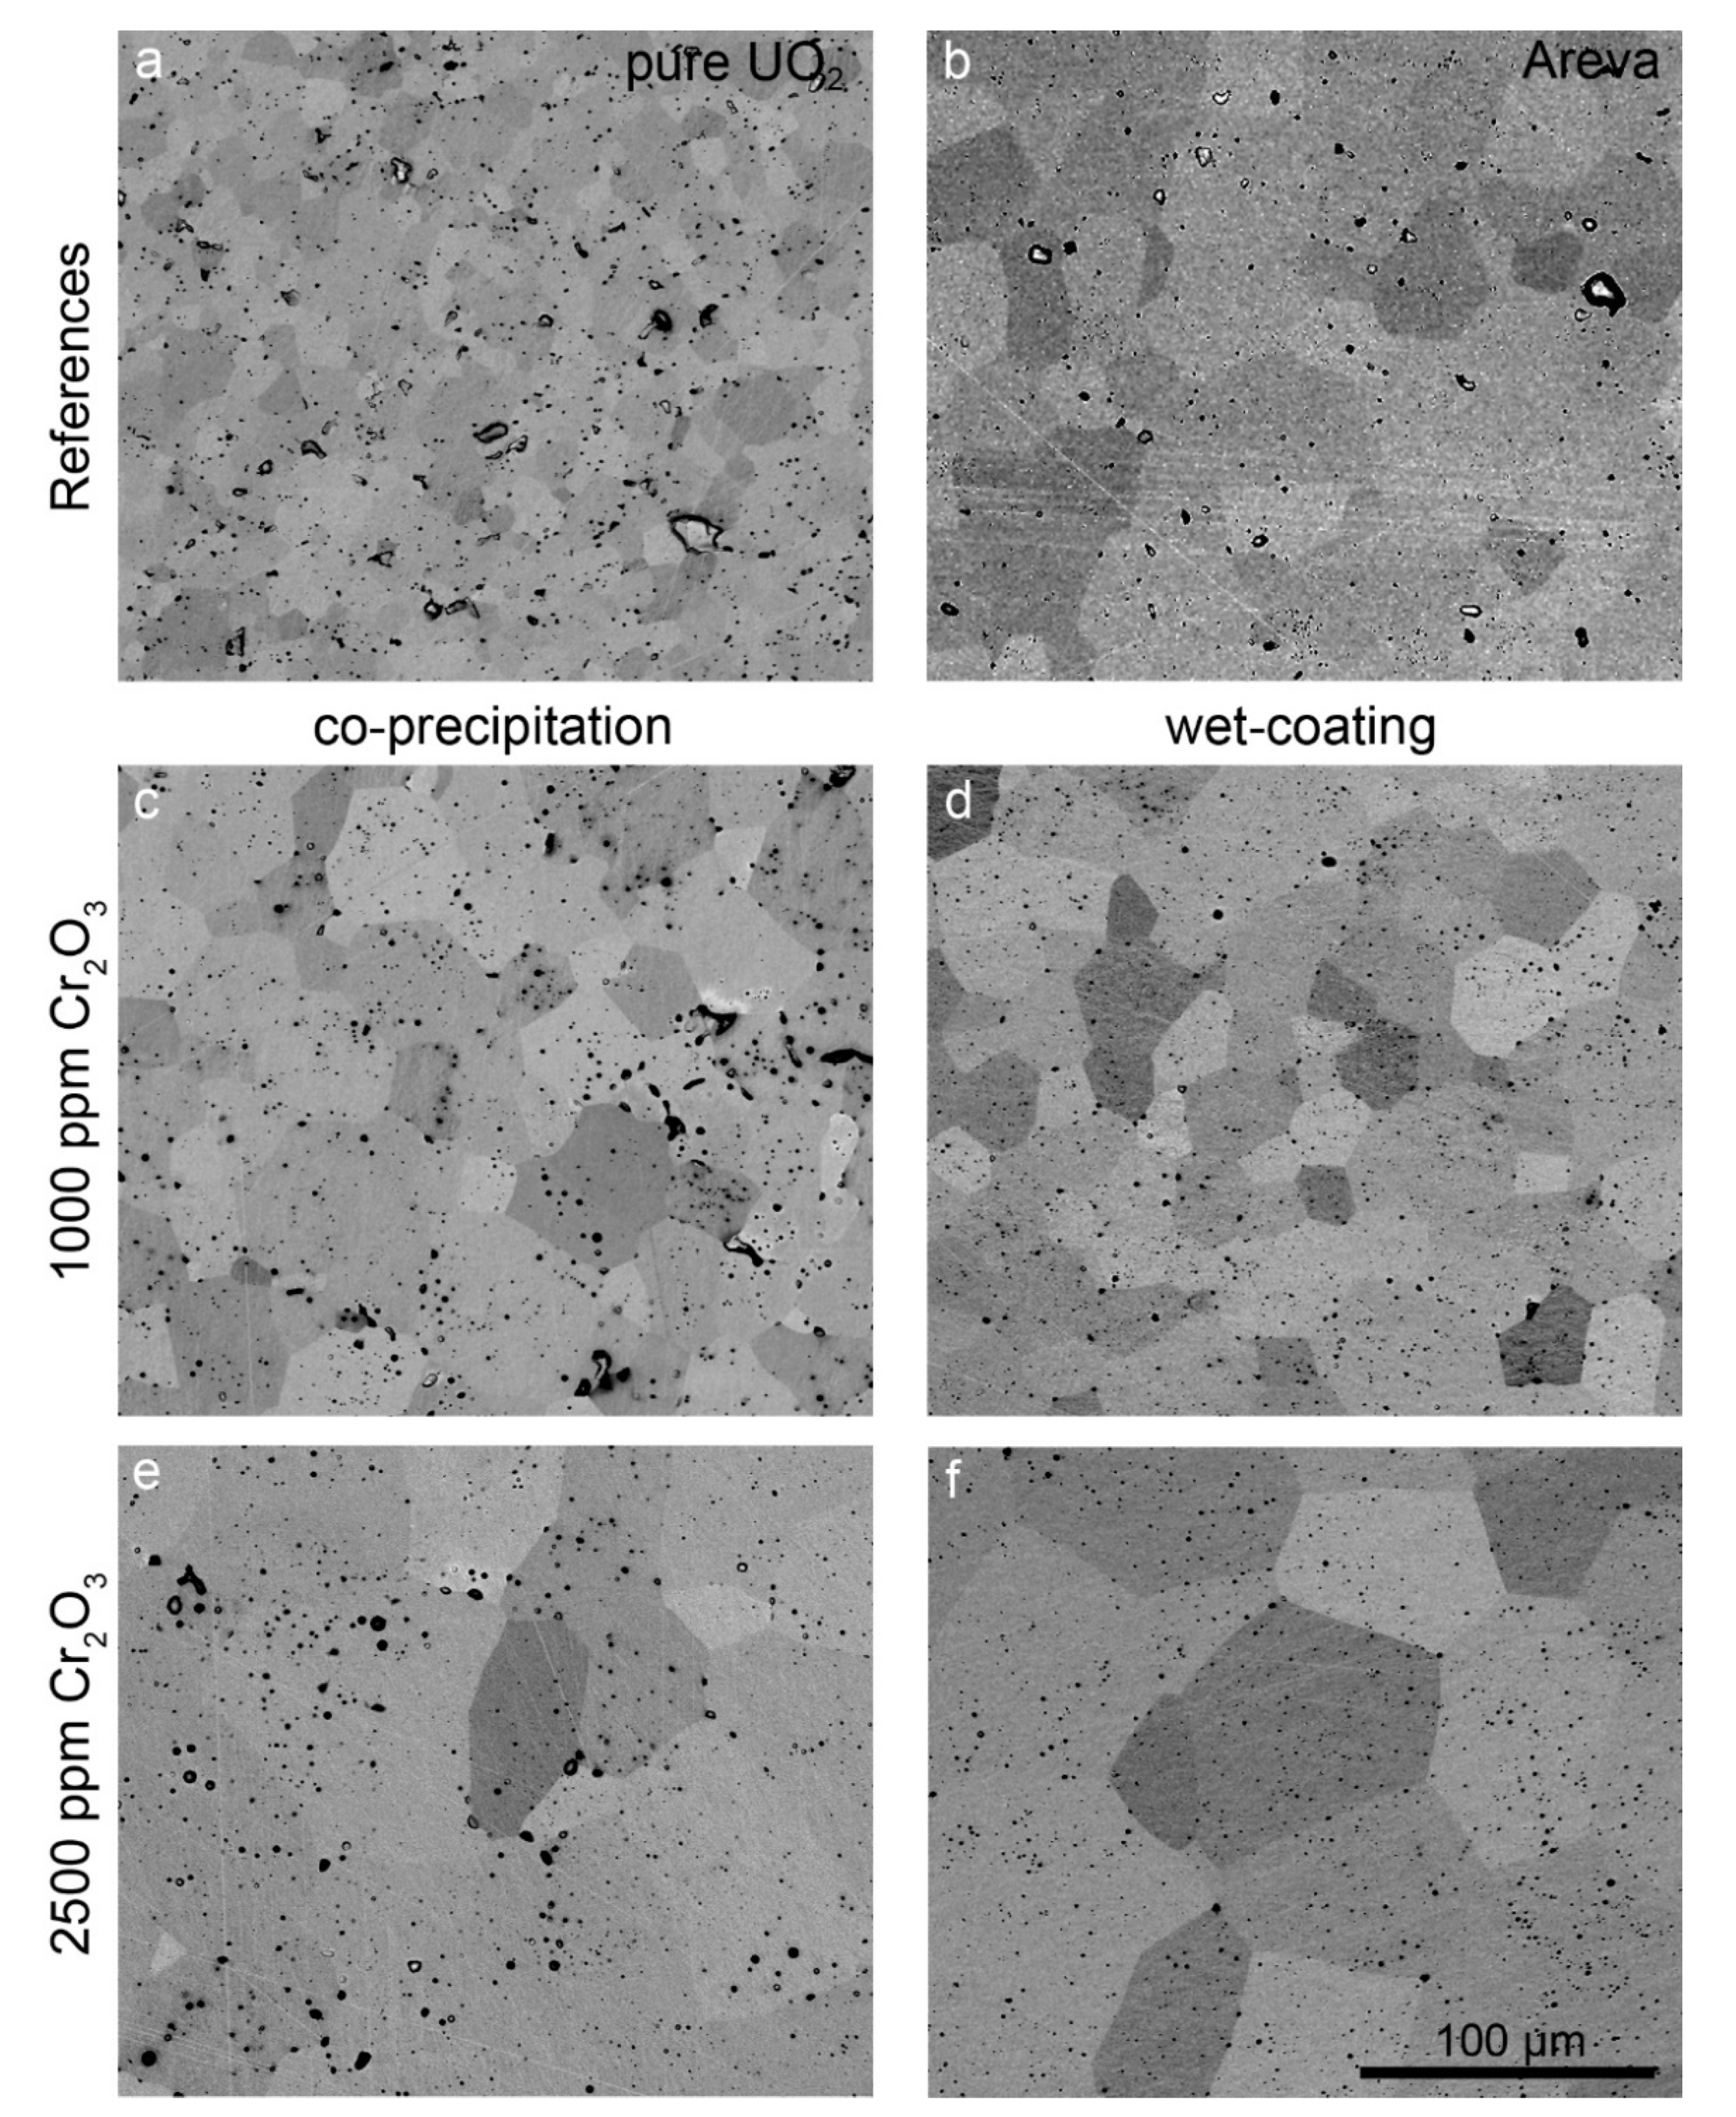
The microstructure and grain size of samples sintered at 1700 °C with varying oxygen potential were analyzed in detail. The microstructures of samples prepared at an oxygen potential of −420 kJ/mol O2 and of the AREVA reference material are presented in the backscattered electron (BSE) SEM images in Figure 5. In this SEM mode, the individual grains can be distinguished due to their orientation contrast. Pores appear as black round features, with some of them filled with Cr, as detected by EDS (see Figure 5).

Figure 5.
BSE images of pellets sintered at 1700 °C and an oxygen potential of −420 kJ/mol O2 for 10 h. (a) Pure UO2. (b) AREVA Cr-doped UO2 sample (sintering conditions unknown). (c) CPM sample, 1000 ppm Cr2O3. (d) WCM sample, 1000 ppm Cr2O3. (e) CPM sample, 2500 ppm Cr2O3. (f) WCM sample, 2500 ppm Cr2O3. The scale is the same in all images.
The pure UO2 reference pellet as prepared by our synthesis route (Figure 5a) contained grains in a size range between 1 µm (min) and ~25 µm (max) with an average grain size of 12 µm. Typical for this sample is a uniform grain size distribution and well-formed triple points with an angle of 120°. Small pores with about a 1 µm diameter are homogeneously distributed. Additionally, some pores with a size of up to 10 µm are visible. No systematic relationship between the location of the pores and grain boundaries or triple points was observed. Pure UO2 pellets sintered at more reducing conditions (−510 kJ/mol O2) showed the same microstructure (Figure S1 in supplementary materials).
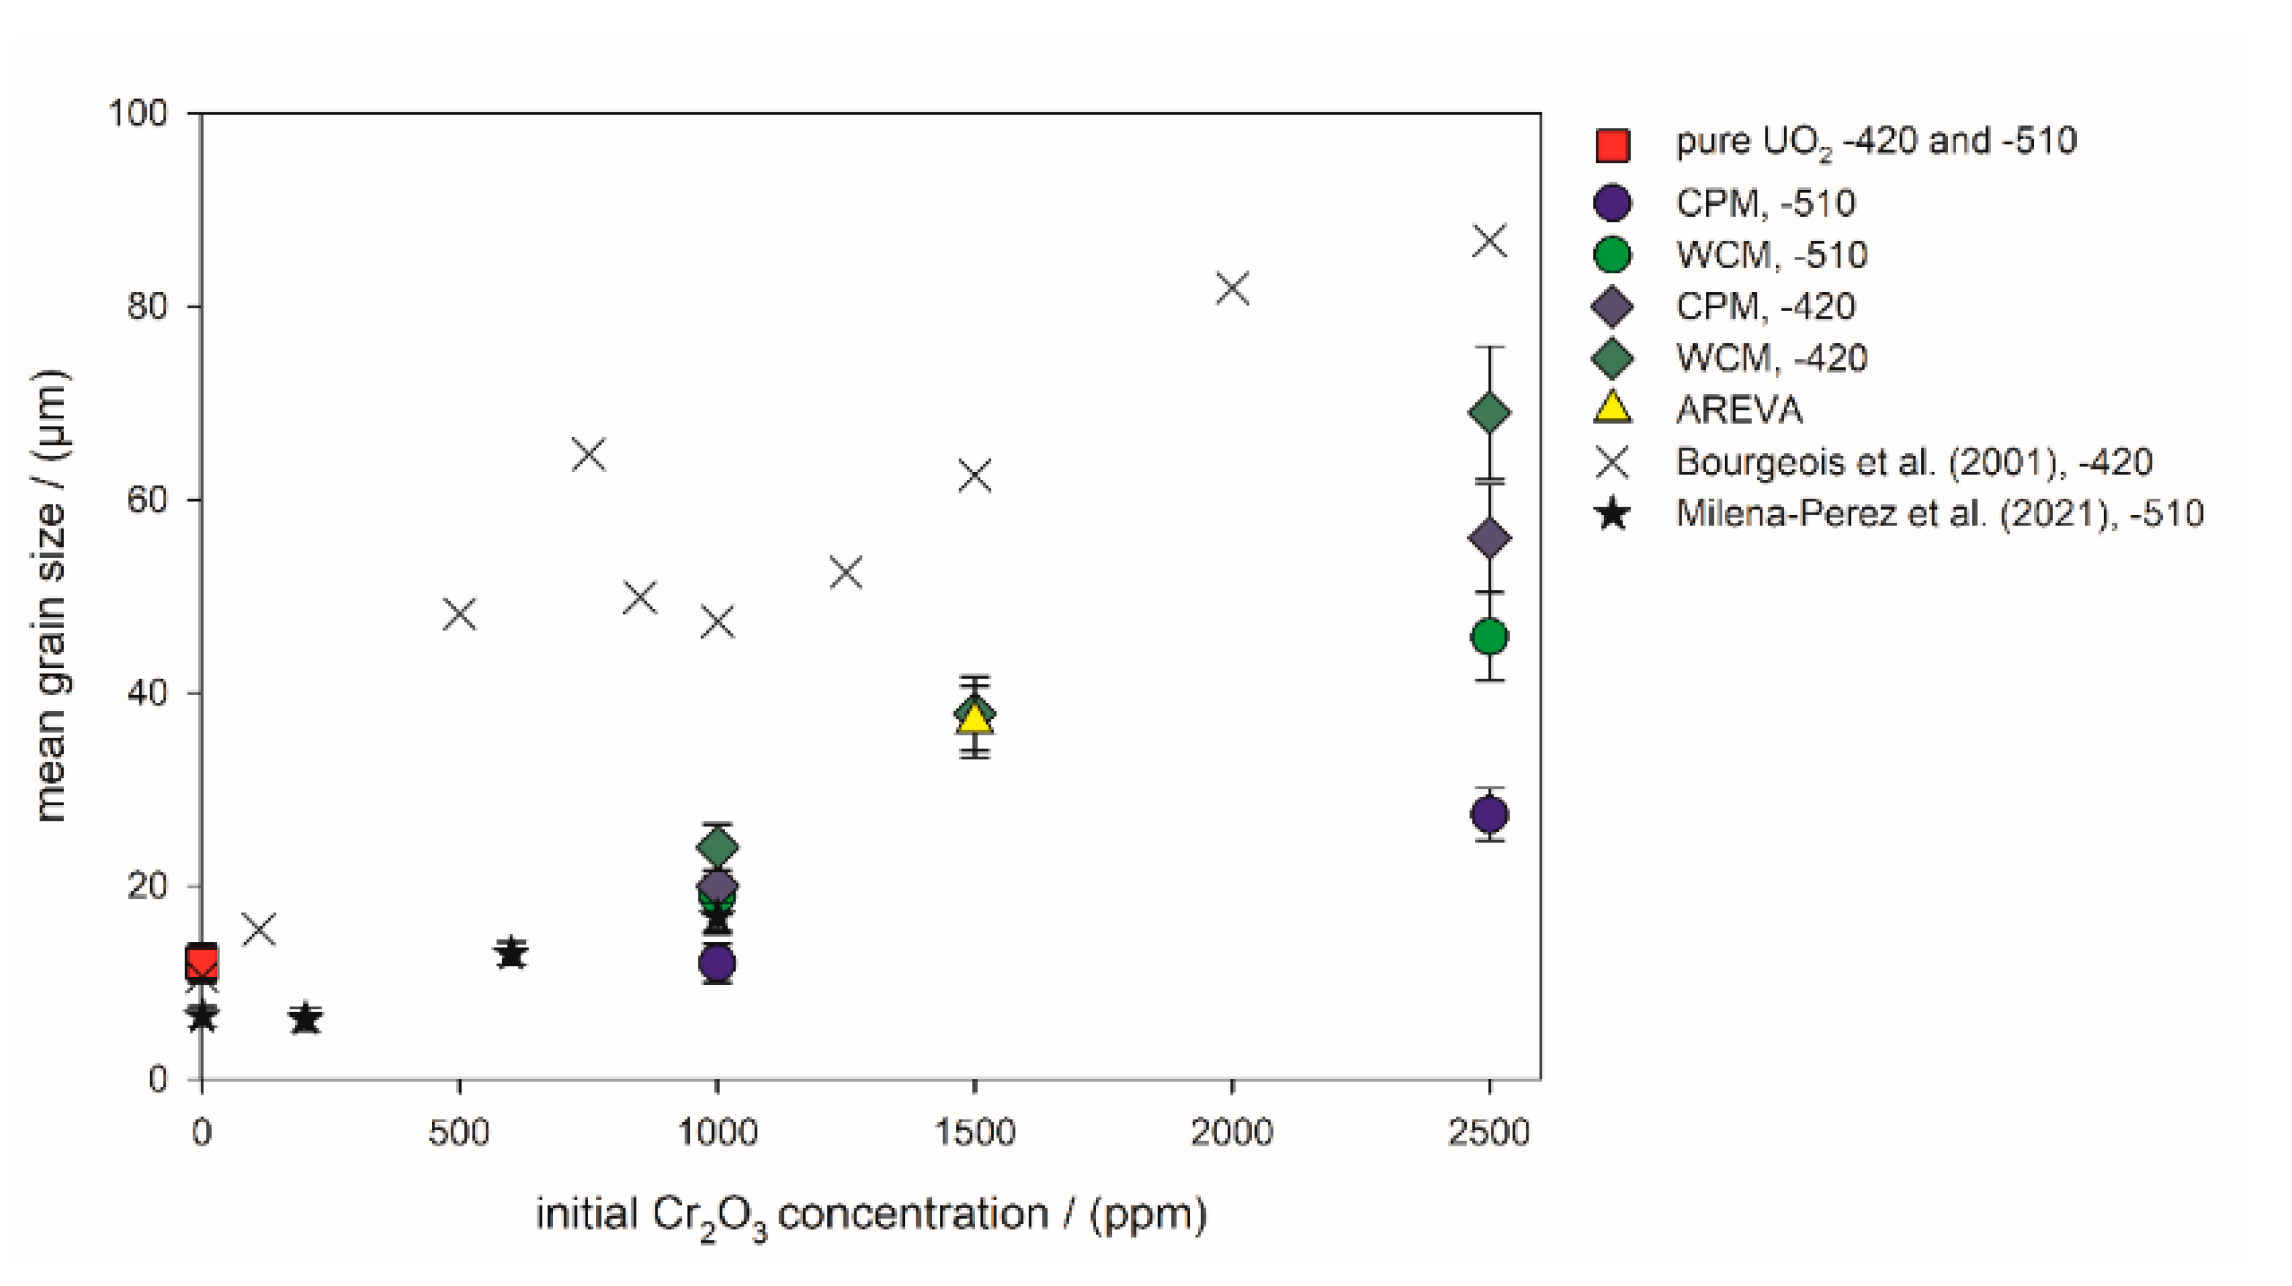
In contrast to the pure UO2 pellet, the grains of the AREVA reference UO2–Cr2O3 ceramic (1500 ppm Cr2O3 as initial composition; Figure 5b) were significantly larger, with sizes in the range between 8 and 70 µm and an average grain size of 37 µm (Figure 5 and Figure 6, Table 1, Table S1 in supplementary materials). The porosity was lower than that of the pure UO2 reference, whereas the general microstructure concerning triple points, etc. was similar. Similarly, the WCM and CPM samples, starting from 1000 ppm Cr2O3, also had increased average grain sizes of 20 µm and of 24 µm, respectively (Figure 5c,d and Figure 6). For direct comparison with the AREVA reference, a sample with 1500 ppm Cr2O3 was prepared via WCM, which showed a similar microstructure and average grain size (Figure S2 in supplementary materials). Increasing the initial Cr2O3 doping level further to 2500 ppm led to an additional coarsening effect and average grain sizes of 56 (CPM) and 69 µm (WCM; Figure 5 and Figure 6). In general, the co-precipitation samples exhibited a slightly higher porosity and a smaller grain size than the wet coating samples.
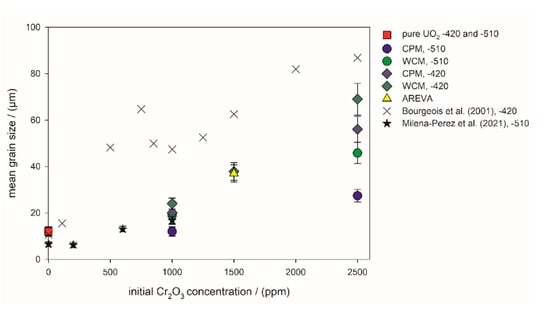
Figure 6.
Mean grain size of the sintered pellets versus the initial Cr2O3-doping level. −510: Sintering atmosphere was Ar/4% H2 with an oxygen potential of −510 kJ/mol O2. −420: Sintering atmosphere was Ar/4% H2 + Ar/1% H2 with an oxygen potential of −420 kJ/mol O2. The sintering temperature of all pellets in this work was 1700 °C. Literature values were taken from Bourgeois et al. (2001) [23], Milena-Perez et al. (2021) [22] and Silva et al. (2021) [21].

Table 1.
Properties of Cr2O3 doped pellets sintered under −420 kJ/mol O2.
The mean grain sizes obtained in this study and the available literature data are compiled in Figure 6. The data from the present wet chemical syntheses show a systematic shift in the average grain size toward larger grains, resulting from the variation of oxygen potential to lower values. In general, the samples prepared at −510 kJ/mol O2 exhibited a lower grain size than the corresponding samples sintered at −420 kJ/mol O2. The grains of the WCM samples were systematically larger than the grains of the CPM samples. The AREVA pellet had an identical average grain size as the WCM sample initially doped with 1500 ppm Cr2O3 and sintered at −420 kJ/mol O2. Compared to the pure UO2 sample, the addition of 1000 ppm Cr2O3 only had minor effects on the average grain size for the samples sintered at −510 kJ/mol O2, and a more pronounced effect at −420 kJ/mol O2 (Figure 6).
To understand where the Cr is located within the samples, EDS mappings were carried out for the detection of Cr-rich precipitates (Figure 7). A comparison of the EDS mappings and the respective BSE-SEM images indicated no preferred precipitation along the microstructural features (e.g., pores or grain boundaries, cf. example overlay of EDS and BSE image in
Figure S3
in supplementary materials). Typically, the ceramics prepared in this study had small Cr-rich precipitates that appeared not to agglomerate to larger particles. The image analyses carried out on the EDS mappings (Table 2) indicated similar precipitate sizes for all samples (i.e., the average sphere equivalent radius calculated from the areas of the precipitates varied between 0.3 and 0.47 µm). The number of Cr-rich precipitates was observed to increase with the doping level, but the total amount of Cr2O3 in the precipitates remained negligible compared to the total mass doped into the UO2 ceramics. The Cr-precipitates in the AREVA pellet were found to be coarser with an average sphere equivalent radius of 0.82 µm.
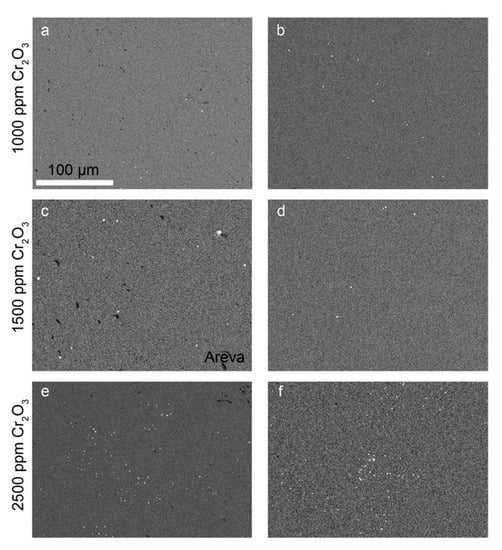
Figure 7.
EDS-mapping of Cr–K in Cr2O3-doped samples produced by (a) co-precipitation with 1000 ppm Cr2O3; (b) WCM with 1000 ppm Cr2O3; (c) AREVA with 1500 ppm Cr2O3; (d) wet coating with 1500 ppm Cr2O3; (e) co-precipitation with 2500 ppm Cr2O3; and (f) WCM with 2500 ppm Cr2O3. All samples were sintered at an oxygen potential of −420 kJ/mol O2. For better contrast, the EDX mappings were transformed into grey scale. Bright spots represent chromium-rich grains, black spots refer to pores, and grey refers to the Cr-doped UO2 matrix. Scale was the same for all images.
Table 2.
Image analysis results of the Cr-rich precipitates from the Cr-K-EDS mapping.
Figure 7c shows the Cr-grain distribution of a commercially available Cr doped UO2 pellet (AREVA). With an average grain size of 37 µm (Figure 5b, Table S1 in supplementary materials), the microstructure was similar to the pellets produced in the frame of this work doped with 1500 ppm Cr using the wet-coating method and sintered at an oxygen potential of −420 kJ/mol O2.
3.2.2. Cr2O3-Doping: Structural Uptake and Lattice Parameter Effects
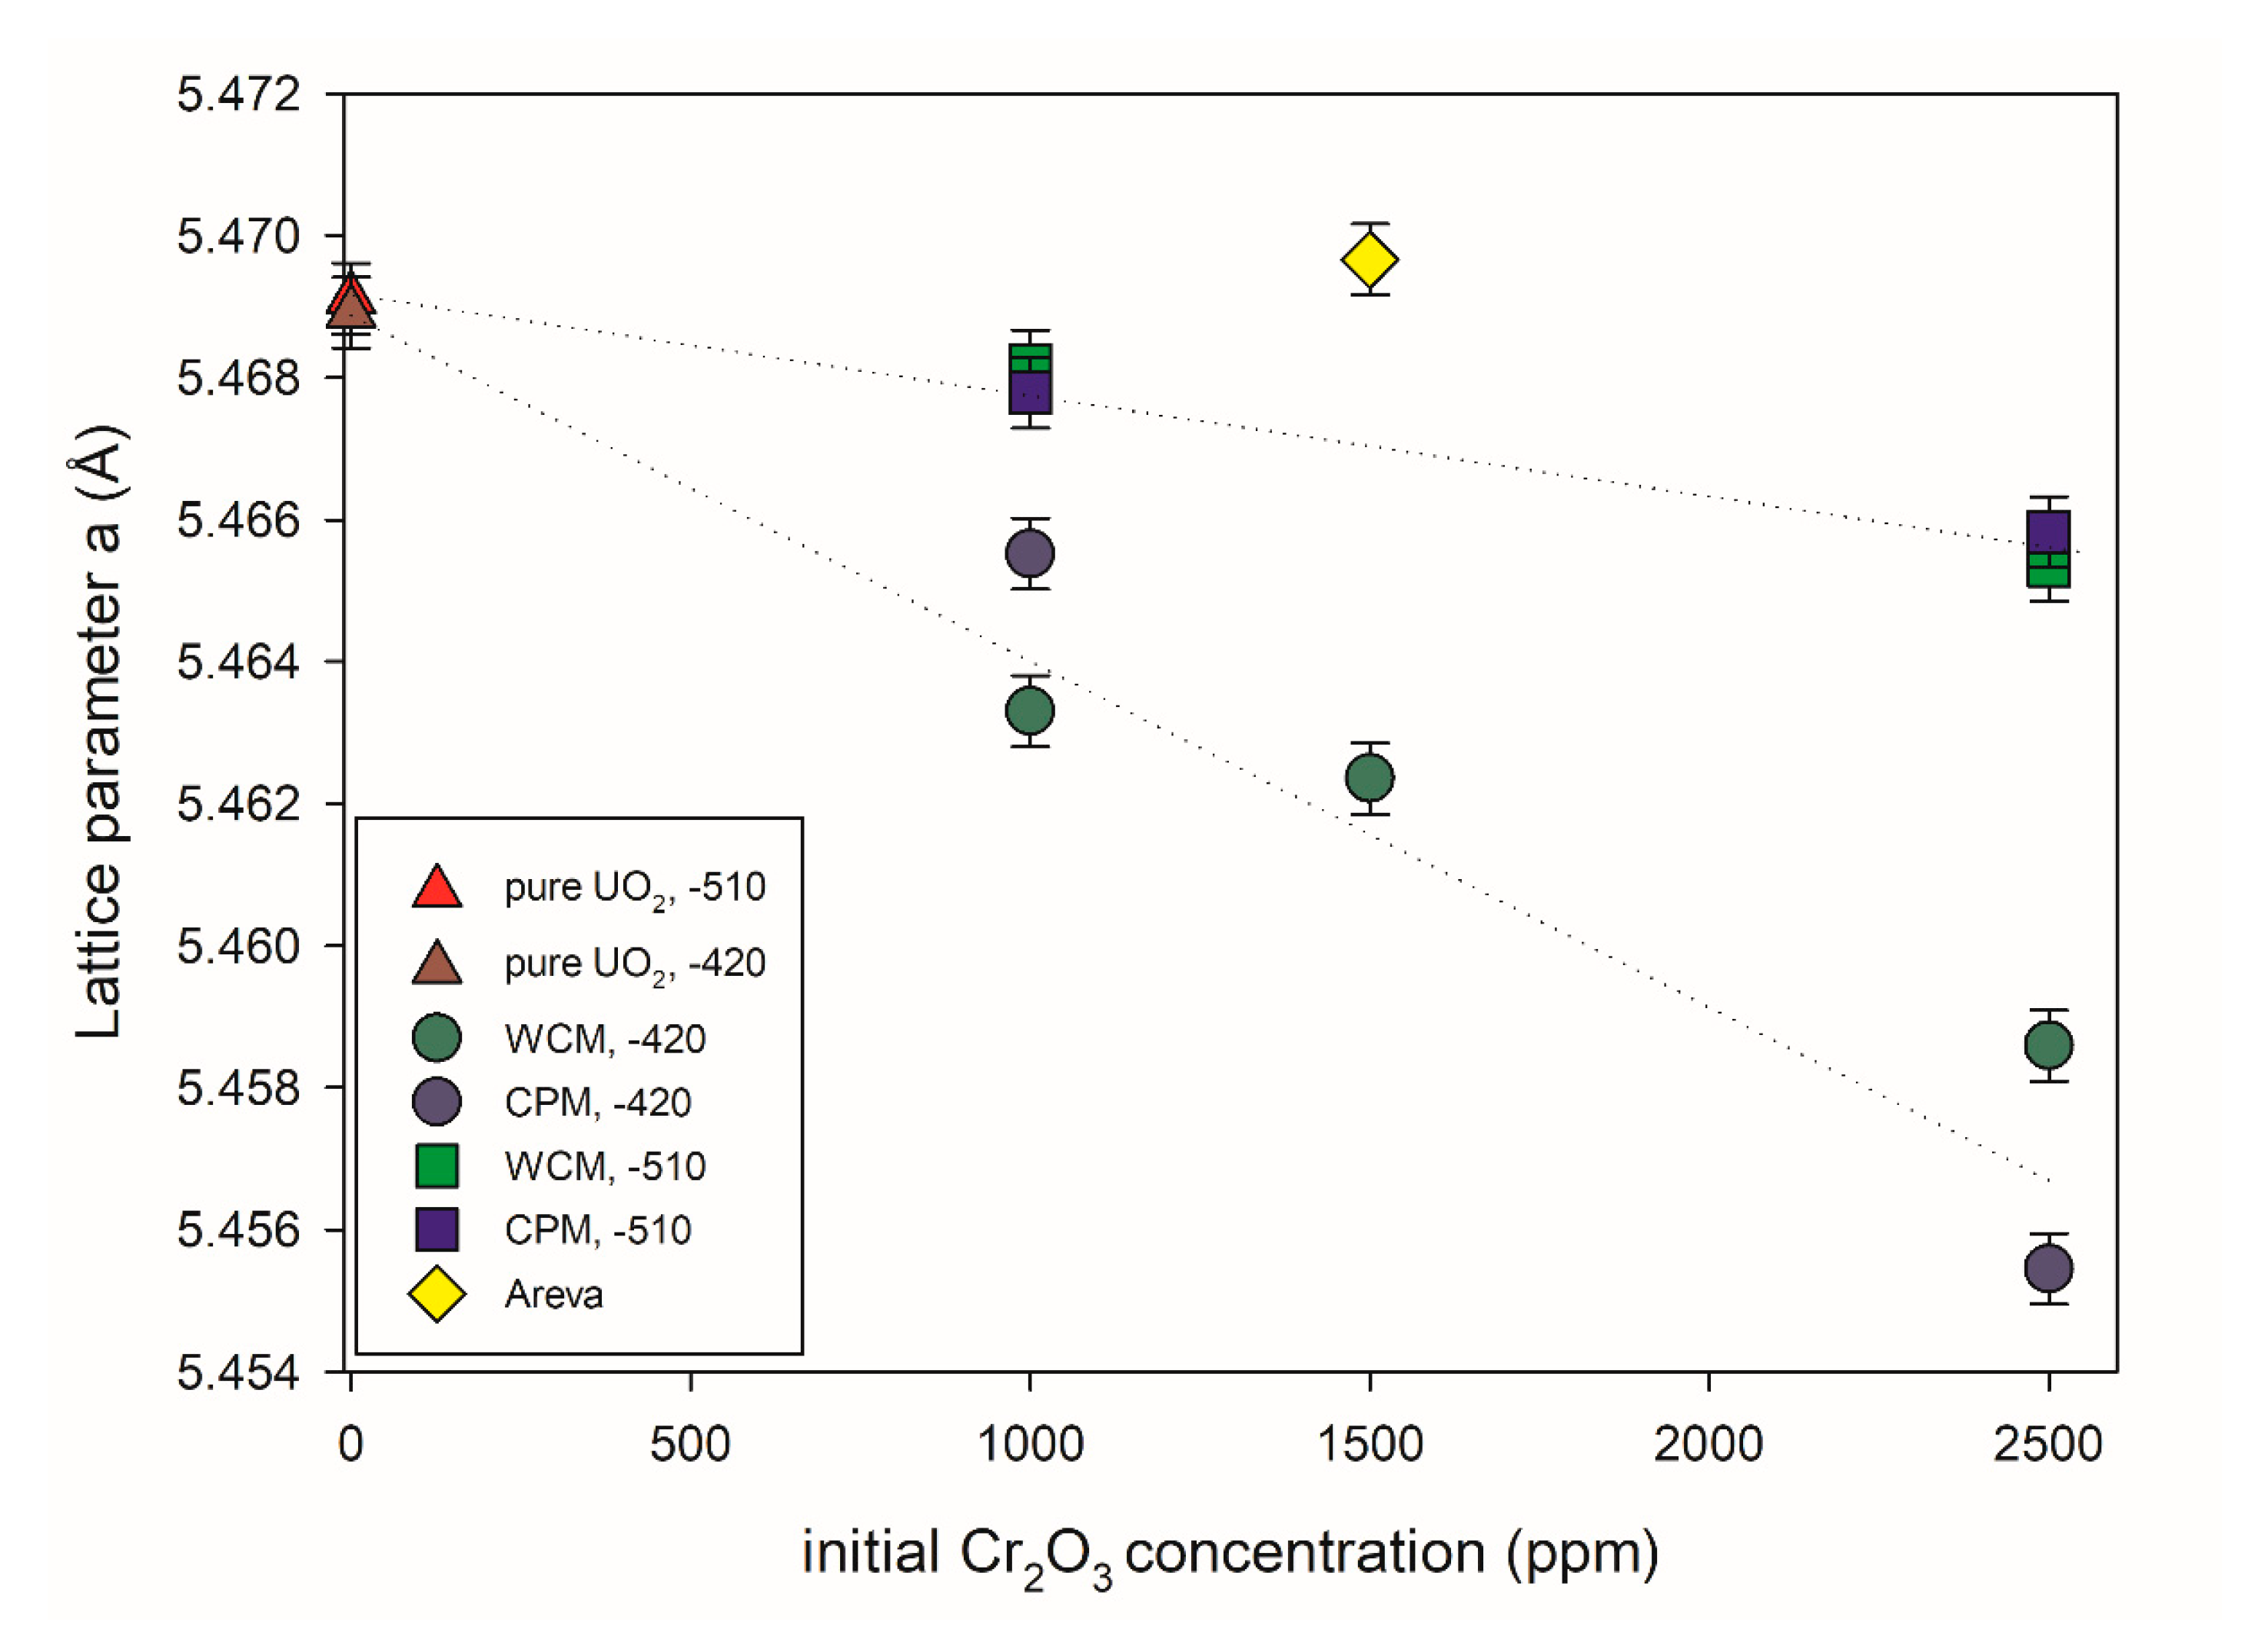
Figure 8 shows the UO2 lattice parameter (a) of different pellets synthesized in this work as a function of the initial Cr2O3 doping level obtained via Rietveld refinement analysis. A Rietveld profile is presented in Figure S4 in supplementary materials for reference. It can be observed that the incorporation of Cr into the UO2 lattice led to a subsequent contraction of the lattice parameter, but is dependent on the Cr2O3-doping level in addition to the oxygen potential used during the sintering process. In contrast, the lattice parameters of pure UO2 pellets showed an insignificant change with the variation in the oxygen potential during sintering. In the range of Cr2O3-doping levels presented here, the increase in the initial Cr2O3-doping level leads to a nearly linear decrease in the lattice parameters (i.e., a higher amount of Cr2O3-doping leads to a higher structural uptake of Cr into the lattice of UO2). The change in lattice parameters of UO2 was less pronounced at lower oxygen potential (−510 kJ/mol O2) compared to the samples sintered at higher oxygen potential (−420 kJ/mol O2). That general lattice contraction, as observed with increasing initial Cr content, is consistent with previous experimental studies of and Cr doping of UO2 [9,21,22,41]. In these references, the lattice contraction was attributed to U(V) formation due to charge balancing of the dopant cations. Accordingly, it can be argued that the greater contraction observed at higher initial Cr content is due to the formation of an increased amount of oxidized U.

Figure 8.
UO2 lattice parameters versus initial Cr2O3 doping level. Two different doping methods and oxygen potentials during the sintering process were investigated. −510: Sinter atmosphere was an Ar/4% H2 mixture with an oxygen potential (ΔG° = −RT ln PO2) of −510 kJ/mol O2. −420: Sinter atmosphere was an Ar/4% H2 + Ar/1% H2 mixture with an oxygen potential of −420 kJ/mol O2. The sintering temperature of all pellets was 1700 °C.
The effect of the doping method on the structural uptake appears to play no significant role depending on the oxygen partial pressure. In the case of −510 kJ/mol O2, no discernible difference could be observed between the different doping methods used with increasing Cr initial addition. At higher oxygen partial pressure, slight differences could be observed between the lattice parameter when using the different doping methods. At 1000 ppm Cr2O3 (i.e., below the solubility limit), WCM led to a greater contraction and presumed higher incorporation of Cr, whereas at 2500 ppm Cr2O3 (i.e., above the solubility limit of Cr), CPM led to greater contraction and presumed higher incorporation of Cr. A mechanistic understanding was beyond the scope of the present investigation, nevertheless, it can be readily observed that the doping methods and controlled oxygen partial pressure greatly assist in incorporation into the UO2 matrix as opposed to the sample produced by AREVA via powdering mixing routes where its doping of 1500 ppm Cr2O3 seemed to have little effect on the UO2 lattice and it is argued that the matrix contains little Cr.
4. Discussion
As already discussed in the introductory part of this paper, the scope of this work is the provision of a “construction kit” for all kinds of UO2 model systems useable for single effect studies with the possibility of adjusting parameters such as density/porosity, grainsize, Cr-distribution in the matrix. The flow chart in Figure 9 displays the optimized processing steps for the fabrication of pure UO2 and Cr2O3 doped UO2 pellets with well controlled microstructure, sintered density, and distribution of Cr within the pellets. A careful preparation of the three solid phases (powders) ADU, U3O8, and UO2 before the sintering of the ceramic is an essential prerequisite for successful pellet fabrication. In the following section, the parameters that have a strong influence on the sinterability are discussed for the production of pure UO2 and of the UO2 + Cr2O3 ceramic via wet chemical methods. In addition, the effects of doping UO2 with Cr2O3 upon the microstructure and crystal structure are discussed in comparison with studies following the powder synthesis route.
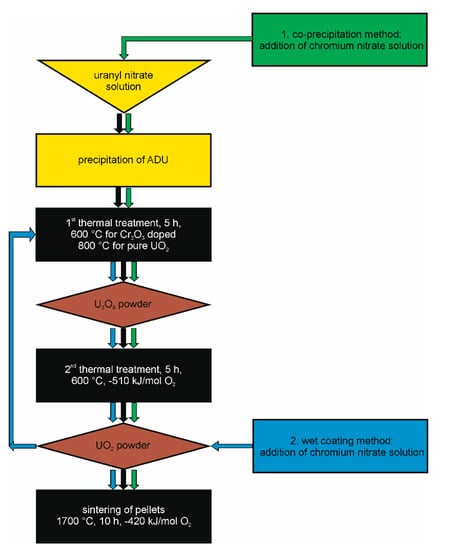
Figure 9.
Flow chart of the synthesis route for the production of pure and chromium doped UO2 pellets developed in this work.
4.1. Processing Parameters
The present results for pure UO2 indicate that there was a significant effect with respect to the two thermal treatments and the compaction pressure upon sinterability and density of the final ceramic. The optimum compaction pressure for all samples was determined as 637 MPa because it is well below the identified limit of the middle pressure region—independently from the other processing steps [32]. For pure UO2, conversion temperatures from ADU to U3O8 of 600 °C or 800 °C result in a good sinterability. This is well in line with the XRD measurements indicating a full transition to U3O8 already at 600 °C and the findings of Hung et al. (2001) [27], who also suggested these two temperatures based on their ADU to UO2 pellet processing study.
To minimize the known chromium loss due to volatilization during thermal treatment [9,10], 600 °C was the temperature chosen for the conversion of ADU to U3O8 when the Cr-doped ceramics were prepared. For the reduction step, a temperature of 600 °C was determined to be sufficient. It is known that higher temperatures during thermal treatment lower the active surface of powders and thereby their reactivity due to the fusion of grains and beginning the sintering processes [42,43]. As no milling or grinding steps should be included in the synthesis route, this effect could change and deteriorate the density/porosity of the sintered pellets [44]. To optimize the sintered density, the sintering atmosphere was optimized in the last step to −420 kJ/mol O2. At these conditions, pure UO2 pellets with a density of higher than 96 % were prepared, providing the starting point for the optimized Cr-doped pellet route.
Cr-doping was found to increase the sintered density in all cases when compared with the respective UO2 reference. For the Cr-doped materials sintered at −510 kJ/mol O2, as usually done in other studies [21,22], the relationship between the processing parameters and the final density was more similar to pure UO2 in the case of the CPM approach than with the WCM approach. At optimized conditions, the highest densities were reached with the WCM method, independent from the compaction pressure, whereas the CPM method yielded lower sintered densities. The Cr-doped pellets of Silva et al. (2021) [21] reached about 96% of the theoretical density at comparable conditions, close to the pellets prepared via CPM at −510 kJ/mol O2. In contrast, the samples prepared by Milena-Perez et al. (2021) [22], which were sintered at an oxygen potential of about −510 kJ/mol O2, showed increasing porosity with increasing doping, as observed via SEM.
The increase of the oxygen potential to −420 kJ/mol O2 during sintering improved the densities to around 98%, confirming that the combination of 600/600 °C for the thermal treatments with this oxygen potential leads to better results. The densities were similar for WPM and CPM and independent of the doping level.
4.2. Microstructure, Grain Size, Chromium Distribution, and Lattice Parameters in Comparison with the Literature
After the optimization of parameters, the wet chemical synthesis route leads to ceramics with a very well-developed microstructure. All samples, pure and Cr-doped UO2, exhibited a uniform grain size distribution and 120° triple points, indicating well equilibrated grain boundaries. Pores were homogeneously distributed with an average size of 1 µm. The mean grain size of the pure UO2 was very similar to the samples prepared by Silva et al. (2021) [21] via the classical powder method. Depending on the doping method, during sintering at −510 kJ/mol O2, the grain size increased with the doping level of Cr2O3. In agreement with the observed increasing density, the grain size of the WCM sample was also higher. This was also true for sintering at −420 kJ/mol O2, but not as significantly. The values of Milena-Perez et al. (2021) [22] followed a very similar trend as the new data presented here, whereas Bourgeois et al. (2001) [23] produced larger grains in general, which may partly be explained by the advanced spray coating doping method used. Still, the trend of their data was also similar with increasing doping level. The effect of sintering time on the grain growth seems to be insignificant compared to the effect of doping level and oxygen potential, as the sintering time used in [22] and [23] was only 4 h, whereas the sintering time in this work was 10 h. The heating and cooling rates as well as the sinter temperature ([22] 1675 °C [23], and this work 1700 °C) in all studies was in the same order of magnitude. Silva et al. (2021) [21] only saw a very slight change in the mean grain size with increasing Cr-doping. In particular, at higher doping levels above 2000 ppm, their trend in the mean grain size deviated from the trend of Bourgeois [23] and this study. However, the absolute numbers of the mean grain sizes deviated between all studies, indicating that the details of the preparation for the classical powder route also have a significant effect on the resulting microstructure.
Chromium precipitates are a common feature of Cr-doped UO2 ceramics. The occurrence of Cr-precipitates and their size was evaluated by Cardinaels et al. (2012) [9] to correlate with the total amount of Cr doping, with a typical size of the precipitates of about 1 to 3 µm, often bound to pores. Similarly, the precipitates in the AREVA reference pellets had Cr-precipitates of about 1 µm in size. For the pellets synthesized in this work, the number and the size of pores was smaller and the number of Cr-precipitates lower. Additionally, the grain size distribution of Cr-grains was more even. The Cr precipitates were typically smaller than 1 µm when produced via wet-chemical routes.
The solubility of chromium in the UO2 lattice is known to depend on the oxygen potential [8]. Consequently, the effect of Cr upon the lattice parameter was systematically examined at different Cr initial doping levels for the materials sintered at −420 kJ/mol O2 compared to those sintered at −510 kJ/mol O2 [9,10,21]. It was argued recently by Riglet-Martial et al. (2014) [8] that the incorporation of Cr into the UO2 lattice depends on the oxygen partial pressure whereby higher oxygen potentials lead to higher Cr inclusion; however, volatility of Cr also plays a significant role. That we observed greater lattice contraction and by extension Cr inclusion at higher oxygen potentials is consistent with the argument given by [8]. A full mechanistic understanding was beyond the scope of the present investigation, nevertheless, it can be readily observed that the doping methods and controlled oxygen partial pressure greatly assisted in Cr incorporation into the UO2 matrix. In contrast to this observation, the sample produced by AREVA via powder mixing routes with 1500 ppm initial Cr2O3 doping only seemed to have little effect on the UO2 lattice and it is argued that the matrix contained little Cr.
As described earlier, it was argued by Sun et al. that the incorporation of Cr into the UO2 matrix resulted in the occurrence of Cr2+ with U5+ and an oxygen vacancy surrounding it, independent of Cr2O3 precipitates. It was subsequently argued through this structural and redox mechanism of incorporation that it would result in a relative change of lattice parameter, Δa/a, at 1000 ppm of −0.25 − 10 −3 compared to 0 ppm. At the same concentration from the present study, the experimentally determined Δa/a derived from Rietveld refinements against XRD data of 0 and 1000 ppm Cr was −3.08 × 10 −3 for WCM −420 kJ/mol O2, –0.52 × 10 −3 for WCM −510 kJ/mol O2, −1.86 × 10 −3 for CPM −420 kJ/mol O2 and −0.72 × 10 −3 for CPM −510 kJ/mol O2. Compared to the value reported by [24], the values were somewhat consistent for more reducing conditions, but an order of magnitude difference was observed for oxidizing. However as shown by this investigation, the solubility of Cr is oxygen potential dependent, such that varying the oxygen potential will result in variable amounts of Cr entering the matrix and subsequently effecting the lattice parameter to different degrees. Accordingly, it is difficult to corroborate the proposed structural redox scheme of Cr2+ with U5+ and an oxygen vacancy surrounding it by [24] via measurement of the lattice parameter due to its dependence on the oxygen potential. Subsequently, it is argued that for true determination of the structural and redox state within the matrix of Cr doped UO2, direct measurement of the crystal lattice ideally via grain or a single crystal samples is necessary.
The analysis here indicates that the structural uptake of Cr has no effect on the microstructure and sintered density. This indicates that Cr is surface active during the sintering, changing the behavior of the moving grain boundaries. However, the extent of Cr uptake was found to be strongly dependent upon treatment approach and the oxygen partial pressure.
A comparison of grain boundaries between pure and Cr-doped UO2 pellets revealed a distinct curvature of the grain boundaries for the pure UO2 pellets, whereas the chromium doped UO2 pellets, especially the pellets doped with WCM, had straight grain boundaries. This is an indication for a wetting effect caused by the chromium dopant during sintering [42,43].
5. Conclusions
In this work, a wet chemical synthesis route for the production of pure and Cr-doped UO2 pellets was demonstrated. Two different approaches for the Cr-doping were followed, namely doping by co-precipitation with the ADU precursor and doping by wet coating of UO2 powders. Using an initial synthesis route involving precipitation of ADU as opposed to traditional powder mixing was demonstrated to be advantageous for producing high quality ceramics regarding the material properties and dopant homogeneity to be used later for single effect studies such as dissolution experiments on simulated (spent) nuclear fuel. Such a method can be readily applied to produce high quality ceramics involving other homogeneously distributed dopants relevant to model systems studies such as U-233 or Pu-238, among others.
Comparison with the literature shows similar trends for the influence of Cr-doping on the UO2 grain growth in sintered pellets. This effect is pronounced in different degrees depending on the synthesis route. Choosing the wet chemical route of this work allows for a very good reproducibility of the results compared to routes with mechanical steps such as milling.
A recently discussed topic is the structural uptake of Cr into the UO2 structure lattice. The theoretical approach of [8,24] describes that chromium incorporation is strongly dependent on oxygen partial pressure during the sintering process. This observation is supported by the findings of this work, although the solubility limit of Cr in the UO2 lattice was not determined. The determination of the solubility of chromium in the UO2 lattice is an important task for future work.
The precise knowledge of the influence of the synthesis parameters, for instance, the thermal treatment of precursors, method and amount of chromium doping, and oxygen potential during the sintering of the pellets facilitates the production of materials with a hand tailored microstructure with respect to the density, grain size, and chromium grain distribution.
Supplementary Materials
The following are available online at https://www.mdpi.com/article/10.3390/ma14206160/s1, Table S1: Values of all experiments; Figure S1: BSE images of a pure UO2 pellets sintered at 1700 °C and an oxygen potential of −510 kJ/mol O2, for 10 h; Figure S2: BSE images of a Cr-doped UO2 pellets with 1500 ppm Cr2O3 WCM, sintered at 1700 °C and an oxygen potential of −420 kJ/mol O2, for 10 h; Figure S3: Example overlay of EDX and BSE image from sample 2500 ppm Cr₂O₃ WCM, 600/600, −420 kJ_1; Figure S4: Example Rietveld profile of UO2 doped with Cr at 1000 ppm initial using a WCM approach. Black crosses = observed; red solid line = calculated; red line below = difference curve; vertical black tick marks = positions of the space group allowed Bragg reflections.
Author Contributions
Conceptualization, P.K., D.B., F.B., and G.D.; Methodology, P.K. and A.B.; Validation, All Authors.; Formal analysis, P.K.; Investigation, P.K., M.K., A.B., and G.L.M.; Resources, D.B.; Writing—original draft preparation, P.K.; Writing—review and editing, P.K., M.K., F.B., G.L.M., and G.D.; Visualization, P.K. and M.K.; Supervision, D.B.; Project administration, D.B., G.D., and P.K.; Funding acquisition, D.B. and F.B. All authors have read and agreed to the published version of the manuscript.
Funding
This project has received funding from the European Union’s Horizon 2020 research and training program of the European Atomic Energy Community (EURATOM) (H2020-NFRP2016/2017) under grant agreement no. 755443 (DisCo).
Institutional Review Board Statement
Not applicable.
Informed Consent Statement
Not applicable.
Data Availability Statement
Data is contained within the article and supplementary material.
Acknowledgments
The authors thank Wolfgang Rheinheimer for intensive discussion. Thorough reviews by three anonymous referees led to improvement of the paper.
Conflicts of Interest
The authors declare no conflict of interest.
References
- Commissariat à L’énergie Atomique et Aux Énergies (CEA). Nuclear Fuels; CEA: Gif-sur-Yvette Cedex, France, 2009; p. 147. [Google Scholar]
- Arborelius, J.; Backman, K.; Hallstadius, L.; LimbäCk, M.; Nilsson, J.; Rebensdorff, B.; Zhou, G.; Kitano, K.; Löfström, R.; Rönnberg, G. Advanced Doped UO2 Pellets in LWR Applications. J. Nucl. Sci. Technol. 2006, 43, 967–976. [Google Scholar] [CrossRef]
- Massih, A.R. Effects of Additives on Uranium Dioxide Fuel Behavior; Strålsäkerhetsmyndigheten (SSM): Uppsala, Sweden, 2014; Volume 21, p. 62. [Google Scholar]
- Kashibe, S.; Une, K. Effect of additives (Cr2O3, Al2O3, SiO2, MgO) on diffusional release of 133Xe from UO2 fuels. J. Nucl. Mater. 1998, 254, 234–242. [Google Scholar] [CrossRef]
- Cooper, M.W.D.; Pastore, G.; Che, Y.; Matthews, C.; Forslund, A.; Stanek, C.R.; Shirvan, K.; Tverberg, T.; Gamble, K.A.; Mays, B.; et al. Fission gas diffusion and release for Cr2O3-doped UO2: From the atomic to the engineering scale. J. Nucl. Mater. 2021, 545, 152590. [Google Scholar] [CrossRef]
- Greenquist, I.; Tonks, M.; Cooper, M.; Andersson, D.; Zhang, Y. Grand potential sintering simulations of doped UO2 accident-tolerant fuel concepts. J. Nucl. Mater. 2020, 532, 152052. [Google Scholar] [CrossRef]
- Killeen, J.C. Fission gas release and swelling in UO2 doped with Cr2O3. J. Nucl. Mater. 1980, 88, 177–184. [Google Scholar] [CrossRef]
- Riglet-Martial, C.; Martin, P.; Testemale, D.; Sabathier-Devals, C.; Carlot, G.; Matheron, P.; Iltis, X.; Pasquet, U.; Valot, C.; Delafoy, C.; et al. Thermodynamics of chromium in UO2 fuel: A solubility model. J. Nucl. Mater. 2014, 447, 63–72. [Google Scholar] [CrossRef]
- Cardinaels, T.; Govers, K.; Vos, B.; Van den Berghe, S.; Verwerft, M.; De Tollenaere, L.; Maier, G.; Delafoy, C. Chromia doped UO2 fuel: Investigation of the lattice parameter. J. Nucl. Mater. 2012, 424, 252–260. [Google Scholar] [CrossRef]
- Leenaers, A.; de Tollenaere, L.; Delafoy, C.; Van den Berghe, S. On the solubility of chromium sesquioxide in uranium dioxide fuel. J. Nucl. Mater. 2003, 317, 62–68. [Google Scholar] [CrossRef]
- Peres, V.; Favergeon, L.; Andrieu, M.; Palussière, J.C.; Balland, J.; Delafoy, C.; Pijolat, M. High temperature chromium volatilization from Cr2O3 powder and Cr2O3-doped UO2 pellets in reducing atmospheres. J. Nucl. Mater. 2012, 423, 93–101. [Google Scholar] [CrossRef] [Green Version]
- Bosbach, D.; Brandt, F.; Bukaemskiy, A.; Deissmann, G.; Kegler, P.; Klinkenberg, M.; Kowalski, P.M.; Modolo, G.; Niemeyer, I.; Neumeier, S. Research for the Safe Management of Nuclear Waste at Forschungszentrum Jülich: Materials Chemistry and Solid Solution Aspects. Adv. Eng. Mater. 2020, 22, 1901417. [Google Scholar] [CrossRef] [Green Version]
- International Atomic Energy Agency (IAEA). Scientific and Technical Basis for the Geological Disposal of Radioactive Wastes; Technical Reports Series No. 413; IAEA: Vienna, Austria, 2003. [Google Scholar]
- Council of the European Commission (CEC). Council Directive 011/70/ EURATOM of 19 July 2011 Establishing a Community Framework for the Responsible and Safe Management of Spent Fuel and Radioactive Waste; CEC: Brussels, Belgium, 2011. [Google Scholar]
- Lucuta, P.G.; Matzke, H.; Verrall, R.A.; Tasman, H.A. Thermal conductivity of SIMFUEL. J. Nucl. Mater. 1992, 188, 198–204. [Google Scholar] [CrossRef]
- Lucuta, P.G.; Verrall, R.A.; Matzke, H.; Palmer, B.J. Microstructural features of SIMFUEL—Simulated high-burnup UO2-based nuclear fuel. J. Nucl. Mater. 1991, 178, 48–60. [Google Scholar] [CrossRef]
- Nilsson, S.; Jonsson, M. H2O2 and radiation induced dissolution of UO2 and SIMFUEL pellets. J. Nucl. Mater. 2011, 410, 89–93. [Google Scholar] [CrossRef]
- Neck, V.; Kim, J. Solubility and hydrolysis of tetravalent actinides. Radiochim. Acta 2001, 89, 1–16. [Google Scholar] [CrossRef] [Green Version]
- Mennecart, T.; Cachoir, C.; Lemmens, K. Influence of the alpha radiation on the UO2 dissolution in high pH cementitious waters. J. Radioanal. Nucl. Chem. 2015, 304, 61–66. [Google Scholar] [CrossRef]
- Sundin, S.; Dahlgren, B.; Roth, O.; Jonsson, M. H2O2 and radiation induced dissolution of UO2 and SIMFUEL in HCO3- deficient aqueous solution. J. Nucl. Mater. 2013, 443, 291–297. [Google Scholar] [CrossRef]
- Silva, C.M.; Hunt, R.D.; Holliday, K.S. An evaluation of tri-valent oxide (Cr2O3) as a grain enlarging dopant for UO2 nuclear fuels fabricated under reducing environment. J. Nucl. Mater. 2021, 553, 153053. [Google Scholar] [CrossRef]
- Milena-Pérez, A.; Bonales, L.J.; Rodríguez-Villagra, N.; Fernández, S.; Baonza, V.G.; Cobos, J. Raman spectroscopy coupled to principal component analysis for studying UO2 nuclear fuels with different grain sizes due to the chromia addition. J. Nucl. Mater. 2021, 543, 152581. [Google Scholar] [CrossRef]
- Bourgeois, L.; Dehaudt, P.; Lemaignan, C.; Hammou, A. Factors governing microstructure development of Cr2O3-doped UO2 during sintering. J. Nucl. Mater. 2001, 297, 313–326. [Google Scholar] [CrossRef]
- Sun, M.; Stackhouse, J.; Kowalski, P.M. The +2 oxidation state of Cr incorporated into the crystal lattice of UO2. Commun. Mater. 2020, 1, 13. [Google Scholar] [CrossRef] [Green Version]
- Mieszczynski, C.; Kuri, G.; Bertsch, J.; Martin, M.; Borca, C.; Delafoy, C.; Simoni, E. Microbeam X-ray absorption spectroscopy study of chromium in large-grain uranium dioxide fuel. J. Phys. Condens. Matter 2014, 26, 355009. [Google Scholar] [CrossRef] [PubMed]
- Cooper, M.W.D.; Stanek, C.R.; Andersson, D.A. The role of dopant charge state on defect chemistry and grain growth of doped UO2. Acta Mater. 2018, 150, 403–413. [Google Scholar] [CrossRef]
- Hung, N.T.; Thuan, L.B.; Khoai, D.V.; Lee, J.-Y.; Jyothi, R.K. Modeling conversion of ammonium diuranate (ADU) into uranium dioxide (UO2) powder. J. Nucl. Mater. 2016, 479, 483–488. [Google Scholar] [CrossRef]
- Siddiqui, I.; Shah, B.; Tadphale, S.; Kumar, S. A Continuous Process for Precipitation of Ammonium Diuranate from Uranyl Solution: Part 1; Bhabha Atomic Research Centre (BARC)-1422: Bombay, India, 1988.
- Gupta, S.K.; Zuniga, J.P.; Ghosh, P.S.; Abdou, M.; Mao, Y. Correlating Structure and Luminescence Properties of Undoped and Eu3+-Doped La2Hf2O7 Nanoparticles Prepared with Different Coprecipitating pH Values through Experimental and Theoretical Studies. Inorg. Chem. 2018, 57, 11815–11830. [Google Scholar] [CrossRef]
- Vijayaprasath, G.; Murugan, R.; Asaithambi, S.; Sakthivel, P.; Mahalingam, T.; Hayakawa, Y.; Ravi, G. Structural and magnetic behavior of Ni/Mn co-doped ZnO nanoparticles prepared by co-precipitation method. Ceram. Int. 2016, 42, 2836–2845. [Google Scholar] [CrossRef]
- Nästren, C.; Jardin, R.; Somers, J.; Walter, M.; Brendebach, B. Actinide incorporation in a zirconia based pyrochlore (Nd1.8An0.2) Zr2O7 + x (An = Th, U, Np, Pu, Am). J. Solid State Chem. 2009, 182, 1–7. [Google Scholar] [CrossRef]
- Bukaemskiy, A.A.; Barrier, D.; Modolo, G. Compressibility and Sinterability of CeO2–8YSZ Powders Synthesized by a wet Chemical Method. J. Eur. Ceram. Soc. 2009, 29, 1947–1954. [Google Scholar] [CrossRef]
- Babelot, C.; Bukaemskiy, A.; Neumeier, S.; Modolo, G.; Bosbach, D. Crystallization processes, compressibility, sinterability and mechanical properties of La-monazite-type ceramics. J. Eur. Ceram. Soc. 2017, 37, 1681–1688. [Google Scholar] [CrossRef]
- Francis, L.F. (Ed.) Chapter 5—Powder Processes. In Materials Processing; Academic Press: Boston, MA, USA, 2016; pp. 343–414. [Google Scholar]
- Dörr, W.; Assmann, H.; Maier, G.; Steven, J. Bestimmung der dichte, offenen porosität, porengrössenverteilung und spezifischen oberflache von UO2-Tabletten. J. Nucl. Mater. 1979, 81, 135–141. [Google Scholar] [CrossRef]
- Ferreira, R.A.N.; Lopes, J.A.M. Implementation of a fuel pellets density and open porosity measurement system by the xylol penetration-immersion method at CDTN. In Proceedings of the INAC 2007 International Nuclear Atlantic Conference Nuclear Energy and Energetic Challenges for 21st Century 15th Brazilian National Meeting on Reactor Physics and Thermal Hydraulics 8th Brazilian National Meeting on Nuclear Applications, Santos, Brazil, 30 September–5 October 2007. [Google Scholar]
- Kwan, Y.-B.P.; Alcock, J.R. The impact of water impregnation method on the accuracy of open porosity measurements. J. Mater. Sci. 2002, 37, 2557–2561. [Google Scholar] [CrossRef]
- Larson, A.C.; Von Dreele, R.B. General Structure Analysis System (GSAS). Los Alamos National Laboratory Report LAUR 86-748; Los Alamos National Laboratory: Los Alamos, NM, USA, 2004.
- Toby, B.H. EXPGUI, a graphical user interface for GSAS. J. Appl. Crystallogr. 2001, 34, 210–213. [Google Scholar] [CrossRef] [Green Version]
- E112-13, A. Standard Test Methods for Determining Average Grain Size; ASTM International: West Conshohocken, PA, USA, 2013. [Google Scholar]
- Herrero, B.; Bès, R.; Audubert, F.; Clavier, N.; Hunault, M.O.J.Y.; Baldinozzi, G. Charge compensation mechanisms in Nd-doped UO2 samples for stoichiometric and hypo-stoichiometric conditions: Lack of miscibility gap. J. Nucl. Mater. 2020, 539, 152276. [Google Scholar] [CrossRef]
- Chiang, Y.-M.; Birnie, D.P.; Kingery, W.D. Physical Ceramics: Principles for Ceramic Science and Engineering; Wiley: New York, NY, USA, 1997; Volume 409. [Google Scholar]
- Kang, S.-J.L. Sintering: Densification, Grain Growth and Microstructure; Elsevier: Amsterdam, The Netherlands, 2004. [Google Scholar]
- Lahiri, D.; Rao, S.V.R.; Rao, G.V.S.H.; Srivastava, R.K. Study on sintering kinetics and activation energy of UO2 pellets using three different methods. J. Nucl. Mater. 2006, 357, 88–96. [Google Scholar] [CrossRef]


Publisher’s Note: MDPI stays neutral with regard to jurisdictional claims in published maps and institutional affiliations. |
© 2021 by the authors. Licensee MDPI, Basel, Switzerland. This article is an open access article distributed under the terms and conditions of the Creative Commons Attribution (CC BY) license (https://creativecommons.org/licenses/by/4.0/).