
Research on the Hot Deformation Behavior of the Casting NiTi Alloy

Abstract
:1. Introduction
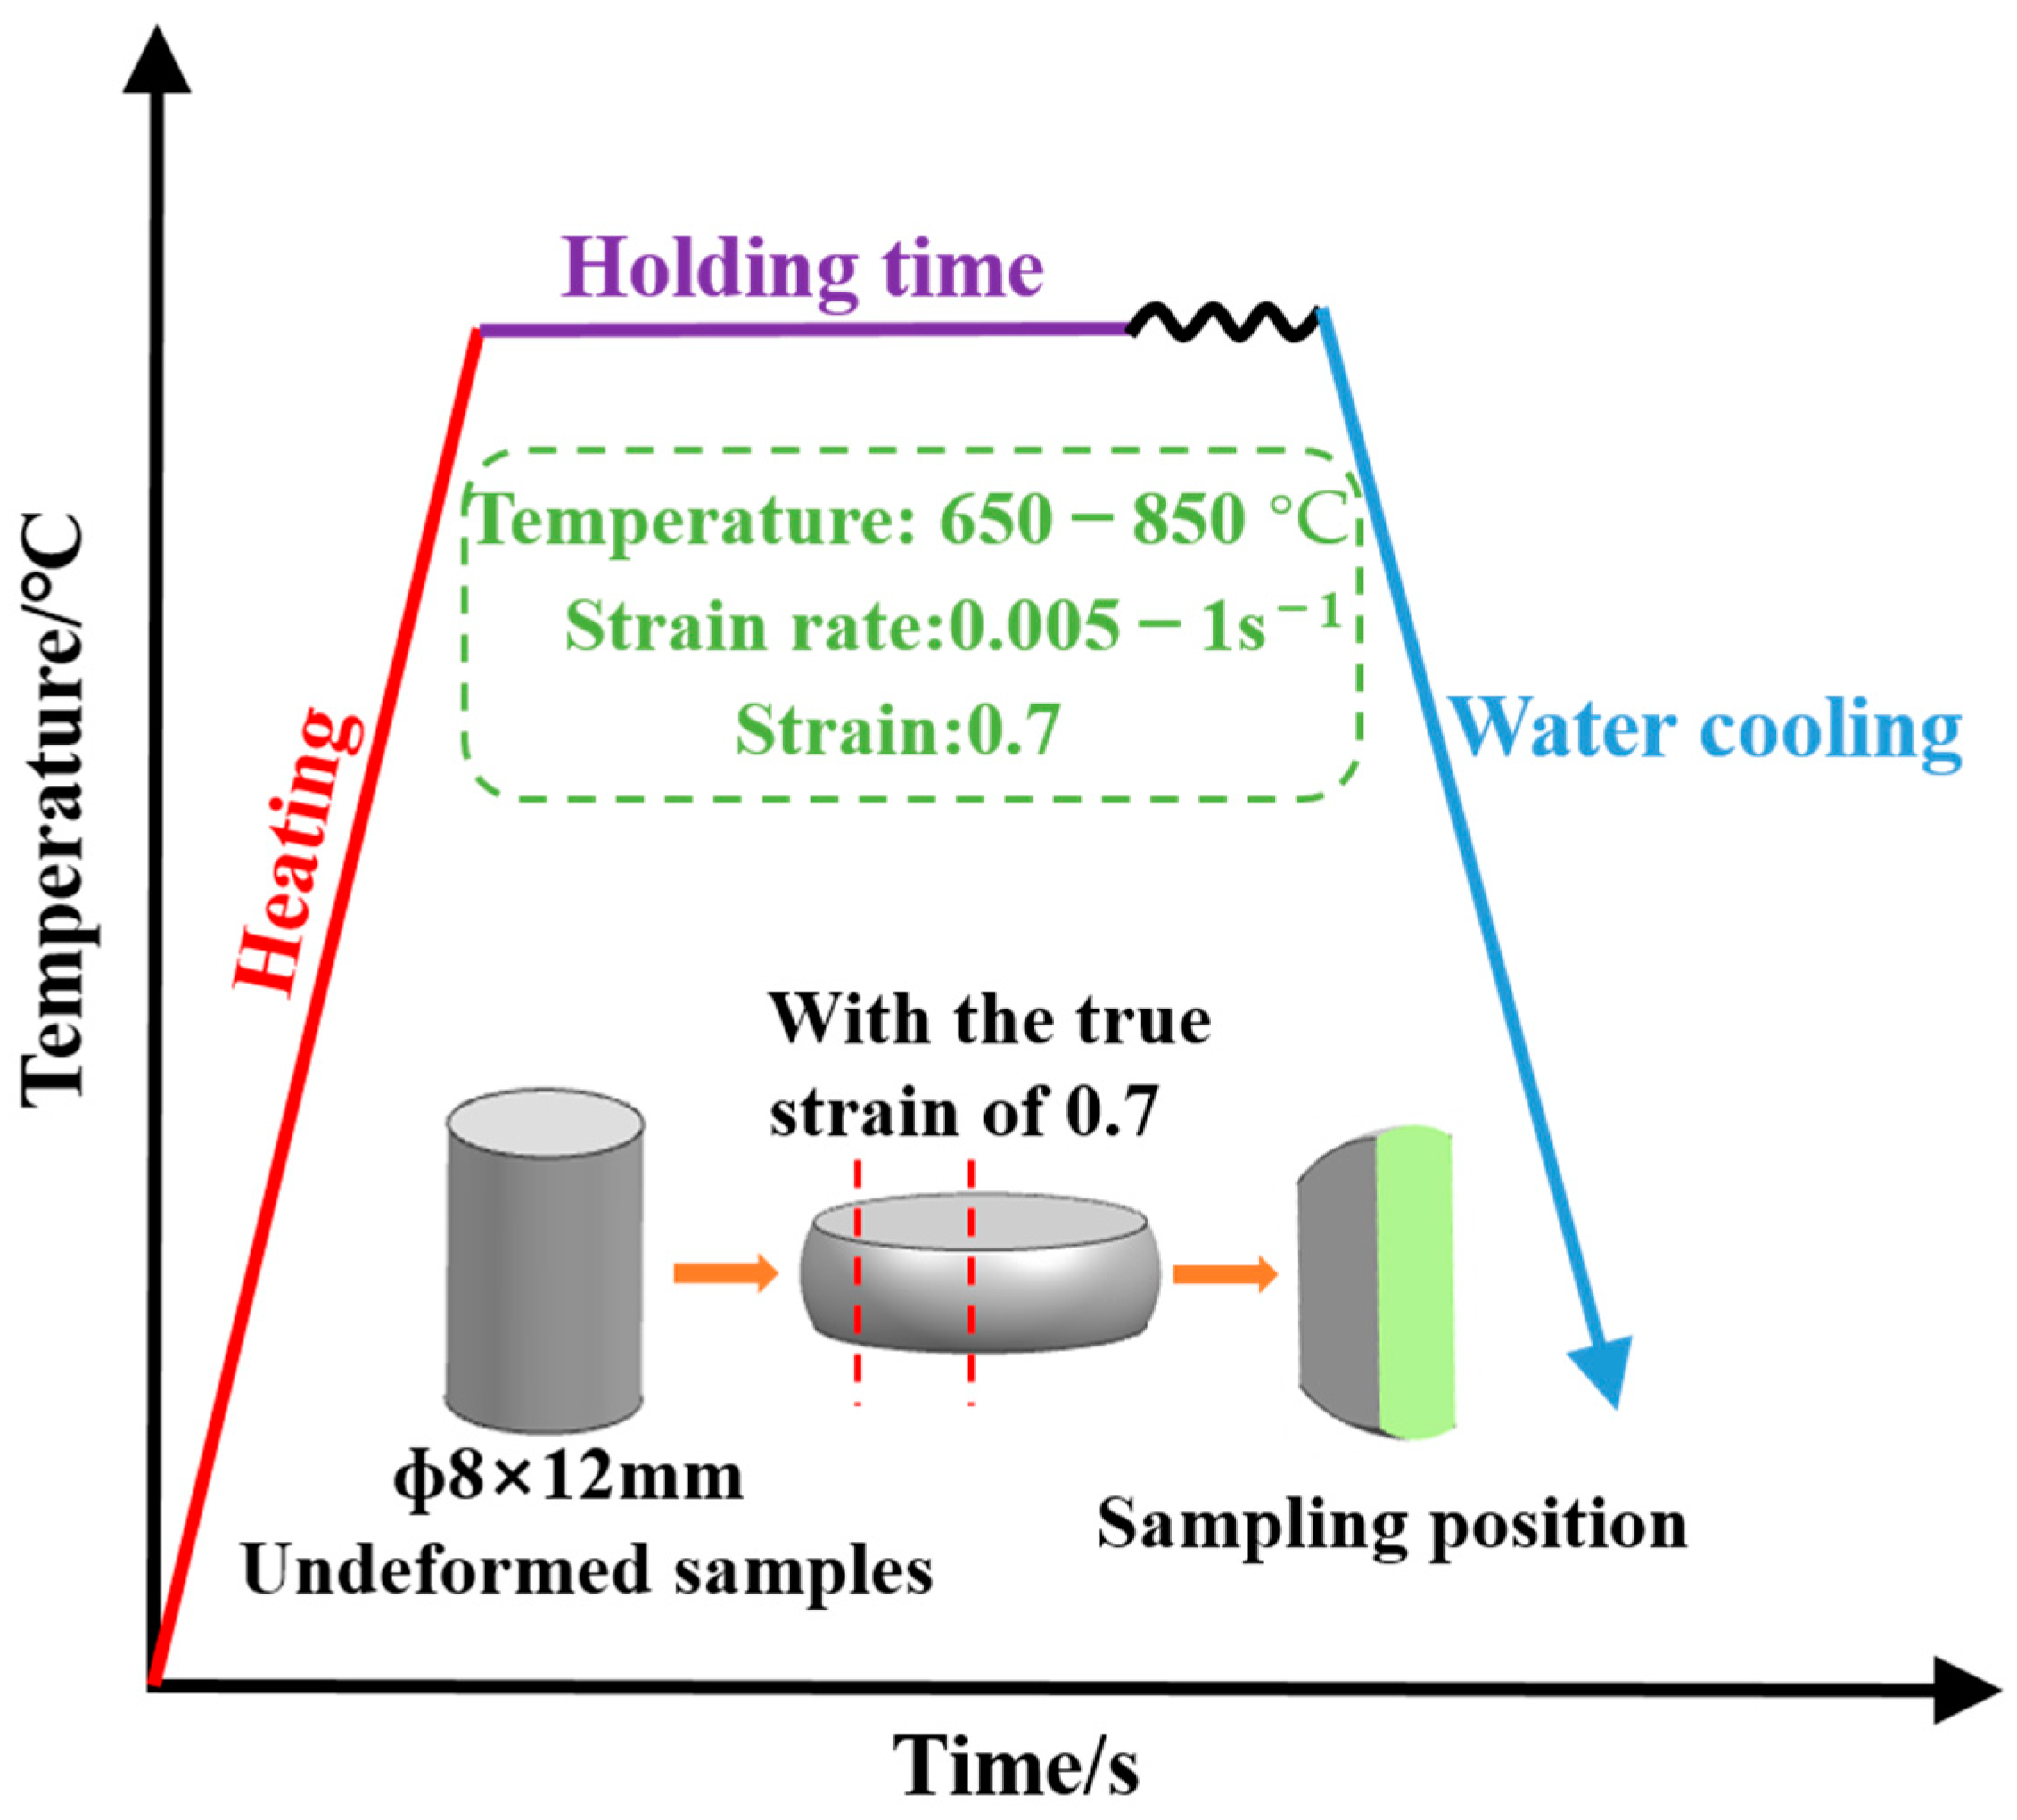
2. Experimental
3. Results and Discussion
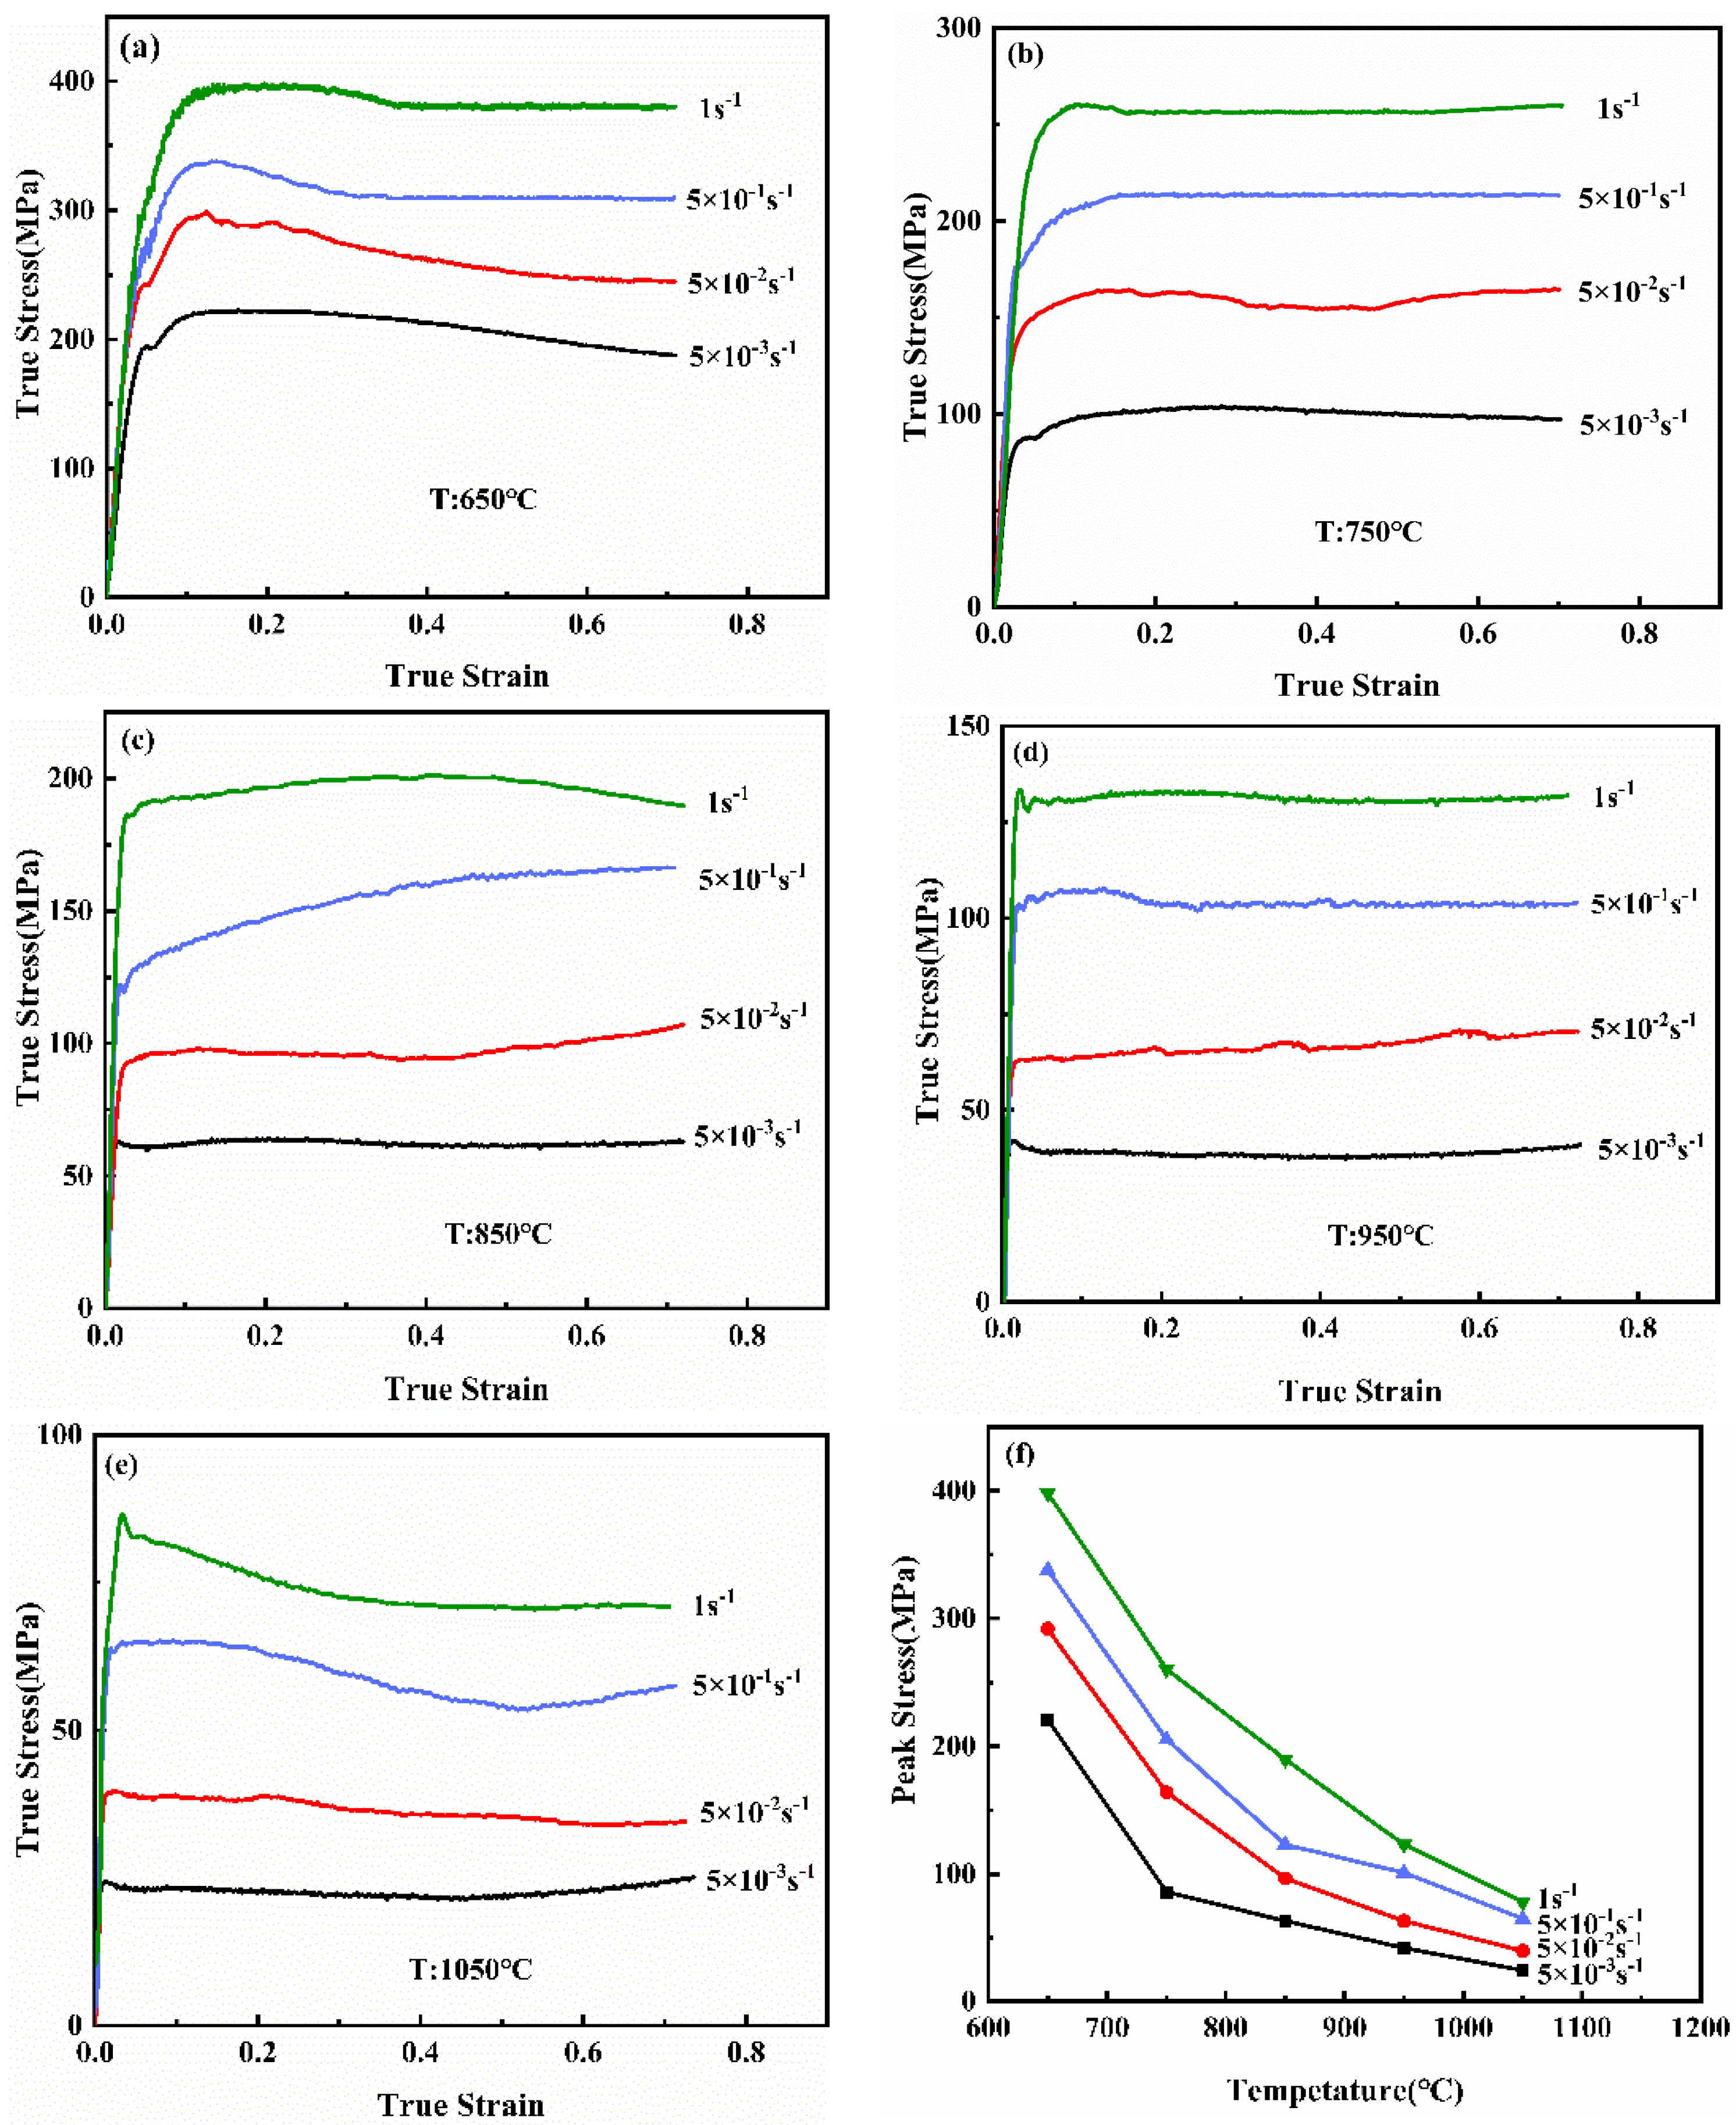
3.1. Mechanical Characteristics of the Casting NiTi Alloy during High-Temperature Deformation
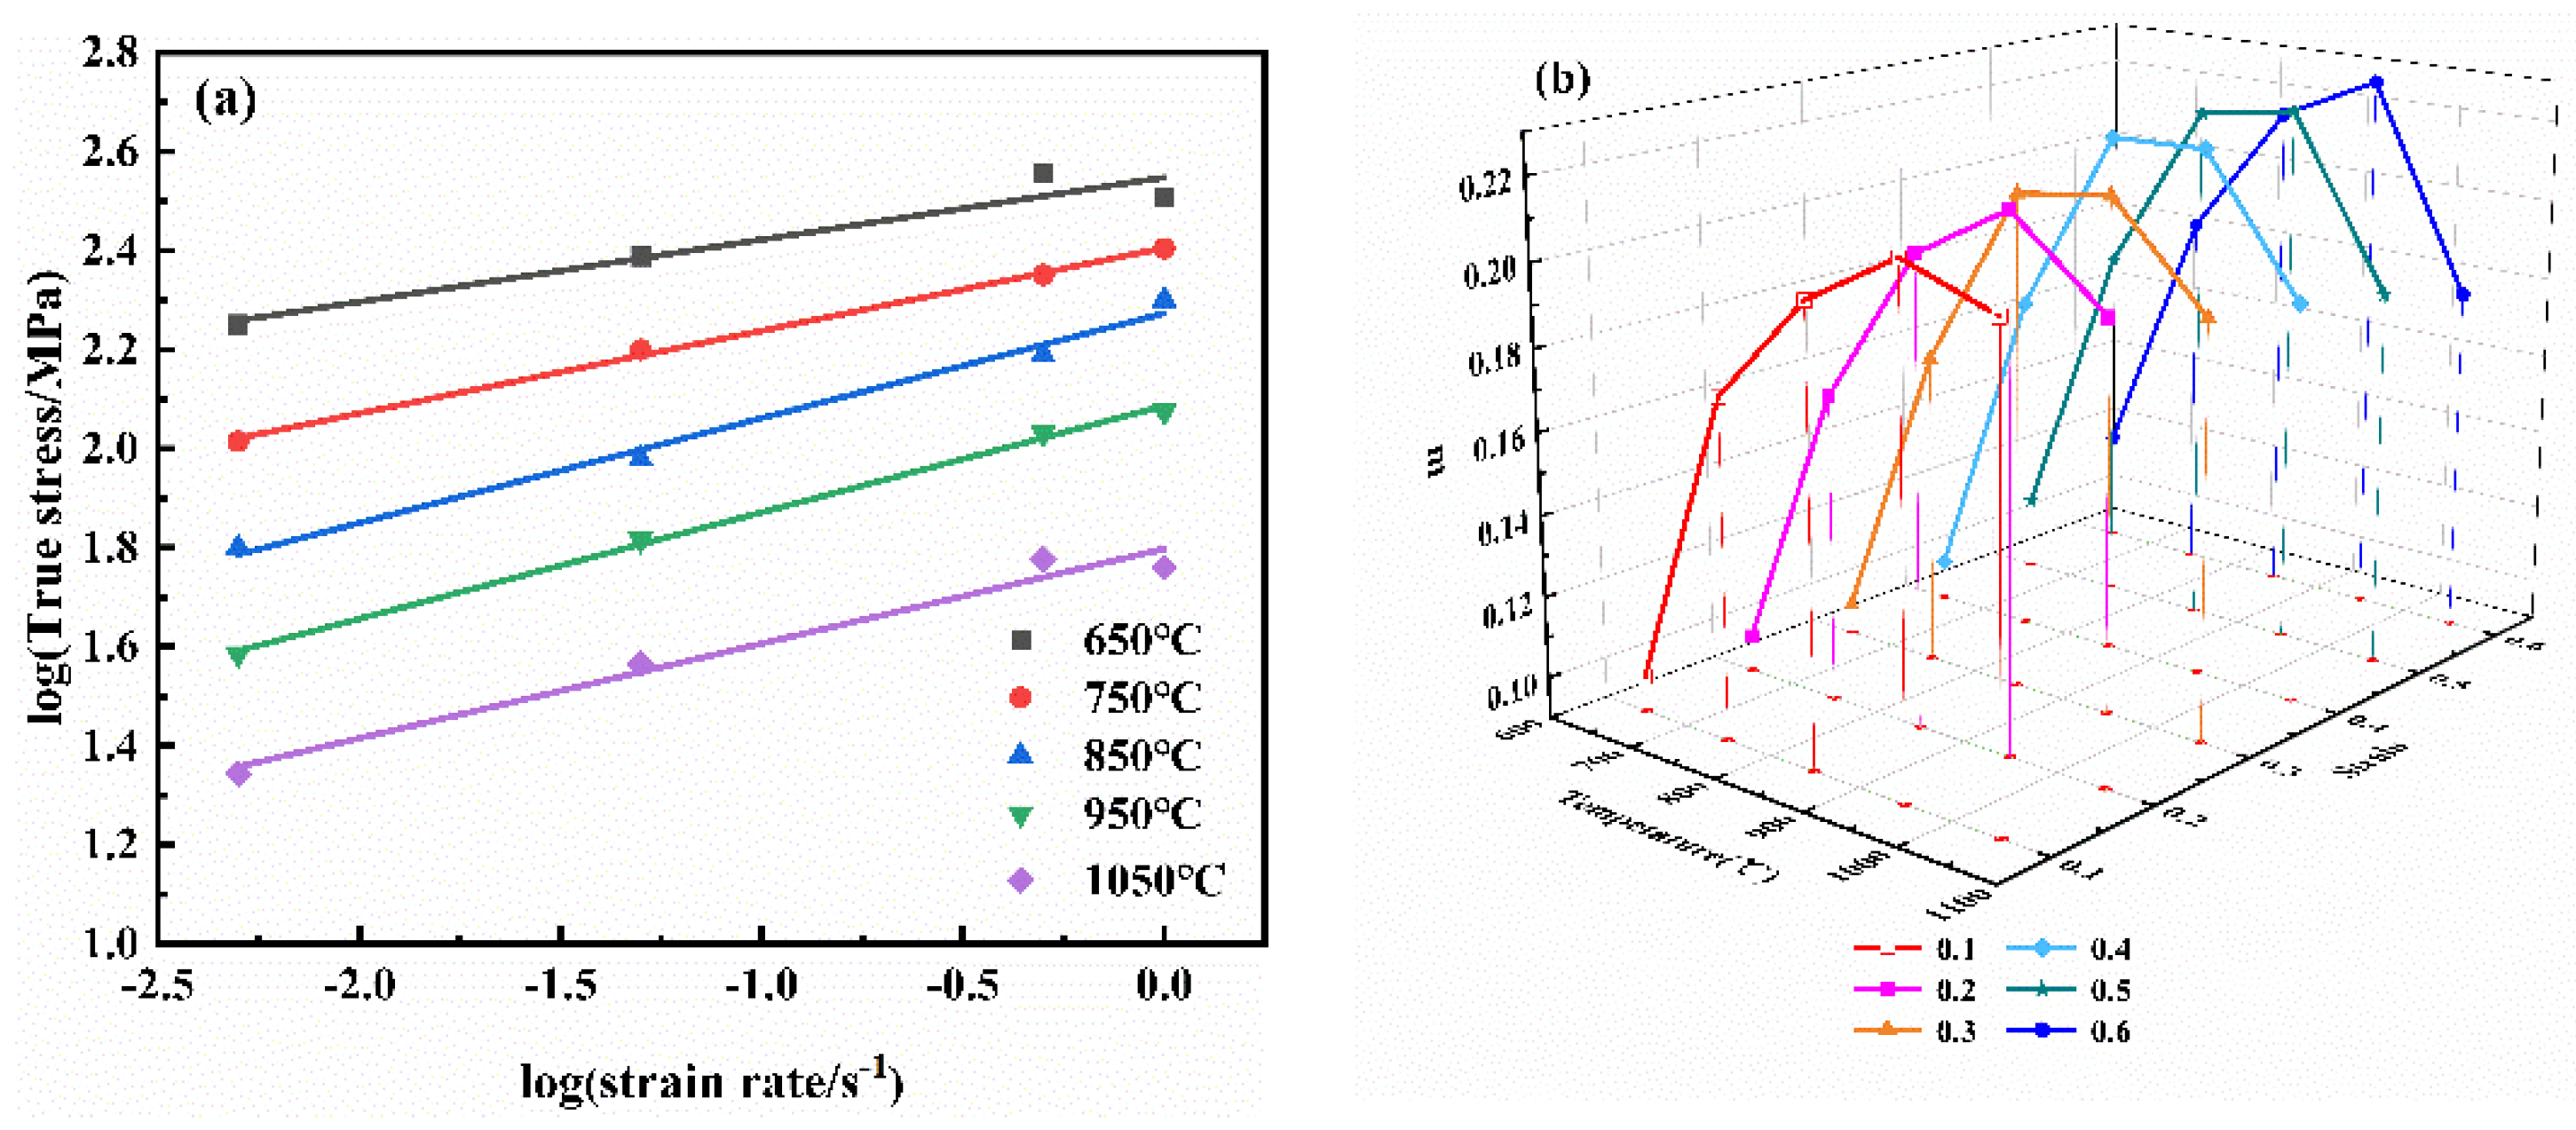
3.2. Strain Rate Sensitivity Exponent of the NiTi Alloy
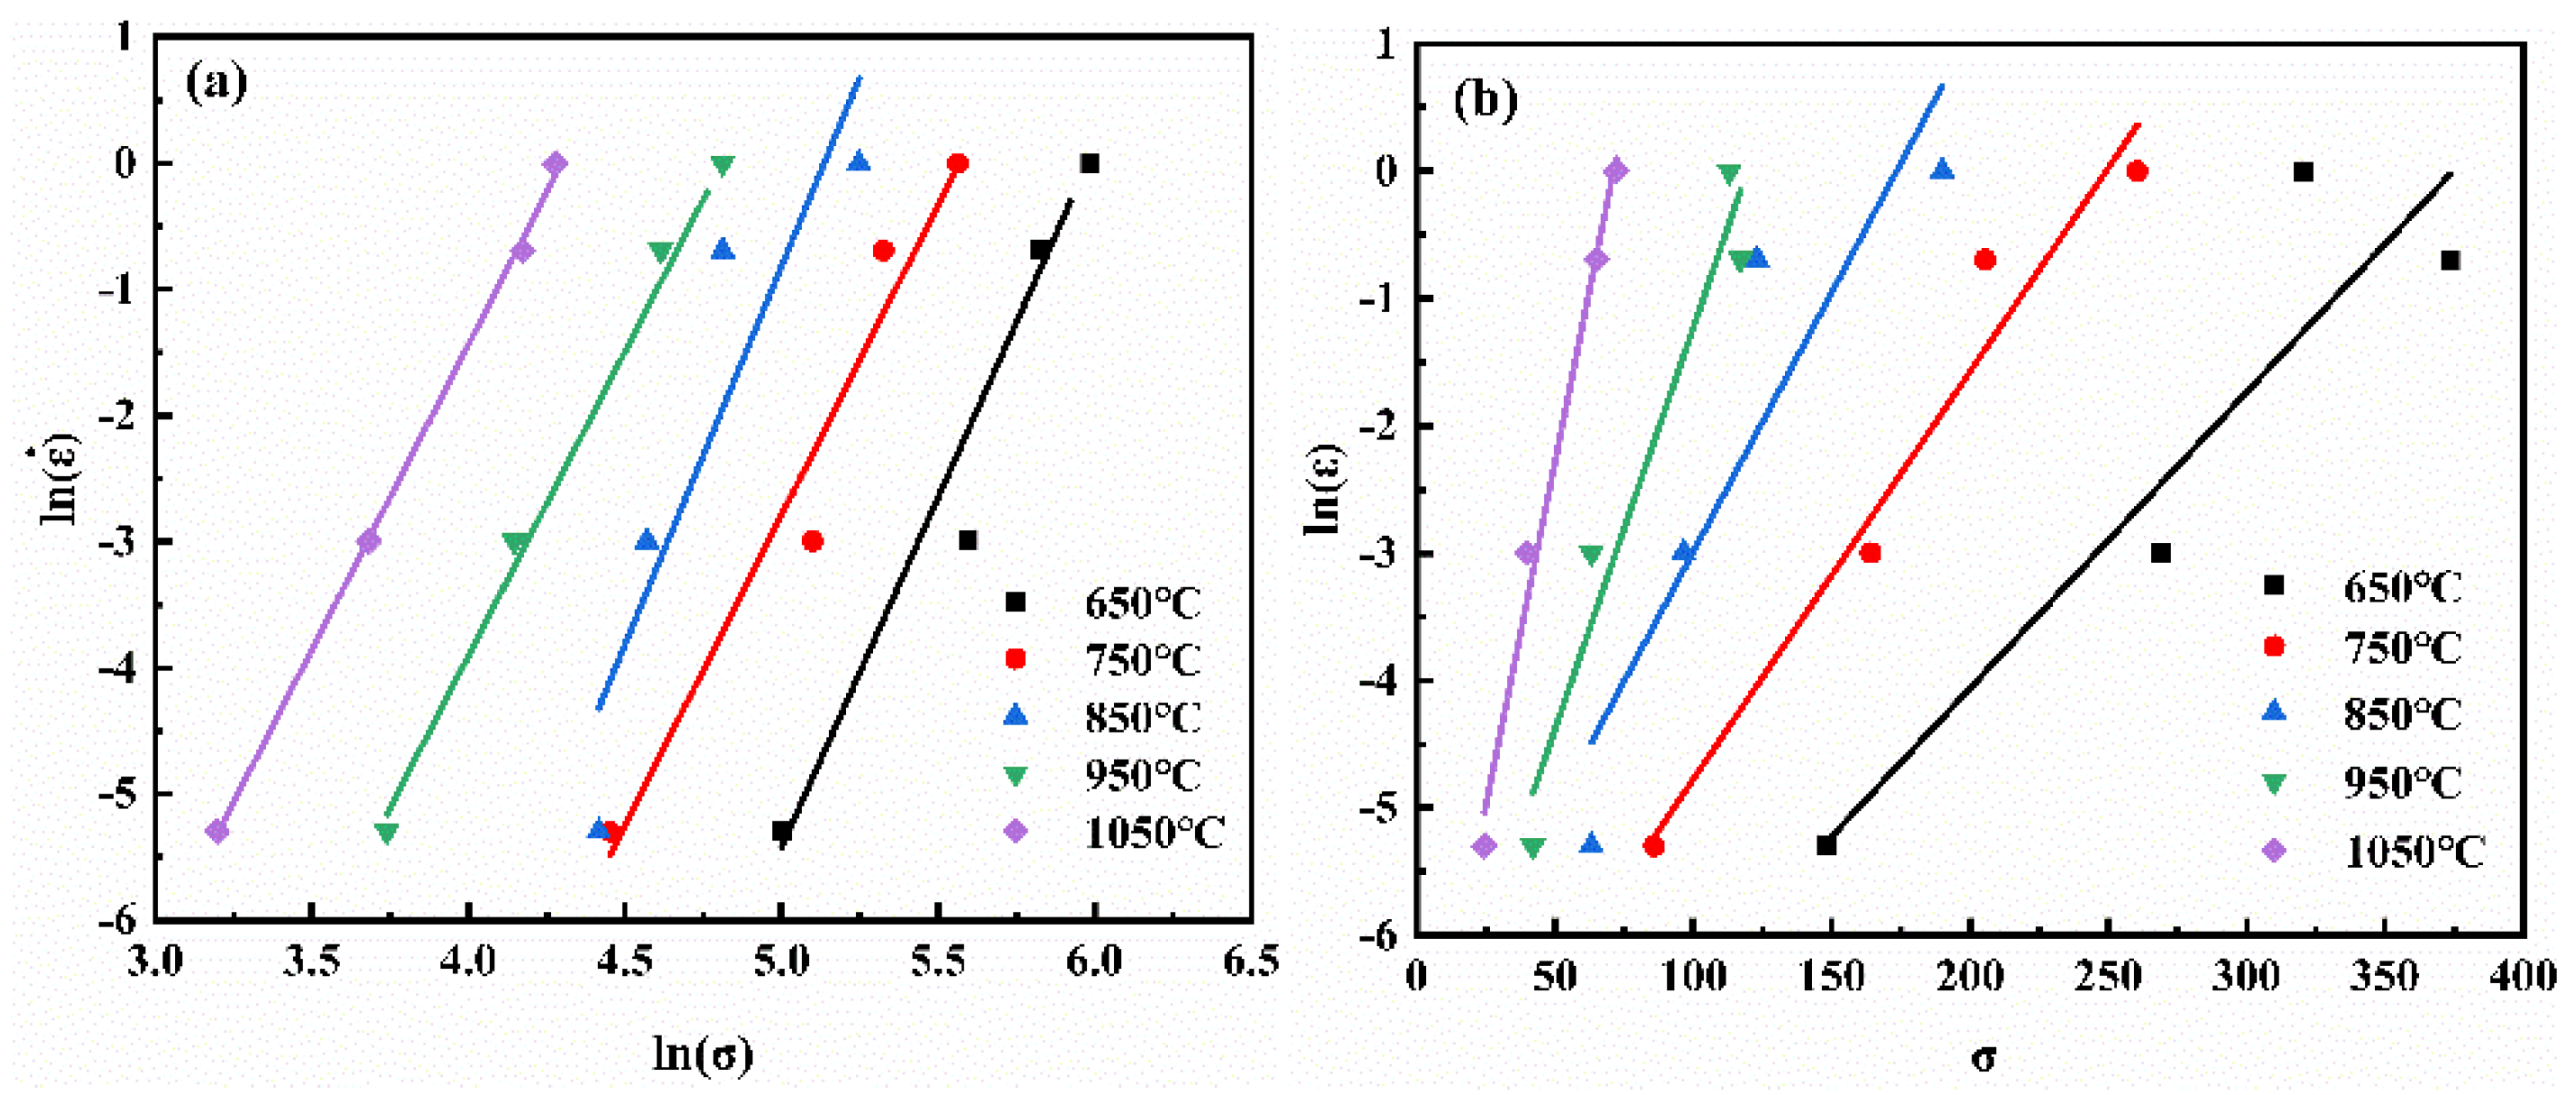
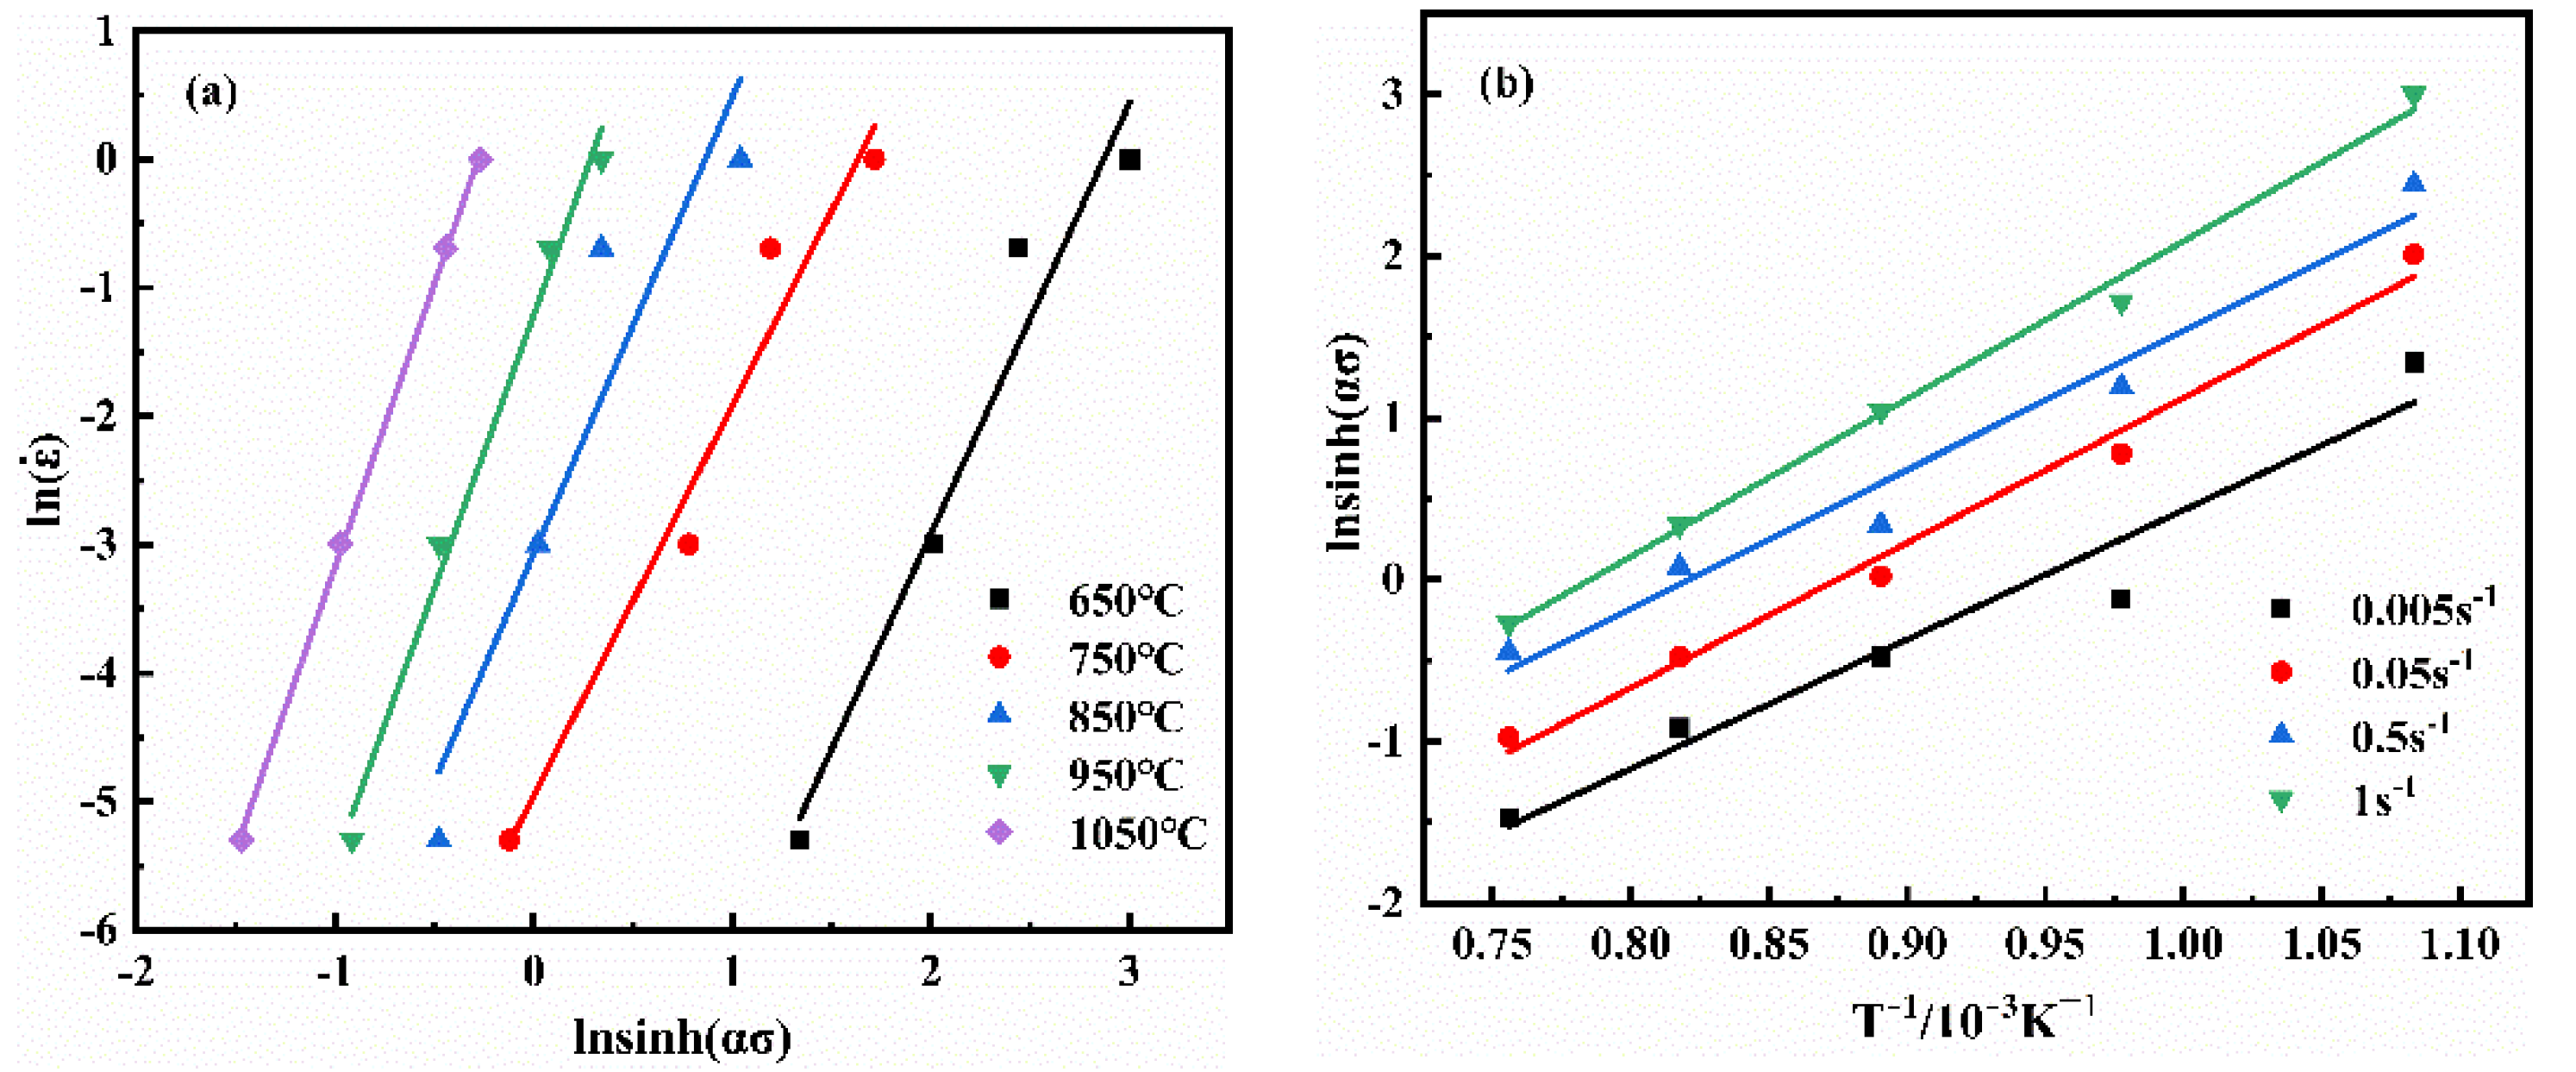
3.3. Hot Deformation Activation Energy of the Casting NiTi Alloy
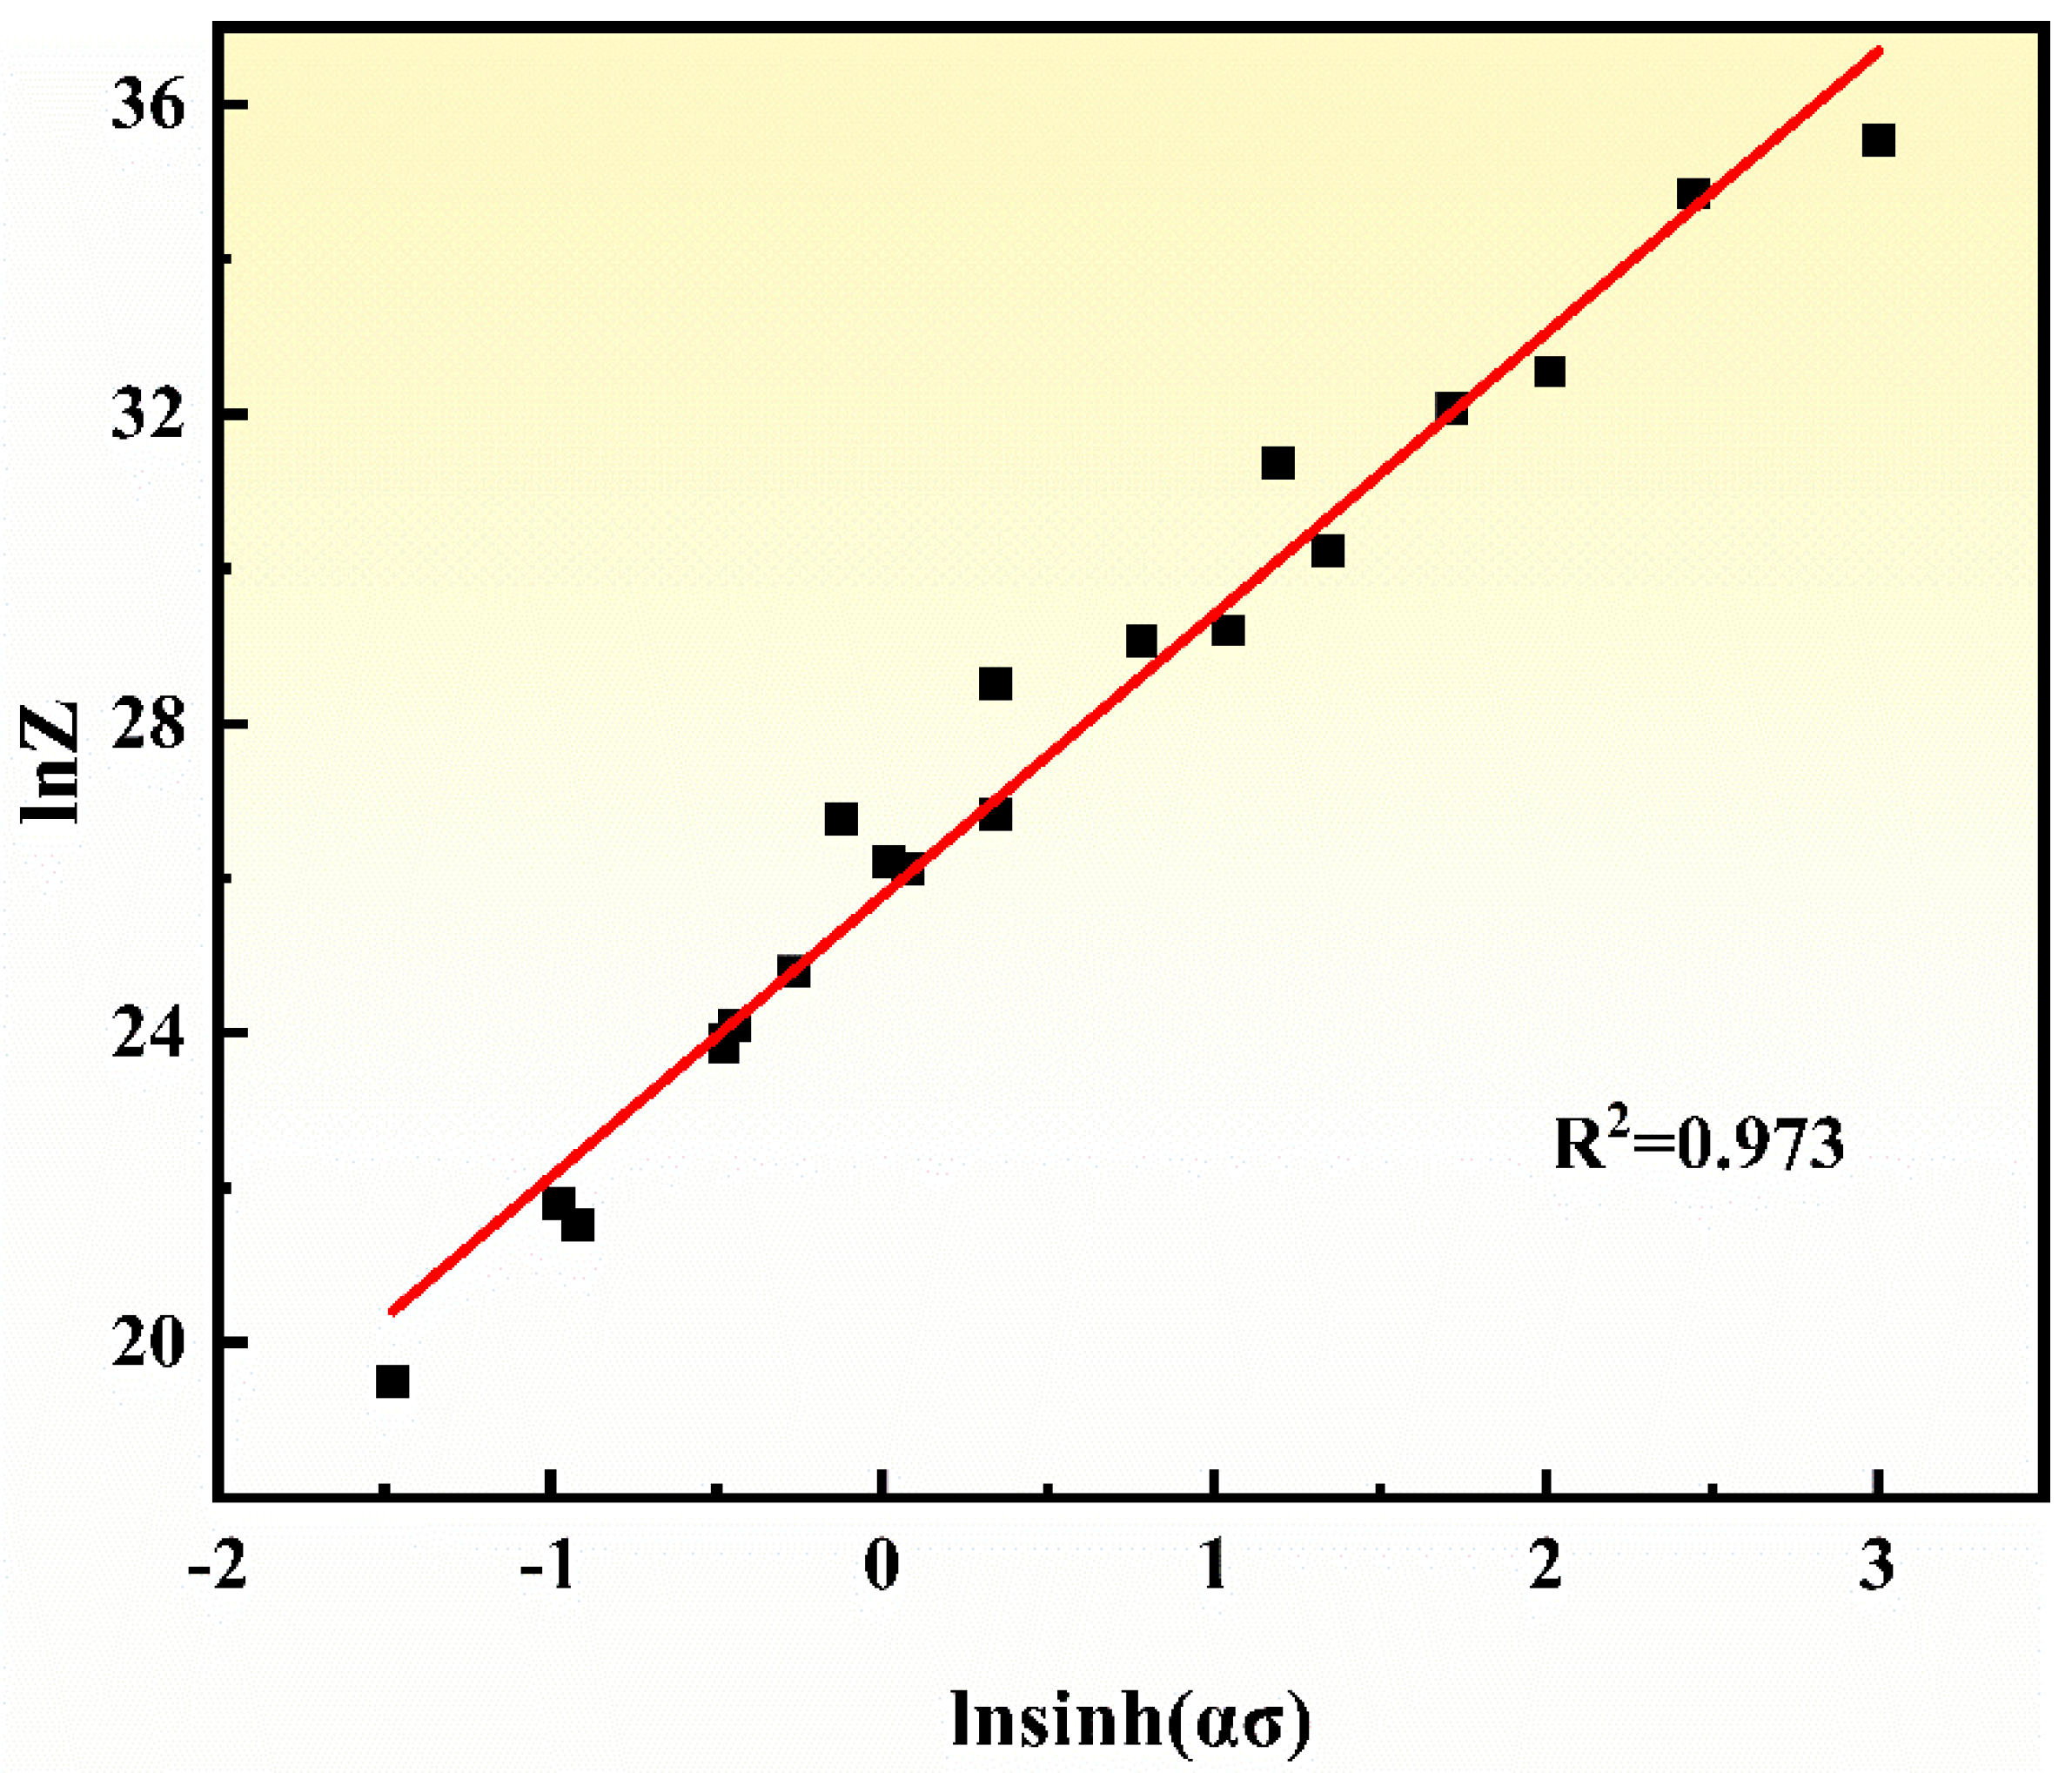
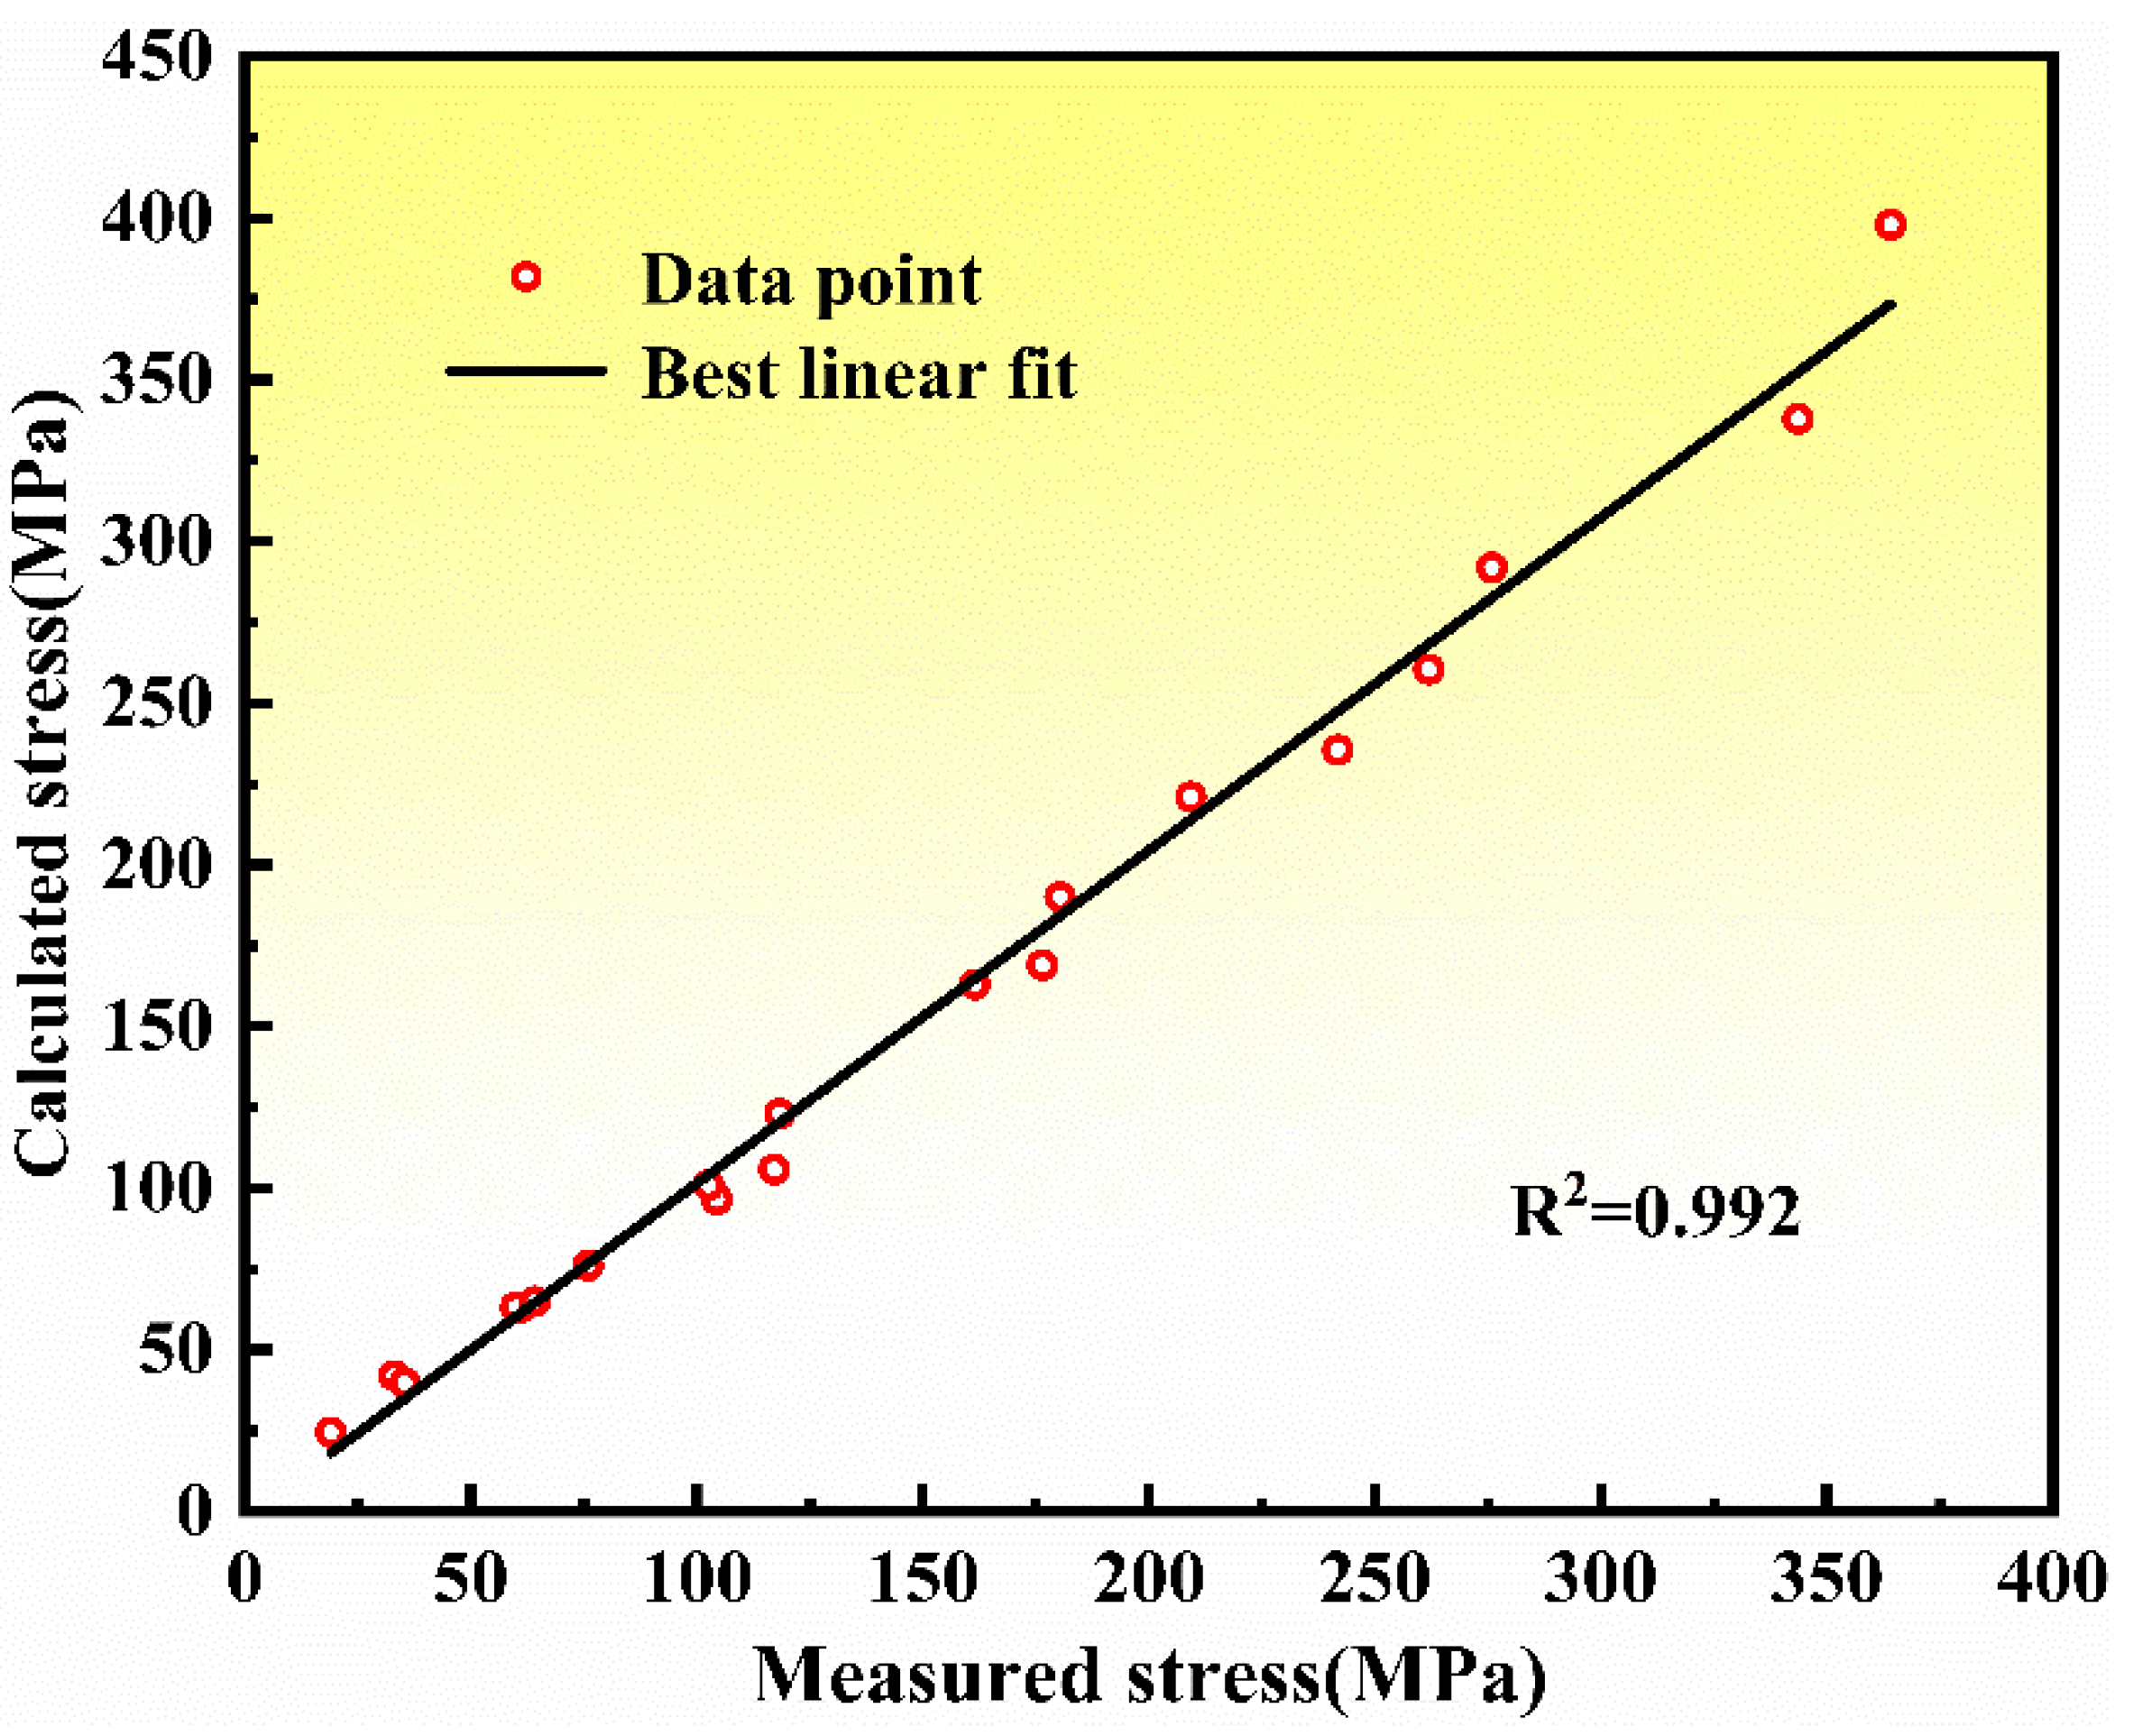
3.4. Hot Deformation Constitutive Relation of the Casting NiTi Alloy
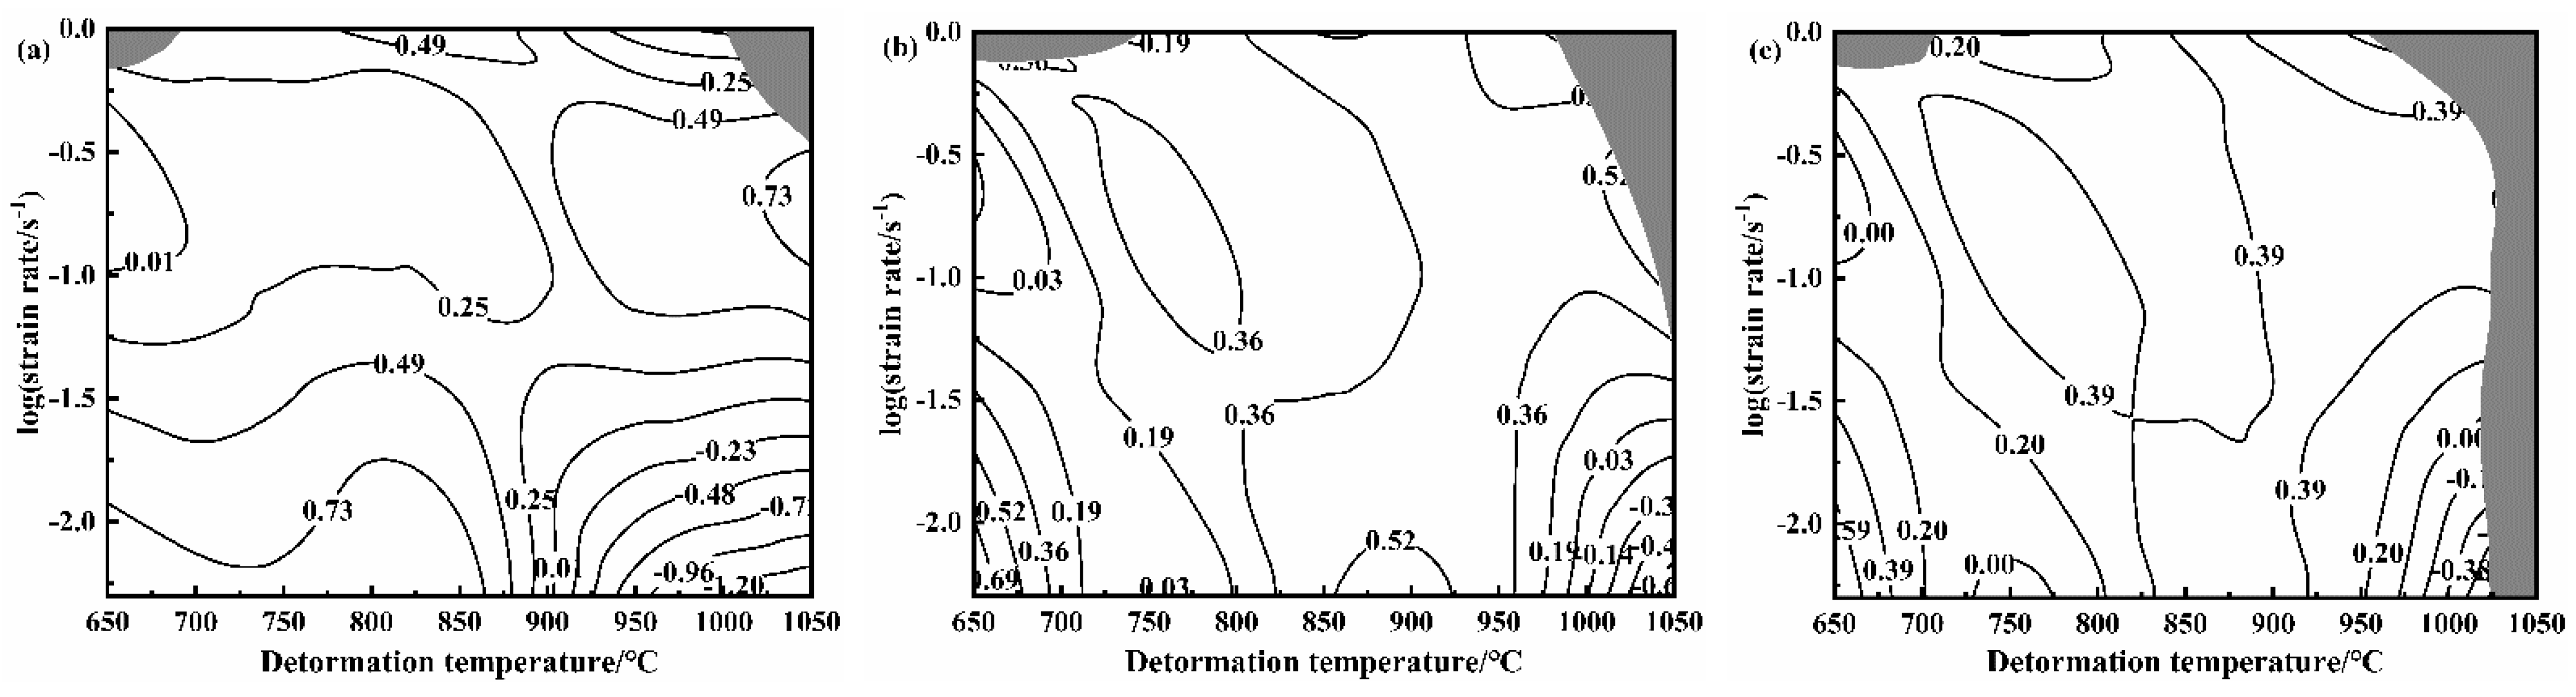
3.5. Hot-Processing Map Construction of the Casting NiTi Alloy
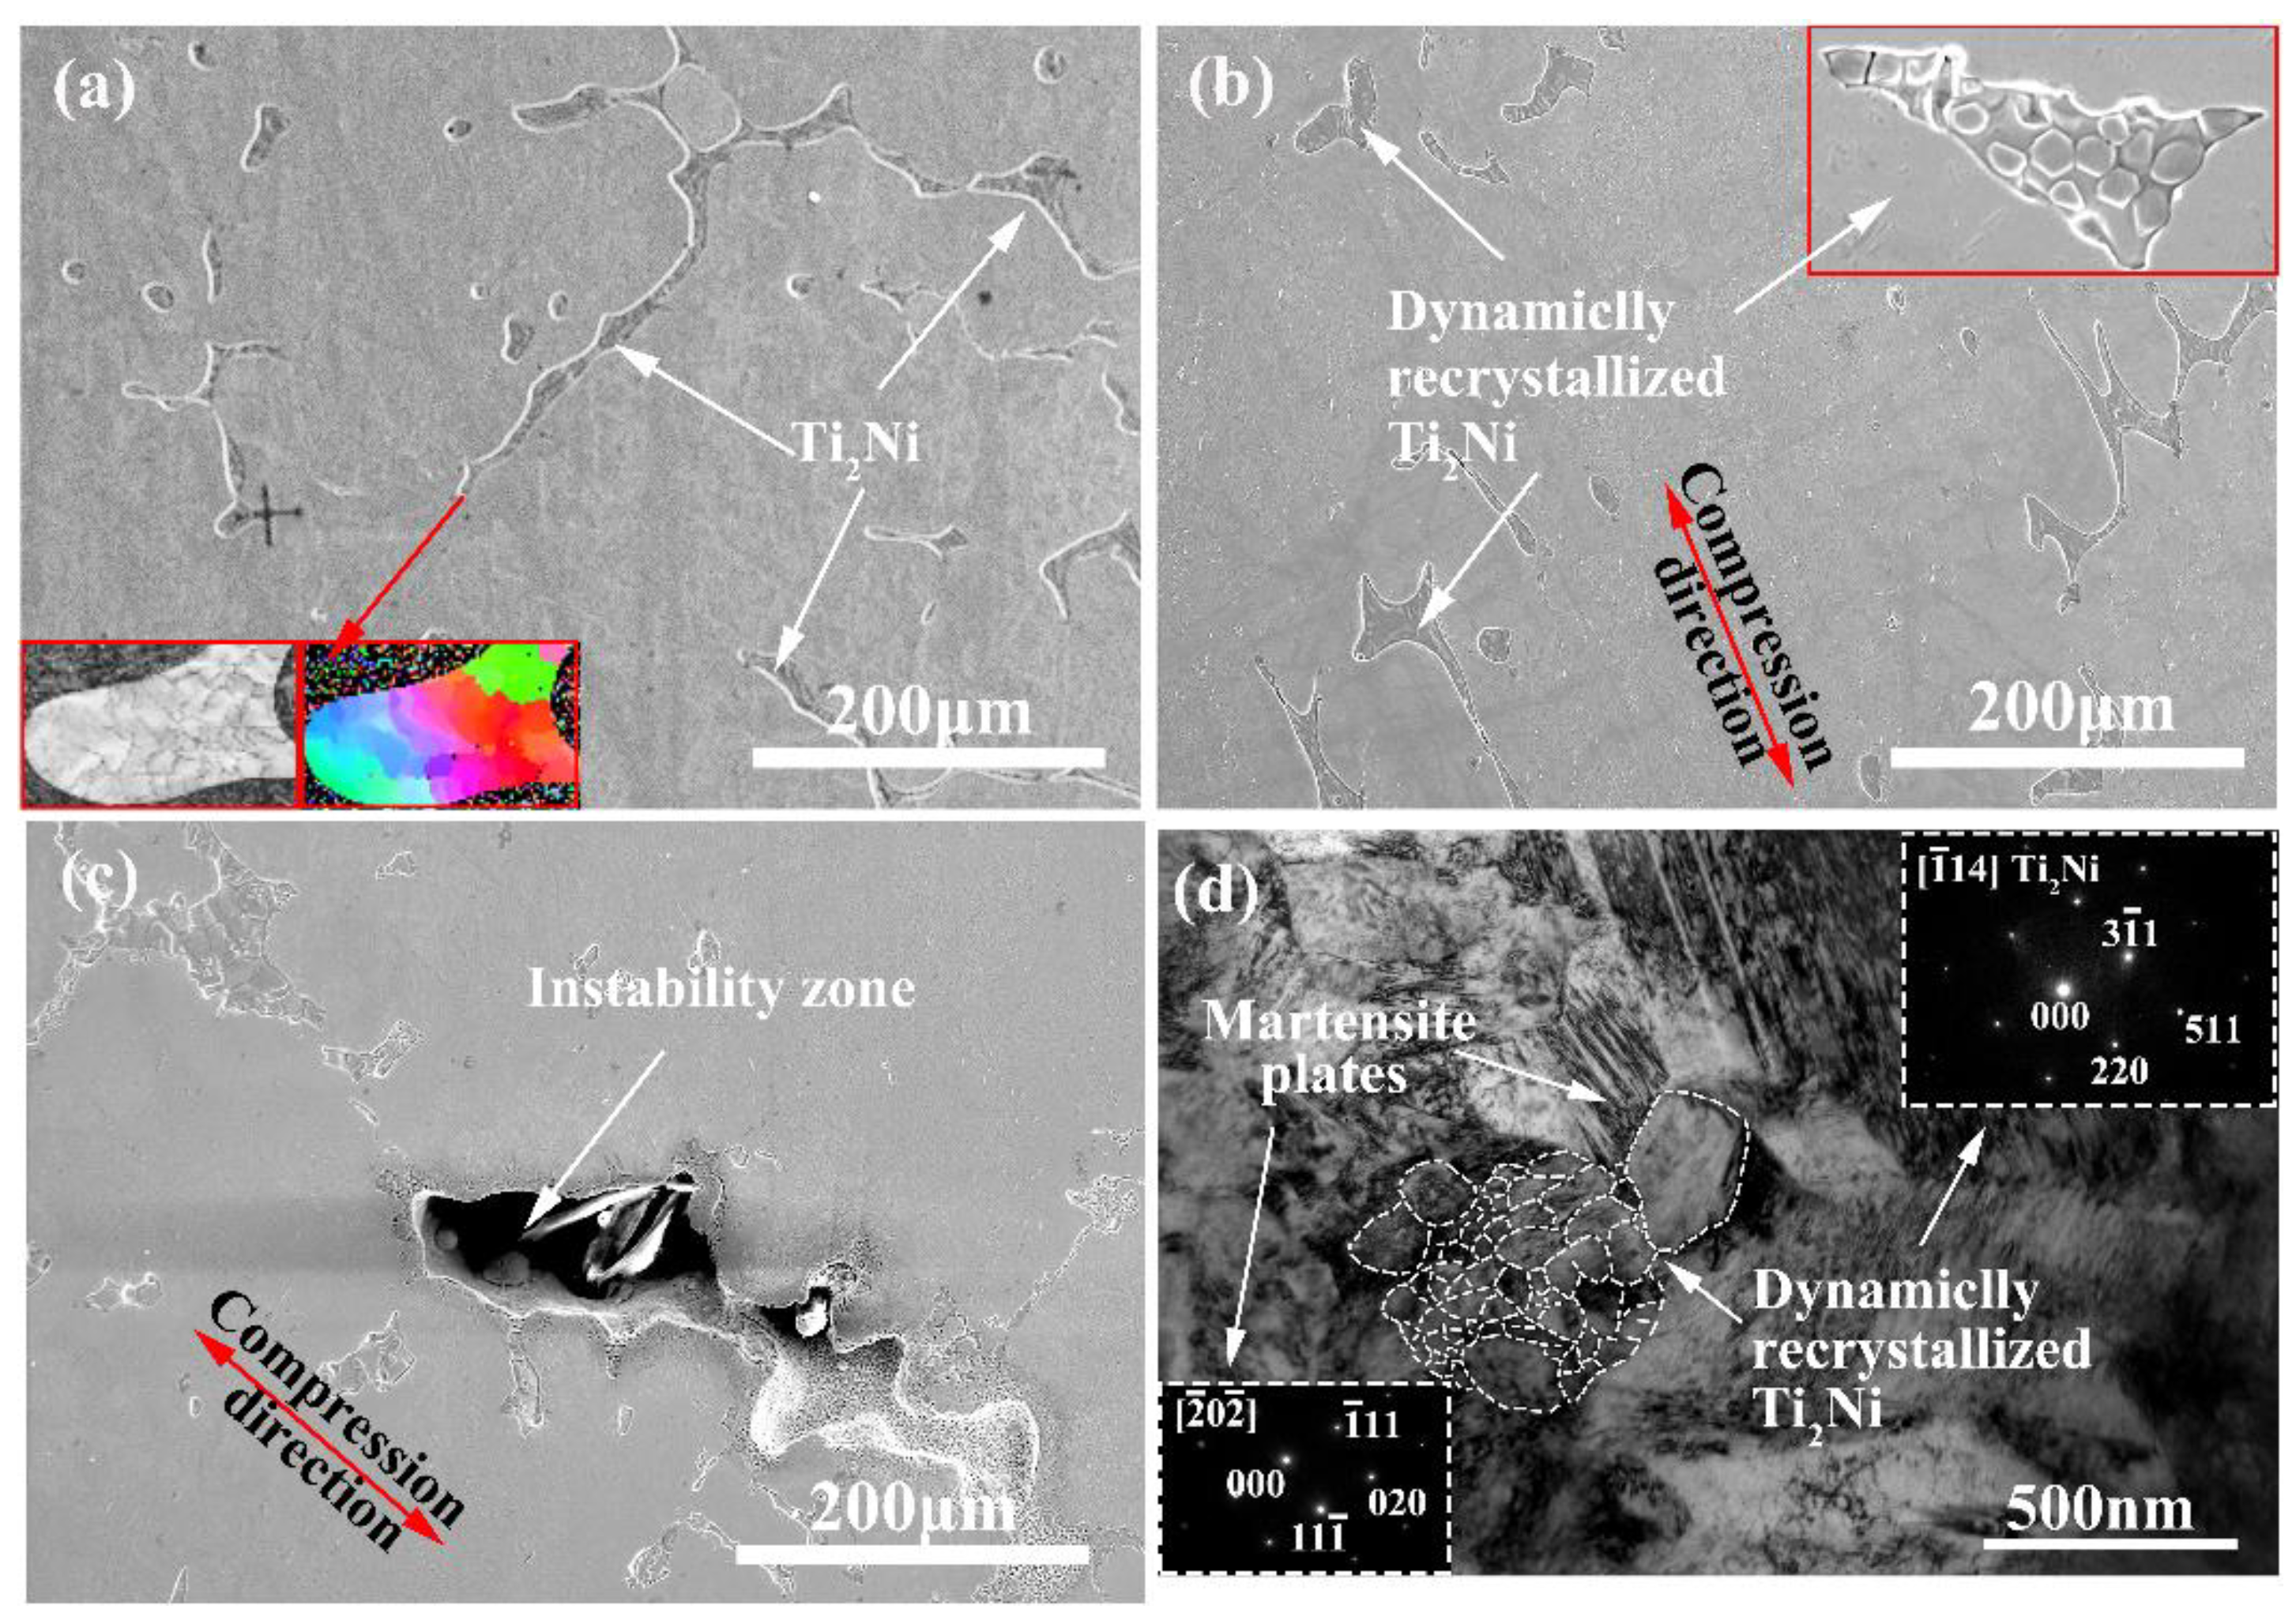
3.6. Microstructure Analysis of the Casting NiTi Alloy
4. Conclusions
Author Contributions
Funding
Institutional Review Board Statement
Informed Consent Statement
Data Availability Statement
Conflicts of Interest
References
- Qin, Q.H.; Peng, H.B.; Fan, Q.C.; Zhang, L.H.; Wen, Y.H. Effect of second phase precipitation on martensitic transformation and hardness in highly Ni-rich NiTi alloys. J. Alloys Compd. 2018, 739, 873–881. [Google Scholar] [CrossRef]
- Li, Y.F.; Zeng, X.G.; Wang, F. Investigation on the micro-mechanism of martensitic transformation in nano-polycrystalline NiTi shape memory alloys using molecular dynamics simulations. J. Alloys Compd. 2020, 821, 153509. [Google Scholar] [CrossRef]
- Wen, S.F.; Gan, J.; Li, F.; Zhou, Y.; Yan, C.Z.; Shi, Y.S. Research Status and Prospect of Additive Manufactured Nickel-Titanium Shape Memory Alloys. Materials 2021, 14, 4496. [Google Scholar] [CrossRef] [PubMed]
- Kato, H. Four-point bending tests to reveal tension-compression flow stress asymmetry in NiTi shape memory alloy thin plate. Mater. Sci. Eng. A 2019, 755, 258–266. [Google Scholar] [CrossRef]
- Wang, J.; Pan, Z.J.; Kristin, C.; Han, J.; Wang, Z.Y.; Li, H.J. Comparative study on crystallographic orientation, precipitation, phase transformation and mechanical response of Ni-rich NiTi alloy fabricated by WAAM at elevated substrate heating temperatures. Mater. Sci. Eng. A 2021, 800, 140307. [Google Scholar] [CrossRef]
- Xiao, Y.; Zeng, P.; Lei, L.P.; Zhang, Y.Z. In situ observation on temperature dependence of martensitic transformation and plastic deformation in superelastic NiTi shape memory alloy. Mater. Des. 2017, 134, 111–120. [Google Scholar] [CrossRef]
- Zhao, M.; Qing, H.B.; Wang, Y.X.; Liang, J.; Zhao, M.Y.; Geng, Y.L.; Liang, J.Z.; Lu, B.H. Superelastic behaviors of additively manufactured porous NiTi shape memory alloys designed with Menger sponge-like fractal structures. Mater. Des. 2021, 200, 109448. [Google Scholar] [CrossRef]
- Kai, H.; Sun, Q.P.; Chao, Y.; Yin, H. Deformation behaviors of gradient nanostructured superelastic NiTi shape memory alloy. Mater. Sci. Eng. A 2020, 786, 139389. [Google Scholar] [CrossRef]
- Zhang, X.P.; Wang, G.J.; Luo, B.Q.; Simon, N.B.; Tan, F.L.; Zhao, F.; Zhao, J.H.; Sun, C.W.; Liu, C.L. Mechanical response of near-equiatomic NiTi alloy at dynamic high pressure and strain rate. J. Alloys Compd. 2018, 731, 569–576. [Google Scholar] [CrossRef]
- Chang, S.H.; Lin, K.H.; Wu, S.K. Effects of Cold-Rolling/Aging Treatments on the Shape Memory Properties of Ti49.3Ni50.7 Shape Memory Alloy. Materials 2017, 10, 704. [Google Scholar] [CrossRef] [Green Version]
- Fan, Q.C.; Zhang, T.H.; Wang, Y.Y.; Sun, M.Y.; Meng, Y.T.; Huang, S.K.; Wen, Y.H. Influences of transformation behavior and precipitates on the deformation behavior of Ni-rich NiTi alloys. Mater. Sci. Eng. A 2017, 700, 269–280. [Google Scholar] [CrossRef]
- Takeda, K.; Tobushi, H.; Pieczyska, E.A. Transformation-Induced Creep and Creep Recovery of Shape Memory Alloy. Materials 2012, 5, 909–921. [Google Scholar] [CrossRef] [Green Version]
- Jiang, S.Y.; Zhang, Y.Q.; Fan, H.T. Fracture behavior and microstructure of as-cast NiTi shape memory alloy. Trans. Nonferrous Met. Soc. China 2012, 22, 1401–1406. [Google Scholar] [CrossRef]
- Morakabati, M.; Aboutalebi, M.; Kheirandish, S.H.; Taheri, A.K.; Abbasi, S.M. Hot tensile properties and microstructural evolution of as cast NiTi and NiTiCu shape memory alloys. Mater. Des. 2011, 32, 406–413. [Google Scholar] [CrossRef]
- Luo, J.; Ye, W.J.; Ma, X.X.; John, O.B.; John, J.L. The evolution and effects of second phase particles during hot extrusion and re-extrusion of a NiTi shape memory alloy. J. Alloys Compd. 2018, 735, 1145–1151. [Google Scholar] [CrossRef]
- Luo, J.; John, O.B.; John, J.L. Microstructural heterogeneity and texture of as-received, vacuum arc-cast, extruded, and re-extruded NiTi shape memory alloy. J. Alloys Compd. 2017, 712, 494–509. [Google Scholar] [CrossRef]
- Motemani, Y.; Nili-Ahmadabadi, M.; Tan, M.J.; Bornapour, M.; Rayagan, S.H. Effect of cooling rate on the phase transformation behavior and mechanical properties of Ni-rich NiTi shape memory alloy. J. Alloys Compd. 2009, 469, 164–168. [Google Scholar] [CrossRef]
- Bhagyaraj, J.; Ramaiah, K.V.; Saikrishna, C.N.; Bhaumik, S.K. Gouthama. Behavior and effect of Ti2Ni phase during processing of NiTi shape memory alloy wire from cast ingot. J. Alloys Compd. 2013, 581, 344–351. [Google Scholar] [CrossRef]
- Sun, D.; Jiang, S.Y.; Xing, X.D.; Yan, B.Y.; Yu, J.B.; Zhang, Y.Q. Microstructures and Mechanical Properties of Equiatomic NiTi Shape Memory Alloy Undergoing Local Canning Compression and Subsequent Annealing. Met. Mater. Int. 2021, 11, 1–10. [Google Scholar] [CrossRef]
- Zhang, W.H.; Zhang, S.H. Correction of Hot Compression Test Data and Constitutive Equation of NiTi Alloy. Acta Metall. Sin. 2006, 42, 1036–1040. [Google Scholar]
- Jiang, S.Y.; Zhang, Y.Q.; Zhao, Y.N. Dynamic recovery and dynamic recrystallization of NiTi shape memory alloy under hot compression deformation. Trans. Nonferrous Met. Soc. China 2013, 23, 140–147. [Google Scholar] [CrossRef]
- Zhang, Y.P.; Jiang, S.Y.; Zhao, Y.N.; Liu, S.W. Constitutive equation and processing map of equiatomic NiTi shape memory alloy under hot plastic deformation. Trans. Nonferrous Met. Soc. China 2016, 26, 2152–2161. [Google Scholar] [CrossRef]
- Yang, Z.L.; Wang, H.; Huang, Y.L.; Ye, X.P.; Li, J.; Zhang, C.S.; Li, H.J.; Pang, B.B.; Huang, C.Q.; Sun, G.G. Strain rate dependent mechanical response for monoclinic NiTi shape memory alloy: Micromechanical decomposition and model validation via neutron diffraction. Mater. Des. 2020, 191, 108656. [Google Scholar] [CrossRef]
- Nayan, N.; Singh, G.; Murty, S.V.S.N.; Narayan, P.R.; Mohan, M.; Venkitakrishnan, P.V.; Ramamurty, U. Effect of ternary additions of Cu and Fe on the hot deformation behavior of NiTi shape memory alloy-A study using processing maps. Intermetallic 2021, 131, 107084. [Google Scholar] [CrossRef]
- Yuan, H.; Liu, W.C. Effect of the δ phase on the hot deformation behavior of Inconel 718. Mater. Sci. Eng. A 2005, 408, 281–289. [Google Scholar] [CrossRef]
- Dong, F.Y.; Yuan, Y.; Li, W.D.; Zhang, Y.; Liaw, P.K.; Yuan, X.G.; Huang, H.J. Hot deformation behavior and processing maps of an equiatomic MoNbHfZrTi refractory high entropy alloy. Intermetallics 2020, 126, 106921. [Google Scholar] [CrossRef]
- Sellars, C.M.; Mctegart, W.J. On the mechanism of hot deformation. Acta Metall. 1966, 14, 1136–1138. [Google Scholar] [CrossRef]
- Song, L.Y.; Gao, X.H.; Wang, M.M.; Xue, Q.H.; Misra, R.D.K.; Li, J.B.; Wu, H.Y.; Du, L.X. Study on Flow Behavior and Processing Maps of High‐Ti low‐C Microalloyed Steel during Hot Compression. Steel Res. Int. 2021, 92, 2100009. [Google Scholar] [CrossRef]
- Kittner, K.; Ullmann, M.; Prahl, U. A Comparative Study on the Hot Deformation Behavior of As-Cast and Twin-Roll Cast Mg-6.8Y-2.5Zn-0.4Zr Alloy. Materials 2021, 14, 3628. [Google Scholar] [CrossRef]
- Wang, Z.; Xu, X.W.; Zhang, B. Hot compression deformation behavior of biomedical Ni–Ti alloy. Rare Met. 2019, 38, 609–619. [Google Scholar] [CrossRef]
- Prasad, Y.; Gegel, H.L.; Doraivelu, S.M.; Malas, J.C.; Morgan, J.T.; Lark, K.A.; Barker, D.R. Modeling of dynamic material behavior in hot deformation: Forging of Ti-6242. Metall. Trans. A 1984, 15, 1883–1892. [Google Scholar] [CrossRef]
- Raj, R. Development of a Processing Map for Use in Warm-Forming and Hot-Forming Processes. Metall. Trans. A 1981, 1, 1089–1097. [Google Scholar] [CrossRef]
- Zhang, J.Q.; Di, H.S.; Wang, H.T.; Mao, K.; Ma, T.J.; Cao, Y. Hot deformation behavior of Ti-15-3 titanium alloy: A study using processing maps, activation energy map, and Zener–Hollomon parameter map. J. Mater. Sci. 2012, 47, 4000–4011. [Google Scholar] [CrossRef]
- Yang, Z.J.; Yu, W.X.; Lang, S.T.; Wei, J.Y.; Wang, G.L.; Ding, P. Hot Deformation Behavior and Processing Maps of a New Ti-6Al-2Nb-2Zr-0.4B Titanium Alloy. Materials 2021, 14, 2456. [Google Scholar] [CrossRef] [PubMed]
- Zhang, Y.S.; Yang, Z.Z.; Zhou, G.; Zhang, H.Y.; Chen, L.J.; Guan, L. Thermocompression Deformation Behavior and Mechanism of Ni60Ti40 Alloy. Rare Metal. Mat. Eng. 2021, 50, 2385–2392. [Google Scholar]
- Mirzadeh, H.; Parsa, M.H. Hot deformation and dynamic recrystallization of NiTi intermetallic compound. J. Alloys Compd. 2014, 614, 56–59. [Google Scholar] [CrossRef]
- Yeom, J.T.; Kim, J.H.; Hong, J.K.; Kim, S.W.; Park, C.H.; Nam, T.H.; Lee, K.Y. Hot forging design of as-cast NiTi shape memory alloy. Mater. Res. Bull. 2014, 58, 234–238. [Google Scholar] [CrossRef]
- Lopez, H.F.; Salinas, A.; Calderon, H. Plastic straining effects on the microstructure of a Ti-rich NiTi shape memory alloy. Metall. Mater. Trans. A 2001, 32, 717–729. [Google Scholar] [CrossRef]


| Element | Ni | Ti | Zr | Hf |
|---|---|---|---|---|
| Content (wt.%) | 55.72 | 43.9 | 0.021 | 0.022 |
| T | 650 °C | 750 °C | 850 °C | 950 °C | 1050 °C | |
|---|---|---|---|---|---|---|
| ε | ||||||
| 0.1 | 0.098 | 0.172 | 0.199 | 0.213 | 0.205 | |
| 0.2 | 0.099 | 0.165 | 0.203 | 0.217 | 0.198 | |
| 0.3 | 0.09900 | 0.167 | 0.211 | 0.215 | 0.191 | |
| 0.4 | 0.100 | 0.174 | 0.219 | 0.221 | 0.188 | |
| 0.5 | 0.108 | 0.179 | 0.221 | 0.225 | 0.184 | |
| 0.6 | 0.118 | 0.182 | 0.215 | 0.227 | 0.177 |
| Strain | n1 | β | α | n |
|---|---|---|---|---|
| 0.1 | 5.93554318 | 0.00958788 | 0.05690933 | 3.72177449 |
| 0.2 | 5.97514982 | 0.00977601 | 0.05841309 | 3.69542632 |
| 0.3 | 5.97581742 | 0.01008106 | 0.06024256 | 3.65501741 |
| 0.4 | 5.89394579 | 0.01037857 | 0.06117069 | 3.58317916 |
| 0.5 | 5.74007542 | 0.01074333 | 0.06166753 | 3.48750191 |
| 0.6 | 5.63761810 | 0.01082401 | 0.06102161 | 3.47574367 |
| T | 650 °C | 750 °C | 850 °C | 950 °C | 1050 °C | |
|---|---|---|---|---|---|---|
| Ε | ||||||
| 0.005 | 225.16 | 239.87 | 231.67 | 288.36 | 354.92 | |
| 0.05 | 229.22 | 244.19 | 235.84 | 293.55 | 361.31 | |
| 0.5 | 220.98 | 235.42 | 227.37 | 283.01 | 348.33 | |
| 1 | 278.70 | 296.90 | 286.75 | 356.92 | 439.31 |
Publisher’s Note: MDPI stays neutral with regard to jurisdictional claims in published maps and institutional affiliations. |
© 2021 by the authors. Licensee MDPI, Basel, Switzerland. This article is an open access article distributed under the terms and conditions of the Creative Commons Attribution (CC BY) license (https://creativecommons.org/licenses/by/4.0/).
Share and Cite
Tao, C.; Huang, H.; Zhou, G.; Zheng, B.; Zuo, X.; Chen, L.; Yuan, X. Research on the Hot Deformation Behavior of the Casting NiTi Alloy. Materials 2021, 14, 6173. https://doi.org/10.3390/ma14206173
Tao C, Huang H, Zhou G, Zheng B, Zuo X, Chen L, Yuan X. Research on the Hot Deformation Behavior of the Casting NiTi Alloy. Materials. 2021; 14(20):6173. https://doi.org/10.3390/ma14206173
Chicago/Turabian StyleTao, Chengchuang, Hongjun Huang, Ge Zhou, Bowen Zheng, Xiaojiao Zuo, Lijia Chen, and Xiaoguang Yuan. 2021. "Research on the Hot Deformation Behavior of the Casting NiTi Alloy" Materials 14, no. 20: 6173. https://doi.org/10.3390/ma14206173