2.1. Raw Materials and Parameters
The characteristic parameters and sources of procurement of the raw materials were as follows.
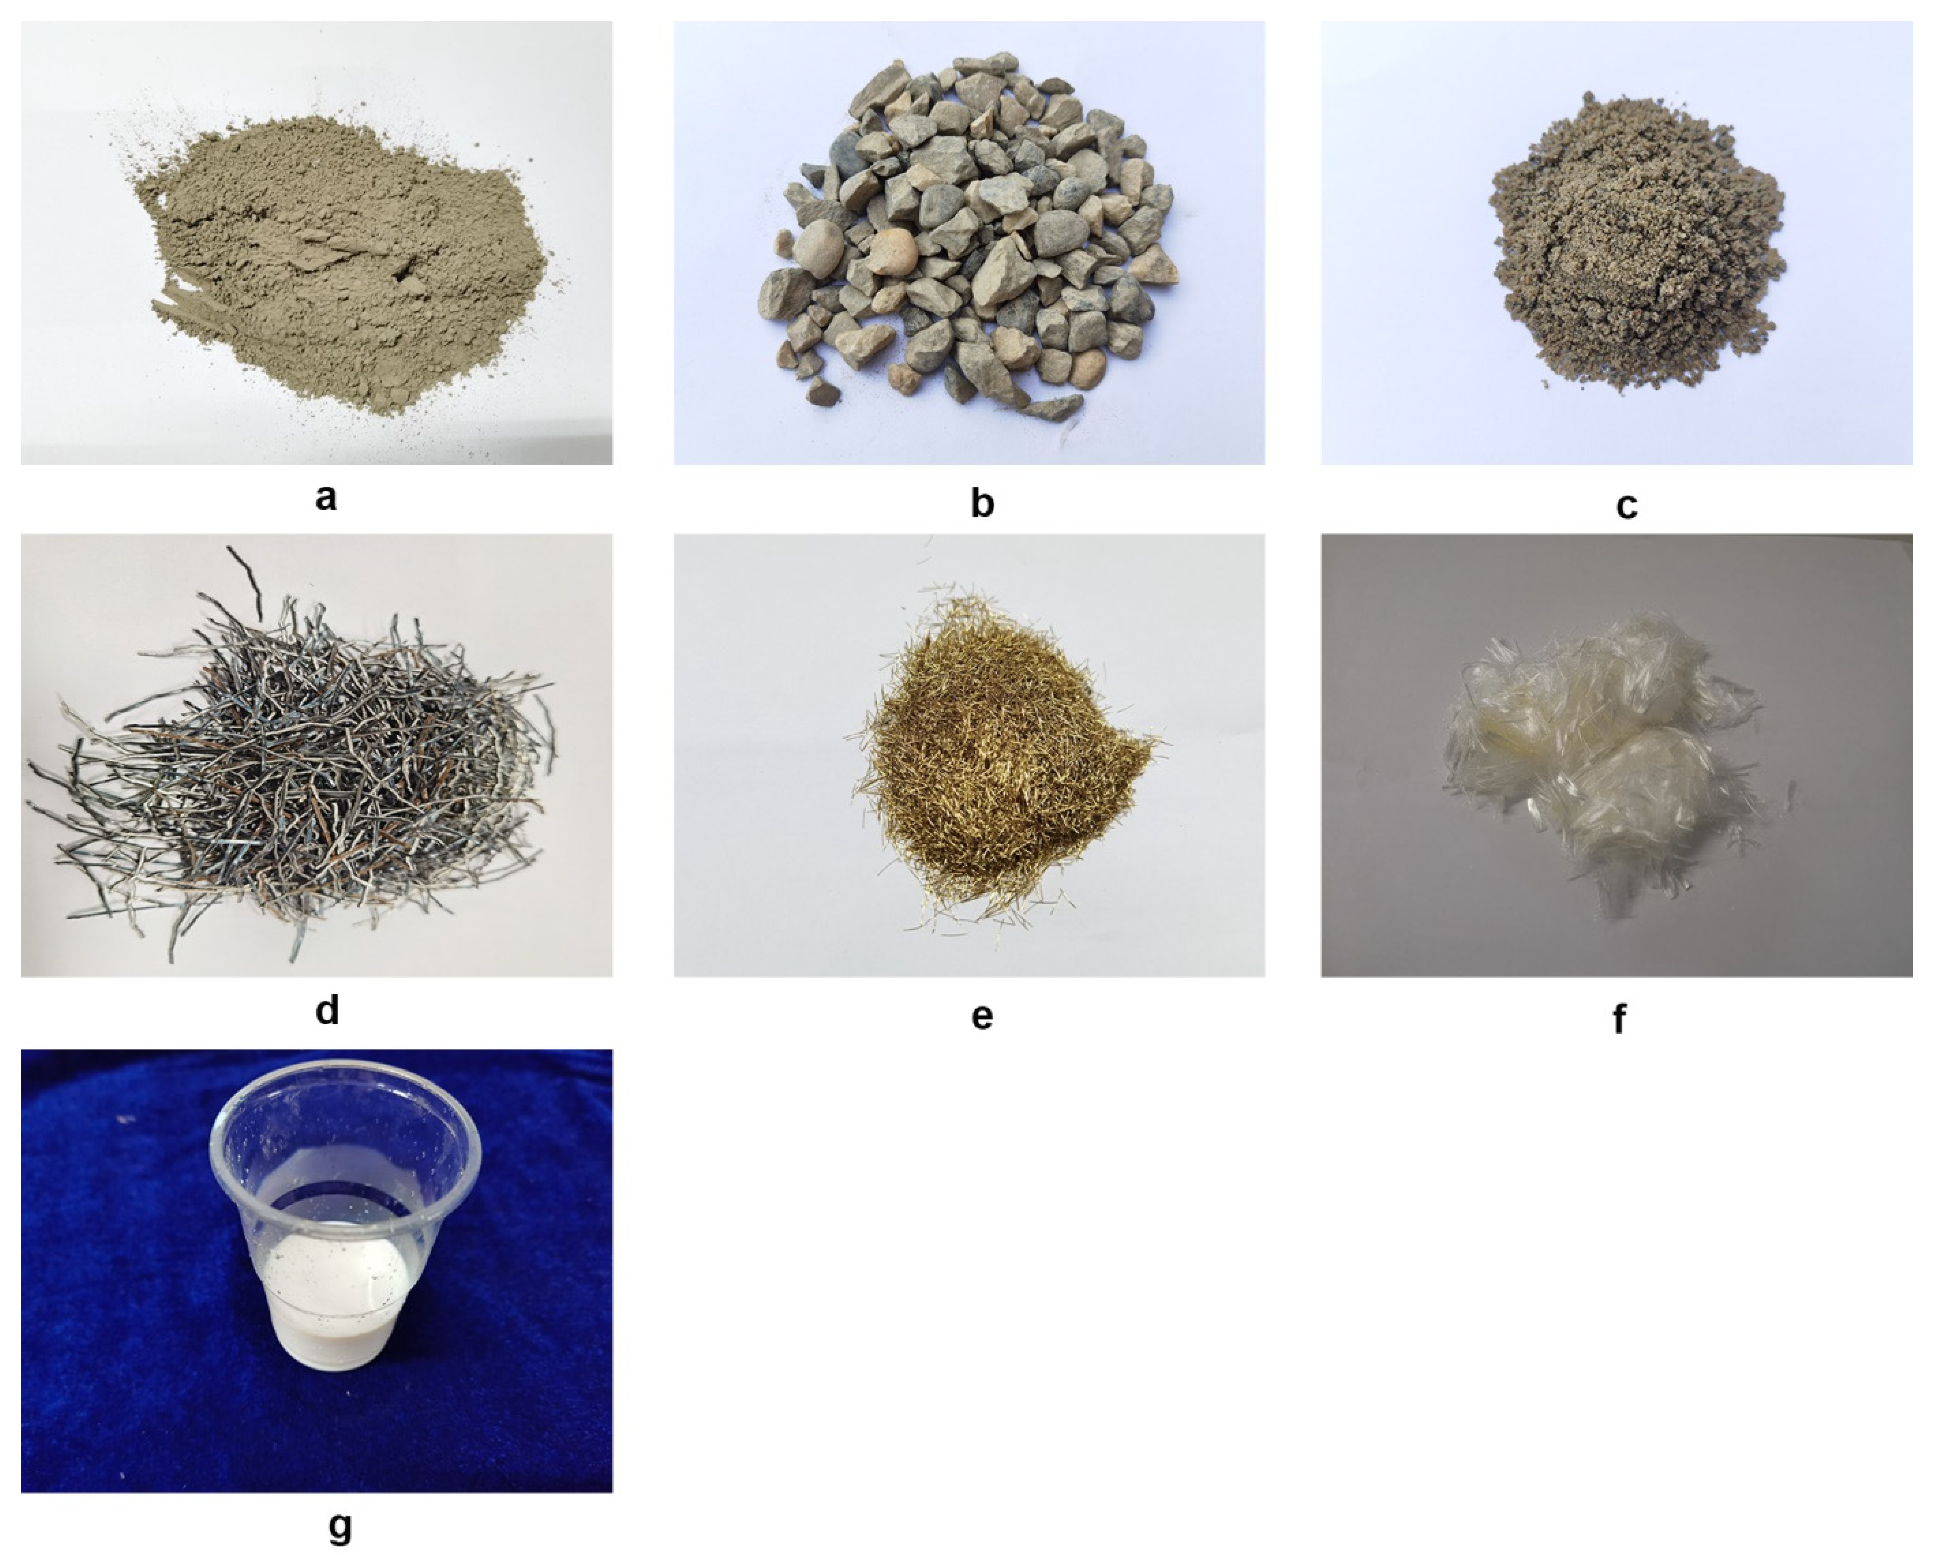
Cement: Ordinary 42.5 silicate type Huaxin Cement produced in Chongqing, as shown in
Figure 1a.
Gravel: Locally produced cobblestones from Chongqing with a maximum nominal grain size of 10 mm and a grading of 5–10 mm, as shown in
Figure 1b.
Fly ash: Grade I fly ash locally produced in Chongqing, as shown in
Figure 1c.
Ordinary steel fiber: Sheared wavy steel fiber (produced by Liaoning Anshan Kebite Technology Co., Ltd., Anshan City, Liaoning province, China.) with length of 35 mm and diameter of 0.87 mm, as shown in
Figure 1d.
Ultrashort ultrafine steel fiber: Melted and drawn ultrashort ultrafine steel fiber manufactured by Liaoning Anshan Kebite Technology Co., Ltd. with length of 6 mm and diameter of 0.2 mm, as shown in
Figure 1e.
Flexible fiber: Polypropylene flexible fiber with length of 12 mm (manufactured by Langfang Haoxin Company of Thermal Insulation, Fireproofing, and Sealing Materials Co., Ltd., Langfang City, Shandong province, China.), as shown in
Figure 1f.
Polymer emulsion: Independently developed polymerized compound emulsion, as shown in
Figure 1g.
Table 1 provides a summary of the basic physical and mechanical parameters of the sheared wavy steel fiber, the ultrashort ultrafine steel fiber, and the flexible fiber.
2.3. Test Method
2.3.1. Slump Test
Slump is mainly used to characterize the plasticizing and pumpable performance of concrete, and the requirements for application to different structures are different. This paper aimed to investigate a material for application to some special pavement structures, such as steel bridge decks, to be used mainly by paving. Therefore, the smaller the slump, the better the paving effect and material performance were judged to be.
The slump test detects the water retention, fluidity, and cohesion of the concrete matrix and also verifies the feasibility and workability of the designed mix proportion. According to the Standard for the Test Method of Performance on Ordinary Fresh Concrete (GB/T50080-2016) [
26], the following measures were taken during the slump test.
(1) The inside of the slump barrel was moistened with water to prevent the adhesion of the concrete mixture with the inner barrel wall, which could potentially cause bonding damage to the concrete during the falling off process. Next, the barrel was placed on a dry, horizontal plate made of steel or wood to avoid the influence of plate inclination and humidity on the test results. The slump barrel was fixed during the filling process, and both feet were stepped on the pedal for loading.
(2) When the materials were loaded to 1/3 and 2/3 of the barrel height, the tamping rod was used for continuous and stable tamping around 20 to 30 times. The tamping rod penetrated the concrete composite matrix without causing an impact to avoid the dispersion of the composite. When the materials were loaded to the top of the slump barrel, then the excess mixture was scraped off with a trowel, and the top surface was smoothened with a scraper.
(3) After the excess concrete materials around the bottom of the barrel were removed, the barrel was lifted within 5 to 10 s. During this period, the slump barrel was lifted vertically with a uniform speed without imposing transverse or twisting forces on the concrete. The whole process from the beginning of loading to the lifting of the slump barrel was completed within 150 s.
(4) A flat plate, which came in contact with the concrete mixture but did not exert force, was gently placed on the top of the concrete mixture during the slump measurement process. The height h was measured from the plate to the bottom with a measuring scale, and then h was subtracted from the height H of the slump barrel. The result obtained was the measured slump, expressed in the unit of mm.
In the slump test, four basic processes were generally included in the preparation of the concrete mixture: weighing, mixing, loading, and measuring. The measuring is shown in
Figure 2.
2.3.2. Elasticity Modulus Test
The test method for the elasticity modulus under static pressure was performed as specified in
Standard for Test Method of Mechanical Properties on Ordinary Concrete (GB/T 50081-2002) [
27]. The test apparatuses, as shown in
Figure 3, consisted of one universal testing machine, one ball socket, two dial gauges, two sets of fixing frames for the measuring instrument, and one steel ruler. In the test, the sample size was 150 mm × 150 mm × 300 mm. Two groups of three samples were used. The first group was used for conducting the static compression test to determine the compressive strength and thus the loading basis of the elasticity modulus test. The second group was used for the formal elasticity modulus test.
During the elasticity module test, the two dial gauges were installed on the fixed frame and symmetrically arranged on both sides of the sample, and the bottom of the dial gauge was close to the centerline on both sides of the test piece. The sample was placed on the central region of the platform, and the press machine was turned on to gradually lower the upper platform and ensure its balanced contact with the sample.
The sample was pretested before the formal test. The loading principle was as follows. First, initial stress of 0.5 MPa was applied, which corresponded to the initial load F0. This stress was held for 60 s, and the readings of the dial gauges were recorded on both sides as 0 (left) and 0 (right). Next, the load was continuously and evenly applied with a loading rate of 0.6 MPa/s. When the load was 1/3 of the ultimate compressive strength, the load was recorded as Fn and held for 60 s, and the readings of the dial gauges are recorded as n (left) and n (right). The differences between the two values and their average did not exceed 20%; if it did, the load was be applied again (the unloading and loading speeds were consistent) until the test requirement was met. It should be noted that, in practice, the same batches of specimens were selected for the compression test in advance. The compression strength of these specimens was measured to convert the load corresponding to 0.5 MPa to eliminate the support displacement. The strength formed by the corresponding load was not necessarily 0.5 MPa corresponding to the test specimen, including 1/3 ultimate compressive strength.
Preloading started after the pretest was completed. Preloading started from the reference load F0 and was held for 60 s, and then the load was increased to Fn, held for another 60 s, and again unloaded to the reference load F0. This preloading cycle was repeated three times.
The formal test was conducted as follows. After the last preloading cycle, starting from the reference load
F0, the readings of the two dial gauges were recorded as
0 (left) and
0 (right) were recorded after the load was held for 60 s. The load was increased to
Fn and held for 60 s, and
n (left) and
n (right) were recorded. Afterward, the dial gauges and fixing frames were removed, the sample was loaded at a rate of 0.6 MPa/s until its failure, and the load during failure was recorded as
Fcp. If the difference between this
Fcp and that measured in the first group was more than 20%, this was marked. The compressive elasticity modulus of the concrete was processed based on the following formula:
where
is the compressive elasticity modulus of the concrete (MPa);
Fn is the final load imposed in the elasticity modulus test (N, corresponding to 1/3 of
Fcp);
F0 is the initial load imposed in the elasticity modulus test (N, corresponding to the load at 0.5 MPa);
L is the length of the measurement gauge (mm);
A is the loaded area of the sample (mm
2);
is the average of deformation differences on both sides of the sample under the influence of
Fn and
F0 at the final loading (mm), i.e.,
=(
n(left)+
n(right))/2−(
0(left)+
0(right))/2;
0 is the reading of the dial gauge when at a load of
F0 (mm); and
n is the reading of the dial gauge at a load of
Fn (mm).
2.3.3. Compression Test
This test was conducted for 3 days, 7 days, and 28 days; each duration was divided into early and late stages. The purpose of this test was to investigate the change in the compressive strength of the hybrid concrete during the starting and final stages when compared to ordinary concrete.
There were 6 groups of samples, including 3 groups of hybrid fiber–polymer concretes and 3 groups of C40 plain concrete, which corresponded to the three durations. There were 3 samples in each group, and thus 18 compressive samples in total, of which all had a size of 100 mm × 100 mm × 100 mm.
A fully automatic pressure testing machine in the laboratory that had a measuring range of 300 tons was used. The test was performed according to the Testing Methods of Cement and Concrete for Highway Engineering [
28] and Test Methods Used for Steel Fiber Reinforced Concrete [
29]. During the test, the regular, flat sides of the samples were selected as the compression surfaces, and the loading was under force control with a rate of 5 kN/s. The compressive strengths of the cubic hybrid fiber–polymer concrete samples were calculated using Equation (2). Since the size of the samples was non-standardized, the final compressive strength had to be multiplied by a factor of 0.95.
Here, is the compressive strength of the concrete, F is the ultimate load (N), and A is the loaded area (mm2). The accuracy of the calculation was 0.01 MPa.
2.3.4. Bending Test
The splitting tensile test and bending tensile test are indirect tensile tests. Like direct tensile tests, they can reflect the tensile properties of materials. A material’s structural design needs to consider the applicable scene and stress state of the material and the stress performance requirements of the structural pavement. This study used the bending tensile test to evaluate the tensile performance of the material under examination.
In order to eliminate the effect of shear stress, four point bending is a common test method. Its advantage is that the bending moment is evenly distributed and that the test results are therefore more accurate. In the test, the three-stage method is used to determine the loading position; that is, the two loading points at the loading position can divide the distance between the supports equally so as to determine the shear and bending spans of the specifications.
The bending test aimed at exploring whether the bending strength and crack resistance of the concrete were improved after the addition of the steel fiber, flexible fiber, and polymer emulsion, and if so, to what extent. The test was divided into ages of 3 days, 7 days, and 28 days to study the phase changes of strength and toughness for the hybrid concrete compared to that of ordinary concrete.
The test was performed according to the
Testing Methods of Cement and Concrete for Highway Engineering [
28] and
Test Methods Used for Steel Fiber Reinforced Concrete [
29] by using the MTS universal testing machine from the laboratory, which possessed a loading range of 200 kN. As shown in
Figure 4, the four-point bending test method was adopted. The distance between the bottom support point and the two ends of the sample was 5 cm, the distance between the two loading points at the top was 10 cm, and the distance between the loading point and the support point was 10 cm. The configured loading speed was 0.3 mm/min and was controlled by the displacement.
As in the compression test, there were 18 compressive samples in total, which included three groups of hybrid fiber–polymer concretes and 3 groups of C40 plain concretes, each containing 3 samples, though the sample size was 400 mm × 100 mm × 100 mm instead.
When the cross-section was within the pure bending section, the bending strength was calculated from the following formula:
where
is the bending strength (MPa),
F is the ultimate load (N),
L is the spacing between the supports (mm),
b is the sample width (mm), and
h is the height of the sample (mm).
Since the sample size (400 mm × 100 mm × 100 mm) was nonstandardized, the test result had to be multiplied by a factor of reduction of 0.85 according to the Testing Methods of Cement and Concrete for Highway Engineering.
2.3.5. Sulfate Resistance
Under alternating high temperature and sulfate solution processing, shrinkage due to drying at high temperatures and expansion due to the erosion of sulfate solution cyclically occurred in the concrete. As the cycle repeated, the shrinkage and expansion of the concrete eventually led to extreme stress failure and internal cracks.
This test simulated the resistance capacities of the hybrid fiber–polymer concrete and plain concrete to natural sulfate attack, in contrast to the actual background of the industrially polluted environment.
This test was performed as per the
Standard for Test Methods of Long-term Performance and Durability of Ordinary Concrete [
30]. When the samples had been cured for 26 days, they were marked using a marking pen to avoid mixing the two kinds of concrete. Furthermore, they were transferred to an oven and baked at 80 °C for 48 h. Anhydrous sodium sulfate solution was mixed with water to obtain 10% sodium sulfate solution, and the samples were kept inside of this solution for the erosion test. After soaking for 15 h, the samples were taken out and put into the oven to bake at 48 °C for another 8 h. The above process constituted a single sulfate attack and high-temperature baking cycle. Fifteen cycles were performed before conducting the bending test, in which, again, the reduction coefficient was not considered.
For economical purposes, the sample size in this test was set to be 40 mm × 40 mm × 160 mm. A total of 12 samples were divided into two test groups and two control groups. The four-point loading mode was used in this case, though the supporting point was placed 20 mm away from the end of the sample, with a spacing of 40 mm between the loading points and a distance of 40 mm between the loading and the supporting point. The bending strength was calculated by using Equation (3), and the corrosion resistance was calculated by using:
where
is the corrosion resistance of the bending strength (%),
is the bending strength of the concrete sample noted after the sulfate resistance test (MPa), and
is the bending strength of the same-age concrete sample cured within room temperature (MPa).
2.3.6. Electron Microscope Scanning
A scanning electron microscope (SEM) was used to determine the microstructural changes in ordinary concrete after the addition of polymer emulsion and steel fiber. The purpose of SEM was to explain the strength growth mechanism of the material and to explain how the fibers and concrete existed as a whole according to the observed microinterface between the fibers and concrete.
Focused electron beams were used by the SEM to scan and image the sample surface point by point. During the test, the cross-section of the sample was cleaned to avoid hampering of the observation results by concrete debris. Samples generally consisted of bulk materials or powder particles, and the imaging signals included secondary electrons, backscattered electrons, or absorbed electrons. The cross spot was taken as the electron source, and a micro electron beam with a certain energy, beam intensity, and beam spot diameter was formed because of the shrinking of the secondary condenser and the objective lens. Grid scanning was performed on the surface of the sample in a certain temporal and spatial sequence, driven by the scanning coil. Physical signals such as the secondary electron emission and the backscattered electrons were produced during the interaction of the focused electron beam with the sample. The amount of secondary electron emission changed along with the surface morphology of the sample. The detector collected the secondary electron signal and converted it into an electrical signal, which was fed into the kinescope grid after video amplification. A secondary electron image reflecting the surface morphology of the sample was obtained by modulating the brightness of the kinescope that was scanned synchronously with the incident electron beam.


