
Analysis of Polygonal Computer Model Parameters and Influence on Fabric Drape Simulation


Abstract
1. Introduction
2. Research Methodology
2.1. Test Fabric Samples
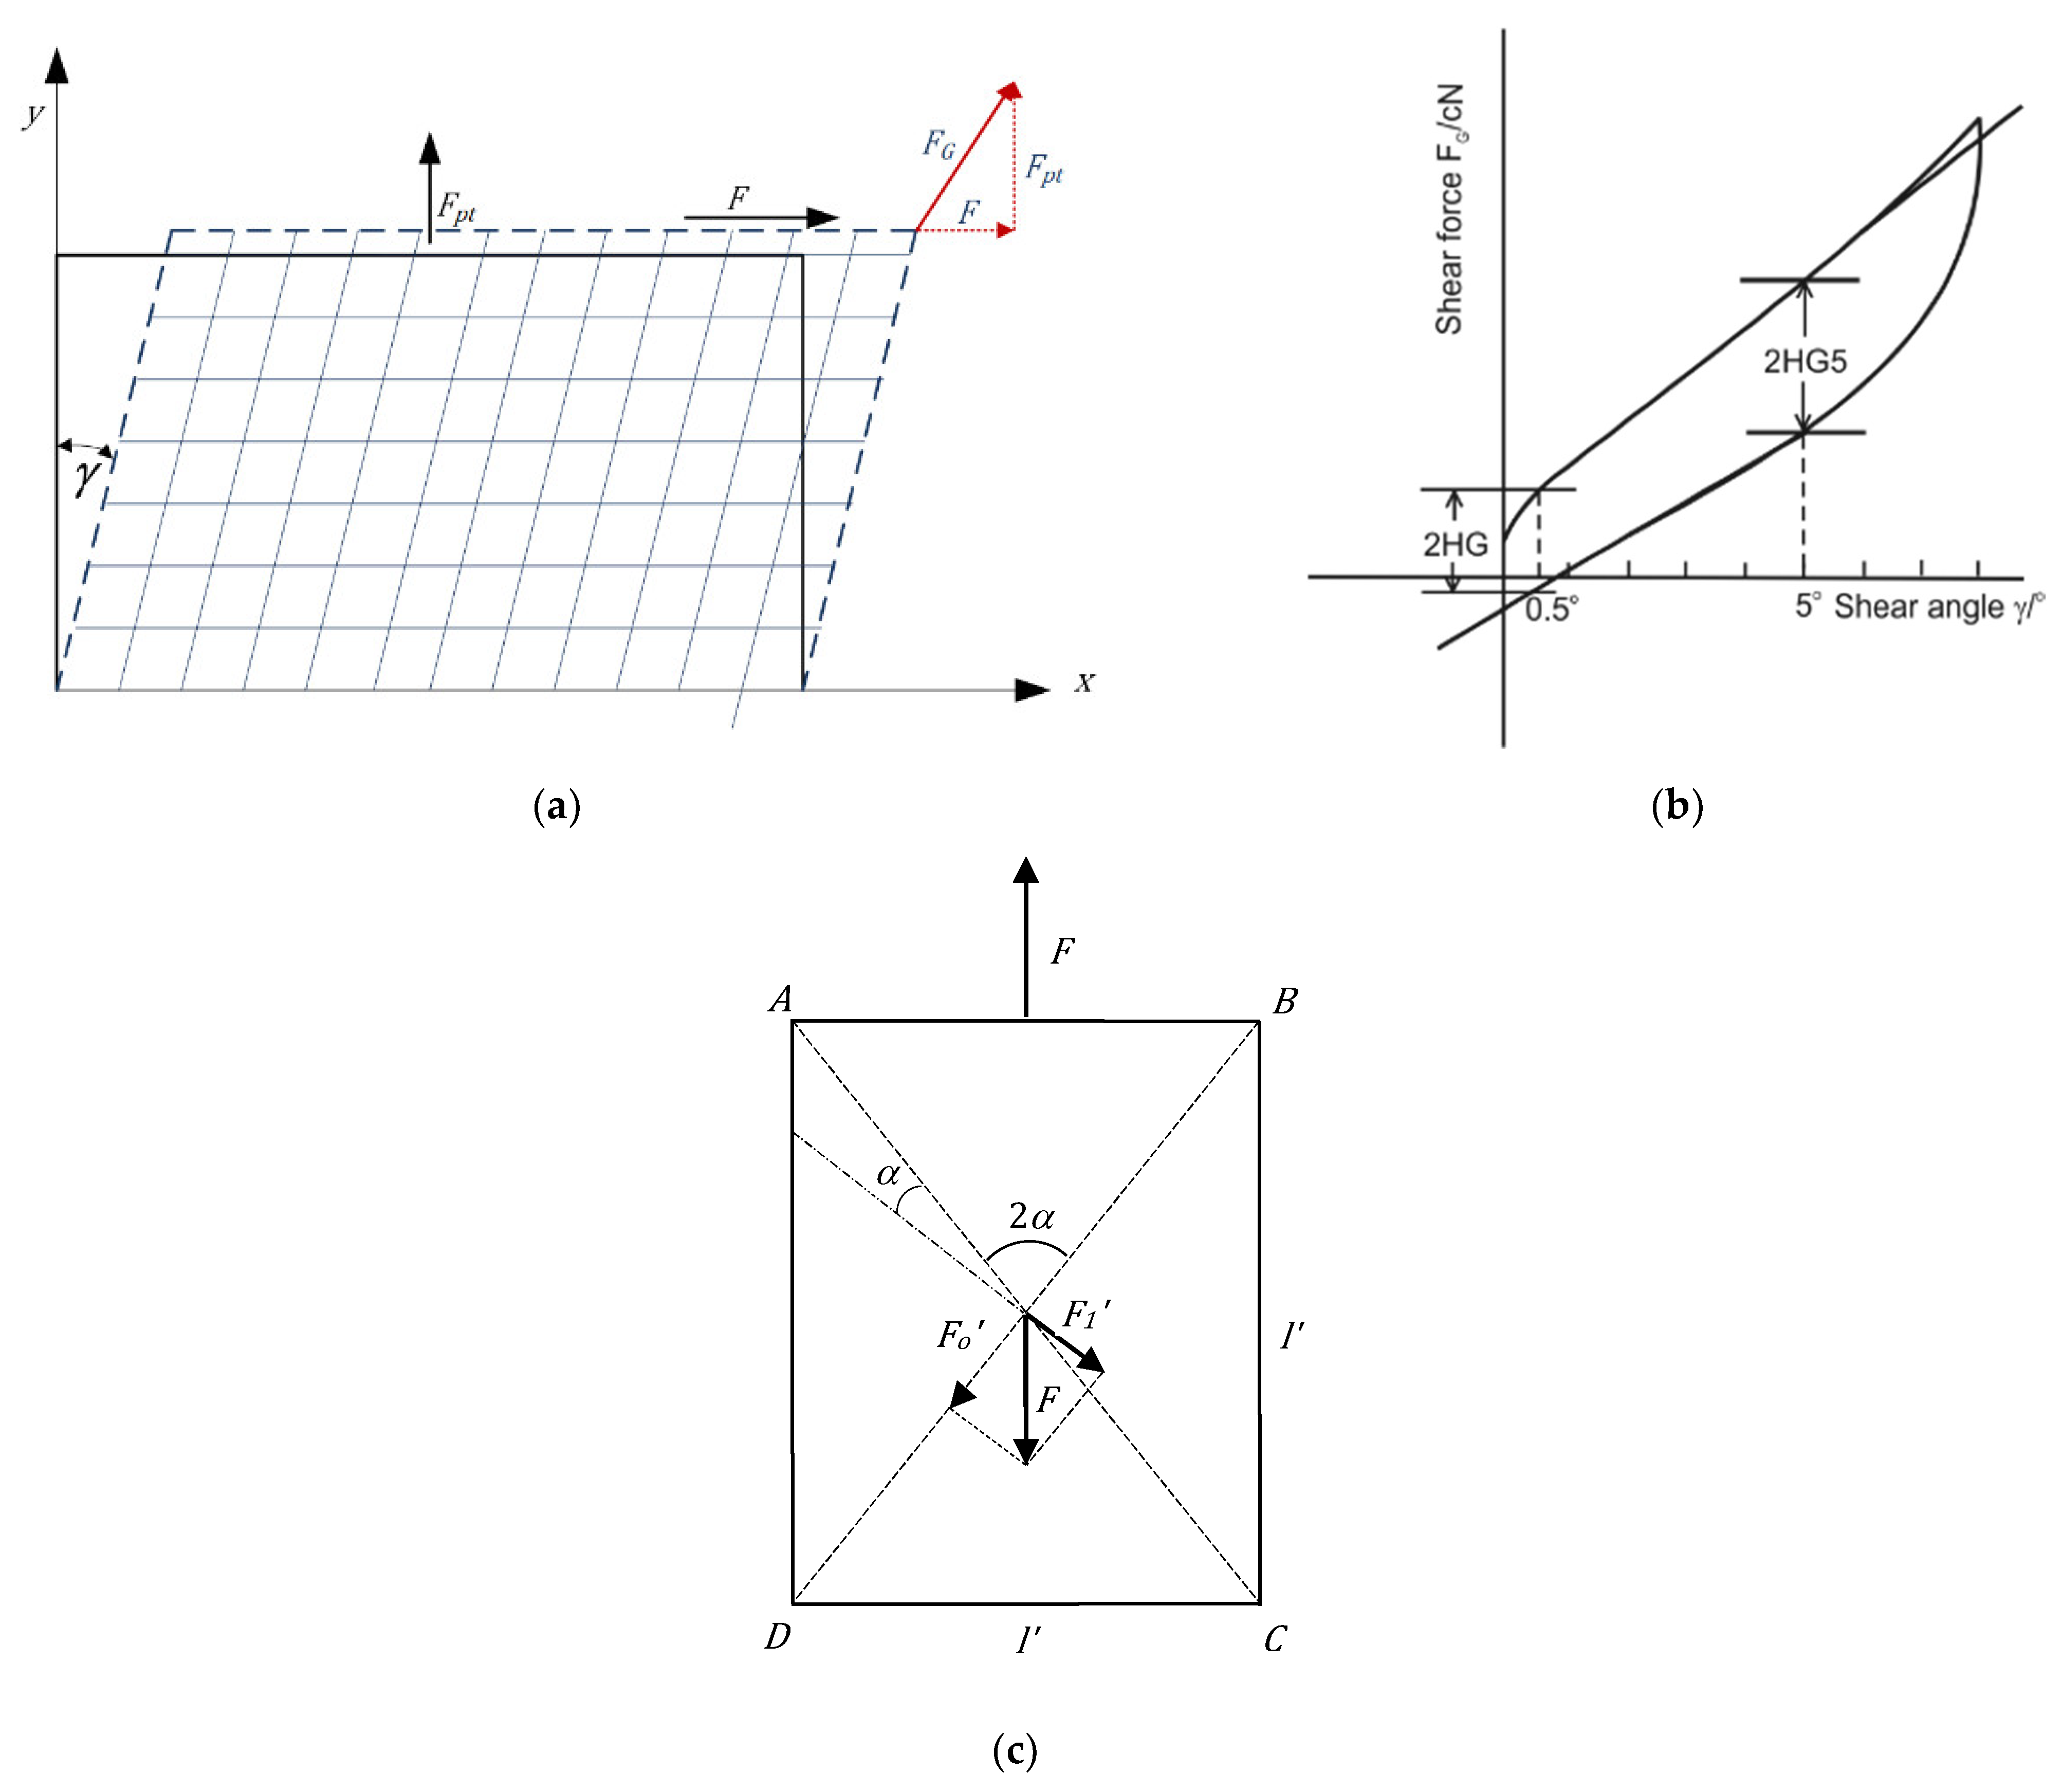
2.2. Determination of the Parameters of Mechanical Properties
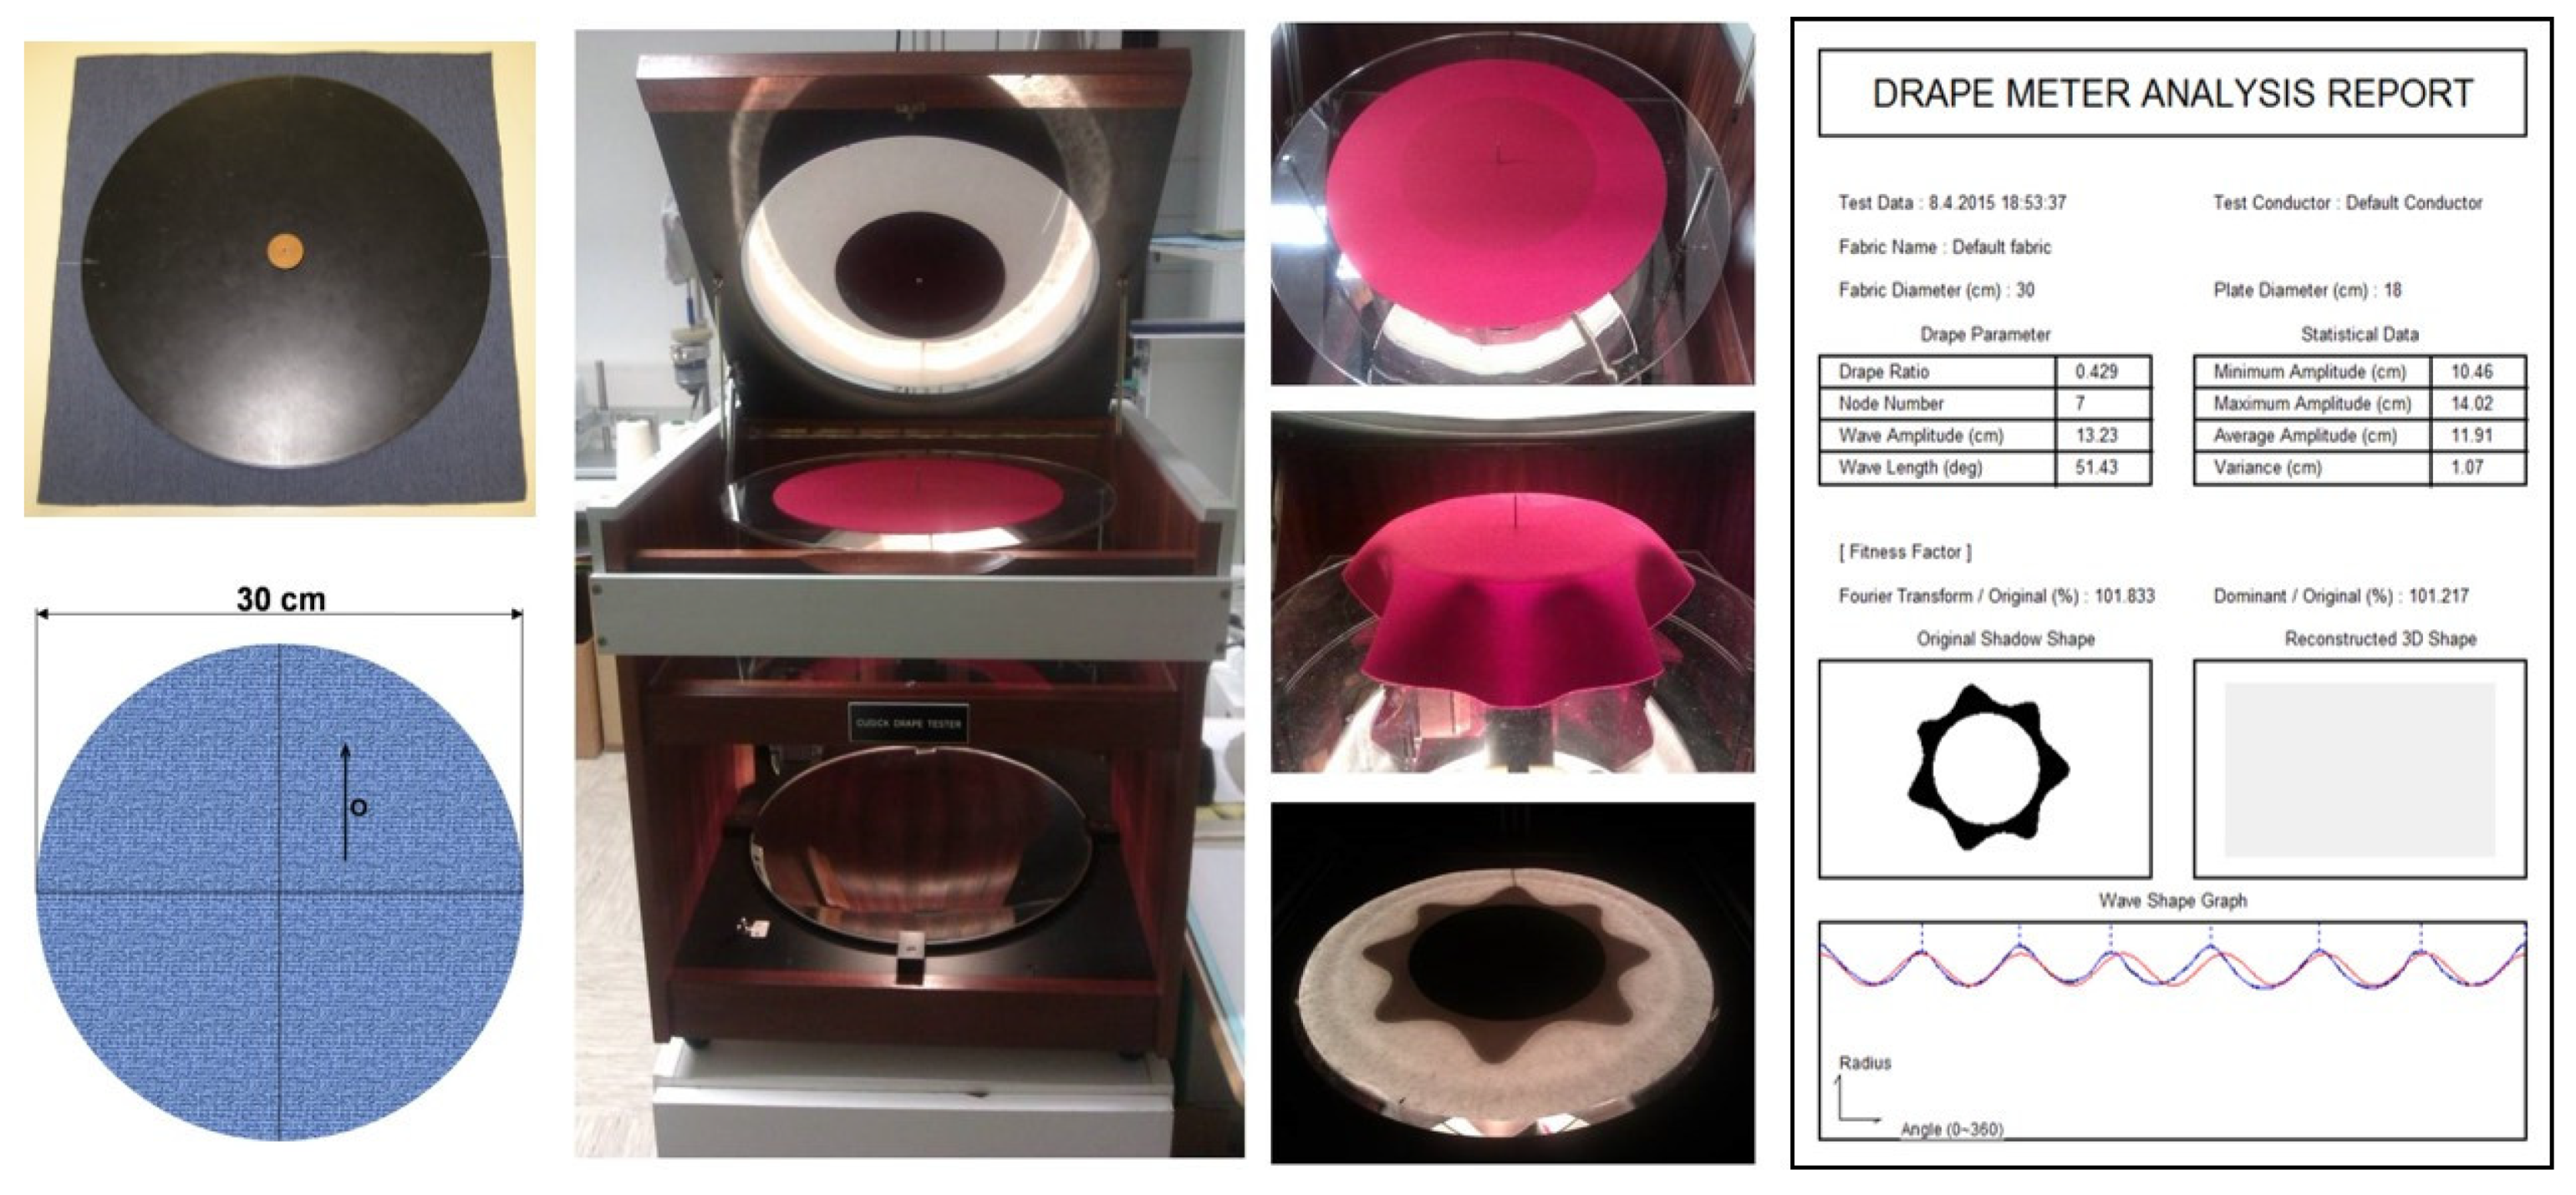
2.3. Research on Fabric Drape
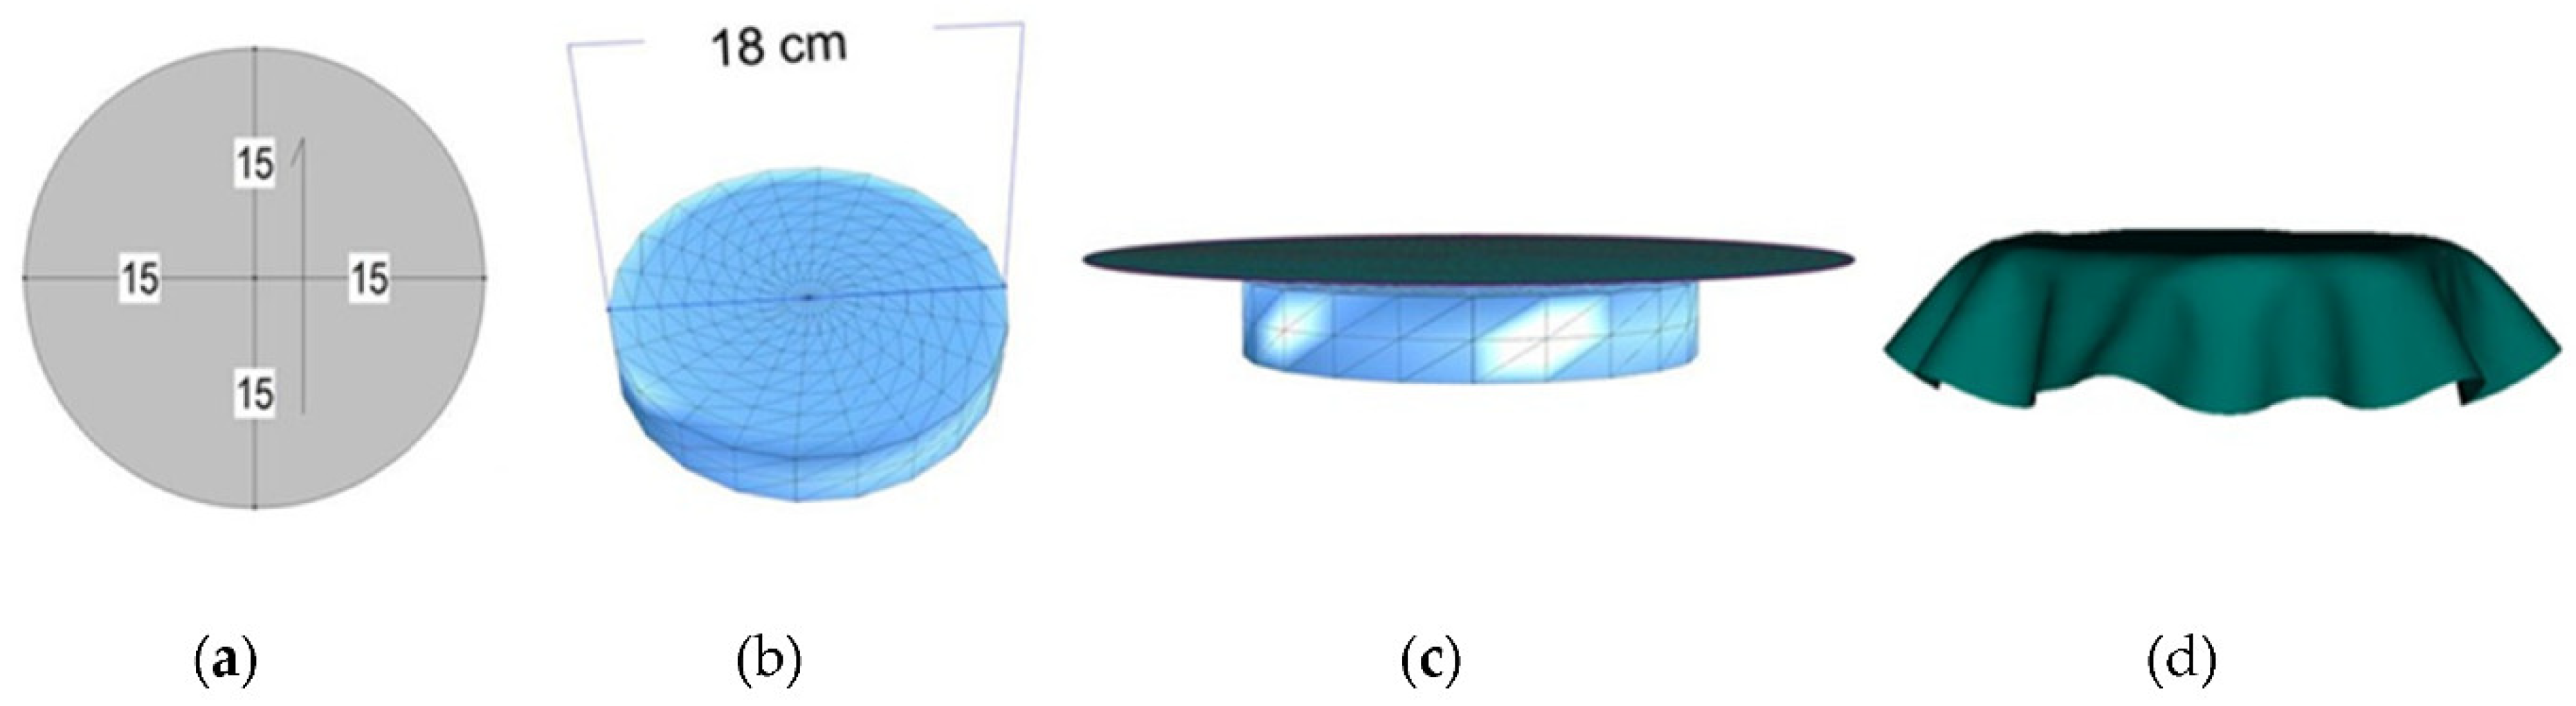
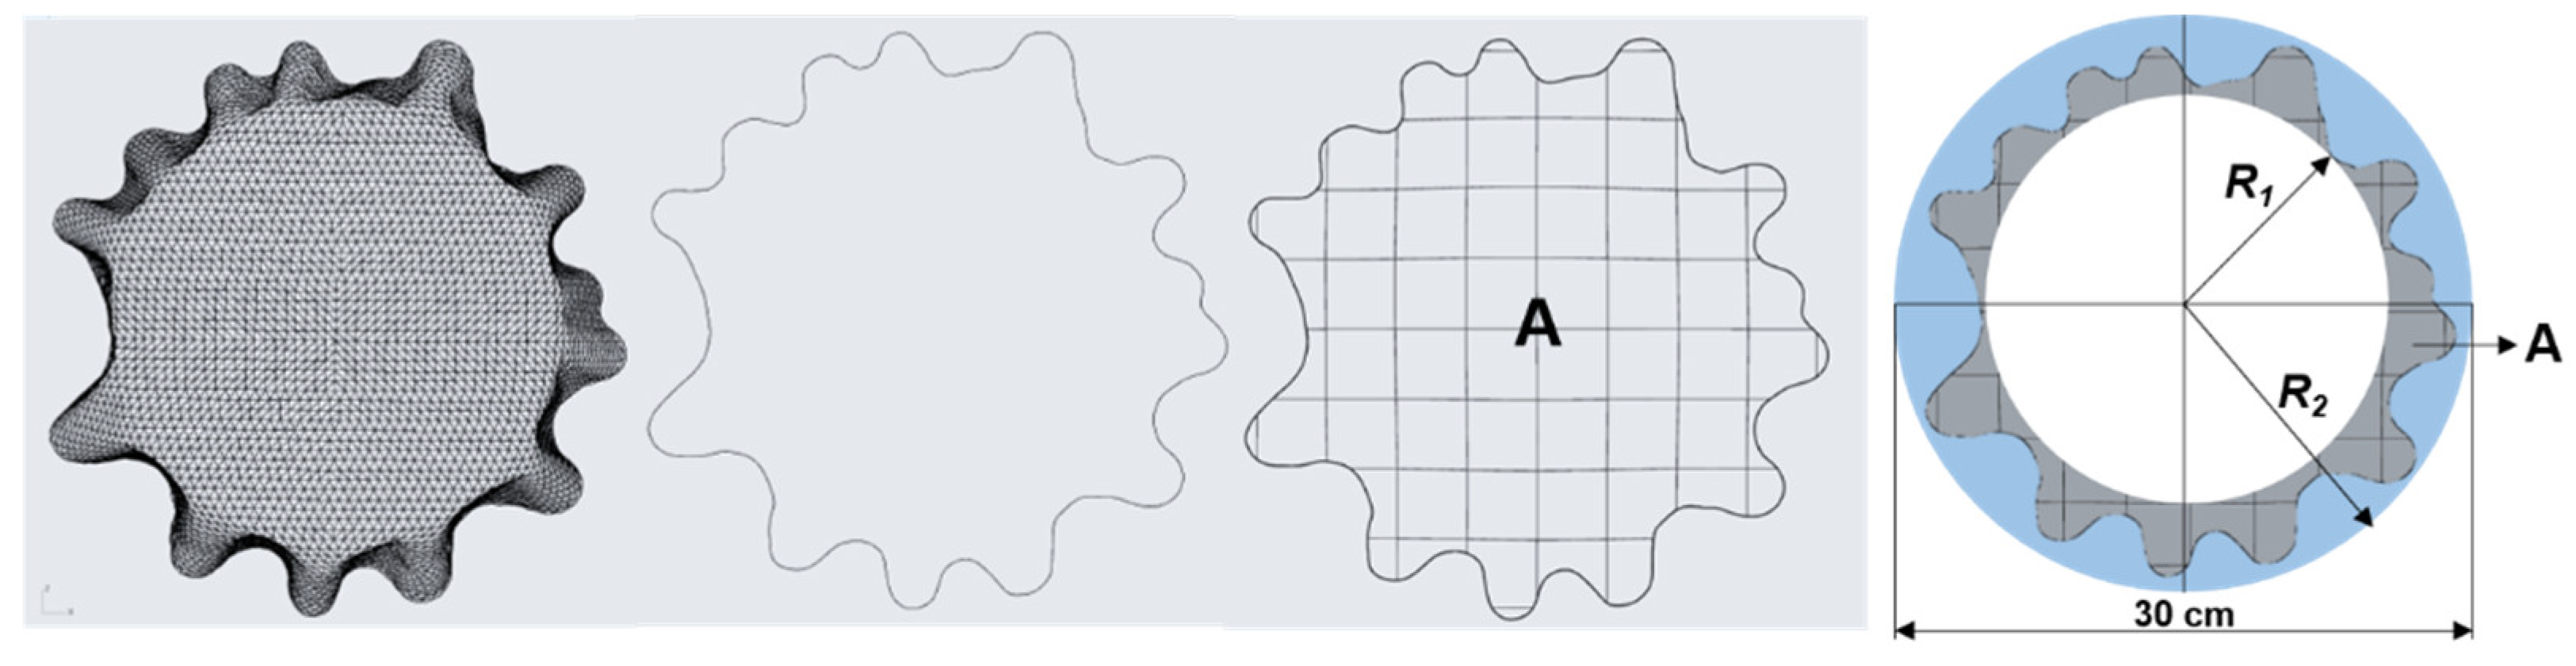
2.4. Computer Simulation of Fabric Drape
3. Results and Discussion
4. Conclusions
Author Contributions
Funding
Institutional Review Board Statement
Informed Consent Statement
Data Availability Statement
Conflicts of Interest
References
- Geršak, J. Objektivno Vrednovanje Plošnih Tekstilija i Odjeće; Tekstilno-tehnološki fakultet Sveučilišta u Zagrebu: Zagreb, Croatia, 2013. [Google Scholar]
- Geršak, J. (Ed.) Study of the complex deformations of textile structure. In Complex Fabric Deformations and Clothing Modelling in 3D; (Complex Fabric Deformations & Modelling); LAP LAMBERT Academic Publishing: Saarbrücken, Germany, 2013; pp. 3–60. [Google Scholar]
- Chu, C.C.; Cummings, C.L.; Teixeriara, N.A. Mechanics of Elastic Performance of Textile Material, Part V: A Study of the Factors Affecting the Drape of Fabric, Development of a Drape Meter. Text. Res. J. 1950, 20, 539–548. [Google Scholar] [CrossRef]
- Cusick, G.E. The dependence of fabric drape on bending and shear stiffness. J. Text. Inst. 1965, 56, 596–606. [Google Scholar] [CrossRef]
- Cusick, G.E. The measurement of fabric drape. J. Text. Inst. 1968, 59, 253–260. [Google Scholar] [CrossRef]
- Kujipers, S.; Luible Bär, C.; Hugh Gong, R. The measurement of fabric properties for virtual simulation—A critical review. In IEEE SA Industry Connections; IEEE Standards Association (IEEE SA): New York, USA, 2020; pp. 8–26. [Google Scholar]
- Strazdiene, E. Textiles Objective and Sensory Evaluation in Rapid Prototyping. Mater. Sci. 2011, 17, 407–412. [Google Scholar] [CrossRef][Green Version]
- Pavlinic, D.Z.; Gersak, J. Design of the System for Prediction of Fabric Behavior in Garment Manufacturing Processes. Int. J. Cloth. Sci. Technol. 2004, 16, 252–261. [Google Scholar] [CrossRef]
- Peirce, F.T. The Handle of Cloth as a Measurable Quantity. J. Text. Inst. 1930, 21, 377–416. [Google Scholar] [CrossRef]
- Abbott, N.J. The Measurement of Stiffness in Textile Fabrics. Text. Res. J. 1951, 21, 435–444. [Google Scholar] [CrossRef]
- Niwa, M.; Seto, F. Relationship between Drapeability and Mechanical Properties of Fabrics. J. Text. Mach. Soc. Jpn. 1986, 39, 161–168. [Google Scholar] [CrossRef]
- Jevšnik, S.; Geršak, J.; Gubenšek, I. The advance engineering methods to plan the behavior of fused panel. Int. J. Cloth. Sci. Technol. 2005, 17, 161–170. [Google Scholar] [CrossRef]
- Robson, D.; Long, C.C. Drape Analysis using Imaging Techniques. Cloth. Text. Res. J. 2000, 18, 1–8. [Google Scholar] [CrossRef]
- Kenkare, N.; Plumlee, T.M. Fabric drape measurement: A modified method using digital image processing. J. Text. Appar. Technol. Manag. 2005, 4, 1–8. Available online: https://textiles.ncsu.edu/tatm/wp-content/uploads/sites/4/2017/11/Plumlee_full_148_05.pdf (accessed on 10 July 2021).
- Geršak, J. Study of relationship between fabric elastic potential and garment appearance quality. Int. J. Cloth. Sci. Technol. 2004, 16, 238–251. [Google Scholar] [CrossRef]
- Jedda, H.; Ghith, A.; Sakli, F. Prediction of fabric drape using the FAST system. J. Text. Inst. 2007, 93, 219–225. [Google Scholar] [CrossRef]
- Chu, C.C. Determination of Factors Which Influence the Draping Properties of Cotton Fabrics; Forgotten Books: London, UK, 2017; pp. 15–37. [Google Scholar]
- Lo, W.M.; Hu, J.L.; Li, L.K. Modeling a Fabric Profile. Text. Res. J. 2002, 72, 454–463. [Google Scholar] [CrossRef]
- Jeong, Y.J. A Study of Fabric-Drape Behavior with Image Analysis Part I: Measurement, Characterization, and Instability. J. Text. Inst. 1998, 89, 59–69. [Google Scholar] [CrossRef]
- Jeong, Y.J.; Philips, D.G. A study of Fabric Drape Behavior with Image Analysis, Part II: The Effect of Fabric Structure and Mechanical Properties on Fabric Drape. J. Text. Inst. 1998, 89, 70–79. [Google Scholar] [CrossRef]
- Sayem, A.S.M.; Kennon, R.; Clarke, N. 3D CAD systems for the clothing industry. Int. J. Fash. Des. Technol. Educ. 2010, 3, 45–53. [Google Scholar] [CrossRef]
- Luible, C. Study of Mechanical Properties in the Simulation of 3D Garments. Ph.D. Thesis, Université de Genève, Genève, Switzerland, 2008. [Google Scholar]
- Volino, P.; Magnenat-Thalmann, N. Virtual Clothing: Theory and Practice; Springer: Berlin/Heidelberg, Germany, 2000; pp. 35–60. [Google Scholar]
- Kuijpers, A.A.M.; Gong, R.H. Virtual tailoring for enhancing product development and sales. In Proceedings of the 4th International Global Fashion Conference: Re-Thinking and Reworking Fashion, Ghent, Belgium, 20–21 November 2014; University College Ghent: Ghent, Belgium, 2014; pp. 1–27. [Google Scholar]
- Ancutiene, K.; Strazdiene, E.; Lekeckas, K. Quality evaluation of the appearance of virtual close-fitting woven garments. J. Text. Inst. 2014, 105, 337–347. [Google Scholar] [CrossRef]
- Petrak, S.; Mahnic, M.; Rogale, D. Impact of male body posture and shape on design and garment fit. Fibres Text. East. Eur. 2015, 23, 150–158. Available online: http://yadda.icm.edu.pl/yadda/element/bwmeta1.element.baztech-43775b65-d95a-4c8e-ad21-85f0a34a5ba0 (accessed on 7 July 2021). [CrossRef]
- Rizzi, C.; Fontana, M.; Cugini, U. Towards virtual prototyping of complex-shaped multi-layered apparel. Comput. Aided. Des. Appl. 2004, 1, 207–216. [Google Scholar] [CrossRef][Green Version]
- Pandurangan, P.; Eischen, J.; Kenkare, N.; Lamar, T.A.M. Enhancing accuracy of drape simulation. Part II: Optimized drape simulation using industry-specific software. J. Text. Inst. 2008, 99, 219–226. [Google Scholar] [CrossRef]
- Lim, H.S. Three Dimensional Virtual Try-on Technologies in the Achievement and Testing of Fit for Mass Customization. Ph.D. Thesis, North Carolina State University, Raleigh, North Carolina, 2009. Available online: https://repository.lib.ncsu.edu/handle/1840.16/3322 (accessed on 18 July 2021).
- Wu, Y.Y.; Mok, P.Y.; Kwok, Y.l.; Fan, J.T.; Xin, J.H. An investigation on the validity of 3D clothing simulation for garment fit evaluation. In Proceedings of the IMProVe 2011 International Conference on Innovative Methods in Product Design, San Servolo, Venice, Italy, 15–17 June 2011; Libreria Internazionale Cortina Padova: Padova, Italy, 2011; pp. 463–468. [Google Scholar]
- Power, J. Fabric objective measurements for commercial 3D virtual garment simulation. Int. J. Cloth. Sci. Technol. 2013, 25, 423–439. [Google Scholar] [CrossRef]
- Luible, C.; Magnenat-Thalmann, N. Suitability of Standard Fabric Characterisation Experiments for the Use in Virtual Simulations. Available online: http://citeseerx.ist.psu.edu/viewdoc/download?doi=10.1.1.524.2550&rep=rep1&type=pdf (accessed on 21 July 2021).
- Kenkare, N.; Lamar, T.A.M.; Pandurangan, P.; Eischen, J. Enhancing accuracy of drape simulation, Part 1: Investigation of drape variability via 3D scanning. J. Text. Inst. 2008, 99, 211–218. [Google Scholar] [CrossRef]
- De Boos, A. Tester, D. SiroFAST Fabric Assurance by Simple Testing. A System for Fabric Objective Measurement and Its Application in Fabric and Garment Manufacture; Report No. WT97.02; SCIRO Division of Wool Technology: Geelong, Australia, 1994. [Google Scholar]
- Kawabata, S. The Standardisation and Analysis of Hand Evaluation, 2nd ed.; The Hand Evaluating and Standardization Committee, The Textile Machinery Society of Japan: Osaka, Japan, 1980. [Google Scholar]
- Becker, M.; Golay, P. Rhino–Nurbs 3D Modeling; New Riders: San Francisco, CA, USA, 1999. [Google Scholar]
- ISO 7211/2-1984 Textiles–Woven Fabrics–Construction–Methods of Analysis, Part 2: Determination of Number of Threads per Unit Length. 1984. 2017. Available online: https://www.iso.org/standard/13842.html (accessed on 15 July 2021).
- ISO 3801:1977 Textiles–Woven Fabrics–Determination of Mass per Unit Length and Mass per Unit Area. 1977. 2017. Available online: https://www.iso.org/standard/9335.html (accessed on 15 July 2021).
- Fabric Converter. Optitex Technical Documentation; EFI Optitex: Rosh HaAyin, Izrael, 2012. [Google Scholar]
- Optitex. Available online: https://optitex.com/ (accessed on 15 July 2021).


| Fabric | Raw Material Composition | Wave | Density [Thread/cm] | Weight [g/m2] | ||
|---|---|---|---|---|---|---|
| Warp | Weft | |||||
| F1 | 100% polyester fiber | Twill 3/1 |  | 112.2 | 41.2 | 135.2 |
| F2 | 100% polyester fiber | Plane 1/1 |  | 72.8 | 36.3 | 83.7 |
| F3 | 63% polyester fiber, 23% viscose fiber, 4% elastane fiber | Twill 2/1 |  | 35.7 | 28.2 | 286.1 |
| F4 | 100% wool | Plane 1/1 |  | 38.9 | 35.9 | 161.8 |
| F5 | 75% wool, 15% polyester fiber, 10% elastane fiber | Twill 2/1 |  | 23.7 | 24.1 | 178.7 |
| F6 | 100% polyester fiber | Plane 1/1 |  | 19.6 | 18.0 | 159.8 |
| F7 | 97% polyester fiber, 3% elastane fiber | Plane 1/1 |  | 23.2 | 20.8 | 178.1 |
| F8 | 65% cotton, 31% polyester fiber, 4% elastane fiber | Twill 2/1 |  | 42.6 | 18.1 | 253.4 |
| F9 | 65% polyester fiber, 35% viscose fiber | Plane 1/1 |  | 42.7 | 31.1 | 366.8 |
| Measurement system | Samples | EM-1 [%] | EM-2 [%] | B-1 [cNcm] | B-2 [cNcm] | G [cN/(cm°)−1] | T0 [mm] |
| KES | F1 | 2.75 | 6.92 | 0.0195 | 0.0061 | 0.41 | 0.405 |
| F2 | 3.90 | 31.28 | 0.0085 | 0.0033 | 0.46 | 0.356 | |
| F3 | 21.54 | 22.05 | 0.0297 | 0.0240 | 0.61 | 0.900 | |
| F4 | 3.02 | 9.58 | 0.0324 | 0.0161 | 0.73 | 0.439 | |
| F5 | 9.05 | 11.49 | 0.0214 | 0.0200 | 0.50 | 0.539 | |
| F6 | 12.41 | 9.63 | 0.0362 | 0.3980 | 0.49 | 0.600 | |
| F7 | 7.02 | 7.75 | 0.0532 | 0.4440 | 0.69 | 0.510 | |
| F8 | 3.48 | 21.15 | 0.0743 | 0.0370 | 1.26 | 0.980 | |
| F9 | 3.97 | 6.27 | 0.3354 | 0.0989 | 1.15 | 2.420 | |
| Measurement system | Samples | E100-1 [%] | E100-2 [%] | B-1 [µNm] | B-2 [µNm] | G [Nm−1] | ST [mm] |
| FAST | F1 | 1.1 | 3.9 | 4.5 | 1.9 | 23 | 0.060 |
| F2 | 1.6 | 18.0 | 2.1 | 1.1 | 16 | 0.080 | |
| F3 | 11.9 | 11.7 | 7.7 | 6.3 | 27 | 0.174 | |
| F4 | 1.4 | 4.9 | 7.6 | 3.9 | 33 | 0.082 | |
| F5 | 4.9 | 5.9 | 5.7 | 5.3 | 24 | 0.086 | |
| F6 | 6.5 | 5.1 | 9.1 | 9.3 | 24 | 0.096 | |
| F7 | 3.2 | 3.4 | 11.9 | 9.8 | 38 | 0.072 | |
| F8 | 1.6 | 10.6 | 32.1 | 10.3 | 60 | 0.225 | |
| F9 | 1.5 | 2.8 | 94.3 | 23.4 | 67 | 0.960 |
| Samples | F1 | F2 | F3 | F4 | F5 | F6 | F7 | F8 | F9 |
|---|---|---|---|---|---|---|---|---|---|
 |  |  |  |  |  |  |  |  | |
| Kd | 0.222 | 0.227 | 0.285 | 0.319 | 0.348 | 0.403 | 0.442 | 0.548 | 0.647 |
| Samples | FAST | KES | ||||||
|---|---|---|---|---|---|---|---|---|
| 0.2 mm | 0.4 mm | 0.6 mm | 0.8 mm | 0.2 mm | 0.4 mm | 0.6 mm | 0.8 mm | |
| F1 |  |  |  |  |  |  |  |  |
| F2 |  |  |  |  |  |  |  |  |
| F3 |  |  |  |  |  |  |  |  |
| F4 |  |  |  |  |  |  |  |  |
| F5 |  |  |  |  |  |  |  |  |
| F6 |  |  |  |  |  |  |  |  |
| F7 |  |  |  |  |  |  |  |  |
| F8 |  |  |  |  |  |  |  |  |
| F9 |  |  |  |  |  |  |  |  |
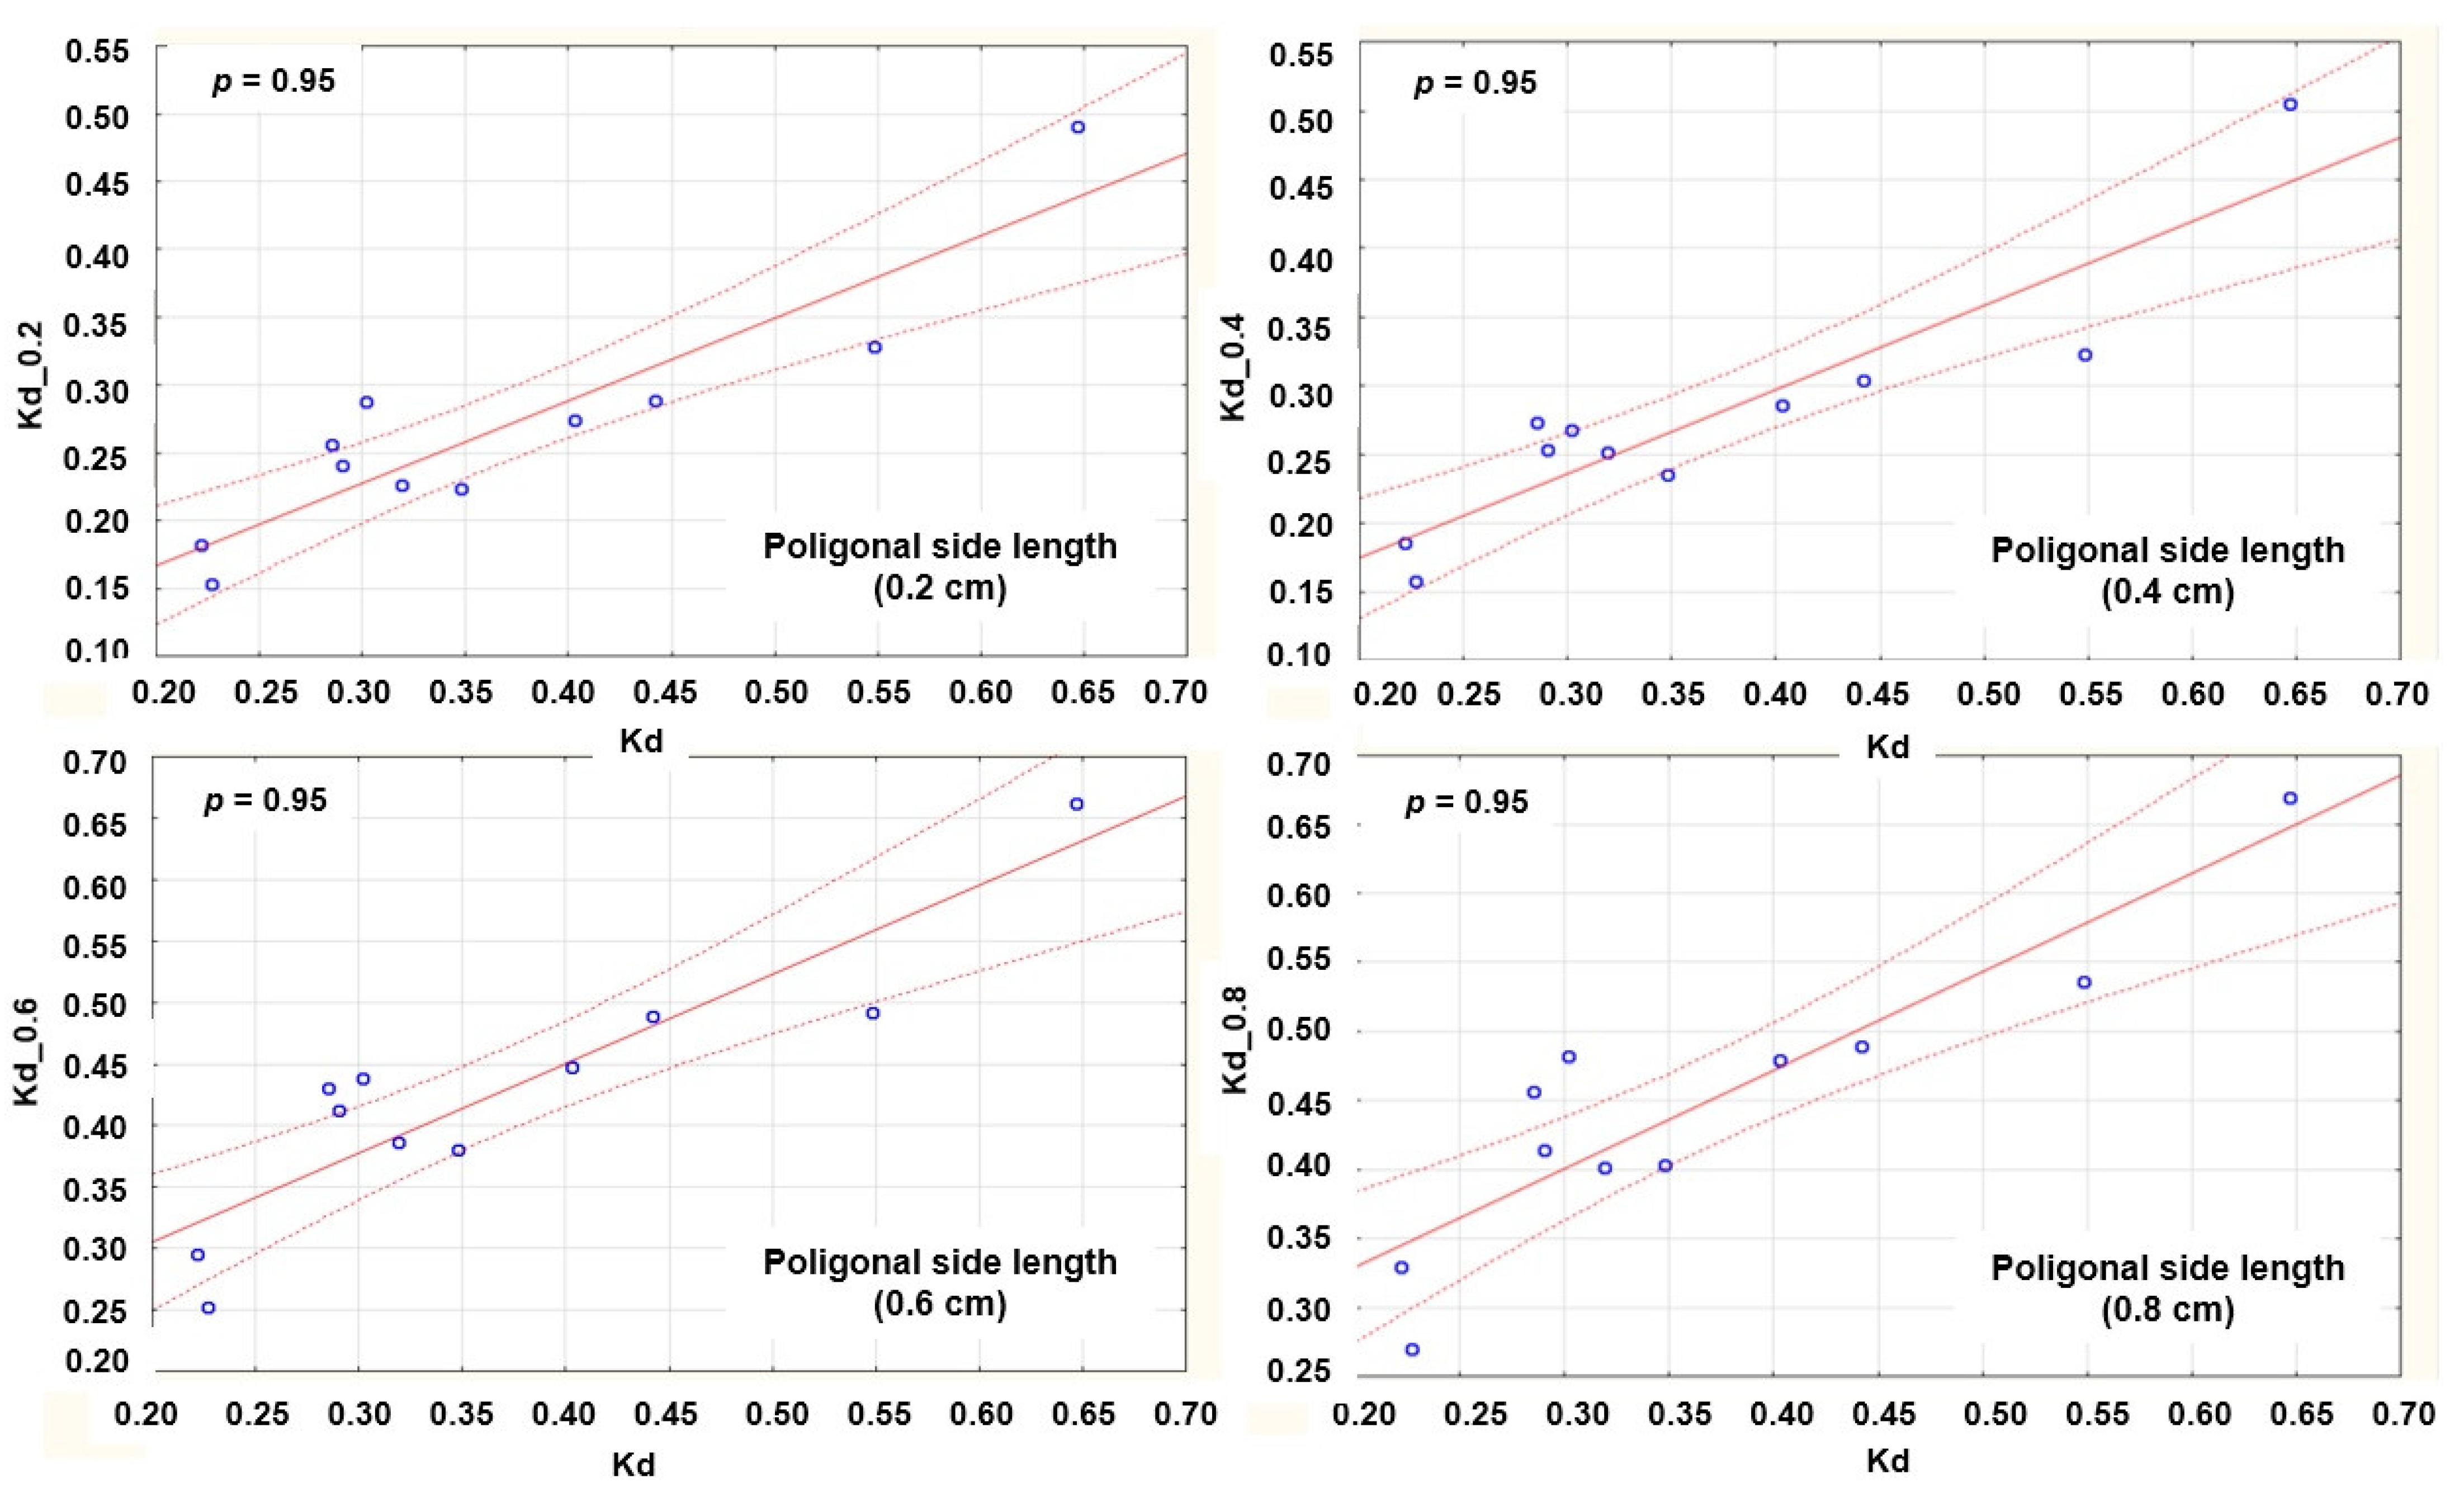
| Measurement System | FAST | KES | ||||||
|---|---|---|---|---|---|---|---|---|
| Correlation parameters | Kd 0.2 | Kd 0.4 | Kd 0.6 | Kd 0.8 | Kd 0.2 | Kd 0.4 | Kd 0.6 | Kd 0.8 |
| r | 0.868 | 0.861 | 0.897 | 0.915 | 0.910 | 0.912 | 0.900 | 0.899 |
| r2 | 0.754 | 0.742 | 0.805 | 0.839 | 0.828 | 0.831 | 0.810 | 0.809 |
| t | 5.250 | 5.090 | 6.093 | 6.841 | 6.591 | 6.649 | 6.197 | 6.186 |
| p | 0.001 | 0.001 | 0.000 | 0.000 | 0.000 | 0.000 | 0.000 | 0.000 |
| a | 0.037 | 0.026 | 0.272 | 0.305 | 0.046 | 0.052 | 0.159 | 0.187 |
| b | 0.234 | 0.946 | 0.750 | 0.747 | 0.607 | 0.612 | 0.726 | 0.712 |
| Samples | Drape | Simulation FAST Data | Simulation KES Data | ||||||
|---|---|---|---|---|---|---|---|---|---|
| Kd | Kd 0.2 | Kd 0.4 | Kd 0.6 | Kd 0.8 | Kd 0.2 | Kd 0.4 | Kd 0.6 | Kd 0.8 | |
| F1 | 0.222 | 0.113 | 0.319 | 0.492 | 0.530 | 0.182 | 0.186 | 0.295 | 0.329 |
| F2 | 0.227 | 0.107 | 0.260 | 0.453 | 0.465 | 0.153 | 0.158 | 0.252 | 0.270 |
| F3 | 0.285 | 0.080 | 0.258 | 0.434 | 0.466 | 0.256 | 0.273 | 0.431 | 0.457 |
| F4 | 0.319 | 0.125 | 0.354 | 0.528 | 0.565 | 0.226 | 0.252 | 0.386 | 0.402 |
| F5 | 0.348 | 0.108 | 0.315 | 0.507 | 0.556 | 0.224 | 0.235 | 0.380 | 0.403 |
| F6 | 0.403 | 0.149 | 0.390 | 0.575 | 0.623 | 0.274 | 0.286 | 0.448 | 0.479 |
| F7 | 0.442 | 0.141 | 0.411 | 0.611 | 0.642 | 0.289 | 0.304 | 0.489 | 0.490 |
| F8 | 0.548 | 0.149 | 0.399 | 0.583 | 0.628 | 0.328 | 0.323 | 0.492 | 0.536 |
| F9 | 0.647 | 0.203 | 0.785 | 0.840 | 0.853 | 0.491 | 0.505 | 0.662 | 0.669 |
| Drape Coefficient | Correlation Parameters | Mechanical Parameters from KES System | ||||||
|---|---|---|---|---|---|---|---|---|
| T0 | B-1 | B-2 | EMT-1 | EMT-2 | G | W | ||
| Kdreal | r | 0.740 | 0.849 | 0.916 | −0.250 | −0.411 | 0.884 | 0.642 |
| p | 0.009 | 0.001 | 0.000 | 0.459 | 0.209 | 0.000 | 0.033 | |
| a | 0.292 | 0.292 | 0.212 | 0.406 | 0.458 | 0.117 | 0.147 | |
| b | 0.381 | 0.004 | 0.020 | −0.010 | −0.012 | 0.007 | 0.106 | |
| Kdsim0.4 | r | 0.911 | 0.955 | 0.963 | −0.352 | −0.541 | 0.775 | 0.604 |
| p | 0.000 | 0.000 | 0.000 | 0.288 | 0.086 | 0.005 | 0.049 | |
| a | 0.272 | 0.281 | 0.199 | 0.434 | 0.504 | 0.132 | 0.145 | |
| b | 0.514 | 0.005 | 0.023 | −0.015 | −0.017 | 0.007 | 0.110 | |
| Kdsim0.6 | r | 0.882 | 0.932 | 0.928 | −0.368 | −0.557 | 0.756 | 0.552 |
| p | 0.000 | 0.000 | 0.000 | 0.266 | 0.075 | 0.007 | 0.078 | |
| a | 0.399 | 0.406 | 0.333 | 0.541 | 0.604 | 0.278 | 0.302 | |
| b | 0.438 | 0.004 | 0.020 | −0.014 | −0.015 | 0.006 | 0.088 | |
Publisher’s Note: MDPI stays neutral with regard to jurisdictional claims in published maps and institutional affiliations. |
© 2021 by the authors. Licensee MDPI, Basel, Switzerland. This article is an open access article distributed under the terms and conditions of the Creative Commons Attribution (CC BY) license (https://creativecommons.org/licenses/by/4.0/).
Share and Cite
Petrak, S.; Mahnić Naglić, M.; Rogale, D.; Geršak, J. Analysis of Polygonal Computer Model Parameters and Influence on Fabric Drape Simulation. Materials 2021, 14, 6259. https://doi.org/10.3390/ma14216259
Petrak S, Mahnić Naglić M, Rogale D, Geršak J. Analysis of Polygonal Computer Model Parameters and Influence on Fabric Drape Simulation. Materials. 2021; 14(21):6259. https://doi.org/10.3390/ma14216259
Chicago/Turabian StylePetrak, Slavenka, Maja Mahnić Naglić, Dubravko Rogale, and Jelka Geršak. 2021. "Analysis of Polygonal Computer Model Parameters and Influence on Fabric Drape Simulation" Materials 14, no. 21: 6259. https://doi.org/10.3390/ma14216259
APA StylePetrak, S., Mahnić Naglić, M., Rogale, D., & Geršak, J. (2021). Analysis of Polygonal Computer Model Parameters and Influence on Fabric Drape Simulation. Materials, 14(21), 6259. https://doi.org/10.3390/ma14216259