
Hydration Patterns in Sodium Alginate Polymeric Matrix Tablets—The Result of Drug Substance Incorporation

 , , , , ,
  , and
, and
Abstract
:
1. Introduction
2. Materials and Methods
2.1. Materials
2.2. Tablet Preparation, Hydration and Spatial Sampling
2.3. Spatial Distribution of Water Content within the Matrix Tablets Using Karl Fischer Titration
2.4. Differential Scanning Calorimetry
2.5. Magnetic Resonance Imaging and Image Analysis
2.6. X-ray Microtomography
2.7. Drug Dissolution Study
3. Results
3.1. Characteristics of ALG/SA Tablets
3.2. Characteristics of ALG/SNA Tablets
3.3. Discussion with Reference to Alginate (Placebo) Matrix
4. Conclusions
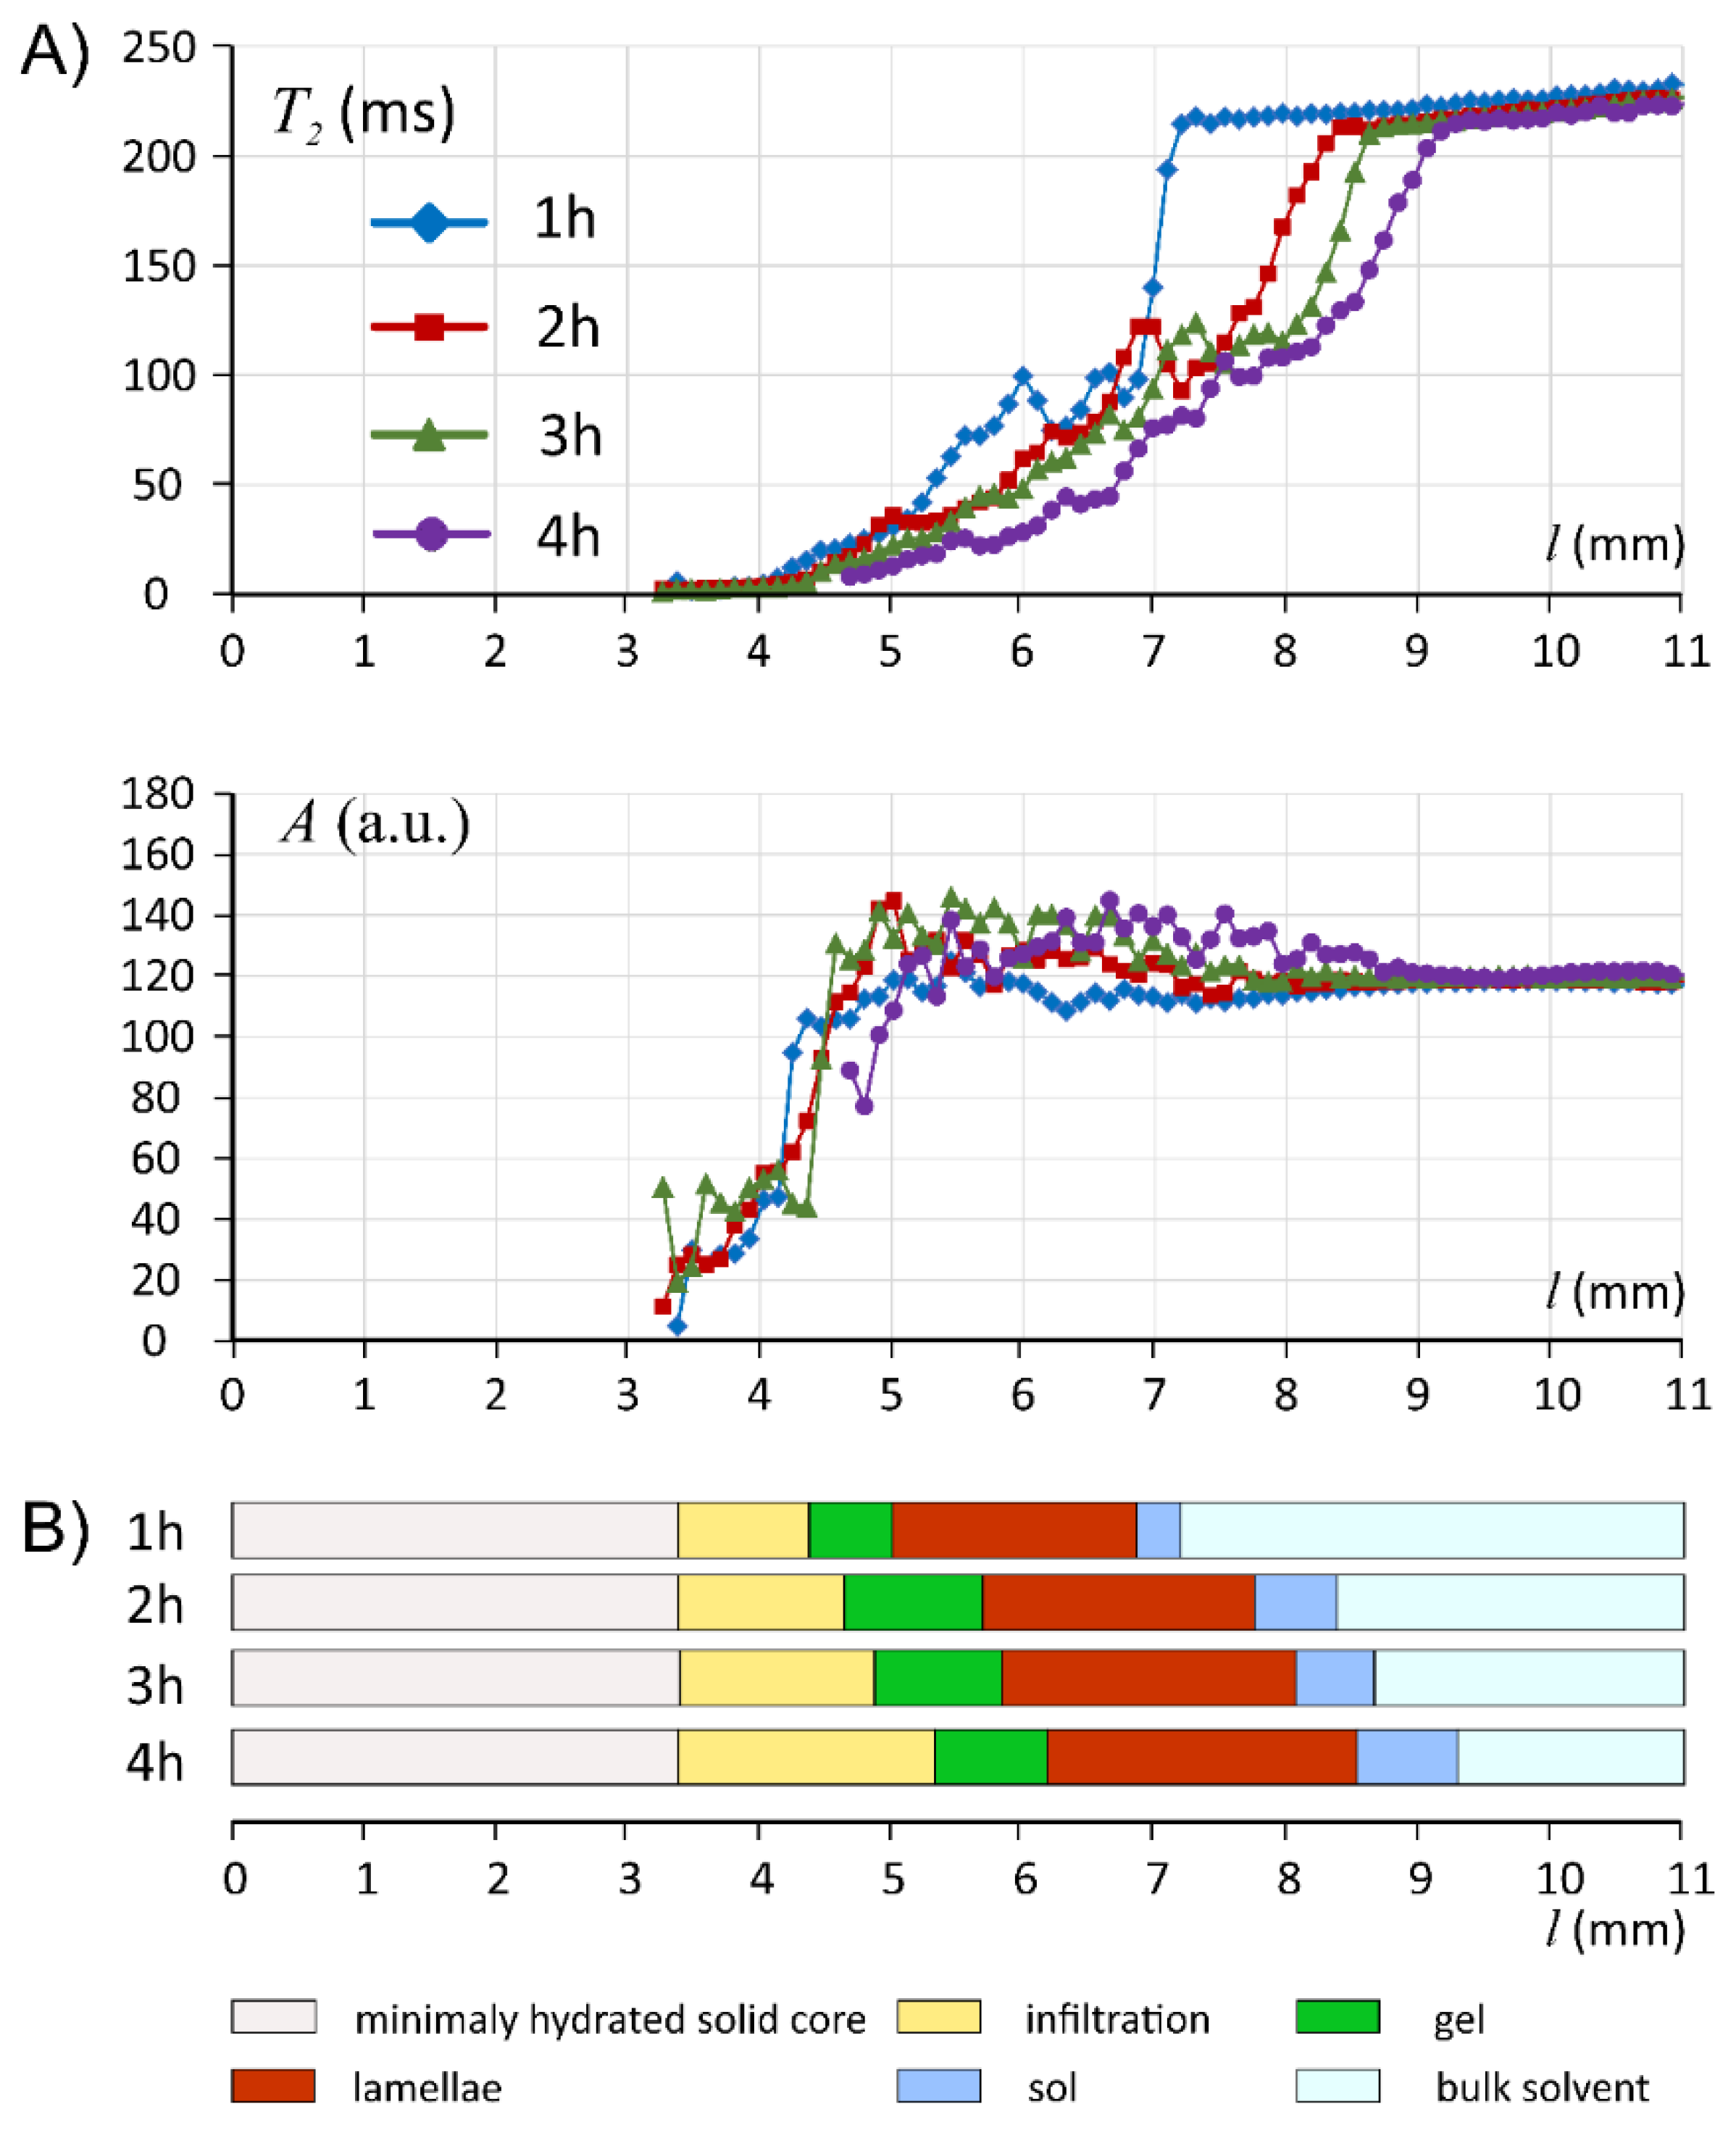
- “locking” of the internal part of the matrix (ALG/SA);
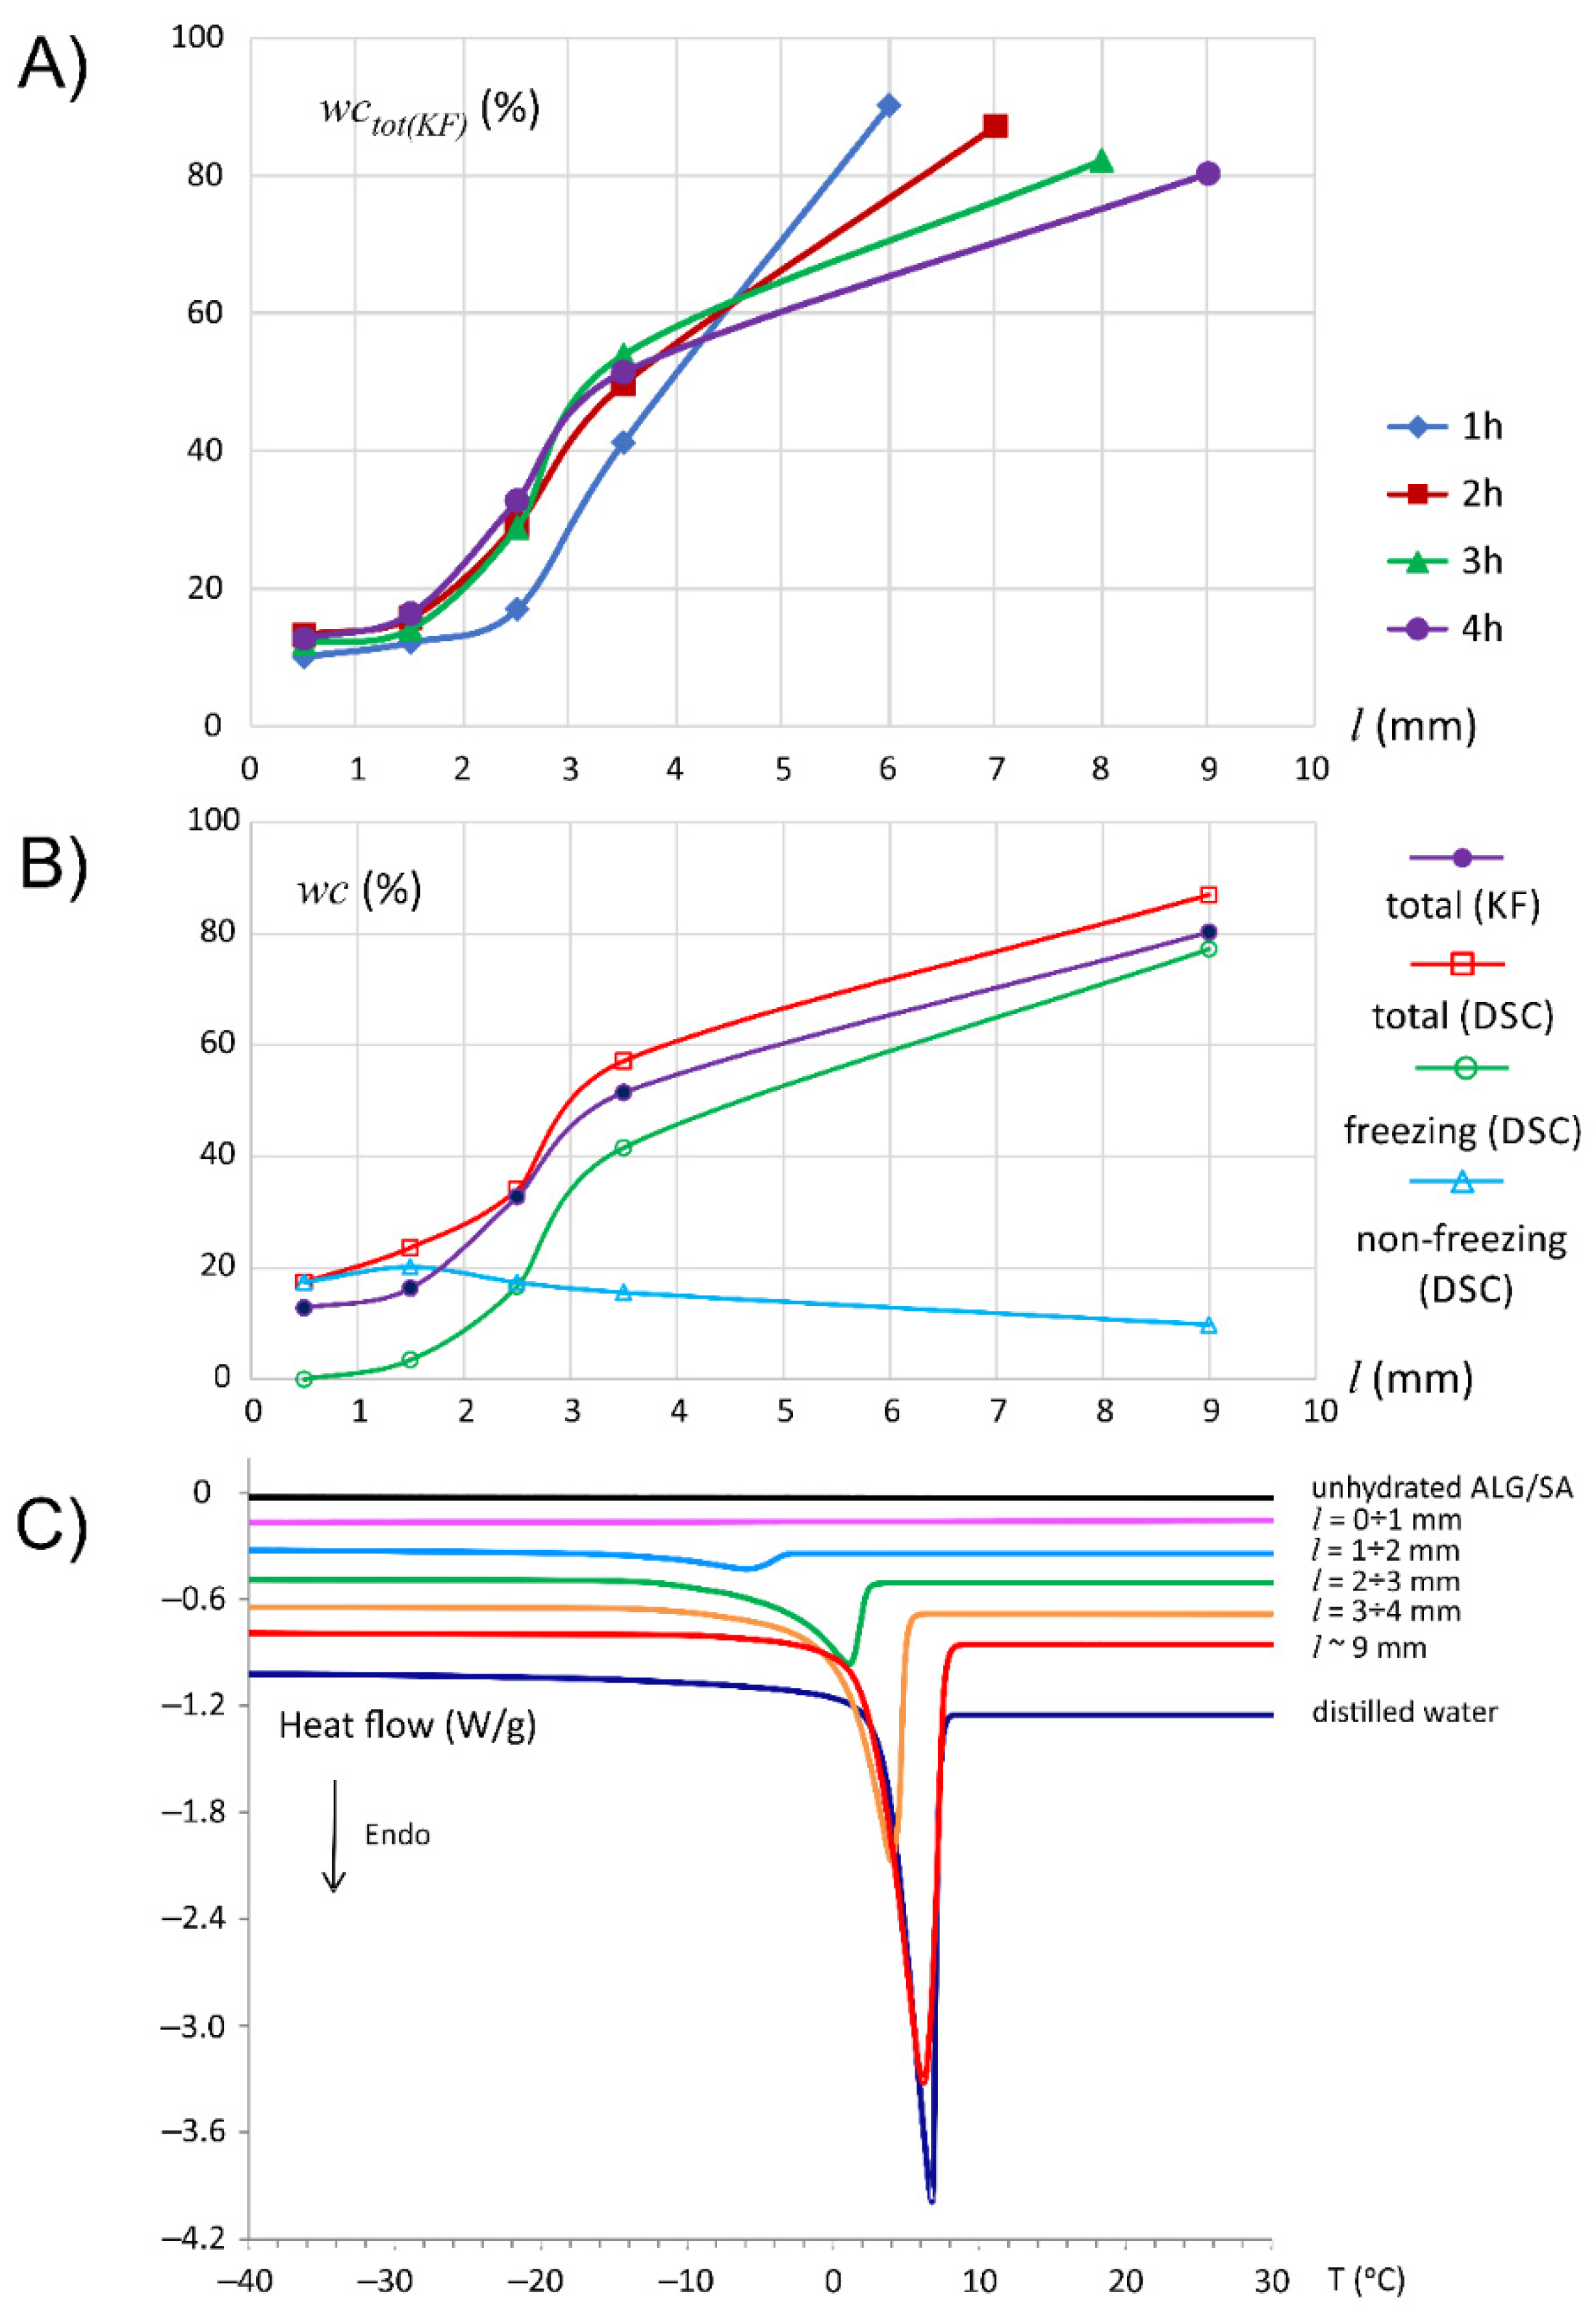
- existence of lamellar region associated with detection of free/freezing water (ALG/SA);
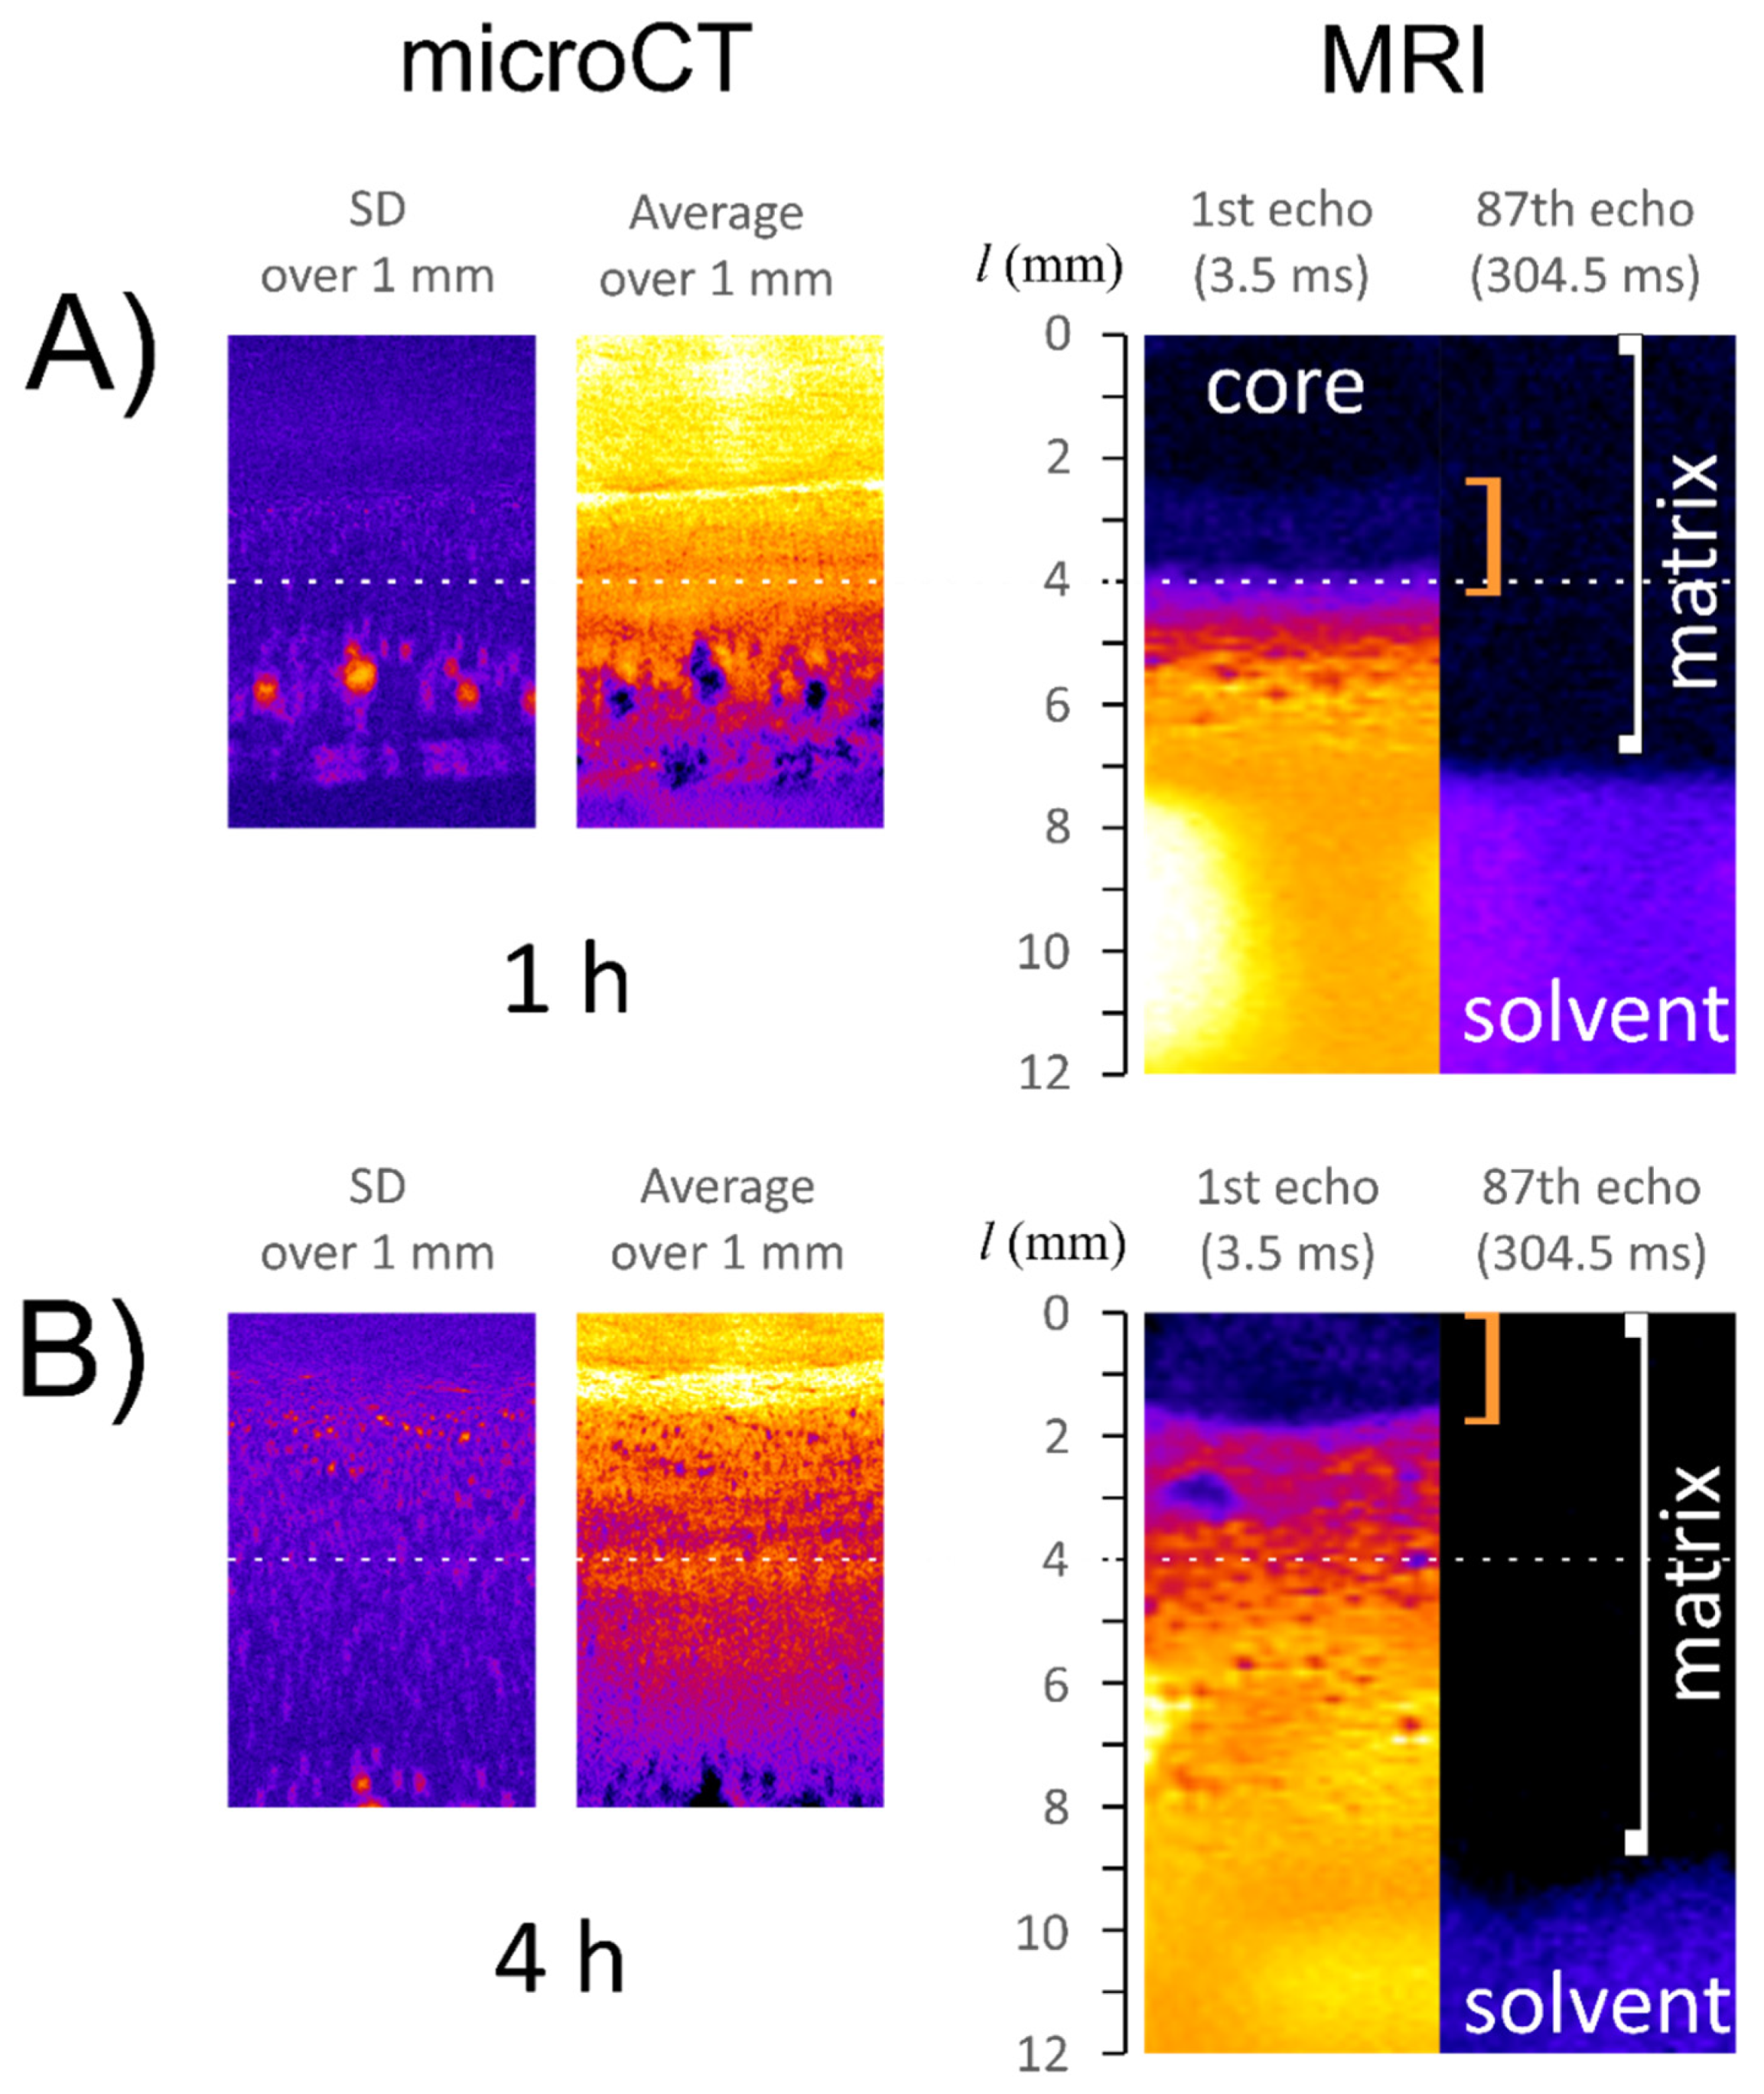
- existence of water penetrating the matrix, forming a specific layer preceding the infiltration layer (ALG/SNA);
- switch in the onset temperature of endothermic water peak associated with an increase in the fraction of non-freezing water weight per dry matrix weight in the middle of infiltration layer (ALG/SNA);
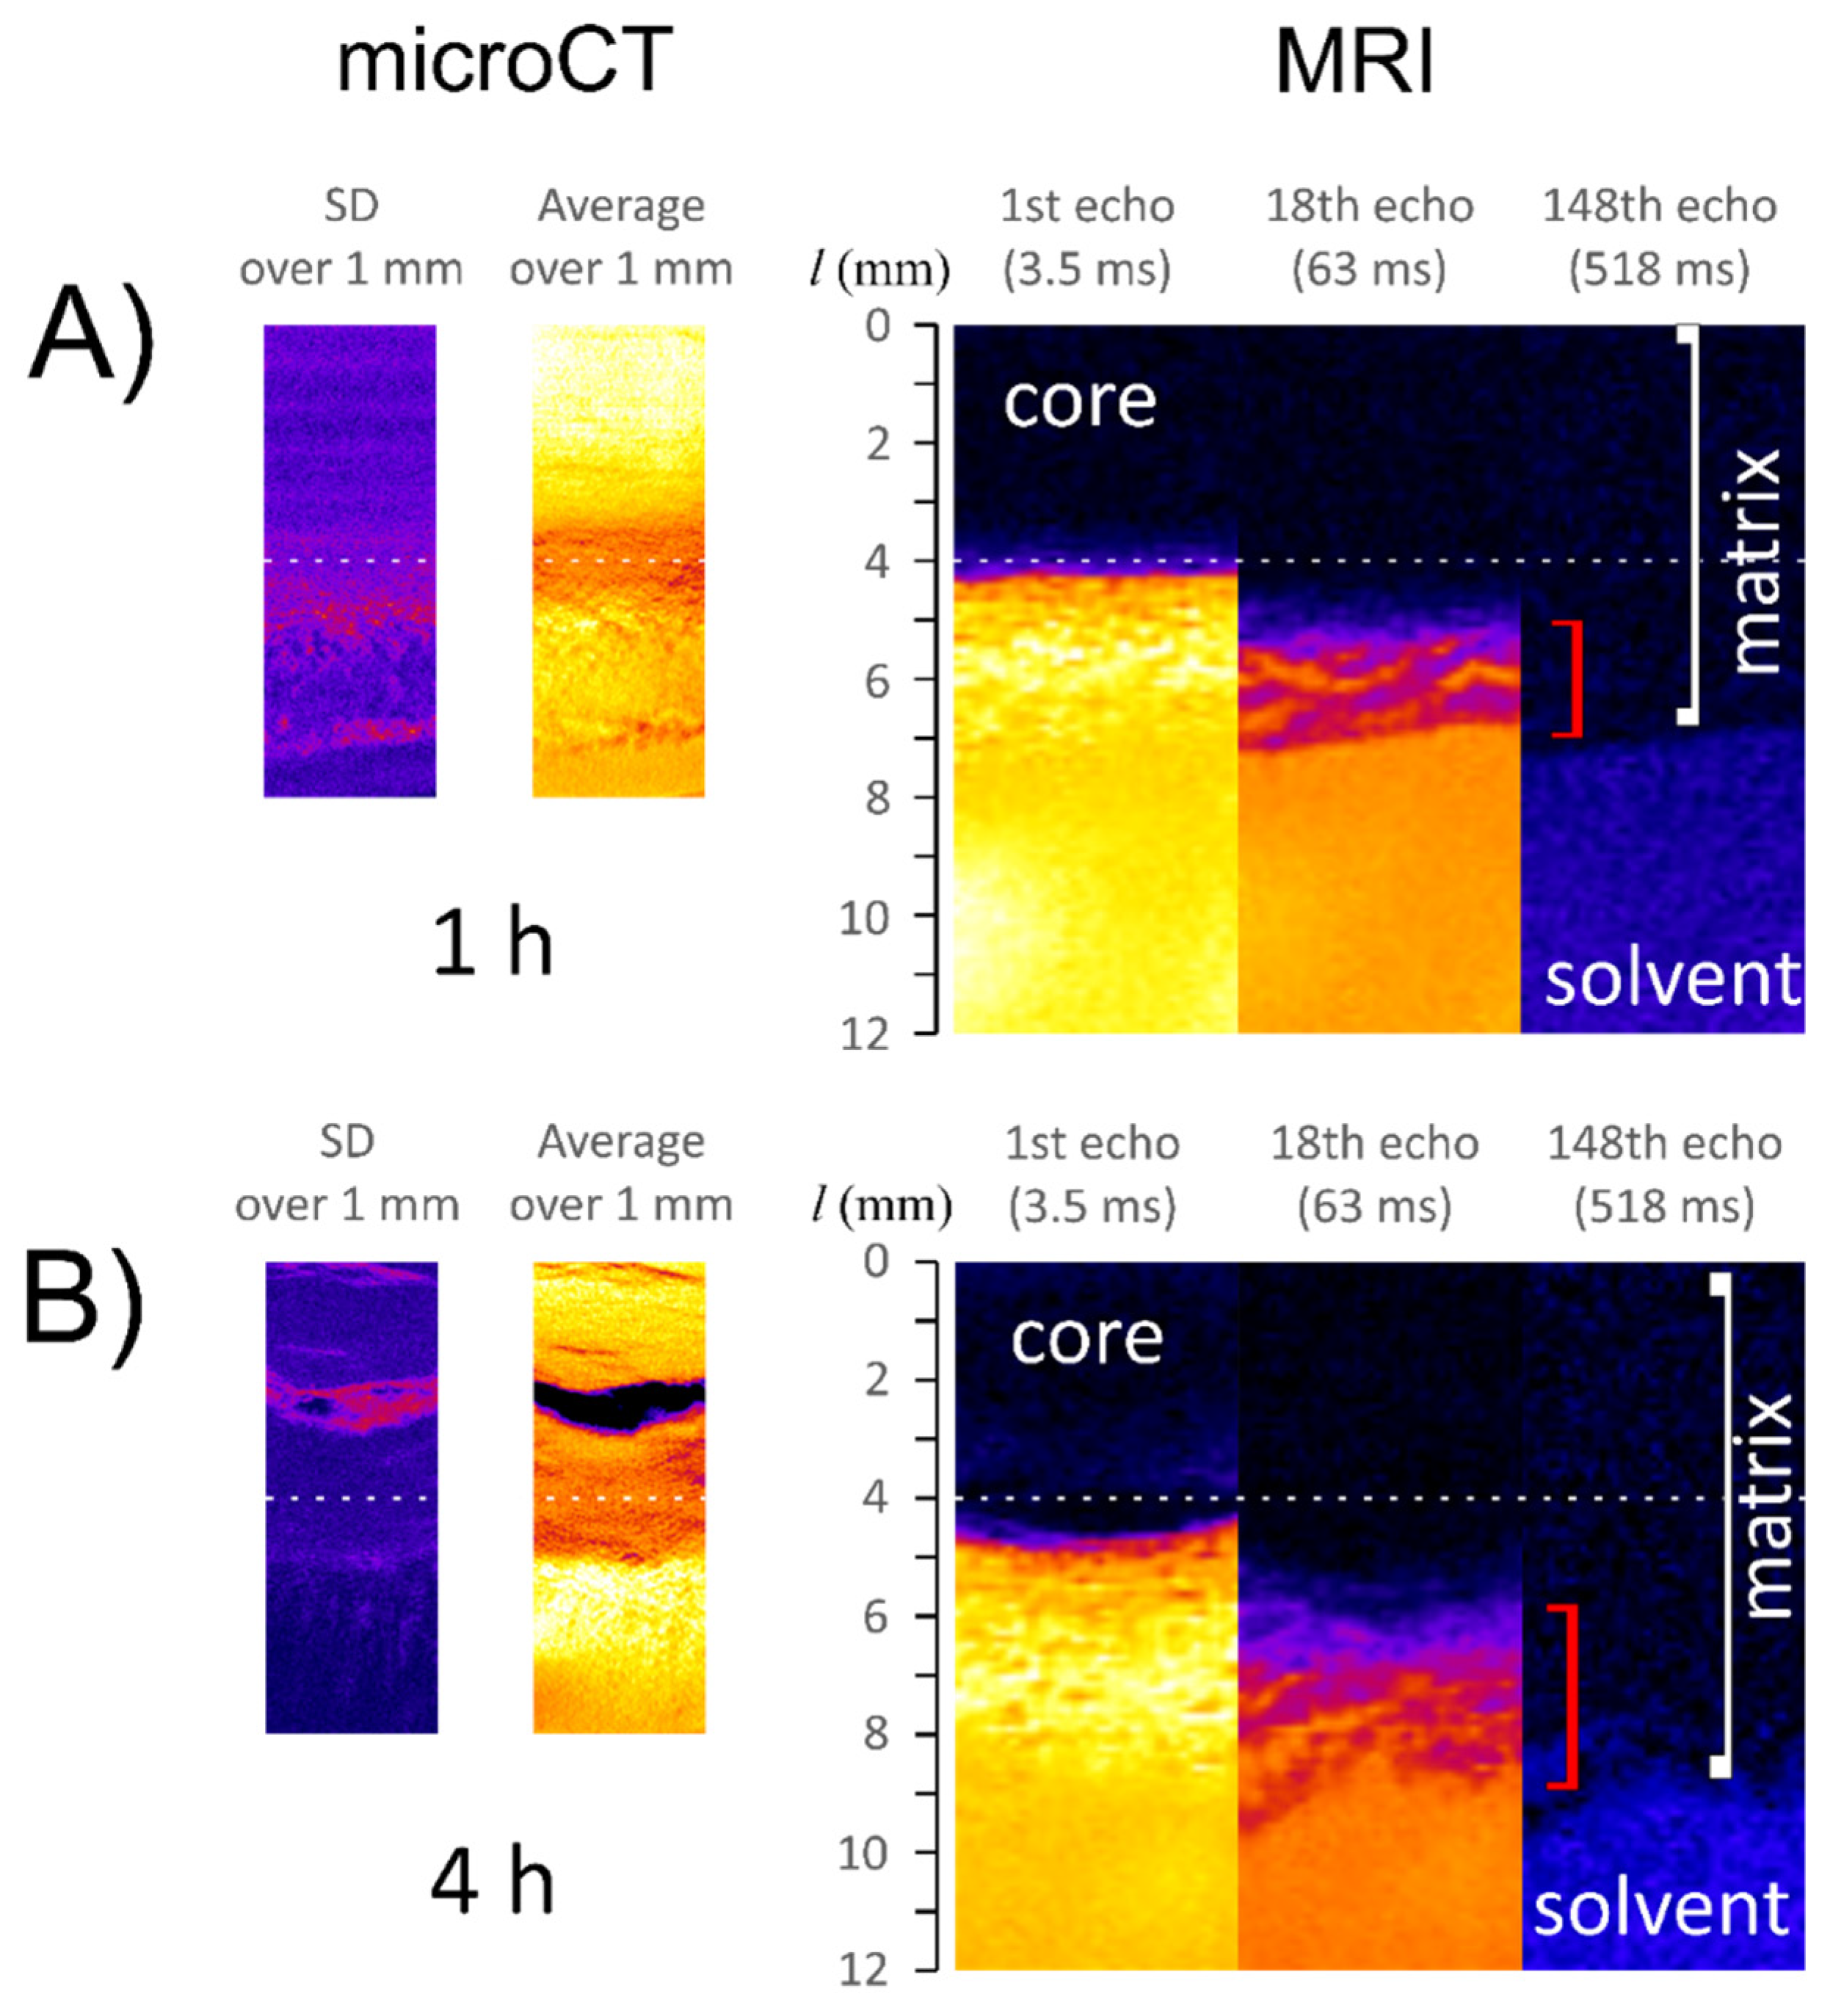
- the region denoted as infiltration layer is characterized by a high gradient in magnetic resonance signal intensity (proton density) and lower X-ray absorbance (mainly lower density) when compared with the core.
Supplementary Materials
Author Contributions
Funding
Institutional Review Board Statement
Informed Consent Statement
Data Availability Statement
Conflicts of Interest
References
- Mansour, H.M.; Sohn, M.; Al-Ghananeem, A.; DeLuca, P.P. Materials for Pharmaceutical Dosage Forms: Molecular Pharmaceutics and Controlled Release Drug Delivery Aspects. Int. J. Mol. Sci. 2010, 11, 3298–3322. [Google Scholar] [CrossRef] [Green Version]
- Timmins, P.; Pygall, S.R.; Melia, C.D. Hydrophilic Matrix Tablets for Oral Controlled Release. AAPS Adv. Pharm. Sci. Ser. 2014, 16, 326. [Google Scholar] [CrossRef]
- Siepmann, F.; Eckart, K.; Maschke, A.; Kolter, K.; Siepmann, J. Modeling drug release from PVAc/PVP matrix tablets. J. Control. Release 2010, 141, 216–222. [Google Scholar] [CrossRef]
- Kulinowski, P.; Mlynarczyk, A.; Jasinski, K.; Talik, P.; Gruwel, M.L.H.; Tomanek, B.; Weglarz, W.P.; Dorozynski, P. Magnetic Resonance Microscopy for Assessment of Morphological Changes in Hydrating Hydroxypropylmethylcellulose Matrix Tablets In Situ-Is it Possible to Detect Phenomena Related to Drug Dissolution Within the Hydrated Matrices? Pharm. Res. 2014, 31, 2383–2392. [Google Scholar] [CrossRef] [Green Version]
- Kulinowski, P.; Mlynarczyk, A.; Dorozynski, P.; Jasinski, K.; Gruwel, M.L.H.; Tomanek, B.; Weglarz, W.P. Magnetic Resonance Microscopy for Assessment of Morphological Changes in Hydrating Hydroxypropylmethyl Cellulose Matrix Tablets In Situ. Pharm. Res. 2012, 29, 3420–3433. [Google Scholar] [CrossRef]
- Dorozynski, P.P.; Kulinowski, P.; Mlynarczyk, A.; Stanisz, G.J. Foundation review: MRI as a tool for evaluation of oral controlled release dosage forms. Drug Discov. Today 2012, 17, 110–123. [Google Scholar] [CrossRef]
- Nokhodchi, A.; Raja, S.; Patel, P.; Asare-Addo, K. The role of oral controlled release matrix tablets in drug delivery systems. BioImpacts 2012, 2, 175–187. [Google Scholar] [CrossRef] [Green Version]
- Colombo, P.; Bettini, R.; Santi, P.; DeAscentiis, A.; Peppas, N.A. Analysis of the swelling and release mechanisms from drug delivery systems with emphasis on drug solubility and water transport. J. Control. Release 1996, 39, 231–237. [Google Scholar] [CrossRef]
- Colombo, P.; Bettini, R.; Massimo, G.; Catellani, P.L.; Santi, P.; Peppas, N.A. Drug diffusion front movement is important in drug-release control from swellable matrix tablets. J. Pharm. Sci. 1995, 84, 991–997. [Google Scholar] [CrossRef]
- Gao, P.; Skoug, J.W.; Nixon, P.R.; Ju, T.R.; Stemm, N.L.; Sung, K.C. Swelling of hydroxypropyl methylcellulose matrix tablets. 2. Mechanistic study of the influence of formulation variables on matrix performance and drug release. J. Pharm. Sci. 1996, 85, 732–740. [Google Scholar] [CrossRef]
- Kim, H.; Fassihi, R. A new ternary polymeric matrix system for controlled drug delivery of highly soluble drugs. 1. Diltiazem hydrochloride. Pharm. Res. 1997, 14, 1415–1421. [Google Scholar] [CrossRef]
- Colombo, P.; Bettini, R.; Santi, P.; Peppas, N.A. Swellable matrices for controlled drug delivery: Gel-layer behaviour, mechanisms and optimal performance. Pharm. Sci. Technol. Today 2000, 3, 198–204. [Google Scholar] [CrossRef]
- Talukdar, M.M.; Rombaut, P.; Kinget, R. The release mechanism of an oral controlled-release delivery system for indomethacin. Pharm. Dev. Technol. 1998, 3, 1–6. [Google Scholar] [CrossRef]
- Gao, P.; Meury, R.H. Swelling of hydroxypropyl methylcellulose matrix tablets. 1. Characterization of swelling using a novel optical imaging method. J. Pharm. Sci. 1996, 85, 725–731. [Google Scholar] [CrossRef]
- Ferrero, C.; Massuelle, D.; Doelker, E. Towards elucidation of the drug release mechanism from compressed hydrophilic matrices made of cellulose ethers. II. Evaluation of a possible swelling-controlled drug release mechanism using dimensionless analysis. J. Control. Release 2010, 141, 223–233. [Google Scholar] [CrossRef] [PubMed]
- Miller-Chou, B.A.; Koenig, J.L. A review of polymer dissolution. Prog. Polym. Sci. 2003, 28, 1223–1270. [Google Scholar] [CrossRef] [Green Version]
- Bowtell, R.; Sharp, J.C.; Peters, A.; Mansfield, P.; Rajabisiahboomi, A.R.; Davies, M.C.; Melia, C.D. NMR microscopy of hydrating hydrophilic matrix pharmaceutical tablets. Magn. Reson. Imaging 1994, 12, 361–364. [Google Scholar] [CrossRef]
- Hyde, T.M.; Gladden, L.F. Simultaneous measurement of water and polymer concentration profiles during swelling of poly(ethylene oxide) using magnetic resonance imaging. Polymer 1998, 39, 811–819. [Google Scholar] [CrossRef]
- Rajabisiahboomi, A.R.; Bowtell, R.W.; Mansfield, P.; Henderson, A.; Davies, M.C.; Melia, C.D. Structure and behavior in hydrophilic matrix sustained-release dosage forms.2. nmr-imaging studies of dimensional changes in the gel layer and core of hpmc tablets undergoing hydration. J. Control. Release 1994, 31, 121–128. [Google Scholar] [CrossRef]
- Kowalczuk, J.; Tritt-Goc, J.; Pislewski, N. The swelling properties of hydroxypropyl methyl cellulose loaded with tetracycline hydrochloride: Magnetic resonance imaging study. Solid State Nucl. Magn. Reson. 2004, 25, 35–41. [Google Scholar] [CrossRef]
- Tritt-Goc, J.; Kowalczuk, J. Spatially resolved solvent interaction with glassy HPMC polymers studied by magnetic resonance microscopy. Solid State Nucl. Magn. Reson. 2005, 28, 250–257. [Google Scholar] [CrossRef]
- Mikac, U.; Sepe, A.; Baumgartner, S.; Kristl, J. The Influence of High Drug Loading in Xanthan Tablets and Media with Different Physiological pH and Ionic Strength on Swelling and Release. Mol. Pharm. 2016, 13, 1147–1157. [Google Scholar] [CrossRef]
- Mikac, U.; Sepe, A.; Kristl, J.; Baumgartner, S. A new approach combining different MRI methods to provide detailed view on swelling dynamics of xanthan tablets influencing drug release at different pH and ionic strength. J. Control. Release 2010, 145, 247–256. [Google Scholar] [CrossRef]
- Laity, P.R.; Cameron, R.E. Synchrotron X-ray microtomographic study of tablet swelling. Eur. J. Pharm. Biopharm. 2010, 75, 263–276. [Google Scholar] [CrossRef]
- Laity, P.R.; Mantle, M.D.; Gladden, L.F.; Cameron, R.E. Magnetic resonance imaging and X-ray microtomography studies of a gel-forming tablet formulation. Eur. J. Pharm. Biopharm. 2010, 74, 109–119. [Google Scholar] [CrossRef]
- Yin, X.; Li, H.; Guo, Z.; Wu, L.; Chen, F.; de Matas, M.; Shao, Q.; Xiao, T.; York, P.; He, Y.; et al. Quantification of Swelling and Erosion in the Controlled Release of a Poorly Water-Soluble Drug Using Synchrotron X-ray Computed Microtomography. AAPS J. 2013, 15, 1025–1034. [Google Scholar] [CrossRef] [Green Version]
- Yin, X.Z.; Li, L.; Gu, X.Q.; Wang, H.M.; Wu, L.; Qin, W.; Xiao, T.Q.; York, P.; Zhang, J.W.; Mao, S.R. Dynamic structure model of polyelectrolyte complex based controlled-release matrix tablets visualized by synchrotron radiation micro-computed tomography. Mater. Sci. Eng. C Mater. Biol. Appl. 2020, 116, 9. [Google Scholar] [CrossRef]
- Dorozynski, P.; Kulinowski, P.; Jamroz, W.; Juszczyk, E. Geometry of modified release formulations during dissolution-Influence on performance of dosage forms with diclofenac sodium. Int. J. Pharm. 2014, 477, 57–63. [Google Scholar] [CrossRef]
- Kulinowski, P.; Hudy, W.; Mendyk, A.; Juszczyk, E.; Weglarz, W.P.; Jachowicz, R.; Dorozynski, P. The Relationship Between the Evolution of an Internal Structure and Drug Dissolution from Controlled-Release Matrix Tablets. AAPS PharmSciTech 2016, 17, 735–742. [Google Scholar] [CrossRef] [Green Version]
- Juszczyk, E.; Kulinowski, P.; Baran, E.; Birczyński, A.; Majda, D.; García-Montoya, E.; Pérez-Lozano, P.; Suñé-Negre, J.M.; Węglarz, W.P.; Dorożyński, P. Spatiotemporal analysis of hydration mechanism in sodium alginate matrix tablets. Materials 2021, 14, 646. [Google Scholar] [CrossRef]
- Singh, B.; Chauhan, G.S.; Sharma, D.K.; Kant, A.; Gupta, I.; Chauhan, N. The release dynamics of model drugs from the psyllium and N-hydroxymethylacrylamide based hydrogels. Int. J. Pharm. 2006, 325, 15–25. [Google Scholar] [CrossRef]
- Tungprapa, S.; Jangchud, I.; Supaphol, P. Release characteristics of four model drugs from drug-loaded electrospun cellulose acetate fiber mats. Polymer 2007, 48, 5030–5041. [Google Scholar] [CrossRef]
- Taepaiboon, P.; Rungsardthong, U.; Supaphol, P. Drug-loaded electrospun mats of poly(vinyl alcohol) fibres and their release characteristics of four model drugs. Nanotechnology 2006, 17, 2317–2329. [Google Scholar] [CrossRef]
- Schindelin, J.; Arganda-Carreras, I.; Frise, E.; Kaynig, V.; Longair, M.; Pietzsch, T.; Preibisch, S.; Rueden, C.; Saalfeld, S.; Schmid, B.; et al. Fiji: An open-source platform for biological-image analysis. Nat. Methods 2012, 9, 676–682. [Google Scholar] [CrossRef] [Green Version]
- Ching, A.L.; Liew, C.V.; Chan, L.W.; Heng, P.W.S. Modifying matrix micro-environmental pH to achieve sustained drug release from highly laminating alginate matrices. Eur. J. Pharm. Sci. 2008, 33, 361–370. [Google Scholar] [CrossRef]
- Al Lafi, A.G.; Hay, J.N. State of the water in crosslinked sulfonated poly(ether ether ketone). J. Appl. Polym. Sci. 2013, 128, 3000–3009. [Google Scholar] [CrossRef]
- Mlcoch, T.; Kucerik, J. Hydration and drying of various polysaccharides studied using DSC. J. Therm. Anal. Calorim. 2013, 113, 1177–1185. [Google Scholar] [CrossRef]
- Hofer, K.; Mayer, E.; Johari, G.P. Glass liquid transition of water and ethylene-glycol solution in poly(2-hydroxyethyl methacrylate) hydrogel. J. Phys. Chem. 1990, 94, 2689–2696. [Google Scholar] [CrossRef]
- Kyritsis, A.; Pissis, P.; Ribelles, J.L.G.; Pradas, M.M. Polymer-water interactions in poly(hydroxyethyl acrylate) hydrogels studied by dielectric, calorimetric and sorption isotherm measurements. Polym. Gels Netw. 1995, 3, 445–469. [Google Scholar] [CrossRef]
- Kabirud, D.; Parveen, N.; Naqvi, A.Z. Hydrotropic Behavior of Sodium Salicylate in Presence of Additives. J. Dispers. Sci. Technol. 2009, 30, 1500–1505. [Google Scholar] [CrossRef]
- Ju, R.T.C.; Nixon, P.R.; Patel, M.V.; Tong, D.M. Drug-release from hydrophilic matrices. 2. a mathematical-model based on the polymer disentanglement concentration and the diffusion layer. J. Pharm. Sci. 1995, 84, 1464–1477. [Google Scholar] [CrossRef]
- Kulinowski, P.; Dorozynski, P.; Mlynarczyk, A.; Weglarz, W.P. Magnetic Resonance Imaging and Image Analysis for Assessment of HPMC Matrix Tablets Structural Evolution in USP Apparatus 4. Pharm. Res. 2011, 28, 1065–1073. [Google Scholar] [CrossRef] [Green Version]
- Kulinowski, P.; Woyna-Orlewicz, K.; Rappen, G.-M.; Haznar-Garbacz, D.; Weglarz, W.P.; Dorozynski, P.P. An understanding of modified release matrix tablets behavior during drug dissolution as the key for prediction of pharmaceutical product performance—Case study of multimodal characterization of quetiapine fumarate tablets. Int. J. Pharm. 2015, 484, 235–245. [Google Scholar] [CrossRef]
- Kulinowski, P.; Woyna-Orlewicz, K.; Obral, J.; Rappen, G.M.; Haznar-Garbacz, D.; Weglarz, W.P.; Jachowicz, R.; Wyszogrodzka, G.; Klaja, J.; Dorozynski, P.P. Multimodal approach to characterization of hydrophilic matrices manufactured by wet and dry granulation or direct compression methods. Int. J. Pharm. 2016, 499, 263–270. [Google Scholar] [CrossRef]
- Lapidus, H.; Lordi, N.G. Drug release from compressed hydrophilic matrices. J. Pharm. Sci. 1968, 57, 1292–1301. [Google Scholar] [CrossRef]


Publisher’s Note: MDPI stays neutral with regard to jurisdictional claims in published maps and institutional affiliations. |
© 2021 by the authors. Licensee MDPI, Basel, Switzerland. This article is an open access article distributed under the terms and conditions of the Creative Commons Attribution (CC BY) license (https://creativecommons.org/licenses/by/4.0/).
Share and Cite
Juszczyk, E.; Kulinowski, P.; Baran, E.; Birczyński, A.; Klaja, J.; Majda, D.; Garcia-Montoya, E.; Węglarz, W.P.; Dorożyński, P. Hydration Patterns in Sodium Alginate Polymeric Matrix Tablets—The Result of Drug Substance Incorporation. Materials 2021, 14, 6531. https://doi.org/10.3390/ma14216531
Juszczyk E, Kulinowski P, Baran E, Birczyński A, Klaja J, Majda D, Garcia-Montoya E, Węglarz WP, Dorożyński P. Hydration Patterns in Sodium Alginate Polymeric Matrix Tablets—The Result of Drug Substance Incorporation. Materials. 2021; 14(21):6531. https://doi.org/10.3390/ma14216531
Chicago/Turabian StyleJuszczyk, Ewelina, Piotr Kulinowski, Ewelina Baran, Artur Birczyński, Jolanta Klaja, Dorota Majda, Encarna Garcia-Montoya, Władysław P. Węglarz, and Przemysław Dorożyński. 2021. "Hydration Patterns in Sodium Alginate Polymeric Matrix Tablets—The Result of Drug Substance Incorporation" Materials 14, no. 21: 6531. https://doi.org/10.3390/ma14216531