
The Assessment of Water Retention Efficiency of Different Soil Amendments in Comparison to Water Absorbing Geocomposite


Abstract
:
1. Introduction
2. Materials and Methods
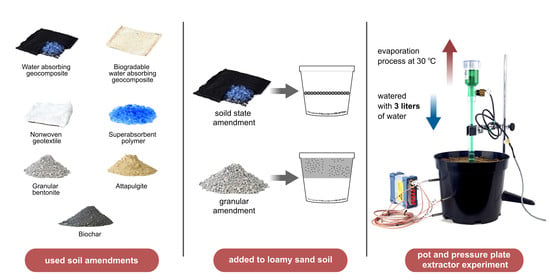
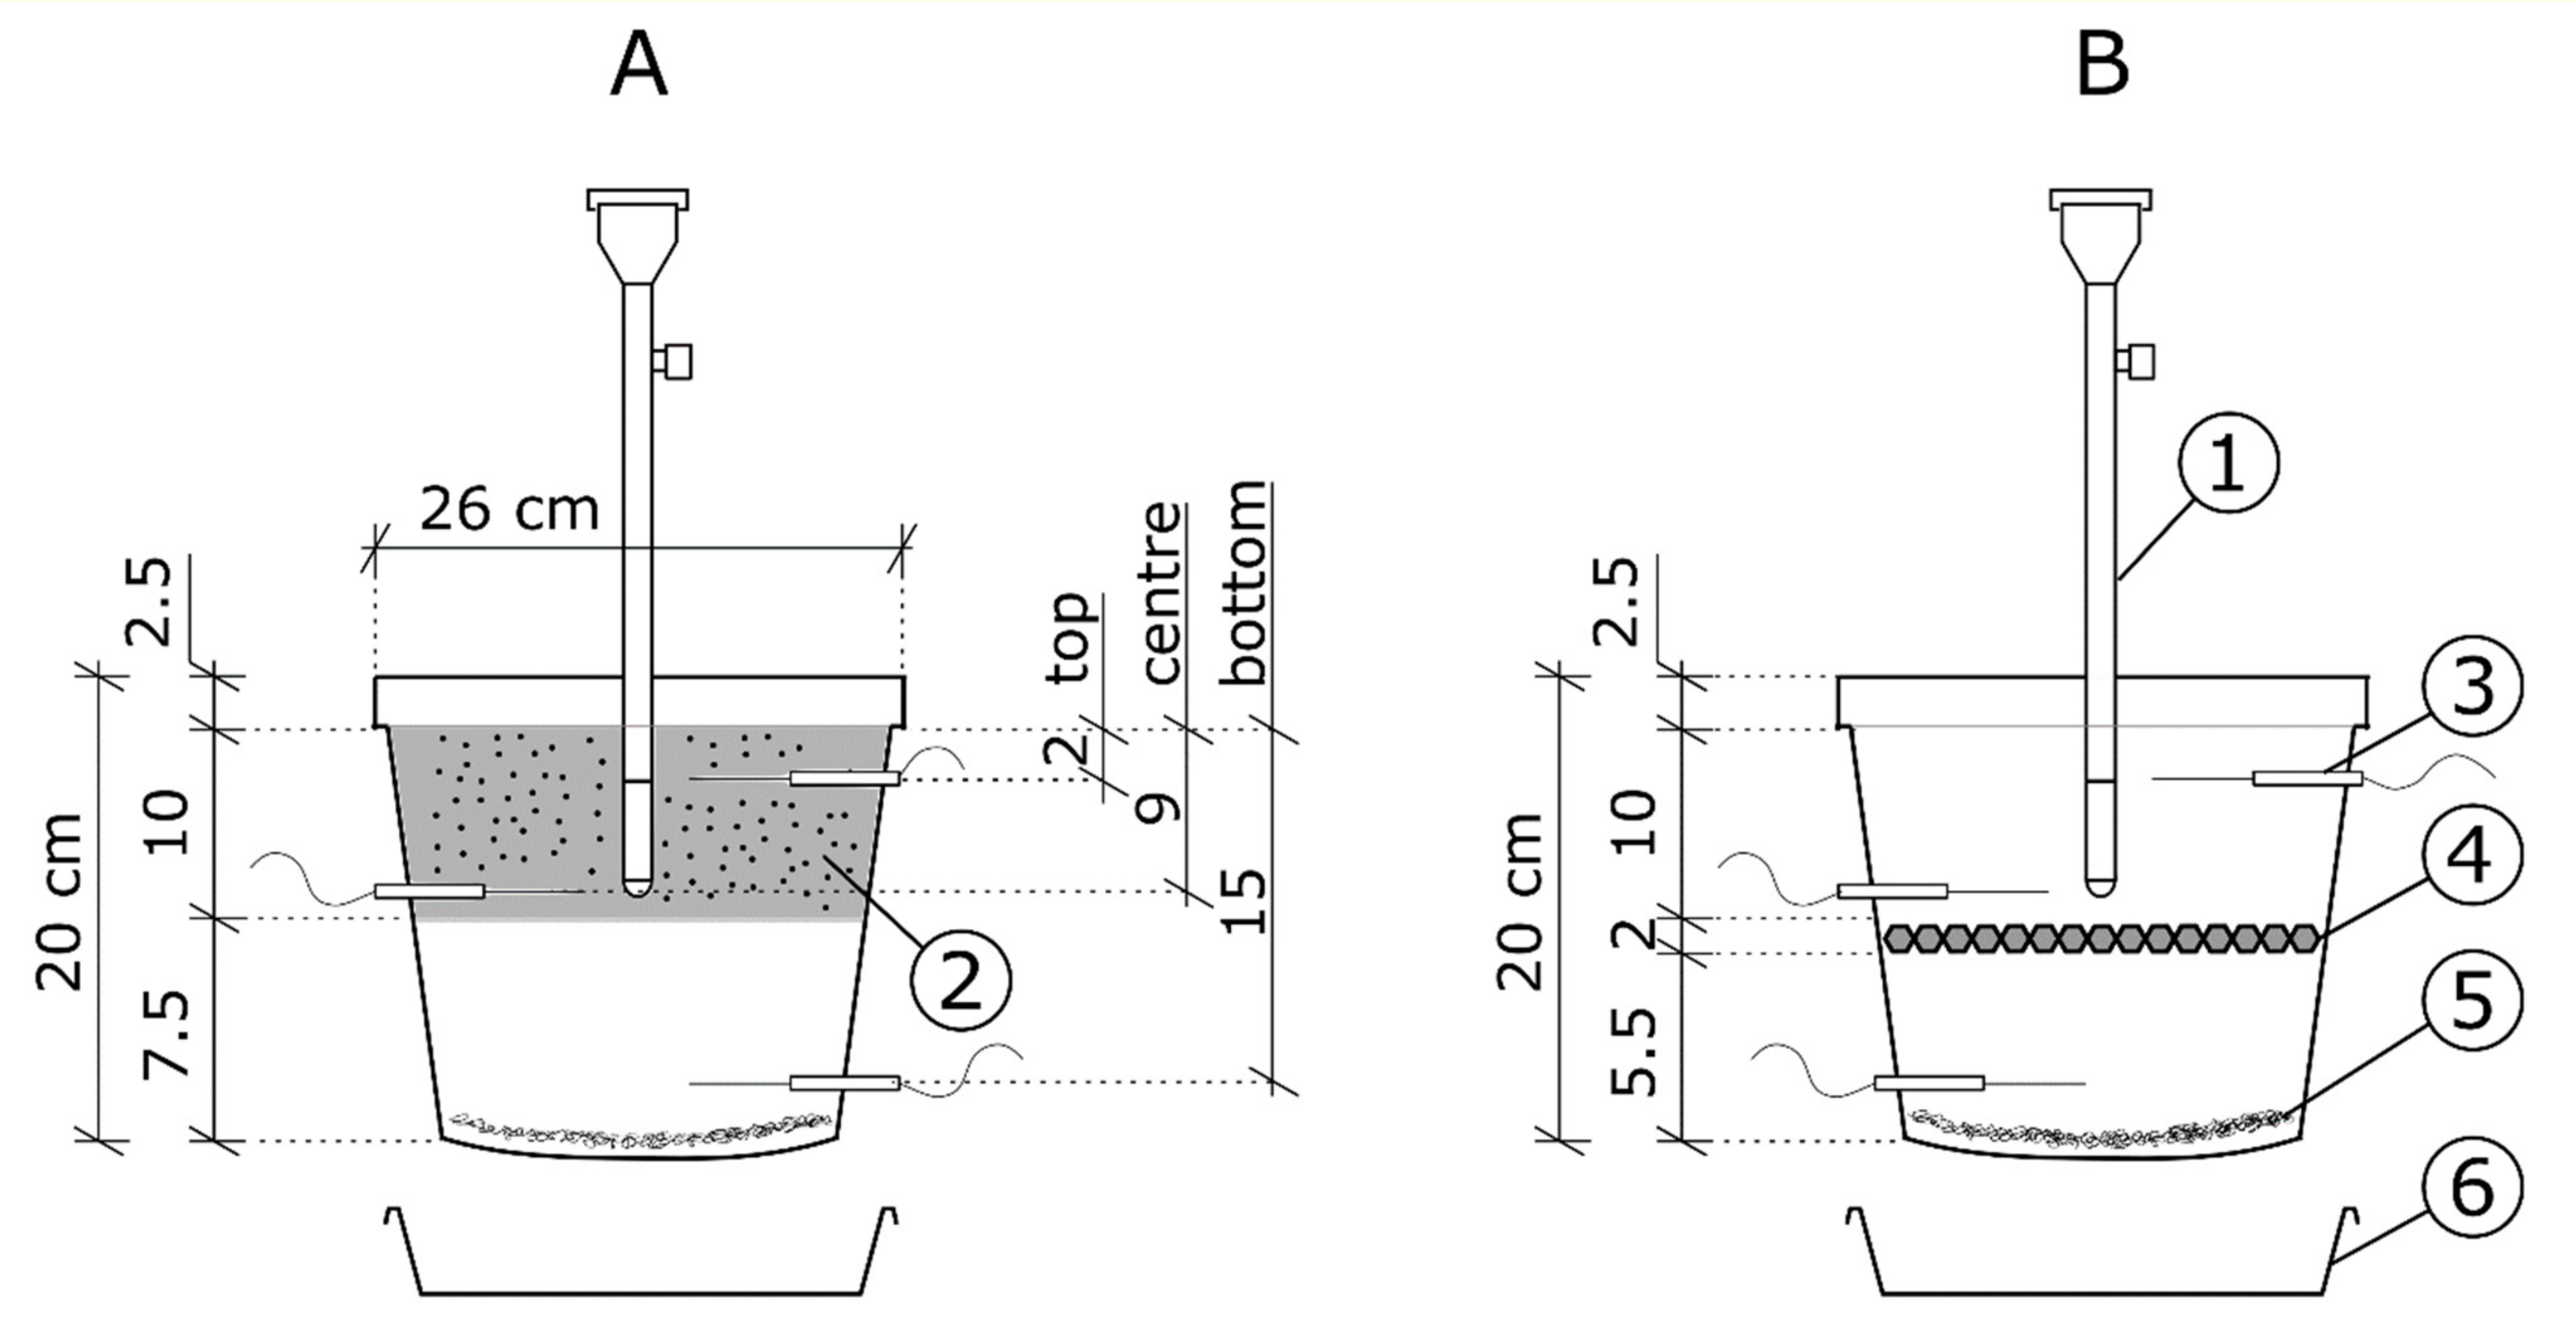
2.1. Preparation of Pot Samples
2.2. Testing Procedure in a Pot Experiment
2.3. Equipment
2.4. Materials Used
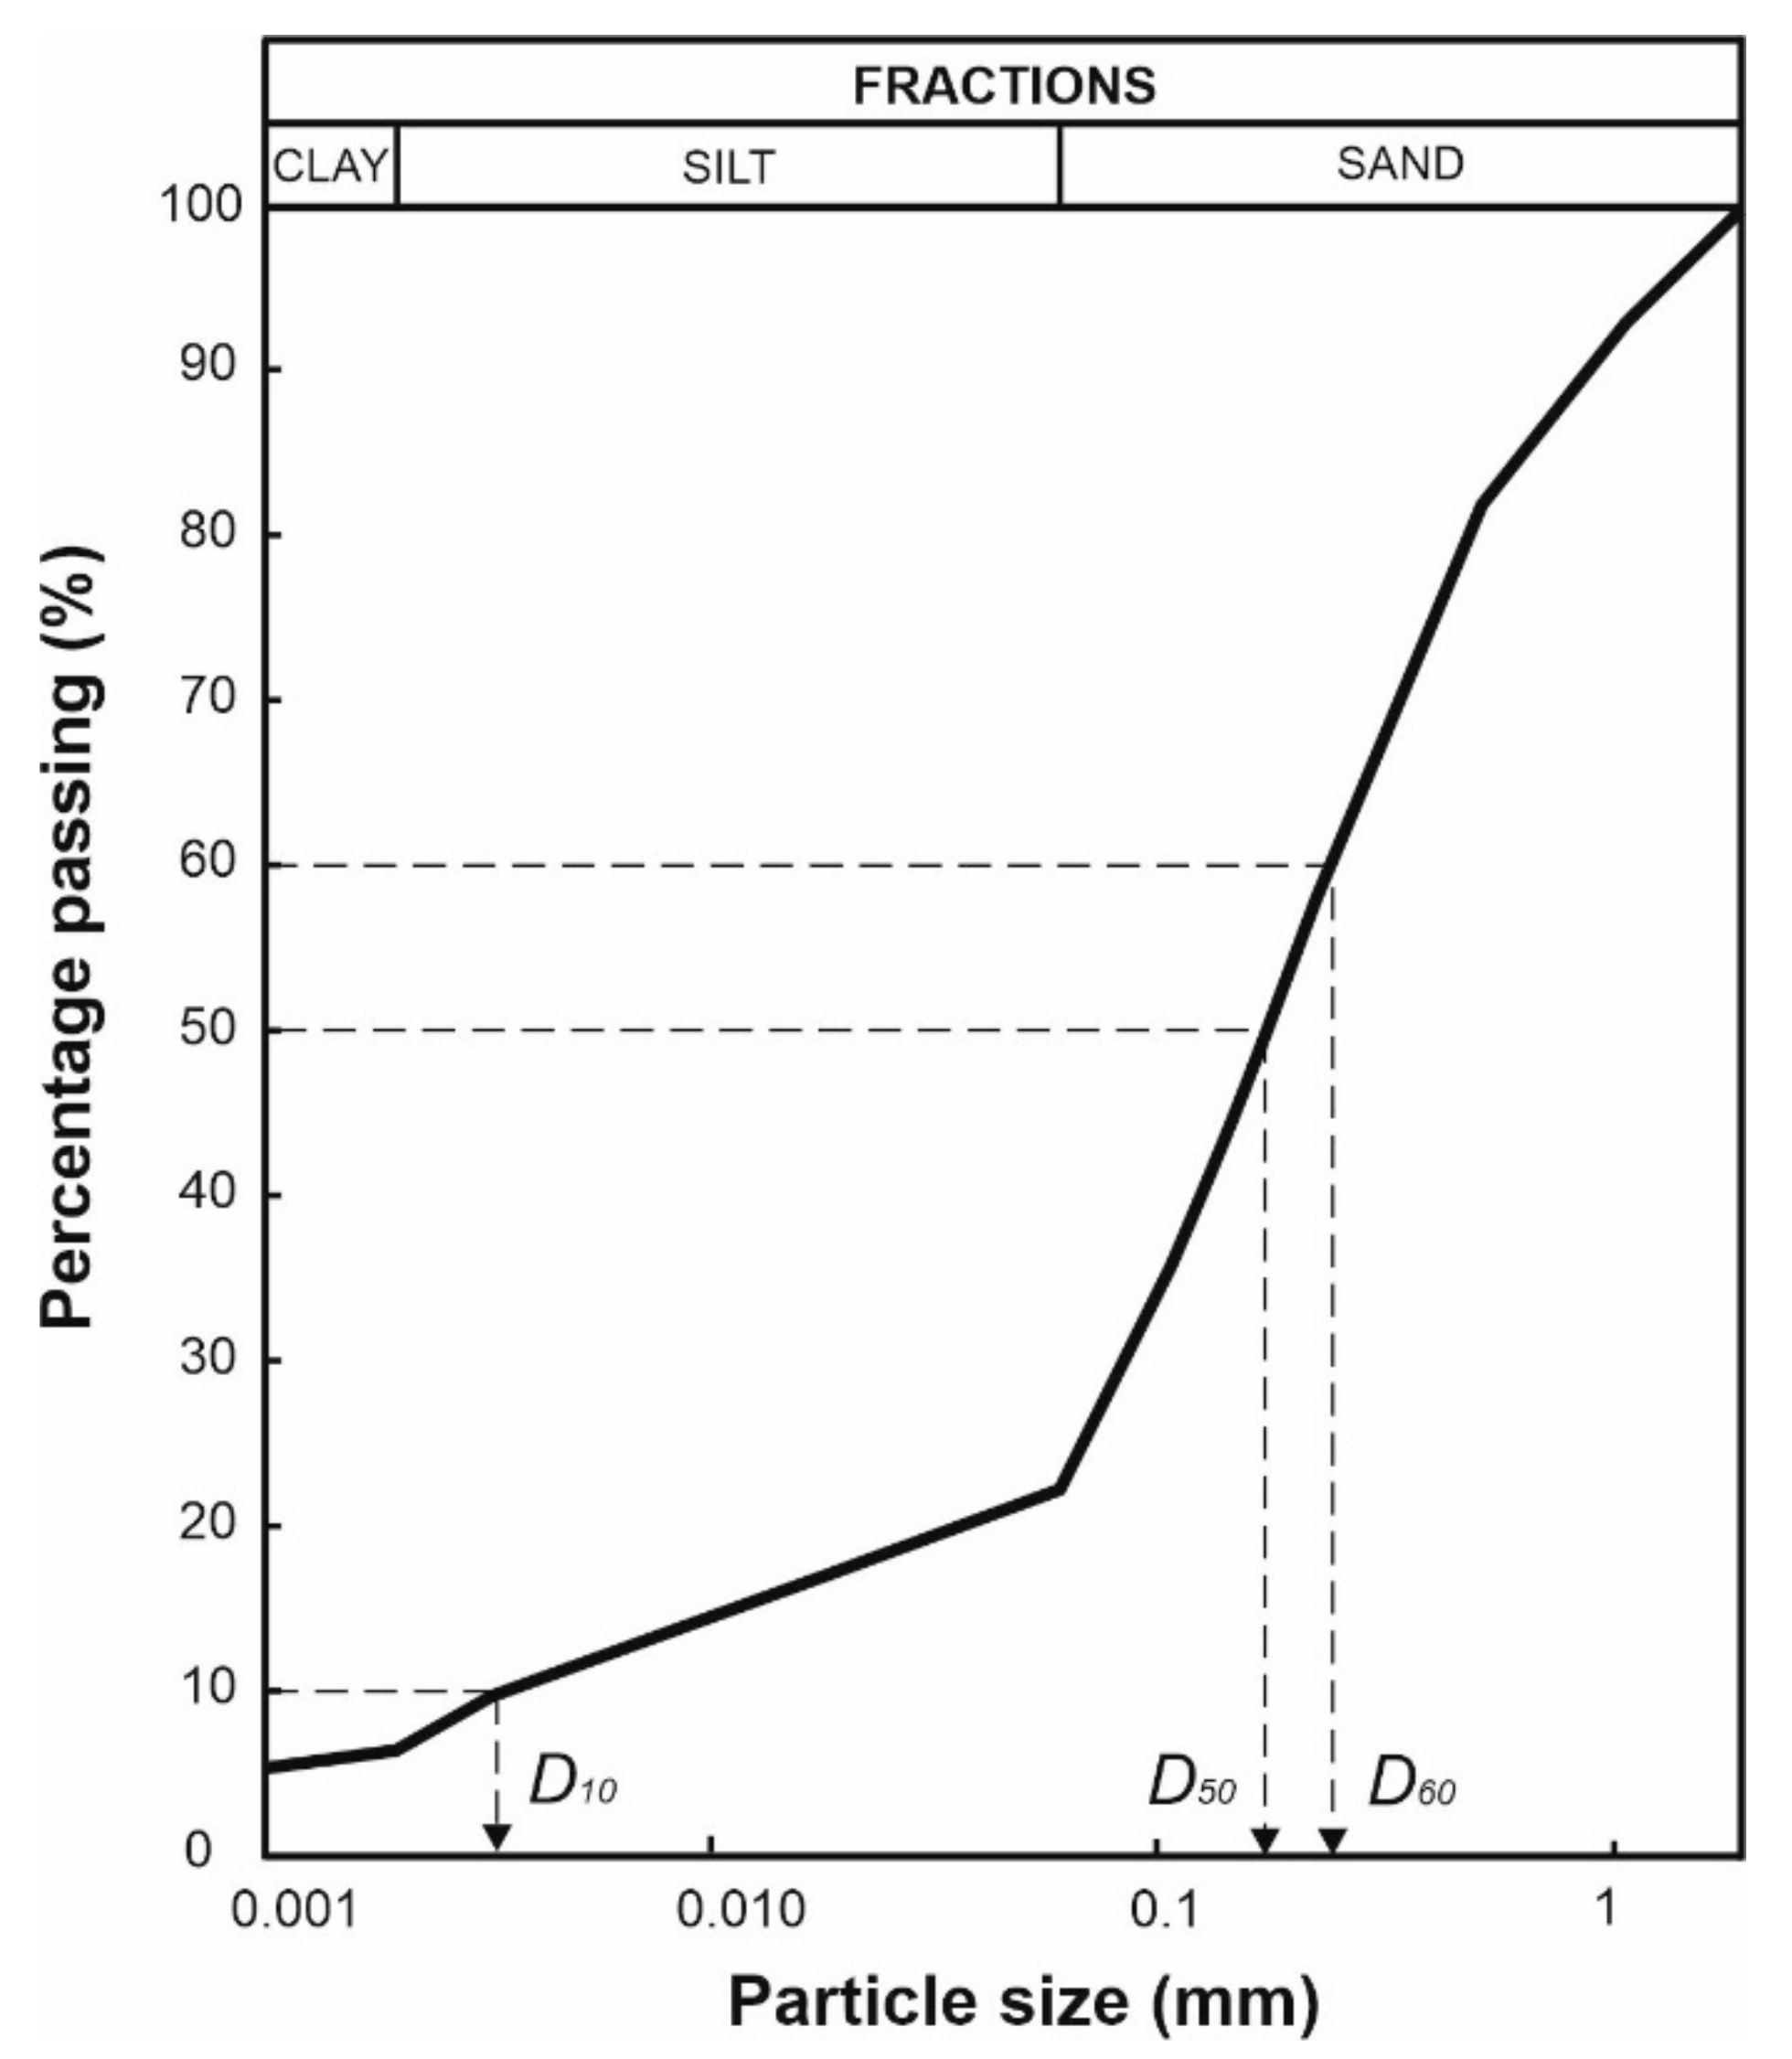
2.4.1. Soil
2.4.2. Attapulgite and Granular Bentonite
2.4.3. Nonwoven Geotextile
2.4.4. Water Absorbing Geocomposite (WAG)
2.4.5. Biodegradable Water Absorbing Geocomposite (bioWAG)
2.4.6. Biochar
2.4.7. Superabsorbent Polymer (SAP)
2.5. Water Absorption of Used Materials
2.6. Data Analysis
3. Results
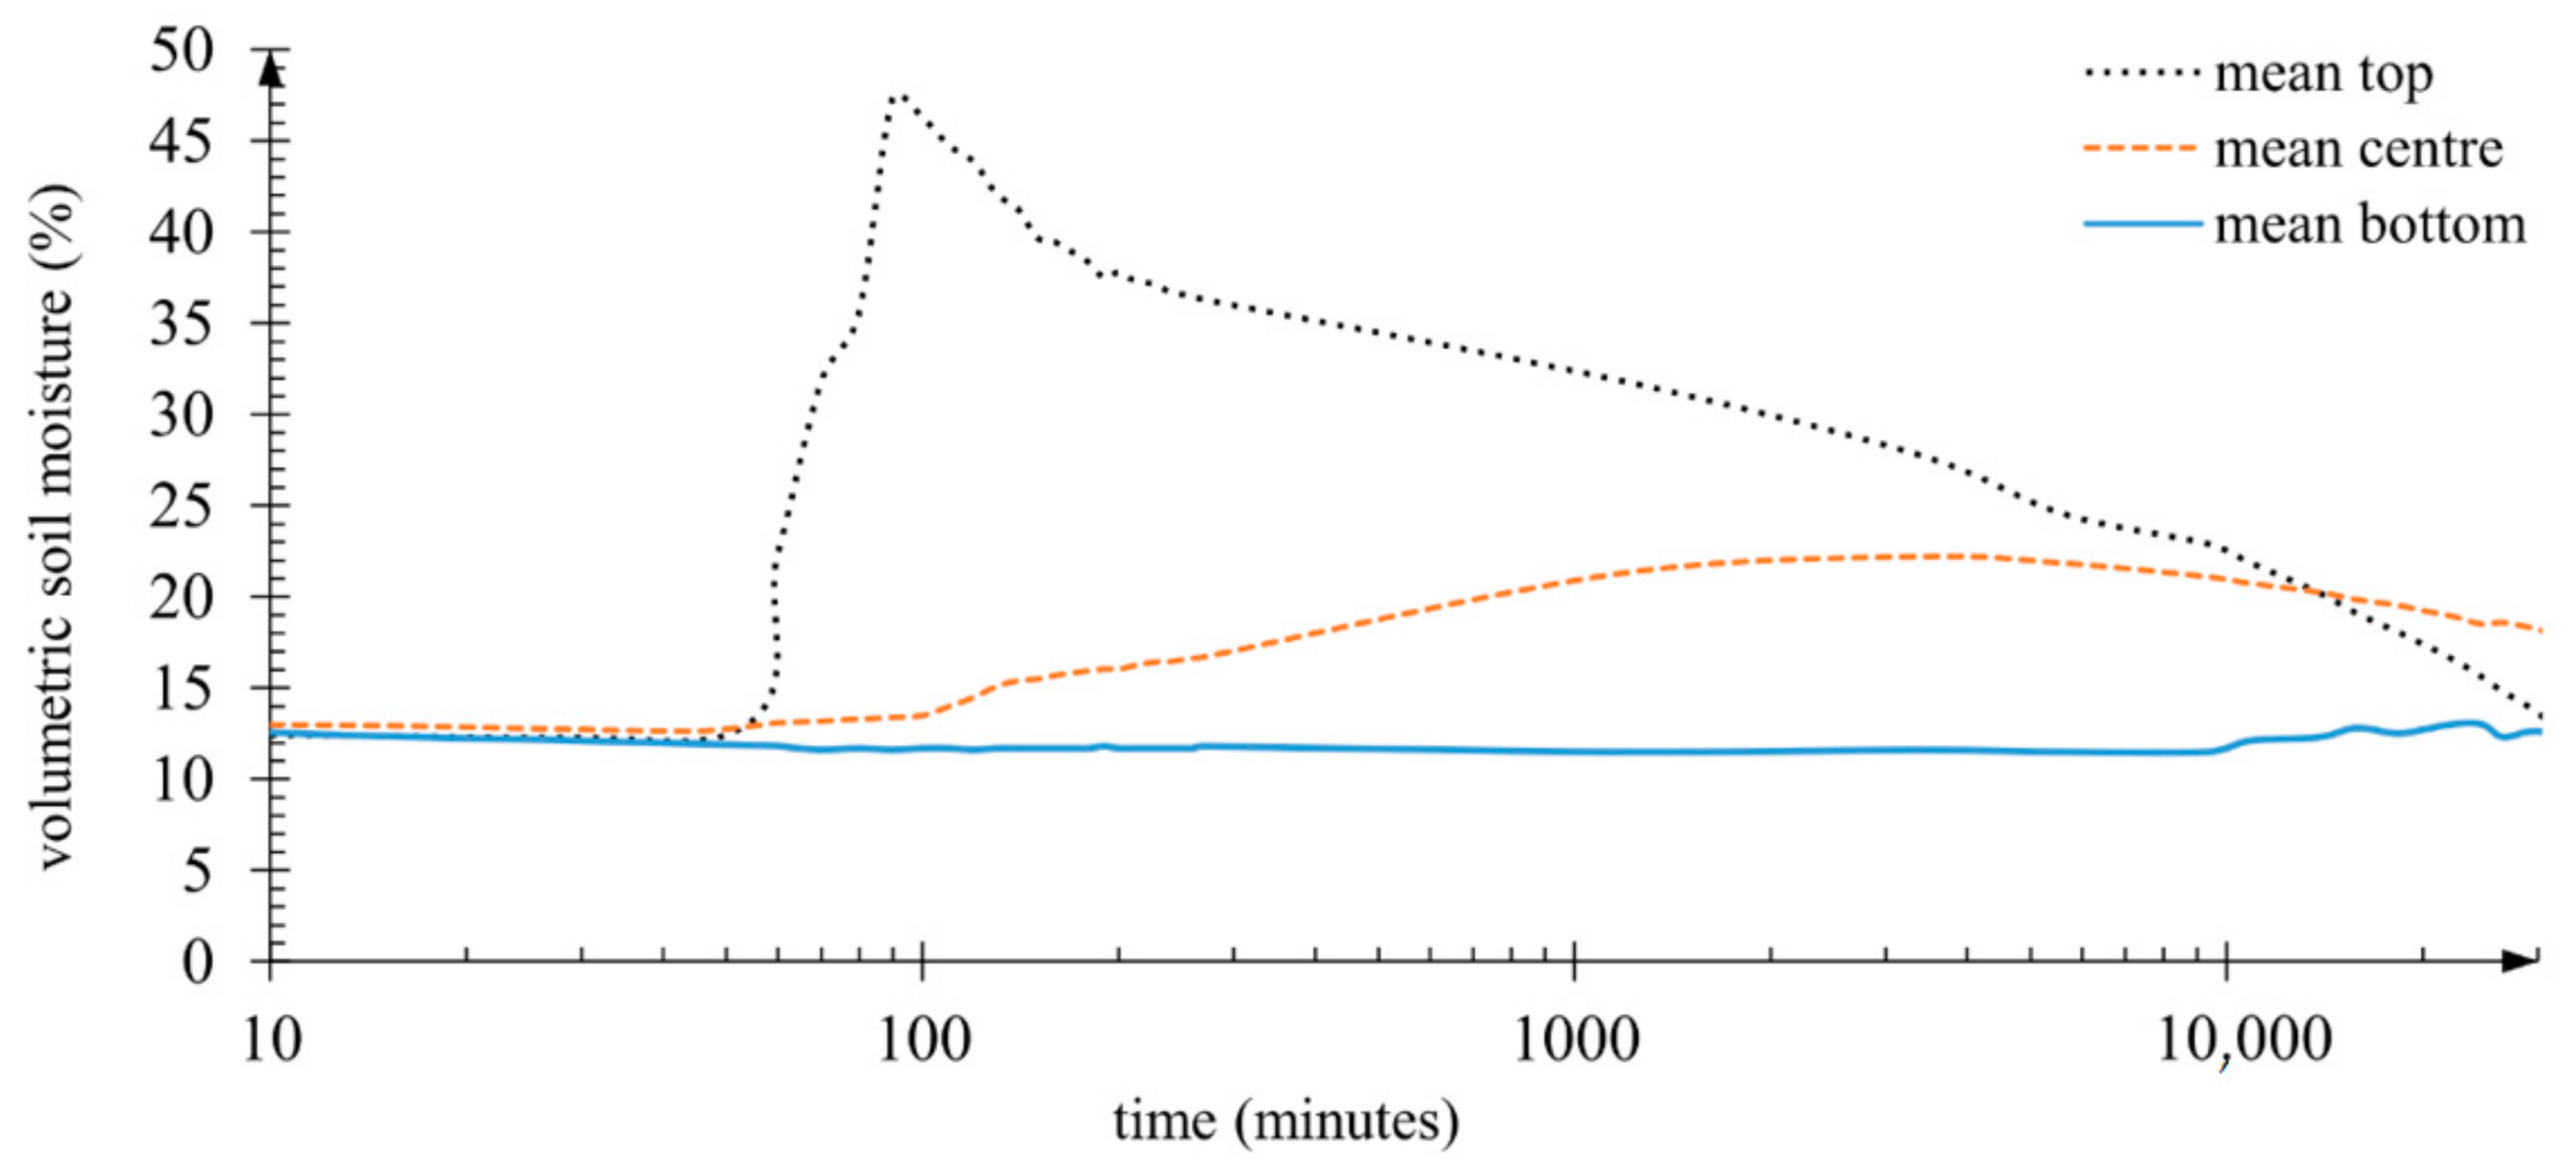
3.1. Soil Moisture in Pot Samples
3.2. Soil Matric Potential in Pot Samples
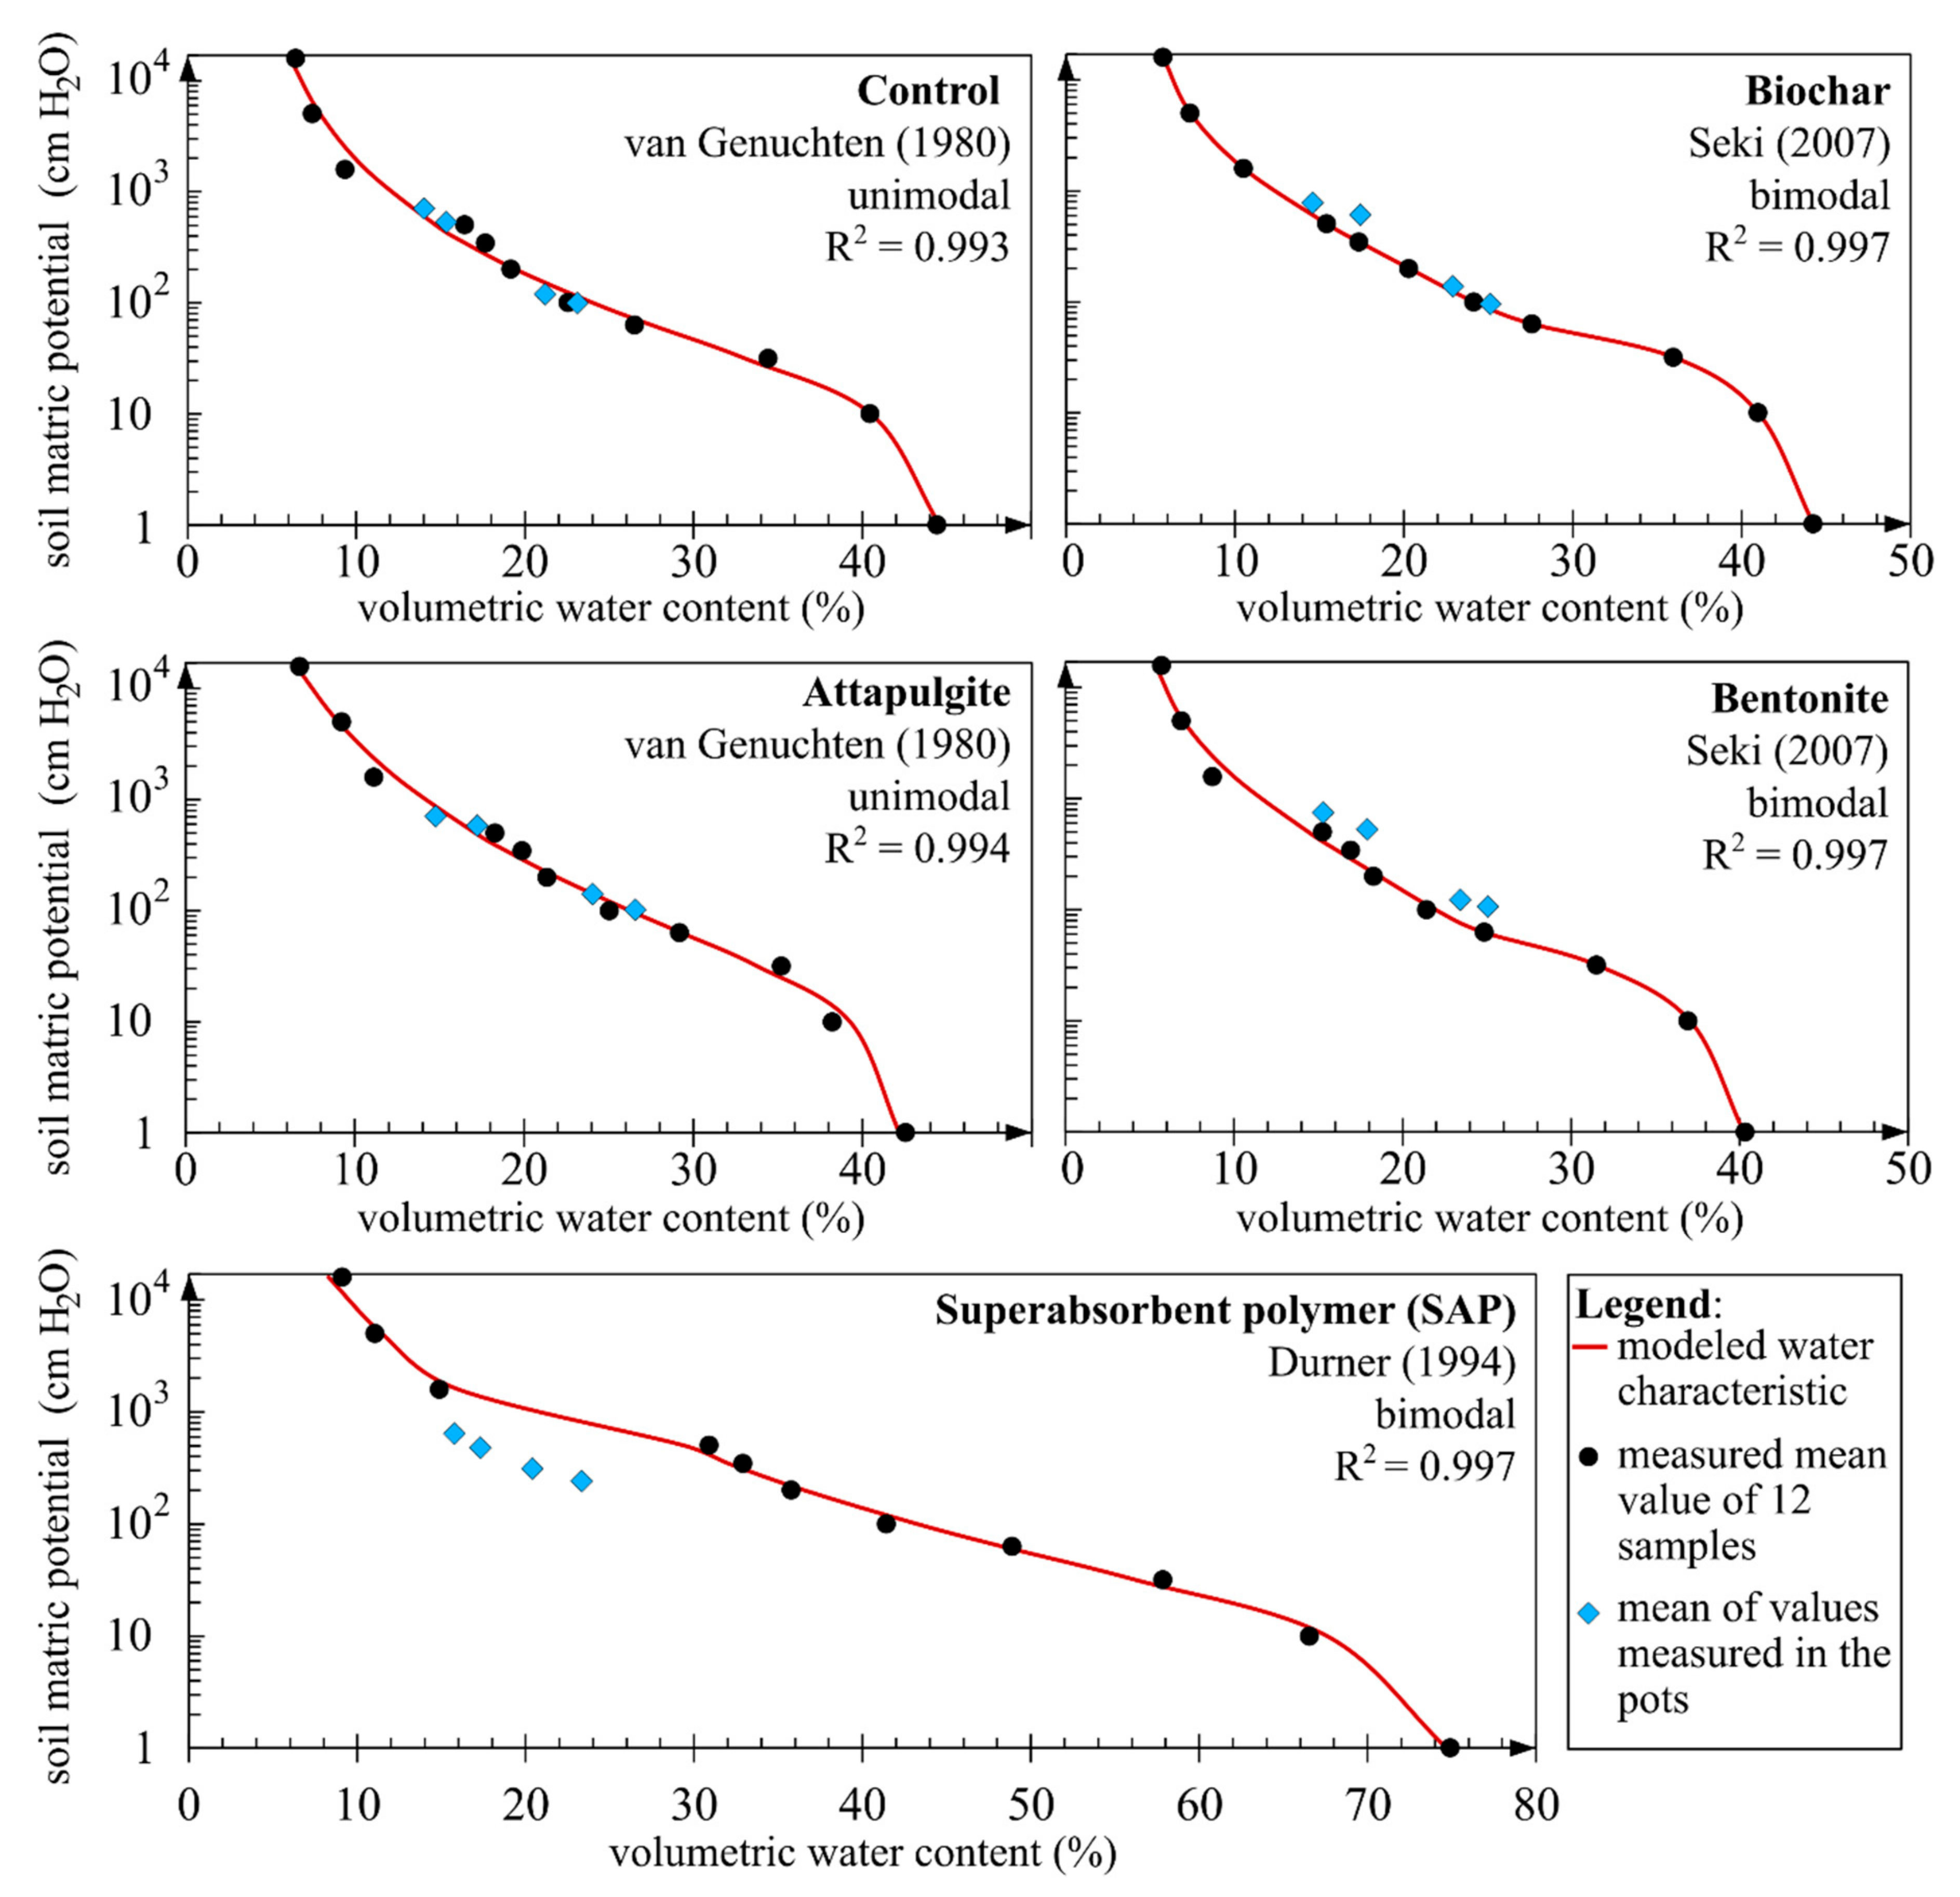
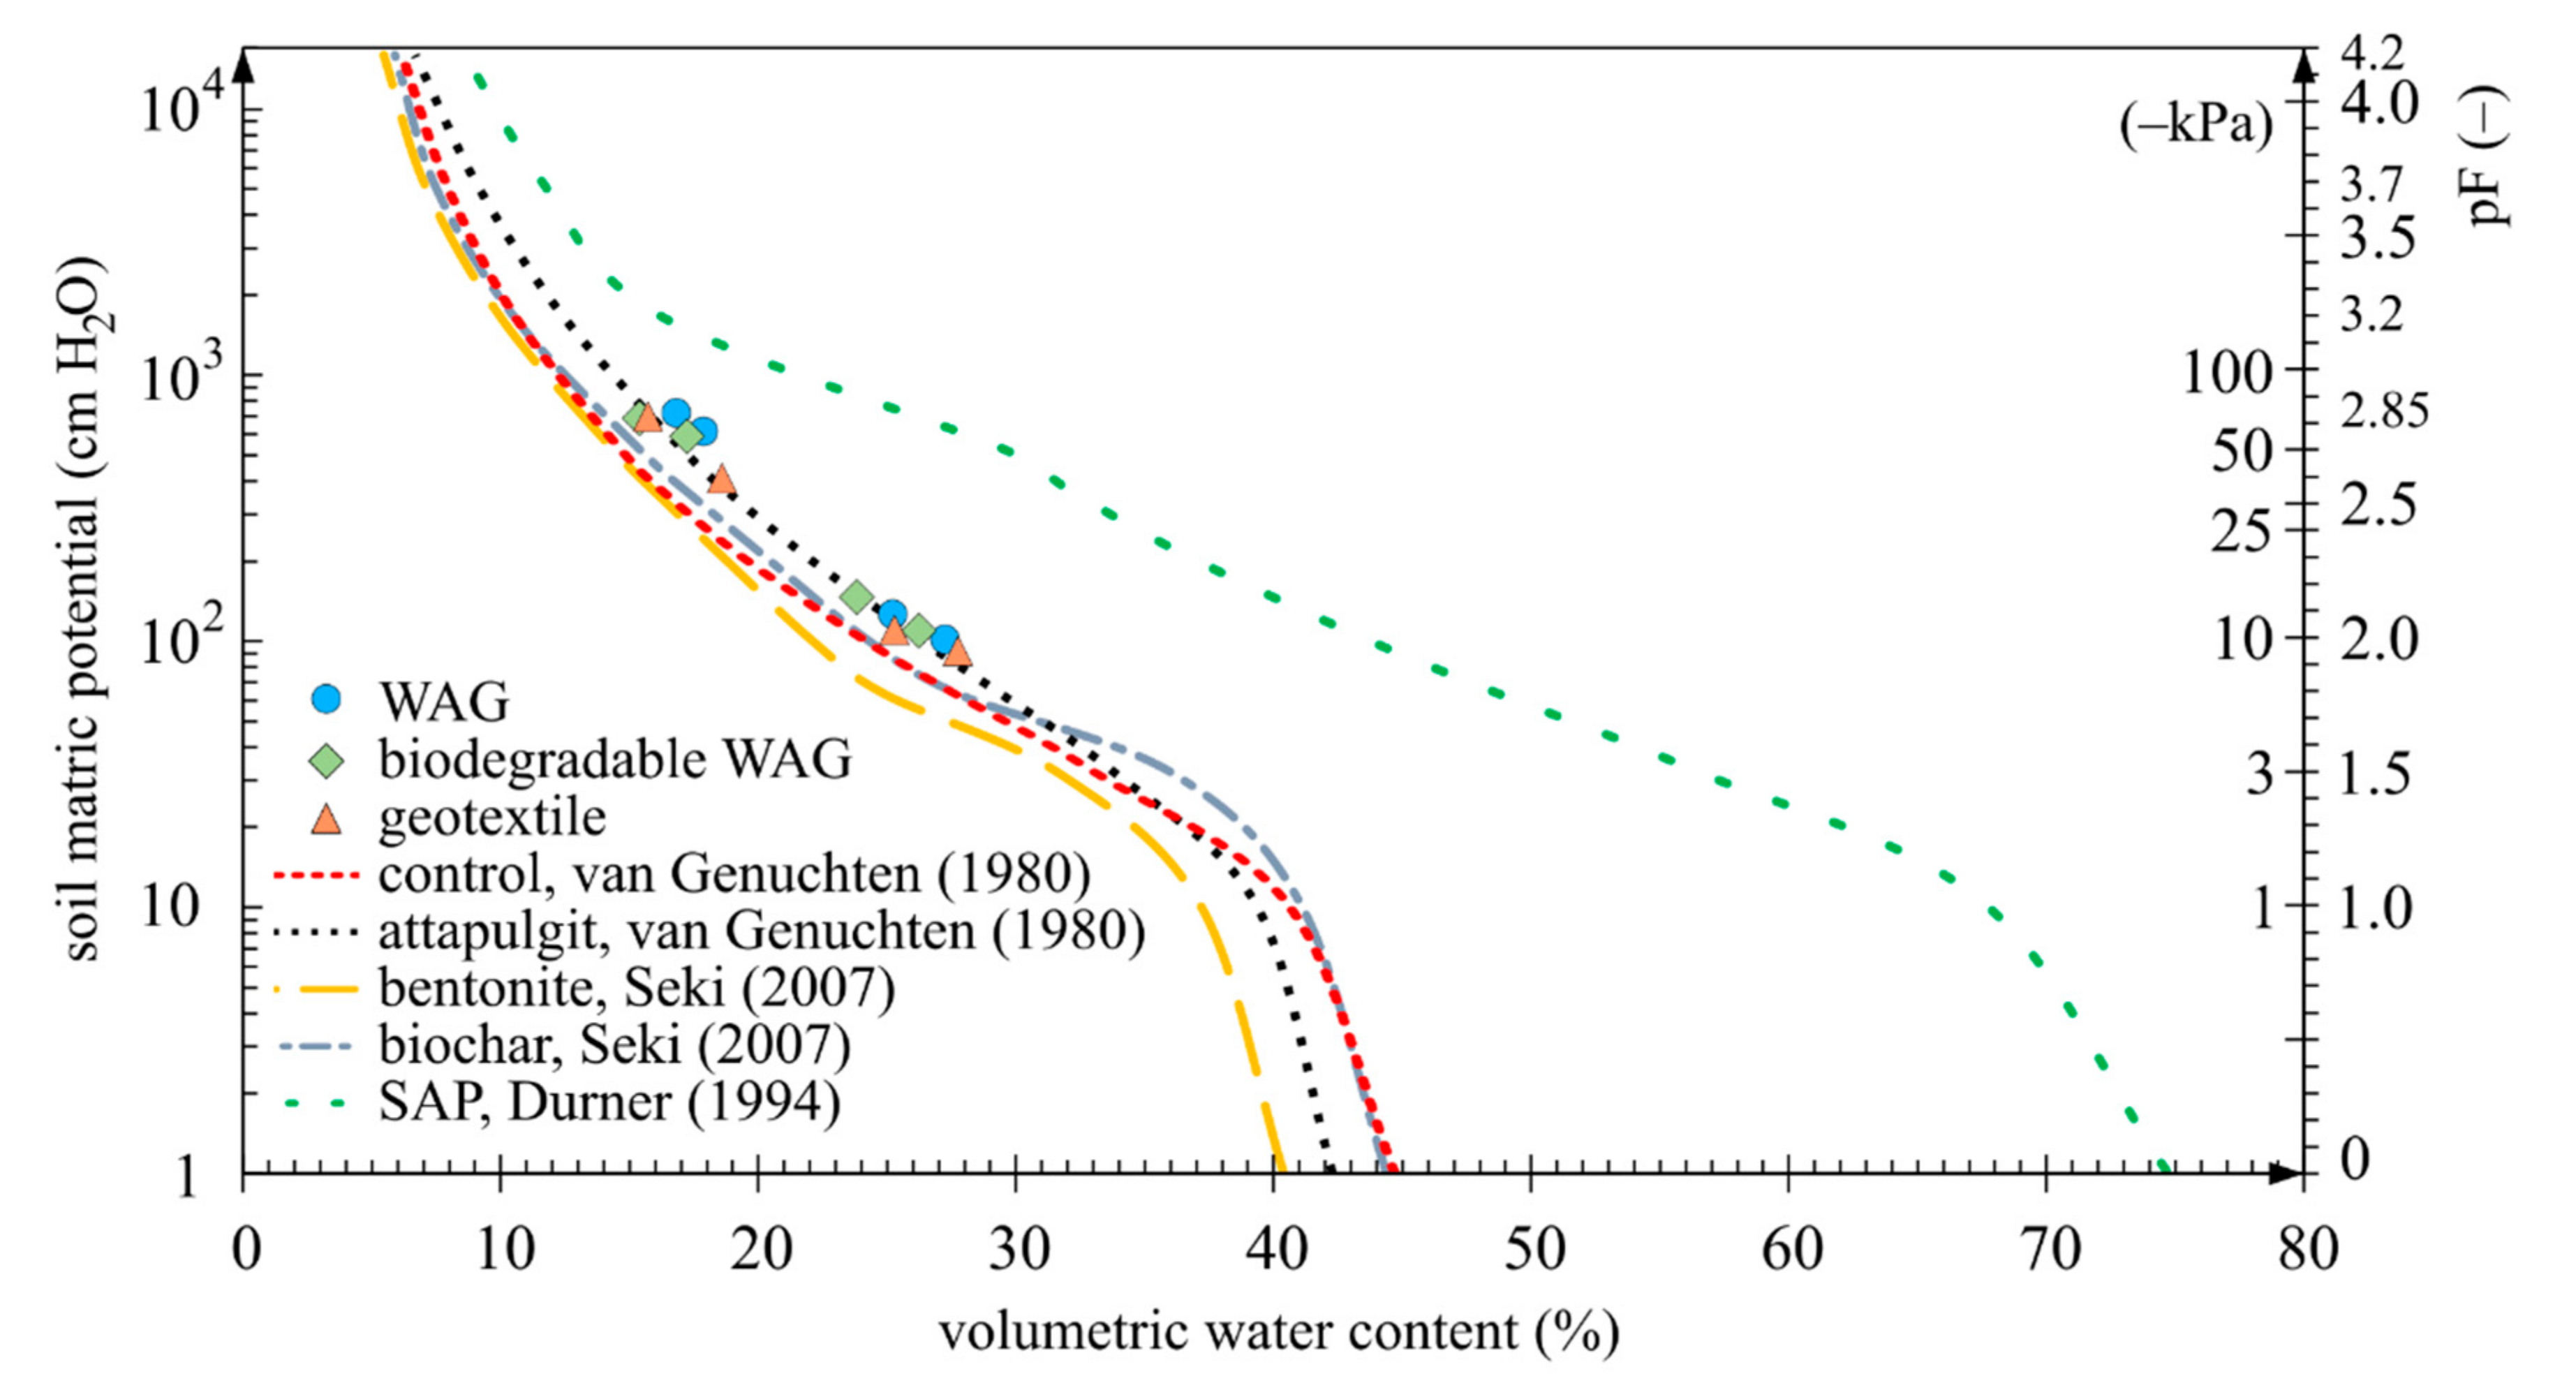
3.3. Soil Water Characteristic
4. Discussion
4.1. Superabsorbent Polymer (SAP)
4.2. Biochar, Attapulgite and Bentonite
4.3. Nonwoven Geotextile, WAG, bioWAG
4.4. Limitations of the Study
5. Conclusions
6. Patents
Supplementary Materials
Author Contributions
Funding
Institutional Review Board Statement
Informed Consent Statement
Data Availability Statement
Conflicts of Interest
References
- Mohawesh, O.; Durner, W. Effects of Bentonite, Hydrogel and Biochar Amendments on Soil Hydraulic Properties from Saturation to Oven Dryness. Pedosphere 2019, 29, 598–607. [Google Scholar] [CrossRef]
- Murray, H.H. Traditional and new applications for kaolin, smectite, and palygorskite: A general overview. Appl. Clay Sci. 2000, 17, 207–221. [Google Scholar] [CrossRef]
- Keiblinger, K.M.; Kral, R.M. Sustainable intensification of agricultural production: A review of four soil amendments. Bodenkultur 2018, 69, 141–153. [Google Scholar] [CrossRef] [Green Version]
- Seddik, W.M.A.; Osman, M.A.; Kenawy, M.H.M. Physico-Chemical Behavior of Natural Minerals along with Synthetic Soil Conditioners on Nutritional Status and Yield Productivity. J. Soil Sci. Agric. Eng. 2019, 10, 397–403. [Google Scholar] [CrossRef]
- Orzeszyna, H.; Garlikowski, D.; Pawłowski, A. Using of geocomposite with superabsorbent synthetic polymers as water retention element in vegetative layers. Int. Agrophys. 2006, 20, 201–206. [Google Scholar]
- Lejcuś, K.; Dąbrowska, J.; Garlikowski, D.; Śpitalniak, M. The application of water-absorbing geocomposites to support plant growth on slopes. Geosynth. Int. 2015, 22, 452–456. [Google Scholar] [CrossRef]
- Pimentel, D.; Berger, B.; Filiberto, D.; Newton, M.; Wolfe, B.; Karabinakis, E.; Clark, S.; Poon, E.; Abbett, E.; Nandagopal, S. Water Resources: Agricultural and Environmental Issues. Bioscience 2004, 54, 909–918. [Google Scholar] [CrossRef] [Green Version]
- FAO. Water for Sustainable Food and Agriculture Water for Sustainable Food and Agriculture; FAO: Rome, Italy, 2017. [Google Scholar]
- Hellerstein, D.; Vilorio, D.; Ribaudo, M. Agricultural Resources and Environmental Indicators, 2019; EIB-208; USDA: Washington, DC, USA, 2019. [Google Scholar]
- Davies, W.J.; Zhang, J.; Yang, J.; Dodd, I.C. Novel crop science to improve yield and resource use efficiency in water-limited agriculture. J. Agric. Sci. 2011, 149, 123–131. [Google Scholar] [CrossRef]
- Grillakis, M.G. Increase in severe and extreme soil moisture droughts for Europe under climate change. Sci. Total Environ. 2019, 660, 1245–1255. [Google Scholar] [CrossRef]
- Bodner, G.; Nakhforoosh, A.; Kaul, H.P. Management of crop water under drought: A review. Agron. Sustain. Dev. 2015, 35, 401–442. [Google Scholar] [CrossRef]
- Sojka, M.; Kozłowski, M.; Kęsicka, B.; Wróżyński, R.; Stasik, R.; Napierała, M.; Jaskuła, J.; Liberacki, D. The Effect of Climate Change on Controlled Drainage Effectiveness in the Context of Groundwater Dynamics, Surface, and Drainage Outflows. Central-Western Poland Case Study. Agronomy 2020, 10, 625. [Google Scholar] [CrossRef]
- Godfray, H.C.J.; Beddington, J.R.; Crute, I.R.; Haddad, L.; Lawrence, D.; Muir, J.F.; Pretty, J.; Robinson, S.; Thomas, S.M.; Toulmin, C. Food security: The challenge of feeding 9 billion people. Science 2010, 327, 812–818. [Google Scholar] [CrossRef] [Green Version]
- Hanjra, M.A.; Qureshi, M.E. Global water crisis and future food security in an era of climate change. Food Policy 2010, 35, 365–377. [Google Scholar] [CrossRef]
- Shukla, P.R.; Skea, J.; Calvo Buendia, E.; Masson-Delmotte, V.; Pörtner, H.-O.; Roberts, D.C.; Zhai, P.; Slade, R.; Connors, S.; van Diemen, R.; et al. IPCC 2019: Climate Change and Land: An IPCC Special Report on Climate Change, Desertification, Land Degradation, Sustainable Land Management, Food Security, and Greenhouse Gas Fluxes in Terrestrial Ecosystems; IPCC: Geneva, Switzerland, 2019. [Google Scholar]
- Woolf, D.; Amonette, J.E.; Street-Perrott, F.A.; Lehmann, J.; Joseph, S. Sustainable biochar to mitigate global climate change. Nat. Commun. 2010, 1, 56. [Google Scholar] [CrossRef] [Green Version]
- Zhang, C.; Lu, N. Soil Sorptive Potential: Its Determination and Predicting Soil Water Density. J. Geotech. Geoenviron. Eng. 2020, 146, 04019118. [Google Scholar] [CrossRef]
- Dontsova, K.M.; Norton, L.D.; Johnston, C.T.; Bigham, J.M. Influence of Exchangeable Cations on Water Adsorption by Soil Clays. Soil Sci. Soc. Am. J. 2004, 68, 1218–1227. [Google Scholar] [CrossRef] [Green Version]
- Lu, N.; Likos, W.J. Unsaturated Soil Mechanics; John Wiley & Sons, Inc.: Hoboken, NJ, USA, 2004; ISBN 978-0-471-44731-3. [Google Scholar]
- Sposito, G. The Chemistry of Soils, 2nd ed.; Oxford University Press: Oxford, UK, 2008; ISBN 9780195313697. [Google Scholar]
- Li, X.; Chang, S.X.; Salifu, K.F. Soil texture and layering effects on water and salt dynamics in the presence of a water table: A review. Environ. Rev. 2013, 22, 41–50. [Google Scholar] [CrossRef]
- Lago, M.; Araujo, M. Capillary Rise in Porous Media. J. Colloid Interface Sci. 2001, 234, 35–43. [Google Scholar] [CrossRef]
- Woodruff, W.F.; Revil, A. CEC-normalized clay-water sorption isotherm. Water Resour. Res. 2011, 47. [Google Scholar] [CrossRef]
- McKissock, I.; Walker, E.L.; Gilkes, R.J.; Carter, D.J. The influence of clay type on reduction of water repellency by applied clays: A review of some West Australian work. J. Hydrol. 2000, 231–232, 323–332. [Google Scholar] [CrossRef]
- McKissock, I.; Gilkes, R.J.; Walker, E.L. The reduction of water repellency by added clay is influenced by clay and soil properties. Appl. Clay Sci. 2002, 20, 225–241. [Google Scholar] [CrossRef]
- Álvarez, A.; Santarén, J.; Esteban-Cubillo, A.; Aparicio, P. Current industrial applications of palygorskite and sepiolite. In Developments in Clay Science; Elsevier B.V.: Amsterdam, The Netherlands, 2011; Volume 3, pp. 281–298. ISBN 9780444536075. [Google Scholar]
- Li, S.; Harris, S.; Anandhi, A.; Chen, G. Predicting biochar properties and functions based on feedstock and pyrolysis temperature: A review and data syntheses. J. Clean. Prod. 2019, 215, 890–902. [Google Scholar] [CrossRef]
- Manjaiah, K.M.; Mukhopadhyay, R.; Paul, R.; Datta, S.C.; Kumararaja, P.; Sarkar, B. Clay minerals and zeolites for environmentally sustainable agriculture. In Modified Clay and Zeolite Nanocomposite Materials: Environmental and Pharmaceutical Applications; Elsevier: Amsterdam, The Netherlands, 2019; pp. 309–329. [Google Scholar]
- Brassard, P.; Godbout, S.; Lévesque, V.; Palacios, J.H.; Raghavan, V.; Ahmed, A.; Hogue, R.; Jeanne, T.; Verma, M. Biochar for soil amendment. In Char and Carbon Materials Derived from Biomass: Production, Characterization and Applications; Elsevier: Amsterdam, The Netherlands, 2019; pp. 109–146. [Google Scholar]
- Das, D.K.; Dakshinamurti, C. Bentonite as a Soil Conditioner. In Soil Conditioners; Gardner, W., Moldenhauer, W., Eds.; John Wiley & Sons, Ltd.: Hoboken, NJ, USA, 1975; pp. 65–76. ISBN 9780891187646. [Google Scholar]
- Alghamdi, A.G.; Aly, A.A.; Al-Omran, A.M.; Alkhasha, A. Impact of biochar, bentonite, and compost on physical and chemical characteristics of a sandy soil. Arab. J. Geosci. 2018, 11, 670. [Google Scholar] [CrossRef]
- Mi, J.; Gregorich, E.G.; Xu, S.; McLaughlin, N.B.; Ma, B.; Liu, J. Effect of bentonite amendment on soil hydraulic parameters and millet crop performance in a semi-arid region. Field Crop. Res. 2017, 212, 107–114. [Google Scholar] [CrossRef]
- Galan, E. Properties and applications of palygorskite-sepiolite clays. Clay Miner. 1996, 31, 443–453. [Google Scholar] [CrossRef]
- Owen, J.S.; Warren, S.L.; Bilderback, T.E.; Albano, J.; Cassel, K.D. Physical properties of pine bark substrate amended with industrial mineral aggregate. Acta Hortic. 2008, 779, 131–138. [Google Scholar] [CrossRef]
- Koo, R.C.J. Effects of Soil Amendments on Soil Moisture and Growth of Young Orange Trees; Florida State Horticultural Society: Alexandria, VA, USA, 1967. [Google Scholar]
- Wystalska, K.; Kwarciak-Kozlowska, A. The effect of biodegradable waste pyrolysis temperatures on selected biochar properties. Materials 2021, 14, 1644. [Google Scholar] [CrossRef]
- Fischer, B.M.C.; Manzoni, S.; Morillas, L.; Garcia, M.; Johnson, M.S.; Lyon, S.W. Improving agricultural water use efficiency with biochar—A synthesis of biochar effects on water storage and fluxes across scales. Sci. Total Environ. 2019, 657, 853–862. [Google Scholar] [CrossRef]
- Suliman, W.; Harsh, J.B.; Abu-Lail, N.I.; Fortuna, A.M.; Dallmeyer, I.; Garcia-Pérez, M. The role of biochar porosity and surface functionality in augmenting hydrologic properties of a sandy soil. Sci. Total Environ. 2017, 574, 139–147. [Google Scholar] [CrossRef]
- Paetsch, L.; Mueller, C.W.; Kögel-Knabner, I.; Von Lützow, M.; Girardin, C.; Rumpel, C. Effect of in-situ aged and fresh biochar on soil hydraulic conditions and microbial C use under drought conditions. Sci. Rep. 2018, 8, 6852. [Google Scholar] [CrossRef] [Green Version]
- Herath, H.M.S.K.; Camps-Arbestain, M.; Hedley, M. Effect of biochar on soil physical properties in two contrasting soils: An Alfisol and an Andisol. Geoderma 2013, 209–210, 188–197. [Google Scholar] [CrossRef]
- Soinne, H.; Hovi, J.; Tammeorg, P.; Turtola, E. Effect of biochar on phosphorus sorption and clay soil aggregate stability. Geoderma 2014, 219–220, 162–167. [Google Scholar] [CrossRef]
- Burrell, L.D.; Zehetner, F.; Rampazzo, N.; Wimmer, B.; Soja, G. Long-term effects of biochar on soil physical properties. Geoderma 2016, 282, 96–102. [Google Scholar] [CrossRef]
- Zhang, J.; Chen, Q.; You, C. Biochar Effect on Water Evaporation and Hydraulic Conductivity in Sandy Soil. Pedosphere 2016, 26, 265–272. [Google Scholar] [CrossRef]
- Trifunovic, B.; Gonzales, H.B.; Ravi, S.; Sharratt, B.S.; Mohanty, S.K. Dynamic effects of biochar concentration and particle size on hydraulic properties of sand. Land Degrad. Dev. 2018, 29, 884–893. [Google Scholar] [CrossRef]
- Liang, J.; Li, Y.; Si, B.; Wang, Y.; Chen, X.; Wang, X.; Chen, H.; Wang, H.; Zhang, F.; Bai, Y.; et al. Optimizing biochar application to improve soil physical and hydraulic properties in saline-alkali soils. Sci. Total Environ. 2021, 771, 144802. [Google Scholar] [CrossRef]
- Ni, J.J.; Bordoloi, S.; Shao, W.; Garg, A.; Xu, G.; Sarmah, A.K. Two-year evaluation of hydraulic properties of biochar-amended vegetated soil for application in landfill cover system. Sci. Total Environ. 2020, 712, 136486. [Google Scholar] [CrossRef]
- Jačka, L.; Trakal, L.; Ouředníček, P.; Pohořelý, M.; Šípek, V. Biochar presence in soil significantly decreased saturated hydraulic conductivity due to swelling. Soil Tillage Res. 2018, 184, 181–185. [Google Scholar] [CrossRef]
- Ziȩba, Z. Influence of soil particle shape on saturated hydraulic conductivity. J. Hydrol. Hydromech. 2017, 65, 80–87. [Google Scholar] [CrossRef] [Green Version]
- Aller, D.; Rathke, S.; Laird, D.; Cruse, R.; Hatfield, J. Impacts of fresh and aged biochars on plant available water and water use efficiency. Geoderma 2017, 307, 114–121. [Google Scholar] [CrossRef]
- Verheijen, F.G.A.; Zhuravel, A.; Silva, F.C.; Amaro, A.; Ben-Hur, M.; Keizer, J.J. The influence of biochar particle size and concentration on bulk density and maximum water holding capacity of sandy vs sandy loam soil in a column experiment. Geoderma 2019, 347, 194–202. [Google Scholar] [CrossRef]
- Hyväluoma, J.; Kulju, S.; Hannula, M.; Wikberg, H.; Källi, A.; Rasa, K. Quantitative characterization of pore structure of several biochars with 3D imaging. Environ. Sci. Pollut. Res. 2018, 25, 25648–25658. [Google Scholar] [CrossRef] [Green Version]
- Villagra-Mendoza, K.; Horn, R. Effect of biochar addition on hydraulic functions of two textural soils. Geoderma 2018, 326, 88–95. [Google Scholar] [CrossRef]
- Spokas, K.A.; Cantrell, K.B.; Novak, J.M.; Archer, D.W.; Ippolito, J.A.; Collins, H.P.; Boateng, A.A.; Lima, I.M.; Lamb, M.C.; McAloon, A.J.; et al. Biochar: A Synthesis of Its Agronomic Impact beyond Carbon Sequestration. J. Environ. Qual. 2012, 41, 973–989. [Google Scholar] [CrossRef]
- Atkinson, C.J. How good is the evidence that soil-applied biochar improves water-holding capacity? Soil Use Manag. 2018, 34, 177–186. [Google Scholar] [CrossRef] [Green Version]
- Carvalho, M.T.M.; Madari, B.E.; Bastiaans, L.; van Oort, P.A.J.; Leal, W.G.O.; Heinemann, A.B.; da Silva, M.A.S.; Maia, A.H.N.; Parsons, D.; Meinke, H. Properties of a clay soil from 1.5 to 3.5 years after biochar application and the impact on rice yield. Geoderma 2016, 276, 7–18. [Google Scholar] [CrossRef]
- Jeffery, S.; Meinders, M.B.J.; Stoof, C.R.; Bezemer, T.M.; van de Voorde, T.F.J.; Mommer, L.; van Groenigen, J.W. Biochar application does not improve the soil hydrological function of a sandy soil. Geoderma 2015, 251–252, 47–54. [Google Scholar] [CrossRef]
- Omondi, M.O.; Xia, X.; Nahayo, A.; Liu, X.; Korai, P.K.; Pan, G. Quantification of biochar effects on soil hydrological properties using meta-analysis of literature data. Geoderma 2016, 274, 28–34. [Google Scholar] [CrossRef]
- Yu, O.Y.; Raichle, B.; Sink, S. Impact of biochar on the water holding capacity of loamy sand soil. Int. J. Energy Environ. Eng. 2013, 4, 44. [Google Scholar] [CrossRef] [Green Version]
- El-Naggar, A.; Lee, S.S.; Rinklebe, J.; Farooq, M.; Song, H.; Sarmah, A.K.; Zimmerman, A.R.; Ahmad, M.; Shaheen, S.M.; Ok, Y.S. Biochar application to low fertility soils: A review of current status, and future prospects. Geoderma 2019, 337, 536–554. [Google Scholar] [CrossRef]
- Jeffery, S.; Verheijen, F.G.A.; van der Velde, M.; Bastos, A.C. A quantitative review of the effects of biochar application to soils on crop productivity using meta-analysis. Agric. Ecosyst. Environ. 2011, 144, 175–187. [Google Scholar] [CrossRef]
- Razzaghi, F.; Obour, P.B.; Arthur, E. Does biochar improve soil water retention? A systematic review and meta-analysis. Geoderma 2020, 361, 114055. [Google Scholar] [CrossRef]
- Yoo, S.Y.; Kim, Y.J.; Yoo, G. Understanding the role of biochar in mitigating soil water stress in simulated urban roadside soil. Sci. Total Environ. 2020, 738, 139798. [Google Scholar] [CrossRef]
- Edeh, I.G.; Mašek, O.; Buss, W. A meta-analysis on biochar’s effects on soil water properties—New insights and future research challenges. Sci. Total Environ. 2020, 714, 136857. [Google Scholar] [CrossRef]
- Jahan, S.; Iqbal, S.; Rasul, F.; Jabeen, K. Structural characterization of soil biochar amendments and their comparative performance under moisture deficit regimes. Arab. J. Geosci. 2019, 12, 203. [Google Scholar] [CrossRef]
- Głąb, T.; Palmowska, J.; Zaleski, T.; Gondek, K. Effect of biochar application on soil hydrological properties and physical quality of sandy soil. Geoderma 2016, 281, 11–20. [Google Scholar] [CrossRef]
- Bowman, D.C.; Evans, R.Y. Calcium Inhibition of Polyacrylamide Gel Hydration Is Partially Reversible by Potassium. HortScience 1991, 26, 1063–1065. [Google Scholar] [CrossRef] [Green Version]
- Akhter, J.; Mahmood, K.; Malik, K.A.; Mardan, A.; Ahmad, M.; Iqbal, M.M. Effects of hydrogel amendment on water storage of sandy loam and loam soils and seedling growth of barley, wheat and chickpea. Plant Soil Environ. 2004, 50, 463–469. [Google Scholar] [CrossRef] [Green Version]
- Hüttermann, A.; Zommorodi, M.; Reise, K. Addition of hydrogels to soil for prolonging the survival of Pinus halepensis seedlings subjected to drought. Soil Tillage Res. 1999, 50, 295–304. [Google Scholar] [CrossRef]
- Saha, A.; Rattan, B.; Sekharan, S.; Manna, U. Quantifying the interactive effect of water absorbing polymer (WAP)-soil texture on plant available water content and irrigation frequency. Geoderma 2020, 368, 114310. [Google Scholar] [CrossRef]
- Laftah, W.A.; Hashim, S.; Ibrahim, A.N. Polymer hydrogels: A review. Polym.—Plast. Technol. Eng. 2011, 50, 1475–1486. [Google Scholar] [CrossRef]
- Bakass, M.; Mokhlisse, A.; Lallemant, M. Absorption and desorption of liquid water by a superabsorbent polymer: Effect of polymer in the drying of the soil and the quality of certain plants. J. Appl. Polym. Sci. 2002, 83, 234–243. [Google Scholar] [CrossRef]
- Dorraji, S.S.; Golchin, A.; Ahmadi, S. The Effects of Hydrophilic Polymer and Soil Salinity on Corn Growth in Sandy and Loamy Soils. CLEAN—Soil Air Water 2010, 38, 584–591. [Google Scholar] [CrossRef]
- Banedjschafie, S.; Durner, W. Water retention properties of a sandy soil with superabsorbent polymers as affected by aging and water quality. J. Plant Nutr. Soil Sci. 2015, 178, 798–806. [Google Scholar] [CrossRef]
- Lejcuś, K.; Śpitalniak, M.; Dabrowska, J. Swelling Behaviour of Superabsorbent Polymers for Soil Amendment under Different Loads. Polymers 2018, 10, 271. [Google Scholar] [CrossRef] [PubMed]
- Misiewicz, J.; Lejcuś, K.; Dąbrowska, J.; Marczak, D. The Characteristics of Absorbency Under Load (AUL) for Superabsorbent and Soil Mixtures. Sci. Rep. 2019, 9, 18098. [Google Scholar] [CrossRef] [Green Version]
- Misiewicz, J.; Głogowski, A.; Lejcuś, K.; Marczak, D. The Characteristics of Swelling Pressure for Superabsorbent Polymer and Soil Mixtures. Materials 2020, 13, 5071. [Google Scholar] [CrossRef]
- Han, Y.G.; Yang, P.L.; Luo, Y.P.; Ren, S.M.; Zhang, L.X.; Xu, L. Porosity change model for watered super absorbent polymer-treated soil. Environ. Earth Sci. 2010, 61, 1197–1205. [Google Scholar] [CrossRef]
- Bai, W.; Zhang, H.; Liu, B.; Wu, Y.; Song, J. Effects of super-absorbent polymers on the physical and chemical properties of soil following different wetting and drying cycles. Soil Use Manag. 2010, 26, 253–260. [Google Scholar] [CrossRef]
- Hejduk, S.; Baker, S.W.; Spring, C.A. Evaluation of the effects of incorporation rate and depth of water-retentive amendment materials in sports turf constructions. Acta Agric. Scand. Sect. B Soil Plant Sci. 2012, 62, 155–164. [Google Scholar] [CrossRef]
- Narjary, B.; Aggarwal, P.; Singh, A.; Chakraborty, D.; Singh, R. Water availability in different soils in relation to hydrogel application. Geoderma 2012, 187–188, 94–101. [Google Scholar] [CrossRef]
- Galeş, D.C.; Trincă, L.C.; Cazacu, A.; Peptu, C.A.; Jităreanu, G. Effects of a hydrogel on the cambic chernozem soil’s hydrophysic indicators and plant morphophysiological parameters. Geoderma 2016, 267, 102–111. [Google Scholar] [CrossRef]
- Guilherme, M.R.; Aouada, F.A.; Fajardo, A.R.; Martins, A.F.; Paulino, A.T.; Davi, M.F.T.; Rubira, A.F.; Muniz, E.C. Superabsorbent hydrogels based on polysaccharides for application in agriculture as soil conditioner and nutrient carrier: A review. Eur. Polym. J. 2015, 72, 365–385. [Google Scholar] [CrossRef] [Green Version]
- Montesano, F.F.; Parente, A.; Santamaria, P.; Sannino, A.; Serio, F. Biodegradable Superabsorbent Hydrogel IncreasesWater Retention Properties of Growing Media and Plant Growth. Agric. Agric. Sci. Procedia 2015, 4, 451–458. [Google Scholar] [CrossRef] [Green Version]
- Abrisham, E.S.; Jafari, M.; Tavili, A.; Rabii, A.; Zare Chahoki, M.A.; Zare, S.; Egan, T.; Yazdanshenas, H.; Ghasemian, D.; Tahmoures, M. Effects of a super absorbent polymer on soil properties and plant growth for use in land reclamation. Arid. Land Res. Manag. 2018, 32, 407–420. [Google Scholar] [CrossRef] [Green Version]
- Savi, T.; Marin, M.; Boldrin, D.; Incerti, G.; Andri, S.; Nardini, A. Green roofs for a drier world: Effects of hydrogel amendment on substrate and plant water status. Sci. Total Environ. 2014, 490, 467–476. [Google Scholar] [CrossRef]
- Orzeszyna, H.; Garlikowski, D.; Pawłowski, A.; Lejcus, K. Geocomposite Element, Particularly for Enhancing Plant Growth. EU Patent WO2011133054A1, 27 October 2011. [Google Scholar]
- Oksińska, M.P.; Magnucka, E.G.; Lejcuś, K.; Pietr, S.J. Biodegradation of the cross-linked copolymer of acrylamide and potassium acrylate by soil bacteria. Environ. Sci. Pollut. Res. 2016, 23, 5969–5977. [Google Scholar] [CrossRef]
- Oksińska, M.P.; Magnucka, E.G.; Lejcuś, K.; Jakubiak-Marcinkowska, A.; Ronka, S.; Trochimczuk, A.W.; Pietr, S.J. Colonization and biodegradation of the cross-linked potassium polyacrylate component of water absorbing geocomposite by soil microorganisms. Appl. Soil Ecol. 2019, 133, 114–123. [Google Scholar] [CrossRef]
- Śpitalniak, M.; Lejcuś, K.; Dąbrowska, J.; Garlikowski, D.; Bogacz, A. The Influence of a Water Absorbing Geocomposite on Soil Water Retention and Soil Matric Potential. Water 2019, 11, 1731. [Google Scholar] [CrossRef] [Green Version]
- Bąbelewski, P.; Pancerz, M.; Dębicz, R. The influence of geocomposites on the biomass production, the nutritional status of plants and the substrate characteristics in the container nursery production of rosa cv. white meidiland and Berberis thunbergii cv. green carpet. J. Elem. 2017, 22, 1095–1106. [Google Scholar] [CrossRef]
- Cabała, A.; Wróblewska, K.; Chohura, P.; Dębicz, R. Effect of fertilization through geocomposite on nutritional status of hosta “halcyon” plants grown in containers. Acta Sci. Pol. Hortorum Cultus 2016, 3, 83–93. [Google Scholar]
- Pancerz, M.; Bąbelewski, P.; Dębicz, R. Geocomposite use in container nursery production of selected ornamental shrubs. Acta Hortic. 2018, 1191, 161–166. [Google Scholar] [CrossRef]
- Wróblewska, K.; Chohura, P.; Dębicz, R.; Lejcuś, K.; Dąbrowska, J. Water absorbing geocomposite: A novel method improving water and fertilizer efficiency in Brunnera macrophylla cultivation. Part I. Plant growth. Acta Sci. Pol. Hortorum Cultus 2018, 17, 49–56. [Google Scholar] [CrossRef]
- Kordas, L.; Kuc, P.; Lejcuś, K. Biological stabilisation of tailing pond coasts with use of mineral and organic substances and water-absorbing geocomposites. Pol. J. Environ. Stud. 2018, 27, 2089–2095. [Google Scholar] [CrossRef]
- Kuc, P.; Kordas, L.; Lejcuś, K. Phytostabilisation of tailing ponds with use of water absorbing geocomposites and organic and mineral additives. Environ. Prot. Eng. 2019, 45. [Google Scholar] [CrossRef]
- Śpitalniak, M. The usage of water absorbing geocomposites for the protection of slopes of earth structures against water erosion (Polish). Inżynieria Morska Geotech. 2016, 3, 161–166. [Google Scholar]
- Marczak, D.; Lejcuś, K.; Grzybowska-Pietras, J.; Biniaś, W.; Lejcuś, I.; Misiewicz, J. Biodegradation of sustainable nonwovens used in water absorbing geocomposites supporting plants vegetation. Sustain. Mater. Technol. 2020, 26, e00235. [Google Scholar] [CrossRef]
- Stormont, J.C.; Morris, C.E. Method to Estimate Water Storage Capacity of Capillary Barriers. J. Geotech. Geoenviron. Eng. 1998, 124, 297–302. [Google Scholar] [CrossRef] [Green Version]
- Khire, M.V.; Benson, C.H.; Bosscher, P.J. Capillary Barriers: Design Variables and Water Balance. J. Geotech. Geoenviron. Eng. 2000, 126, 695–708. [Google Scholar] [CrossRef] [Green Version]
- Zornberg, J.G.; Bouazza, A.; McCartney, J.S. Geosynthetic capillary barriers: Current state of knowledge. Geosynth. Int. 2010, 17, 273–300. [Google Scholar] [CrossRef] [Green Version]
- McCartney, J.S.; Zornberg, J.G. Effects of infiltration and evaporation on geosynthetic capillary barrier performance. Can. Geotech. J. 2010, 47, 1201–1213. [Google Scholar] [CrossRef]
- Iryo, T.; Rowe, R.K. On the hydraulic behavior of unsaturated nonwoven geotextiles. Geotext. Geomembr. 2003, 21, 381–404. [Google Scholar] [CrossRef]
- Mccartney, J.S.; Zornberg, J.G. Effect of Wet-Dry Cycles on Capillary Break Formation in Geosynthetic Drainage Layers. Geosynthetics 2007, 2007, 1–10. [Google Scholar]
- Bhattacharyya, R.; Yi, Z.; Yongmei, L.; Li, T.; Panomtaranichagul, M.; Peukrai, S.; Thu, D.C.; Cuong, T.H.; Toan, T.T.; Jankauskas, B.; et al. Effects of biological geotextiles on aboveground biomass production in selected agro-ecosystems. Field Crop. Res. 2012, 126, 23–36. [Google Scholar] [CrossRef]
- Bhattacharyya, R.; Smets, T.; Fullen, M.A.; Poesen, J.; Booth, C.A. Effectiveness of geotextiles in reducing runoff and soil loss: A synthesis. Catena 2010, 81, 184–195. [Google Scholar] [CrossRef]
- Wang, F.; Han, J.; Zhang, X.; Guo, J. Laboratory tests to evaluate effectiveness of wicking geotextile in soil moisture reduction. Geotext. Geomembr. 2017, 45, 8–13. [Google Scholar] [CrossRef]
- Guo, J.; Wang, F.; Zhang, X.; Han, J. Quantifying Water Removal Rate of a Wicking Geotextile under Controlled Temperature and Relative Humidity. J. Mater. Civ. Eng. 2017, 29, 04016181. [Google Scholar] [CrossRef]
- Lejcuś, K.; Dąbrowska, J.; Grzybowska-Pietras, J.; Garlikowski, D.; Lejcuś, I.; Pawłowski, A.; Śpitalniak, M. Optimisation of operational parameters for nonwoven sheaths of water absorbing geocomposites in unsaturated soil conditions. Fibres Text. East. Eur. 2016, 24. [Google Scholar] [CrossRef]
- Janik, G.; Dawid, M.; Walczak, A.; Słowińska-Osypiuk, J.; Skierucha, W.; Wilczek, A.; Daniel, A. Application of the TDR technique for the detection of changes in the internal structure of an earthen flood levee. J. Geophys. Eng. 2017, 14, 292–302. [Google Scholar] [CrossRef] [Green Version]
- Malicki, M.A.; Skierucha, W.M. A manually controlled TDR soil moisture meter operating with 300 ps rise-time needle pulse. Irrig. Sci. 1989, 10, 153–163. [Google Scholar] [CrossRef]
- Skierucha, W. Accuracy of soil moisture measurement by tdr technique. Int. Agrophys. 2000, 14, 417–426. [Google Scholar]
- Skierucha, W.; Wilczek, A.; Szypłowska, A.; Sławiński, C.; Lamorski, K. A TDR-Based Soil Moisture Monitoring System with Simultaneous Measurement of Soil Temperature and Electrical Conductivity. Sensors 2012, 12, 13545–13566. [Google Scholar] [CrossRef]
- Klute, A. Water Retention: Laboratory Methods. In Methods of Soil Analysis, Part 1: Physical and Mineralogical Methods; John Wiley & Sons, Ltd.: Hoboken, NJ, USA, 1986; pp. 635–662. [Google Scholar]
- Cresswell, H.P.; Green, T.W.; McKenzie, N.J. The Adequacy of Pressure Plate Apparatus for Determining Soil Water Retention. Soil Sci. Soc. Am. J. 2008, 72, 41–49. [Google Scholar] [CrossRef]
- Kabała, C.; Bekier, J.; Binczycki, T.; Bogacz, A.; Bojko, O.; Ćwieląg-Piasecka, I.; Dębicka, M.; Cuske, M.; Gałka, B.; Gersztyn, L.; et al. Soils of Lower Silesia: Origins, Diversity and Protection [Gleby Dolnego Śląska: Geneza, różnorodność i ochrona]; PTG: Wrocław, Poland; PTSH: Wrocław, Poland, 2015; ISBN 978-83-934096-4-8. [Google Scholar]
- FAO; IUSS. International Soil Classification System for Naming Soils and Creating Legends for Soil Maps; FAO: Rome, Italy, 2015. [Google Scholar]
- Żukiewicz-Sobczak, W.; Latawiec, A.; Sobczak, P.; Strassburg, B.; Plewik, D.; Tokarska-Rodak, M. Biochars Originating from Different Biomass and Pyrolysis Process Reveal to Have Different Microbial Characterization: Implications for Practice. Sustainability 2020, 12, 1526. [Google Scholar] [CrossRef] [Green Version]
- Ścisłowska, M.; Włodarczyk, R.; Kobyłecki, R.; Bis, Z. Biochar to improve the quality and productivity of soils. J. Ecol. Eng. 2015, 16, 31–35. [Google Scholar] [CrossRef]
- Van Genuchten, M.T. A Closed-form Equation for Predicting the Hydraulic Conductivity of Unsaturated Soils. Soil Sci. Soc. Am. J. 1980, 44, 892–898. [Google Scholar] [CrossRef] [Green Version]
- Seki, K. SWRC fit—A nonlinear fitting program with a water retention curve for soils having unimodal and bimodal pore structure. Hydrol. Earth Syst. Sci. Discuss. 2007, 4, 407–437. [Google Scholar] [CrossRef] [Green Version]
- Durner, W. Hydraulic conductivity estimation for soils with heterogeneous pore structure. Water Resour. Res. 1994, 30, 211–223. [Google Scholar] [CrossRef]
- Kosugi, K. Lognormal Distribution Model for Unsaturated Soil Hydraulic Properties. Water Resour. Res. 1996, 32, 2697–2703. [Google Scholar] [CrossRef]
- Fredlund, D.G.; Xing, A. Equations for the soil-water characteristic curve. Can. Geotech. J. 1994, 31, 521–532. [Google Scholar] [CrossRef]
- Brooks, R.; Corey, A.T. Hydraulic properties of porous media. Hydrol. Pap. Color. State Univ. 1964, 3, 1–37. [Google Scholar]
- Marshall, T.J. Relations between Water and Soil; Commonwealth Bureau of Soils: Harpenden, UK, 1959; Volume 50. [Google Scholar]
- Saha, A.; Sekharan, S.; Manna, U. Superabsorbent hydrogel (SAH) as a soil amendment for drought management: A review. Soil Tillage Res. 2020, 204, 104736. [Google Scholar] [CrossRef]
- Islam, M.R.; Mao, S.; Xue, X.; Eneji, A.E.; Zhao, X.; Hu, Y. A lysimeter study of nitrate leaching, optimum fertilisation rate and growth responses of corn (Zea mays L.) following soil amendment with water-saving super-absorbent polymer. J. Sci. Food Agric. 2011, 91, 1990–1997. [Google Scholar] [CrossRef] [PubMed]
- Satriani, A.; Catalano, M.; Scalcione, E. The role of superabsorbent hydrogel in bean crop cultivation under deficit irrigation conditions: A case-study in Southern Italy. Agric. Water Manag. 2018, 195, 114–119. [Google Scholar] [CrossRef]
- Yang, L.; Han, Y.; Yang, P.; Wang, C.; Yang, S.; Kuang, S.; Yuan, H.; Xiao, C. Effects of superabsorbent polymers on infiltration and evaporation of soil moisture under point source drip irrigation. Irrig. Drain. 2015, 64, 275–282. [Google Scholar] [CrossRef]
- Leciejewski, P. The influence of the hydrogel addition on the changes of the sandy soil’s moisture and the dynamics of soil drying in the laboratory conditions (Polish). Stud. Mater. Cent. Edukac. Przyr. 2008, 10, 316–328. [Google Scholar]
- Fitch, B.C.; Chong, S.K.; Arosemena, J.; Theseira, G.W. Effects of a Conditioner on Soil Physical Properties. Soil Sci. Soc. Am. J. 1989, 53, 1536–1539. [Google Scholar] [CrossRef]
- Baran, A.; Zaleski, T.; Kulikowski, E.; Wieczorek, J. Hydrophysical and Biological Properties of Sandy Substrata Enriched with Hydrogel. Pol. J. Environ. Stud. 2015, 24, 2355–2362. [Google Scholar] [CrossRef]
- Ostrand, M.S.; DeSutter, T.M.; Daigh, A.L.M.; Limb, R.F.; Steele, D.D. Superabsorbent polymer characteristics, properties, and applications. Agrosyst. Geosci. Environ. 2020, 3, e20074. [Google Scholar] [CrossRef]
- Alkhasha, A.; Al-Omran, A.; Aly, A. Effects of Biochar and Synthetic Polymer on the Hydro-Physical Properties of Sandy Soils. Sustainability 2018, 10, 4642. [Google Scholar] [CrossRef] [Green Version]
- Abedi-Koupai, J.; Sohrab, F.; Swarbrick, G. Evaluation of Hydrogel Application on Soil Water Retention Characteristics. J. Plant Nutr. 2008, 31, 317–331. [Google Scholar] [CrossRef]
- Novak, J.M.; Lima, I.; Xing, B.; Gaskin, J.W.; Steiner, C.; Das, K.C.; Ahmedna, M.; Rehrah, D.; Watts, D.W.; Busscher, W.J.; et al. Characterization of designer biochar produced at different temperatures and their effects on a loamy sand. Ann. Environ. Sci. 2009, 3, 195–206. [Google Scholar]
- Novak, J.M.; Busscher, W.J.; Watts, D.W.; Amonette, J.E.; Ippolito, J.A.; Lima, I.M.; Gaskin, J.; Das, K.C.; Steiner, C.; Ahmedna, M.; et al. Biochars Impact on Soil-Moisture Storage in an Ultisol and Two Aridisols. Soil Sci. 2012, 177, 310–320. [Google Scholar] [CrossRef] [Green Version]
- Quin, P.R.; Cowie, A.L.; Flavel, R.J.; Keen, B.P.; Macdonald, L.M.; Morris, S.G.; Singh, B.P.; Young, I.M.; Van Zwieten, L. Oil mallee biochar improves soil structural properties-A study with x-ray micro-CT. Agric. Ecosyst. Environ. 2014, 191, 142–149. [Google Scholar] [CrossRef]
- Gamage, D.N.V.; Mapa, R.B.; Dharmakeerthi, R.S.; Biswas, A. Effect of rice-husk biochar on selected soil properties in tropical Alfisols. Soil Res. 2016, 54, 302. [Google Scholar] [CrossRef]
- Bouazza, A.; Zornberg, J.G.; McCartney, J.S.; Nahlawi, H. Significance of unsaturated behaviour of geotextiles in earthen structures. Aust. Geomech. 2006, 41, 133–142. [Google Scholar]
- Lejcuś, K.; Dąbrowska, J.; Garlikowski, D.; Kordas, L. Water Loss from Soil and Water Absorbing Geocomposite. In Proceedings of the 2015 6th International Conference on Environmental Science and Technology, Singapore, 23–24 May 2015; Volume 84, pp. 123–127. [Google Scholar]


| Model/Soil Amendment | Equation | Parameters | R2 | AIC |
|---|---|---|---|---|
| van Genuchten (1980) control sample | | |||
| van Genuchten (1980) attapulgite | | |||
| Seki (2007) biochar | | |||
| Seki (2007) bentonite | | |||
| Durner (1994) superabsorbent polymer (SAP) | |
| Parameter | Unit | Method | Soil Type: Loamy Sand (LS) |
|---|---|---|---|
| Silt | % | sieve and aerometric analysis | 15 |
| Clay | % | 7 | |
| Sand | % | 78 | |
| pHKCl | (–) | PN-ISO 10390:1997(A) | 7.4 ± 0.3 |
| Total Nitrogen (N) | % DM | ICP-AES | 0.06 |
| Potassium (K) | g∙kg−1 DM | ICP-AES | 1.85 |
| Phosphorus (P) | g∙kg−1 DM | ICP-AES | 0.519 |
| Magnesium (Mg) | g∙kg−1 DM | ICP-AES | 1.84 |
| Calcium (Ca) | g∙kg−1 DM | ICP-AES | 2.45 ± 0.49 |
| Sodium (Na) | g∙kg−1 DM | ICP-AES | 0.107 ± 0.021 |
| Cation Exchange Capacity (CEC) | cmol(+)∙kg−1 | only base cations (Ca2+ + Mg2+ + K+ + Na+) | 32.8 |
| Electric Conductivity (EC) | µS∙cm−1 | PN-ISO 11265+AC1:1997 | 123.0 |
| Soil organic carbon (SOC) | % | thermal method acc. to PN-88/B-04481 | 2.86 |
| Bulk density | g∙cm−3 | Kopecky’s cylinder method | 1.67 |
| Multi-fraction soil | (–) | EN ISO 14688-2:2018 | Cu = 46.67 |
| Day | Depth | SAP | Bentonite | WAG | Biochar | BioWAG | Geotextile | Attapulgite | Control |
|---|---|---|---|---|---|---|---|---|---|
| (–) | (–) | (%) | (%) | (%) | (%) | (%) | (%) | (%) | (%) |
| 4 | top | 25.0 (0.4) | 24.5 (0.9) | 25.3 (0.7) | 23 (0.9) | 25.5 (1.0) | 29.2 (1.3) *d | 25.6 (0.6) | 22.7 (1.8) |
| centre | 21.6 (0.7) | 25.7 (0.7) | 28.9 (1.4) *d | 27.2 (0.8) d | 26.6 (0.6) | 26.0 (0.6) | 27.5 (1.3) d | 23.5 (1.6) | |
| bottom | 11.8 (0.4) *d | 30.3 (0.5) d | 32.7 (1.6) *d | 30.2 (0.3) d | 29.1 (1.6) | 29.0 (1.0) | 29.3 (0.7) | 26.2 (0.9) | |
| 7 | top | 21.1 (0.6) | 23.1 (0.8) | 23.9 (0.8) | 21.0 (1.0) | 23.2 (0.9) | 26.1 (1.1) * | 23.2 (0.6) | 20.7 (1.7) |
| centre | 19.6 (0.8) | 23.8 (0.7) | 26.2 (0.9) * | 24.8 (1.0) | 24.2 (0.5) | 24.2 (0.6) | 24.9 (1.2) | 21.7 (1.5) | |
| bottom | 12.2 (0.4) *d | 27.1 (0.5) *d | 29.5 (1.6) *d | 26.5 (0.6) *d | 26.1 (1.2) *d | 25.6 (0.7) *d | 26.0 (0.8) *d | 20.7 (1.0) | |
| 14 | top | 16.7 (0.3) | 17.4 (0.5) | 16.6 (0.2) | 16.1 (1.0) | 15.8 (0.4) | 18.9 (0.6) * | 17.5 (0.3) | 15.5 (1.2) |
| centre | 17.8 (0.7) d | 18.4 (0.5) *d | 18.9 (0.8) *d | 18.7 (0.8) *d | 18.4 (0.4) *d | 17.9 (0.7) d | 17.2 (0.7) d | 15.2 (0.4) | |
| bottom | 12.8 (0.4) *d | 18.6 (0.4) *d | 19.4 (0.7) *d | 19.6 (0.3) *d | 19.6 (0.6) *d | 18.6 (0.4) *d | 19.1 (0.4) *d | 15.0 (0.3) | |
| 22 | top | 13.9 (0.3) | 14.5 (0.2) | 14.4 (0.1) | 13.4 (0.7) | 13.9 (0.1) | 15.6 (0.3) | 14.9 (0.1) | 13.9 (1.0) |
| centre | 17.6 (0.6) *d | 16.1 (0.7) d | 18.9 (0.8) *d | 15.8 (0.5) | 16.6 (0.4) d | 15.5 (0.6) | 14.6 (0.3) | 14.2 (0.2) | |
| bottom | 13.1 (0.5) | 15.8 (0.2) *d | 16.3 (0.2) *d | 16.2 (0.2) *d | 16.3 (0.4) *d | 15.6 (0.1) *d | 16.6 (0.2) *d | 13.4 (0.3) |
| Day | SAP | Bentonite | WAG | Biochar | BioWAG | Geotextile | Attapulgite | Control |
|---|---|---|---|---|---|---|---|---|
| (–) | (kPa) | (kPa) | (kPa) | (kPa) | (kPa) | (kPa) | (kPa) | (kPa) |
| Day 4 | 23.7 (0.6) * | 10.5 (0.6) | 10.0 (0.4) | 9.4 (0.6) | 10.8 (0.7) | 9.0 (0.4) | 10.0 (0.6) | 9.8 (0.9) |
| Day 7 | 30.6 (0.8) * | 12.2 (0.8) | 12.4 (0.9) | 13.6 (1.4) | 14.4 (1.1) | 9.6 (0.5) | 13.9 (0.7) | 11.8 (1.1) |
| Day 14 | 47.0 (1.3) d | 52.2 (1.4) | 64.9 (1.5) *d | 68.5 (1.6) *d | 57.6 (1.1) d | 40.2 (2.1) *d | 57.3 (1.3) d | 52.3 (1.8) |
| Day 22 | 63.0 (1.4) d | 73.6 (2.9) d | 70.4 (2.1) *d | 76.8 (1.2) *d | 67.6 (2.3) d | 68.4 (2.1) *d | 70.1 (1.6) d | 69.0 (2.1) |
| pF | Obvs. | Median Moisture (%) | Mean Moisture (%) | Min. Moisture (%) | Max. Moisture (%) | SE in Moisture | Mean Bulk Density (g∙cm−3) | SE in Bulk Density | |
|---|---|---|---|---|---|---|---|---|---|
| superabsorbent polymer (SAP) | 0.0 | 12 | 74.1 | 74.9 | 69.7 | 82.5 | 1.1 | 1.14 | 0.020 |
| 1.0 | 12 | 66.6 | 66.5 | 61.2 | 73.8 | 0.9 | |||
| 1.5 | 12 | 57.3 | 57.8 | 52.6 | 63.1 | 1.0 | |||
| 1.8 | 12 | 48.0 | 48.9 | 44.2 | 53.4 | 1.0 | |||
| 2.0 | 12 | 40.9 | 41.4 | 37.2 | 45.6 | 0.9 | |||
| 2.3 | 12 | 35.6 | 35.8 | 31.6 | 40.3 | 0.8 | |||
| 2.5 | 12 | 33.1 | 32.9 | 28.7 | 37.0 | 0.8 | |||
| 2.7 | 12 | 31.2 | 30.9 | 27.1 | 34.6 | 0.8 | |||
| 3.3 | 12 | 14.2 | 14.9 | 10.6 | 21.9 | 0.9 | |||
| 3.7 | 12 | 11.0 | 11.0 | 8.9 | 13.7 | 0.4 | |||
| 4.2 | 12 | 9.3 | 9.1 | 5.5 | 12.2 | 0.7 | |||
| control | 0.0 | 12 | 44.4 | 44.4 | 42.2 | 46.3 | 0.4 | 1.70 | 0.022 |
| 1.0 | 12 | 40.3 | 40.5 | 39.2 | 42.2 | 0.2 | |||
| 1.5 | 12 | 34.5 | 34.4 | 33.2 | 35.4 | 0.2 | |||
| 1.8 | 12 | 26.7 | 26.5 | 25.0 | 27.3 | 0.2 | |||
| 2.0 | 12 | 22.8 | 22.6 | 21.2 | 23.4 | 0.2 | |||
| 2.3 | 12 | 19.2 | 19.2 | 17.5 | 20.8 | 0.3 | |||
| 2.5 | 12 | 17.6 | 17.7 | 15.9 | 18.8 | 0.3 | |||
| 2.7 | 12 | 16.2 | 16.4 | 15.2 | 17.6 | 0.2 | |||
| 3.3 | 12 | 9.6 | 9.4 | 8.0 | 10.1 | 0.2 | |||
| 3.7 | 12 | 7.5 | 7.4 | 5.7 | 8.3 | 0.2 | |||
| 4.2 | 12 | 6.6 | 6.4 | 3.7 | 7.6 | 0.3 | |||
| biochar | 0.0 | 12 | 44.4 | 44.4 | 42.6 | 46.5 | 0.3 | ||
| 1.0 | 12 | 40.8 | 40.9 | 39.5 | 42.6 | 0.3 | |||
| 1.5 | 12 | 36.0 | 35.9 | 34.8 | 37.5 | 0.2 | |||
| 1.8 | 12 | 27.8 | 27.7 | 26.3 | 28.9 | 0.2 | |||
| 2.0 | 12 | 23.5 | 23.5 | 22.0 | 25.2 | 0.2 | |||
| 2.3 | 12 | 20.0 | 20.0 | 18.3 | 21.1 | 0.2 | 1.65 | 0.019 | |
| 2.5 | 12 | 18.4 | 18.3 | 17.1 | 20.1 | 0.2 | |||
| 2.7 | 12 | 16.3 | 16.6 | 15.6 | 18.4 | 0.2 | |||
| 3.3 | 12 | 8.7 | 8.8 | 8.1 | 9.8 | 0.1 | |||
| 3.7 | 12 | 7.3 | 7.4 | 6.5 | 8.2 | 0.1 | |||
| 4.2 | 12 | 6.3 | 6.2 | 5.0 | 7.8 | 0.3 | |||
| attapulgite | 0.0 | 12 | 41.7 | 42.5 | 39.5 | 46.0 | 0.6 | ||
| 1.0 | 12 | 38.1 | 38.2 | 35.6 | 41.0 | 0.5 | |||
| 1.5 | 12 | 35.5 | 35.2 | 33.3 | 36.4 | 0.3 | |||
| 1.8 | 12 | 29.4 | 29.2 | 27.1 | 30.0 | 0.2 | |||
| 2.0 | 12 | 25.2 | 25.0 | 23.2 | 26.2 | 0.2 | |||
| 2.3 | 12 | 21.7 | 21.3 | 19.4 | 22.5 | 0.3 | 1.75 | 0.021 | |
| 2.5 | 12 | 19.9 | 19.9 | 18.4 | 21.6 | 0.3 | |||
| 2.7 | 12 | 18.5 | 18.3 | 16.5 | 20.1 | 0.2 | |||
| 3.3 | 12 | 11.2 | 11.1 | 10.2 | 12.2 | 0.2 | |||
| 3.7 | 12 | 9.2 | 9.2 | 7.4 | 11.4 | 0.3 | |||
| 4.2 | 12 | 6.8 | 6.7 | 5.4 | 7.7 | 0.2 | |||
| bentonite | 0.0 | 12 | 39.5 | 40.4 | 36.1 | 46.0 | 0.8 | ||
| 1.0 | 12 | 36.2 | 37.0 | 34.2 | 41.5 | 0.6 | |||
| 1.5 | 12 | 31.1 | 31.5 | 29.8 | 34.7 | 0.4 | |||
| 1.8 | 12 | 24.6 | 24.9 | 23.9 | 27.6 | 0.3 | |||
| 2.0 | 12 | 21.2 | 21.4 | 20.6 | 23.5 | 0.2 | |||
| 2.3 | 12 | 18.3 | 18.3 | 16.9 | 19.8 | 0.2 | |||
| 2.5 | 12 | 16.8 | 16.9 | 15.6 | 18.2 | 0.2 | 1.50 | 0.025 | |
| 2.7 | 12 | 15.1 | 15.3 | 14.0 | 17.2 | 0.3 | |||
| 3.3 | 12 | 8.5 | 8.7 | 7.6 | 10.3 | 0.3 | |||
| 3.7 | 12 | 6.6 | 6.9 | 6.2 | 8.5 | 0.2 | |||
| 4.2 | 12 | 5.7 | 5.7 | 4.7 | 6.8 | 0.2 |
| Day 4 | Day 7 | Day 14 | Day 22 | ||||||||||
|---|---|---|---|---|---|---|---|---|---|---|---|---|---|
| Depth | Unit | Gtex | bioWAG | WAG | Gtex | bioWAG | WAG | Gtex | bioWAG | WAG | Gtex | bioWAG | WAG |
| Top | p.p. | 6.6 | 2.8 | 2.7 | 5.4 | 2.5 | 3.3 | 3.4 | 0.3 | 1.1 | 1.7 | 0.0 | 0.6 |
| centre | p.p. | 2.4 | 3.1 | 5.4 | 2.4 | 2.4 | 4.5 | 2.8 | 3.2 | 3.7 | 1.4 | 2.4 | 4.8 |
| bottom | p.p. | 2.8 | 2.8 | 6.4 | 4.9 | 5.4 | 8.8 | 3.7 | 4.6 | 4.4 | 2.2 | 2.9 | 2.9 |
| SMP | kPa | 0.8 | −1.0 | −0.2 | 2.1 | −2.6 | −0.6 | 12.1 | −5.3 | −12.6 | 0.6 | 1.5 | −1.4 |
Publisher’s Note: MDPI stays neutral with regard to jurisdictional claims in published maps and institutional affiliations. |
© 2021 by the authors. Licensee MDPI, Basel, Switzerland. This article is an open access article distributed under the terms and conditions of the Creative Commons Attribution (CC BY) license (https://creativecommons.org/licenses/by/4.0/).
Share and Cite
Śpitalniak, M.; Bogacz, A.; Zięba, Z. The Assessment of Water Retention Efficiency of Different Soil Amendments in Comparison to Water Absorbing Geocomposite. Materials 2021, 14, 6658. https://doi.org/10.3390/ma14216658
Śpitalniak M, Bogacz A, Zięba Z. The Assessment of Water Retention Efficiency of Different Soil Amendments in Comparison to Water Absorbing Geocomposite. Materials. 2021; 14(21):6658. https://doi.org/10.3390/ma14216658
Chicago/Turabian StyleŚpitalniak, Michał, Adam Bogacz, and Zofia Zięba. 2021. "The Assessment of Water Retention Efficiency of Different Soil Amendments in Comparison to Water Absorbing Geocomposite" Materials 14, no. 21: 6658. https://doi.org/10.3390/ma14216658