Article

Structure and Dielectric Behavior of Yb2O3-MgO Co-Doped 0.92BaTiO3-0.08(Na0.5Bi0.5)TiO3 Ferroelectric Relaxor

College of Materials Science and Engineering, Xi′an University of Architecture and Technology, Xi′an 710054, China
*
Author to whom correspondence should be addressed.
Materials 2021, 14(22), 6802; https://doi.org/10.3390/ma14226802
Submission received: 13 October 2021 / Revised: 30 October 2021 / Accepted: 5 November 2021 / Published: 11 November 2021

Abstract

:
Dielectric properties and structure of 0.015Yb2O3-xMgO doped 0.92BaTiO3-0.08(Na0.5Bi0.5)TiO3 ceramics with x = 0.0–0.025 have been investigated. As Yb2O3-MgO was added into the BT-NBT, the phase changes from tetragonal to pseudo-cubic, with the tetragonality c/a decreases from 1.011 to 1.008 and XRD peaks broadened. The combined study of XRD and TEM image revealed a formation of core–shell structure in grains with core of 400–600 nm and the shell of a thickness 60–200 nm. There is a slowly phase transition against temperature from the variable temperature Raman analysis. The ferroelectric relaxor peak of BT-NBT decreases from ~4000 to ~2000 and a new broad dielectric peak with an equivalent maximum (εr′~2300) appears in the temperature dependent dielectric constant curve (εr′-T), which produces a flat εr′-T curve. Sample 0.92BaTiO3-0.08(Na0.5Bi0.5)TiO3-0.015Yb2O3-0.005 MgO and 0.92BaTiO3-0.08(Na0.5Bi0.5)TiO3-0.015Yb2O3-0.01MgO give a εr′ variation within ±14% and ±10% in 20–165 °C. The core–shell microstructure should take account for the flattened εr′–T behavior of these samples.

1. Introduction

BaTiO3-based (BT) materials with large dielectric constant (εr′) are widely used in electric components and devices [1], such as high permittivity ceramic capacitors, piezoelectric ceramic transducers, and sensors. Generally, a key parameter of dielectric materials in applications is the permittivity (εr′) and its temperature stability. For example, in multi-layer ceramic capacitors (MLCC), ideal materials should give a high εr′ and a flat εr′-T curve (relaxed) in the operation temperature range. The international EIA of Electronic Industries Association USA (Electronic Industries Association) has proposed a MLCC standard [2] on the rate of change of capacitance against temperature (ΔC/C20°C), in which an X8R type MLCC is ΔC/C20°C in ± 15% from −55 to 150 °C [3]. As a ferroelectric material, the εr′ of BaTiO3 (BT for short) is high (~104) at the vicinity of phase transition temperature (Tc~393 K) and drops significantly at temperature away from Tc, which makes it not immediately suitable for capacitor applications. There are many researches focused on the improvement of the εr′-T curve by the additions of some oxides into BaTiO3, such as Nb2O5, MgO, Co3O4, MnCO3 [4], and many BT-based ferroelectric relaxors reported. Among which, MgO shows the significant effects to the dielectric behavior and microstructure of BT ceramics [5,6,7]. For example, a suitable MgO-Nb2O5-Na0.5Bi0.5TiO3-BT relaxor ceramic can achieves an EIA-X9R standard, showing ΔC/C20°C = −1.8, 1.8, and −5.69% at −55, 125, and 200 °C, respectively [6].
On the relaxation mechanism of BT-based ferroelectric relaxors, the microstructure, chemical inhomogeneity and dielectric properties were focused [5,7,8,9,10,11,12,13]. It is found that BT-based relaxors show very subtle “core–shell” grain microstructures with different chemistry compositions, which should be the origin of the relaxed dielectric behaviors. For example, in MgO-Y2O3-BT ceramics, the core of grains is mainly BT ferroelectric domains, the Y3+ is mainly located in the shell of grains and Mg2+ is mainly at grain boundaries. Thus, in order to obtain a flat εr′-T curve for applications, the control of core–shell microstructure in BaTiO3-based dielectric ceramic is an effective way [11,14,15]. (Na0.5Bi0.5)TiO3 (NBT for short) with a perovskite structure is one of the most important ferroelectric material, which shows a high Curie temperature Tc ~ 593 K. NBT is widely used for the modification of BT ceramics in recent researches to move the Tc to a high temperature and obtain a broad εr′-T curve [14,15,16,17,18,19]. However, the εr′-T curve of BT-NBT still shows significant peak behavior in our experience, which make it not suitable in applications. Thus, a further improvement on the εr′-T relaxing behavior is needed.
In this work, we selected 0.92BaTiO3-0.08(Na0.5Bi0.5)TiO3 (abbreviated as BT-NBT) systems as matrix and Yb2O3-MgO as modifications to study the microstructure/local structure and dielectric properties, which has not been studied. We prepared Yb2O3-MgO doped BT-NBT ceramic samples and investigated the XRD, Raman, and dielectric behaviors.

2. Materials and Methods

0.92BaTiO3-0.08(Na0.5Bi0.5)TiO3-0.015Yb2O3-xMgO (BT-NBT-YM for short) were prepared by high temperature solid-state reaction method. The raw materials selected are BaTiO3, Bi2O3, Na2CO3, TiO2, Yb2O3, and MgO with the purity > 99% (Sinopharm, Beijing, China). (Na0.5Bi0.5)TiO3 powders was prepared from Bi2O3, Na2CO3, and TiO2. Stoichiometric materials were mixed and calcined at 800 °C for 2 h. After cooled, the product was ground (labeled as NBT). Then, the NBT and BaTiO3 powders were weighed and mixed by ball milling for 24 h. The slurry was dried and calcined at 900 °C for 2 h. The cooled product was ground, added with 1.5 mol% Yb2O3 and x mol% MgO (YM for short) and mixed by ball-milled method for 24 h. The slurries were dried and pressed into pellets at ~200 MPa (with 5% PVA as binder). These pellets were sintered at 1240~1270 °C for 3 h (optimized condition) to obtain the final ceramic samples. All the ceramics were carefully polished for further measurements.
The average crystal structure of samples was analyzed by an X-ray diffractometer (X′Pert Pro Panalytical, Almelo, The Netherlands) with scanning rate 1°/min and Cu-Kα radiation (40 kV × 40 mA). The local structure of these samples was analyzed using Raman spectra, which were collected on a Renishaw Invia Raman Microscope spectrometer (Charfield, UK). The spectrometer was equipped with a diffraction grating of 1800 grooves/mm and a confocal microscope (100× objective) to ensure a spectrum resolution of ~2 cm−1. The spectra were collected in backscattering geometry excited by an argon laser at 514.5 nm. A TMS 94 module was used for temperature controlling from 30–200 °C during the measurements. The microstructures of ceramics were investigated by a transmission electron microscopy (TEM, JEOL, Tokyo, Japan), and the samples for the TEM measurements were prepared by ion-beam thinning. Temperature-dependent dielectric parameters were measured using an LCR meter (HP E4980A, Palo Alto, CA, USA) from 20 to 250 °C. For the dielectric measurements, the polished samples were coated with silver paste as electrodes.

3. Results and Discussion

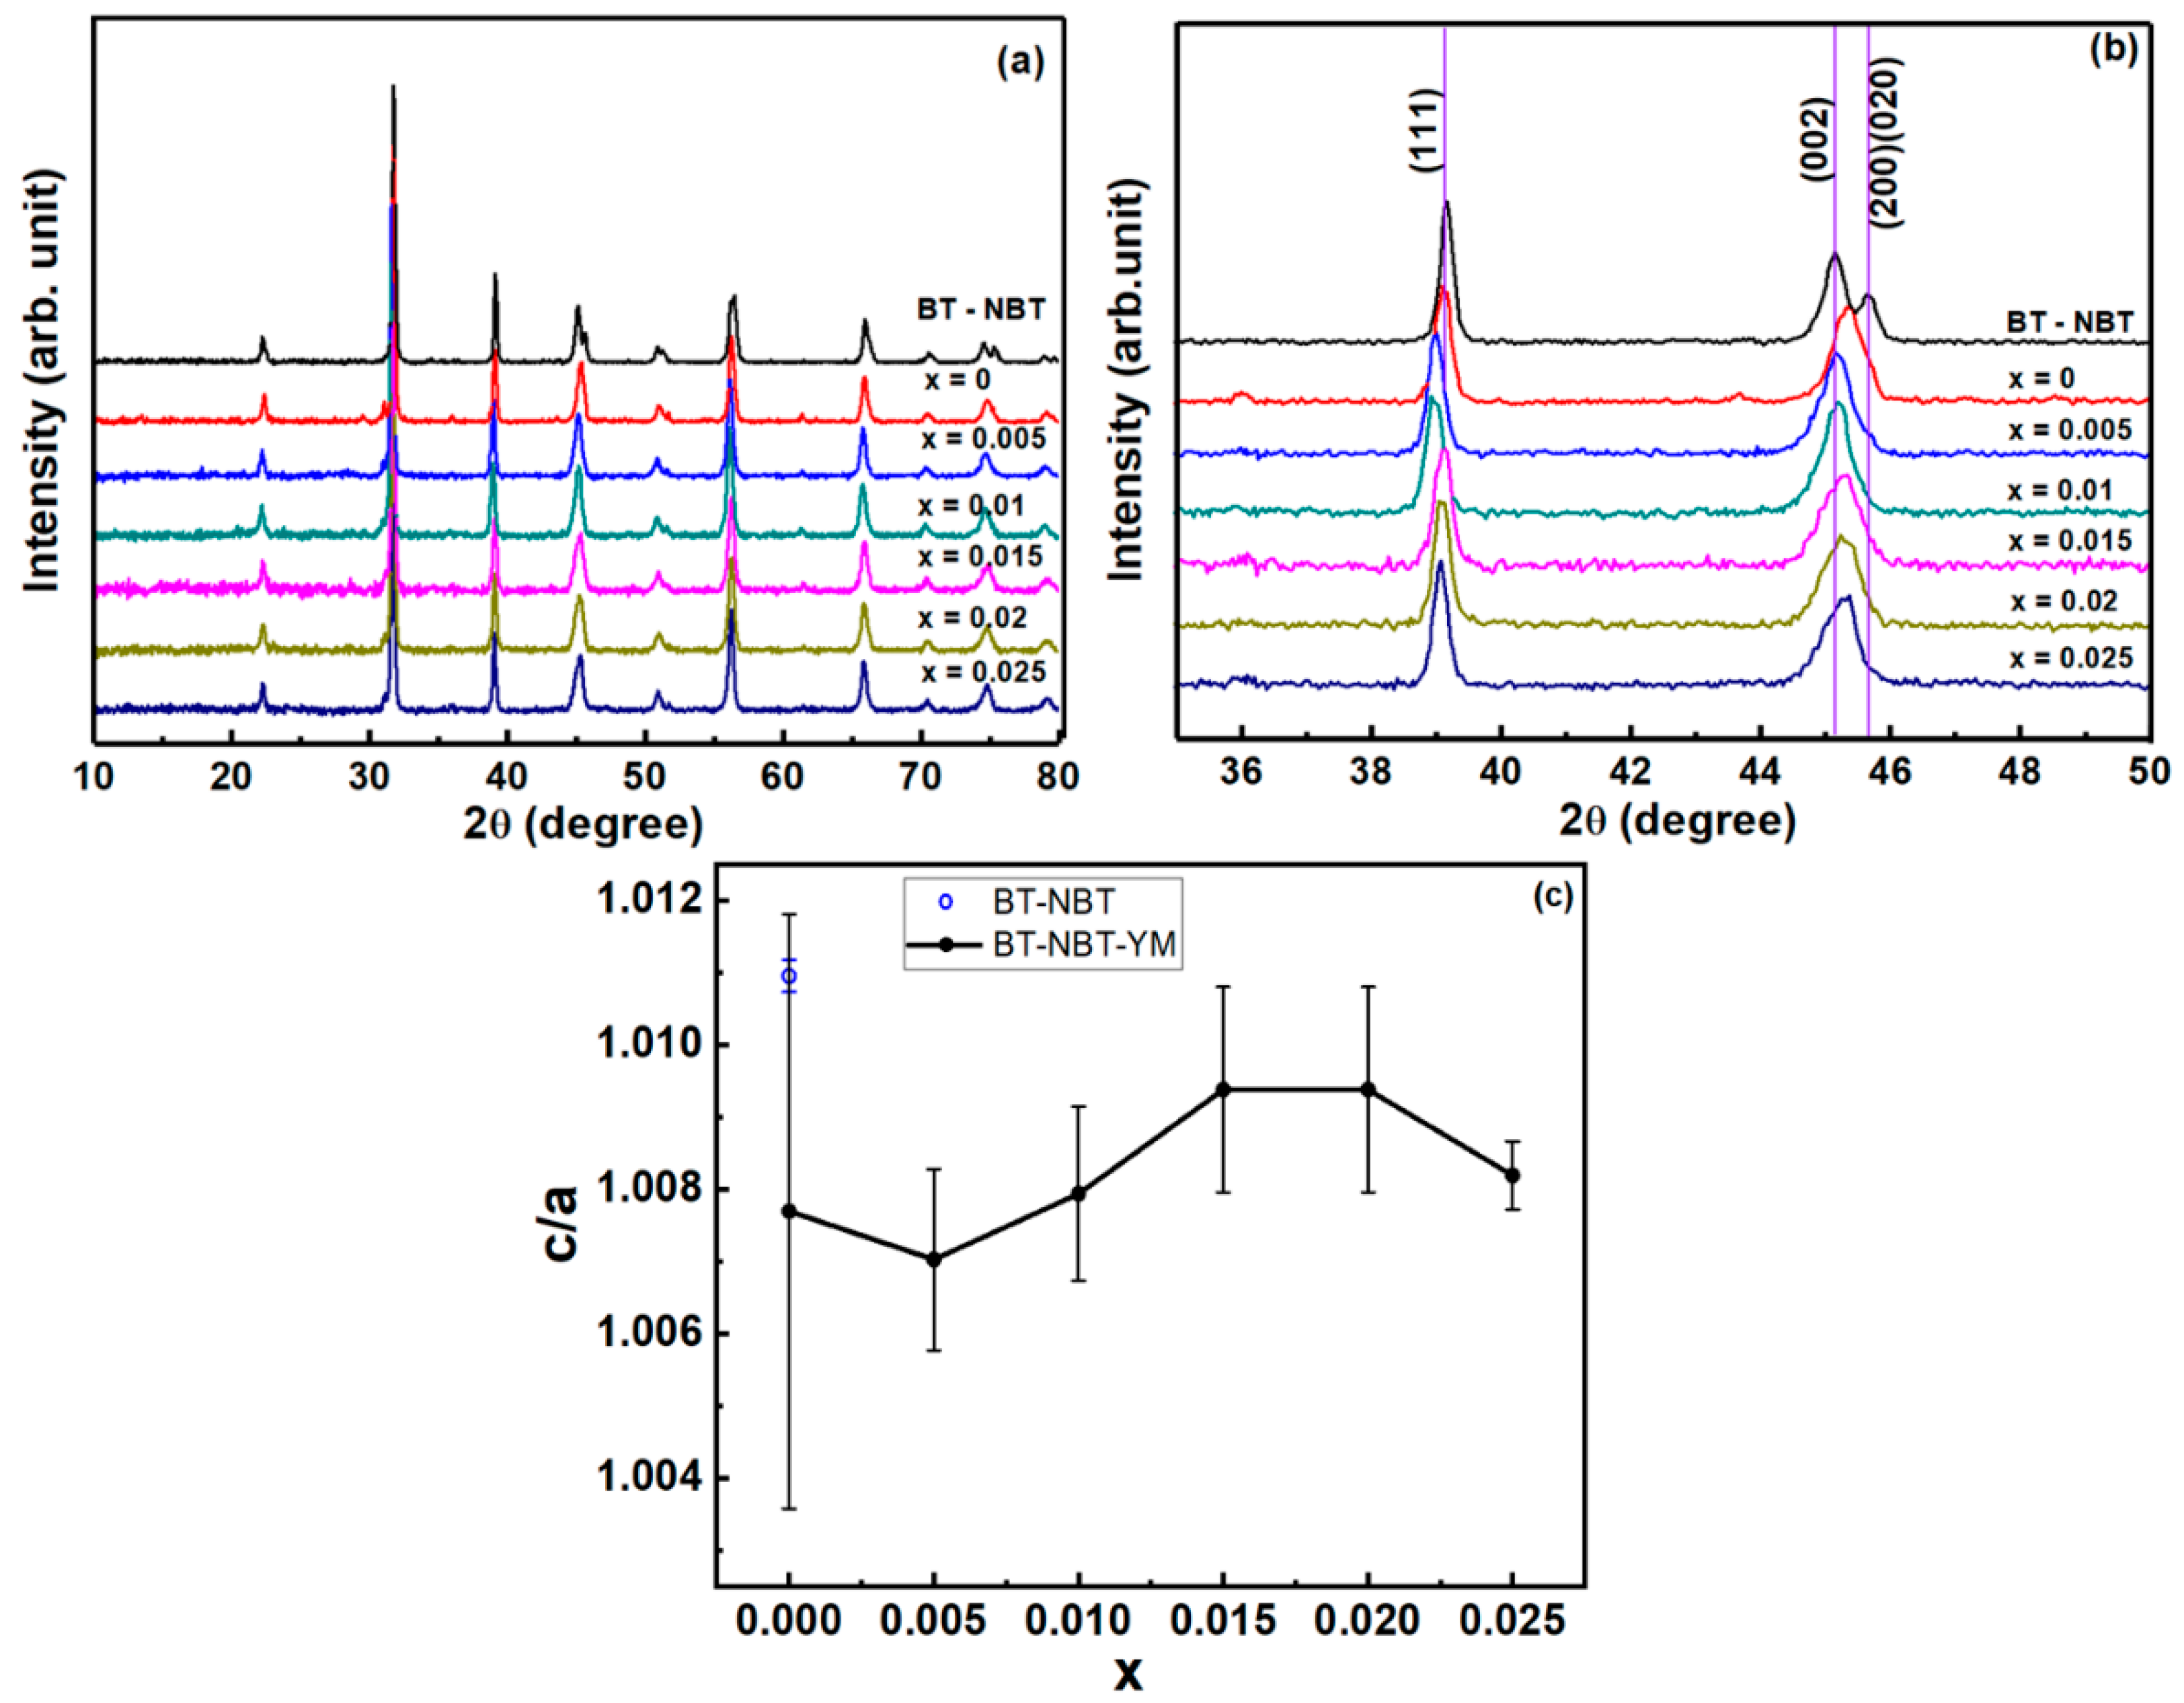
3.1. XRD and the Phase
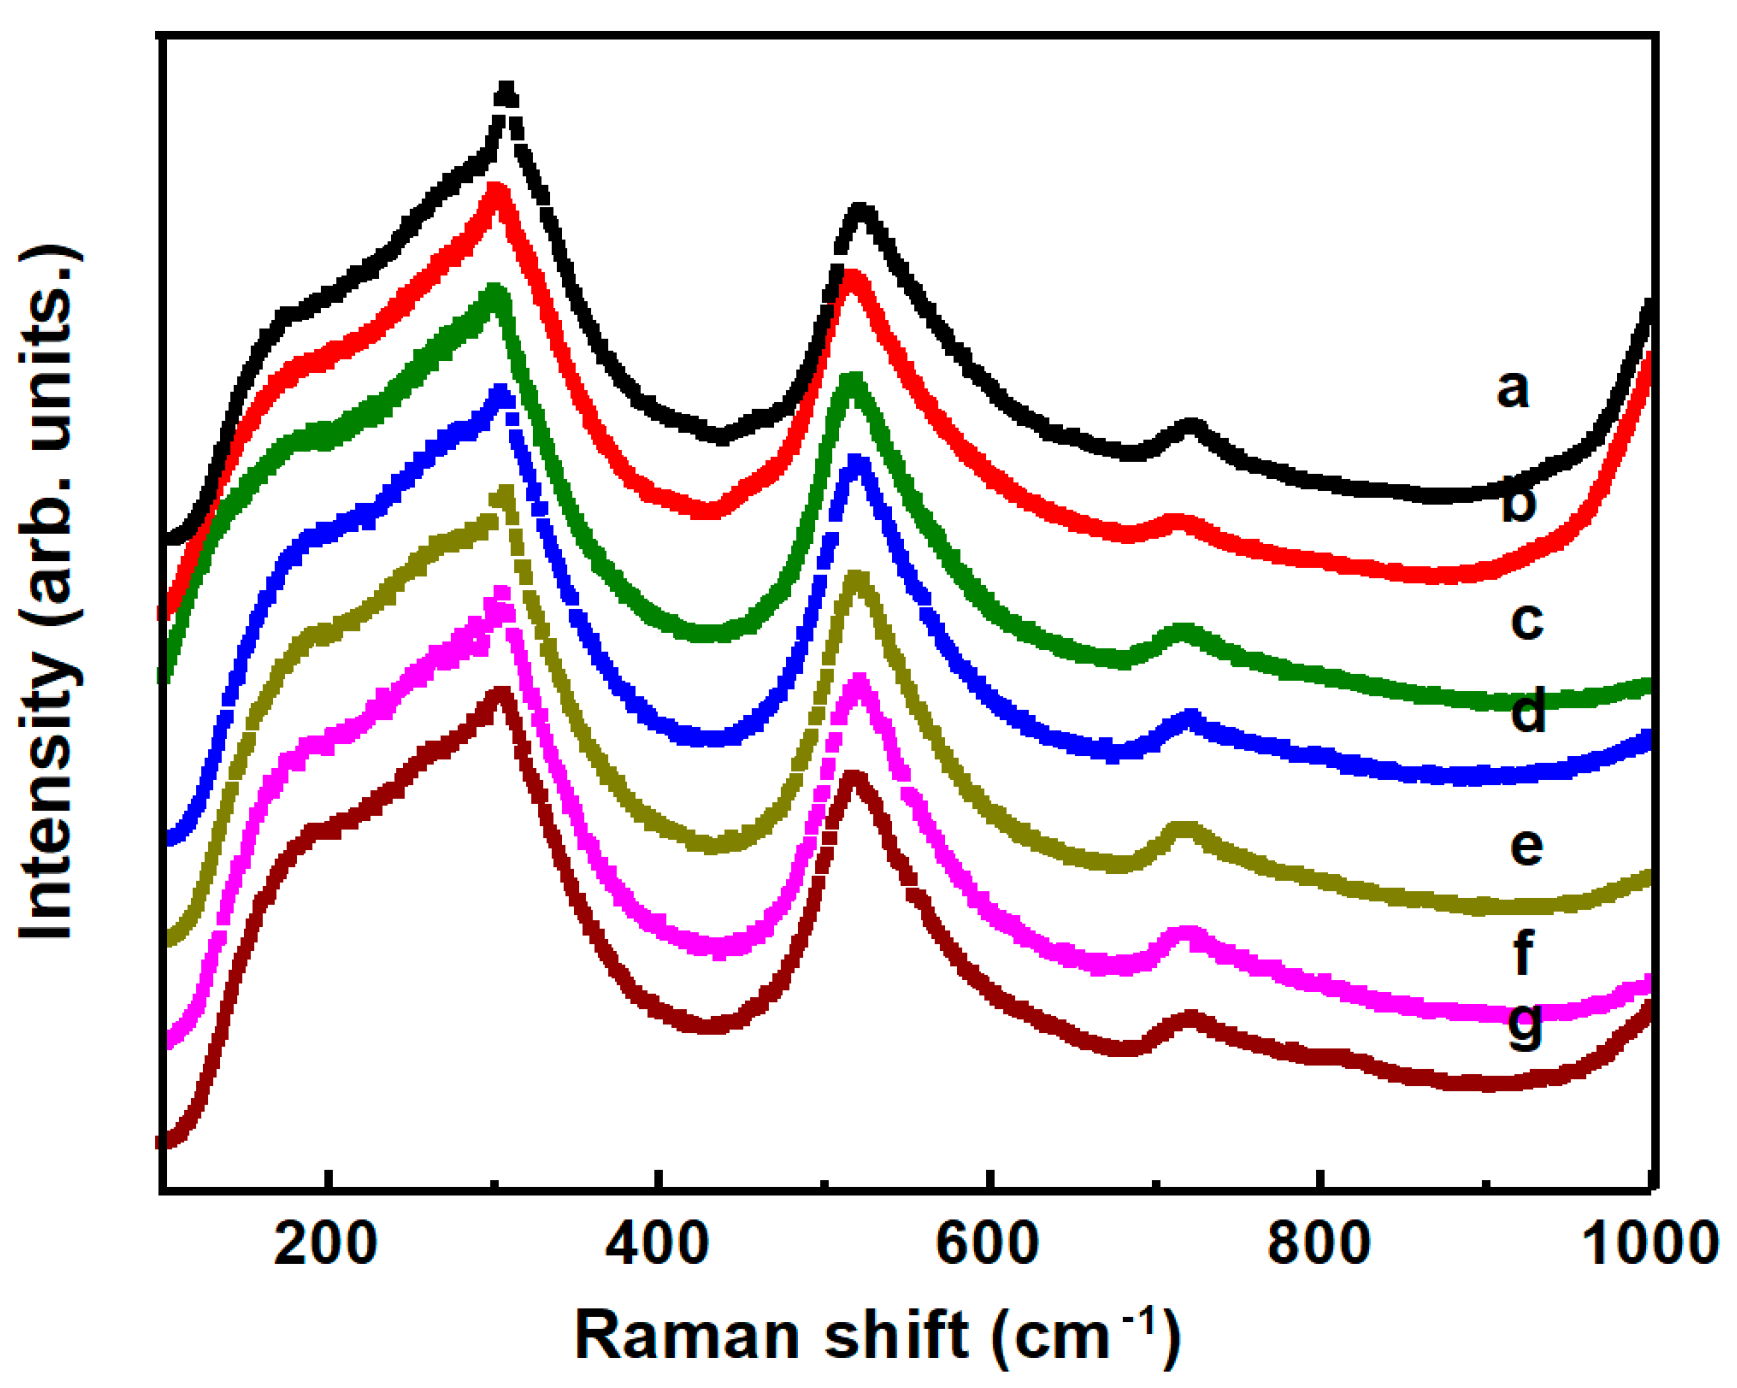
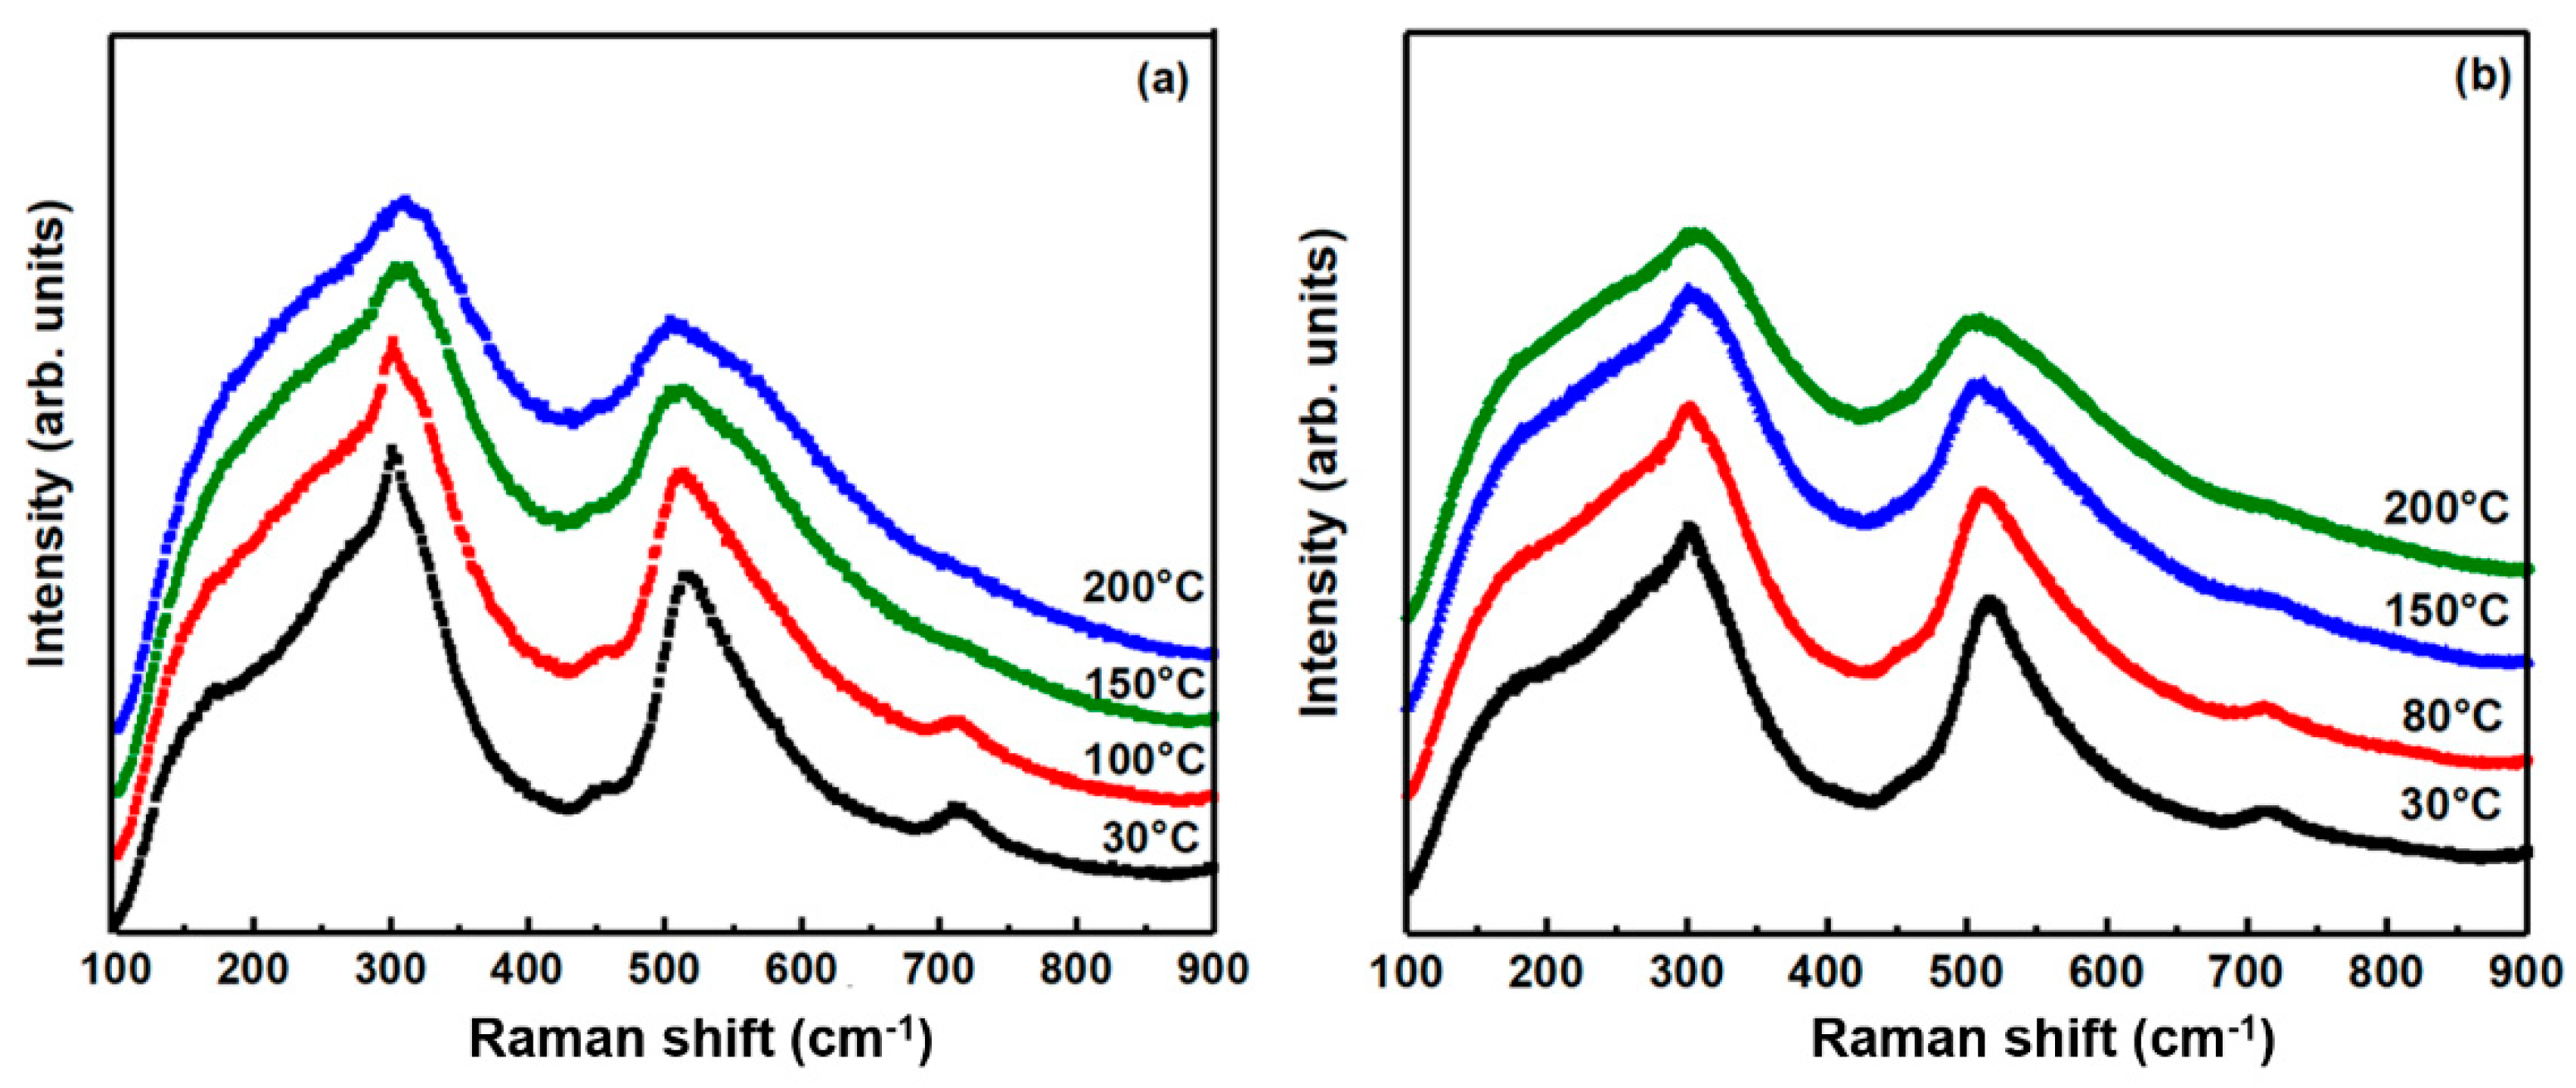
The XRD patterns of BT-NBT-YM samples at room-temperature are shown in Figure 1. Generally, the symmetry of BT-ceramics is tetragonal or cubic/pseudo-cubic nearby room temperature. The difference between them is the relation of cell parameters a, b and c (tetragonality c/a ratio), which gives an “overlapped” peak for the (n00) (0n0) (00n) reflections with the same n in cubic phase but two peaks [(n00) (0n0) peak and (00n) peak] in the tetragonal one. The c/a = 1 for an ideal cubic phase and c/a > 1 for tetragonal BT phase. However, for c/a ≈ 1, it is hard to recognize between tetragonal and cubic ones, which are considered as a pseudo-cubic phase. The undoped BT-NBT ceramics give an obvious tetragonal perovskite structure with separated (200) (020) peak and (002) peak (Figure 1b). The tetragonality c/a of BT-NBT from Pawley refinements (Figure 1c) is 1.011. As YM was added into the system, the (200) (020) peak and (002) peak shift and merge together and the XRD peaks become broadened. Thus, the phase of the BT-NBT system transforms from tetragonal to pseudo-cubic with the “average” tetragonality c/a ≈ 1.008 (Figure 1c). The tetragonality is supposed to dominates the intrinsic dielectric behavior. In our experience, for samples with similar microstructures, the higher tetragonality, the narrower εr′–T relaxing peak. Meanwhile, the size of crystallization domains decreases or more strain is produced, which causes the broadening of the XRD peaks. Hsiang et al. [13] proposed that this agrees with the formation of the core–shell structure in the dielectric grains. Theoretically, the phase and crystal structure of the core and shell parts should be different. However, the crystal structure between them should be quite similar. Considering the effect of peak broadening, it should be hard to distinguish their XRD reflections. Thus, there is no obvious two-phase reflections observed in the XRD measurements.

3.2. Raman Spectra

The room temperature depolarized Raman spectra of BT-NBT and BT-NBT-YM ceramics are plotted in Figure 2. All the spectra show similar characteristic, which means a similar symmetry of the samples. According to the selection rule, BT with cubic symmetry does not have first-order Raman active mode, whilst BT with tetragonal symmetry (P4mm, #99) has the eight first-order Raman active modes (3A1 + B1 + 4E). The broad modes locate at ~118, 152, 188, 289, 509, and 737 cm−1 mean a local symmetry fluctuation in the cubic background (pseudo-cubic). Refer to results of Ba(ZrxTi1−x)O3 [20] and (Ba1−xSrx)TiO3 ceramics [21], we assigned the four obvious Raman modes at 170, 307, 521, and 718 cm−1 to A1(TO1), E(TO2), A1(TO3), and A1(LO3) modes, respectively.
The temperature-dependent Raman spectra of BT-NBT and BT-NBT-YM (x = 0.015) ceramics are plotted in Figure 3. Generally, all the Raman peaks are broadened during the heating. The E(TO2) mode at ~307 cm−1 is considered to be the key modes associates with the tetragonal-cubic phase transition [22] in complex-perovskites and a decreasing intensity is observed as the temperature increases. Thus, a slow phase transition (from low symmetry to high symmetry) occurs with the increase of temperature. The Raman spectra of BT-NBT and BT-NBT-YM are quite similar, which means a similar phase transition behavior between them. This agrees with the similar ferroelectric relaxing behavior observed in the followed sections.

3.3. TEM Analysis

Generally, a composite of doped-BaTiO3 with a low Curie temperature (shell) and undoped-BaTiO3 with a high Curie temperature (core) is known to show a flat permittivity over a wide temperature. To confirm the “core–shell” structure in the BT-NBT-YM samples, we investigated the TEM image of a selected sample (x = 0.015). A typical TEM image of the ceramic is shown in Figure 4.
Obvious “core–shell” grains and grain boundaries can be recognized. There are ferroelectric domain patterns (A) in the core region of grain surrounded by paraelectric shell region (B) of grain and grain boundary (C). For the selected grain, the size of the core (A) is 400–600 nm and the thickness of the shell is 60–200 nm. The crystal structure of the core and shell region should be tetragonal phase and cubic/pseudo-cubic phase, respectively. The crystal structure between them should be quite similar and the small size of core region and shell region causes the broadening of their XRD peaks, which makes the character peaks of them hard to be distinguished in the overlapped XRD patterns.

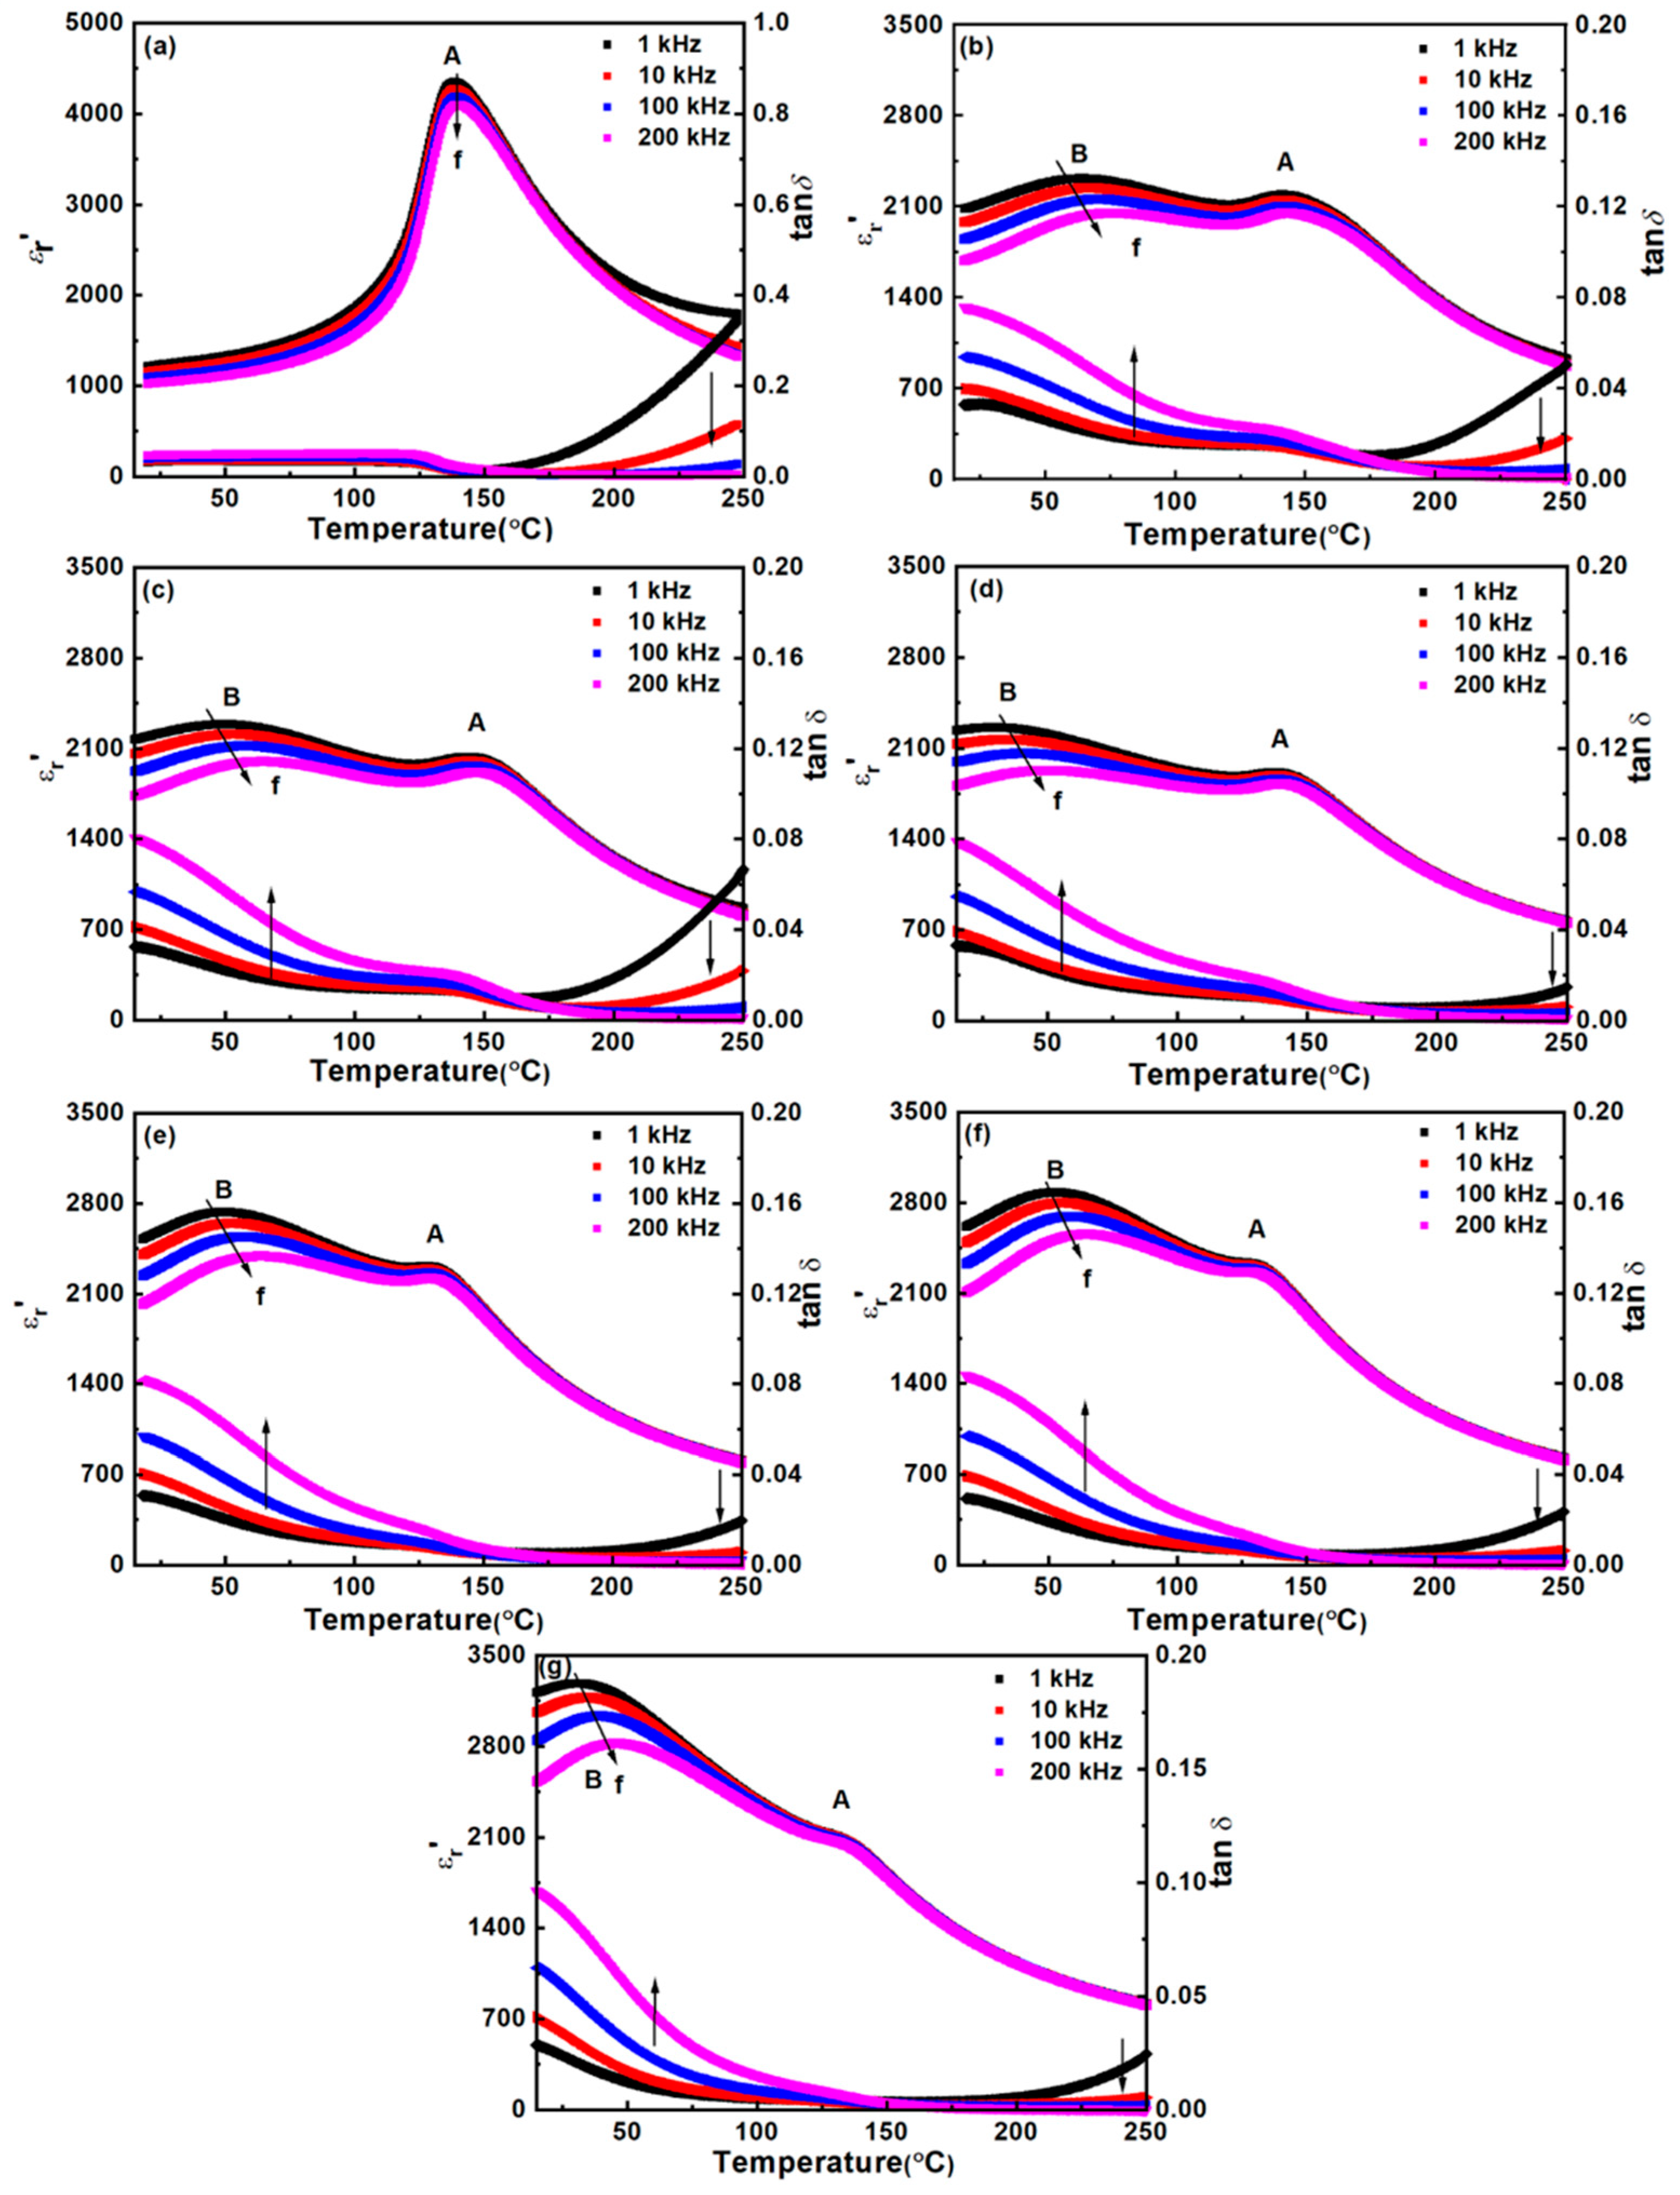
3.4. Dielectric Parameters

The temperature-dependent real permittivity (εr′) and the dielectric loss (tanδ) of the BT-NBT-YM samples are shown in Figure 5, and the temperature-dependent complex permittivity (εr* = εr′ − jεr″) of samples are shown in Figure S1 in the supplementary information (SI). For the BT-NBT sample (Figure 5a and Figure S1a), it shows typical ferroelectric relaxor behavior. There is a broad peak at ~140 °C both in εr′–T (labelled as “A” in Figure 5a) and εr″–T curve. With the increase of frequency, the real εr′–T peak slightly decreases but the imaginary εr″–T peak slightly increases. The loss tanδ increases with the increase of frequency at lower T (<180 °C) but the decreases with the increase of frequency at higher T (>180 °C). The dielectric loss at higher and lower temperature here is named as tanδ′ and tanδ″, respectively. The tanδ″ is almost independent with T but the tanδ′ is greatly influenced by temperature T.
As 1.5 mol % Yb2O3 was added into the BT-NBT (BT-NBT-Yb2O3), the peak “A” decreases from ~4000 to ~2000 and a new broad dielectric peak (labelled as “B” in Figure 5b) with an equivalent maximum (εr′~2300) appears in εr′–T curve. The two-peak like behavior is also observed in the εr″–T curve (Figure S1b). Similarly, the real εr′–T peaks (both A and B) slightly decrease but the imaginary εr″–T peaks slightly increase with the increase of frequency, which means that both are ferroelectric relaxor responses. As MgO was added to the Yb2O3-BT-NBT forming BT-NBT-YM, the dielectric behavior is similar to that of Yb2O3-BT-NBT system. With the increase of x (MgO), the dielectric peak “A” almost keeps unchanged (~2200). However, the peak “B” shifts to lower temperature for x ≤ 0.01 with the position almost unchanged but the maximum increases for x ≥ 0.015, e.g., εr′ = 2300 at 325 K for x = 0.005, εr′ = 1900 at 323 K for x = 0.01, and εr′ = 2500 at 330 K for x = 0.02, at 200 kHz. Thus, YM significantly improves the ferroelectric relaxing performance. The dielectric loss especially tanδ′ decreases at x ≤ 0.01 but keeps almost unchanged at x ≥ 0.015. Sample 0.92BaTiO3-0.08(Na0.5Bi0.5)TiO3-0.015Yb2O3-0.005MgO and 0.92BaTiO3-0.08(Na0.5Bi0.5)TiO3-0.015Yb2O3-0.01MgO give the best ferroelectric relaxor behavior, which give an εr′ variation within ± 14% and ± 10% in 20–165 °C at 200 kHz.
Refer to the studies reported on BT-based dielectric materials and our XRD, TEM, and Raman results, the observed εr′–T behavior of BT-NBT-YM here should be caused by the “core–shell” microstructure. The broad permittivity temperature characteristics should be originated from the compositional inhomogeneity in grains, the dielectric behavior should be a superposition of the characteristics of ferroelectric grain core (peak A), paraelectric grain shell (peak B) and concentration gradient region between them according to ref. [23], Jeon et al., also proposed a solution–precipitation mechanism to explain the microstructure formation process, in which the shell is a result of the precipitation of dopants (Yb2O3 and MgO in this study) from the liquid matrix containing BT-NBT during sintering, and the core region is essentially large BT-NBT grains. Though it is not distinguished in our XRD analysis for BT-NBT-YM samples due to the sensitivity and peak broadening, the samples should be in a complex subtle inhomogeneous microstructure and the tetragonality of core should be larger than that of the shell. Thus, for the observed εr′–T behaviors, the peak A should be dominated by the ferroelectric core (mainly BT-NBT, region A in Figure 4), which is less affected by the increasing of MgO. The peak B should be dominated by the shell (BT-NBT with more Yb2O3 and MgO, solid solution or composite, region B in Figure 4), which is significantly affected by the MgO-Yb2O3. As the shell is similar to the core but with a slightly different composition to that of the core, it gives a transition εr′-T peaks similar to that of the core but the peak at a lower T than that of the core (peak A). Both theoretical and experimental details on the mechanism of the ferroelectric relaxation of BT-NBT-YM need to be investigated in our future studies.

4. Conclusions

1.5% Yb2O3-x mol MgO doped 0.92BaTiO3-0.08(Na0.5Bi0.5)TiO3 ceramics with x = 0.0–0.025 are prepared by the solid state reaction method. The ceramics were analyzed by x-ray diffractions, dielectric measurements, TEM and Raman spectra. As Yb2O3-MgO added, the phase changes from tetragonal to pseudo-cubic, with the tetragonality c/a decreases from 1.011 to 1.008 and XRD peaks broadened obviously. There is a slow phase transition with the temperature changed from variable temperature Raman measurements and core–shell grain microstructures with core of 400–600 nm and a shell of 60–200 nm thickness is observed. A new broad peak in temperature dependent dielectric constant curve is also observed as Yb2O3–MgO added into the 0.92BaTiO3-0.08(Na0.5Bi0.5)TiO3, which improves the overall relaxor behavior. Sample 0.92BaTiO3-0.08(Na0.5Bi0.5)TiO3-0.015Yb2O3-0.005MgO and 0.92BaTiO3-0.08(Na0.5Bi0.5)TiO3-0.015Yb2O3-0.01MgO give the best ferroelectric relaxor behavior, which give an εr′ variation within ± 14% and ± 10% in 20–165 °C.

Supplementary Materials

The following are available online at https://www.mdpi.com/article/10.3390/ma14226802/s1, Figure S1: Temperature-dependent permittivity (εr* = εr′ − jεr) of the BT-NBT-YM samples at different frequencies.

Author Contributions

Investigation, writing—original draft preparation, X.-H.R.; Conceptualization, methodology, investigation, validation, resources, formal analysis, data curation, writing— review and editing, D.-Y.G. All authors have read and agreed to the published version of the manuscript.

Funding

This research received no external funding.

Institutional Review Board Statement

Not applicable.

Informed Consent Statement

Not applicable.

Conflicts of Interest

There is no conflict of interest.

References

  1. Haertling, G.H. Ferroelectric Ceramics: History and Technology. J. Am. Ceram. Soc. 1999, 82, 797–818. [Google Scholar] [CrossRef]
  2. Pan, M.; Randall, C.A. A brief introduction to ceramic capacitors. IEEE Electr. Insul. Mag. 2010, 26, 44–50. [Google Scholar] [CrossRef]
  3. Yuan, Y.; Du, M.; Zhang, S.; Pei, Z. Effects of BiNbO4 on the microstructure and dielectric properties of BaTiO3-based ceramics. J. Mater. Sci. Mater. Electron. 2009, 20, 157–162. [Google Scholar] [CrossRef]
  4. Tian, H.Y.; Qi, J.Q.; Wang, Y.; Wang, J.; Chan, H.L.W.; Choy, C.L. Core-shell structure of nanoscaled Ba0.5Sr0.5TiO3 self-wrapped by MgO derived from a direct solution synthesis at room temperature. Nanotechnology 2004, 16, 47–52. [Google Scholar] [CrossRef]
  5. Park, J.S.; Han, Y.H. Effects of MgO coating on microstructure and dielectric properties of BaTiO3. J. Eur. Ceram. Soc. 2007, 27, 1077–1082. [Google Scholar] [CrossRef]
  6. Li, L.-X.; Han, Y.-M.; Zhang, P.; Ming, C.; Wei, X. Synthesis and characterization of BaTiO3-based X9R ceramics. J. Mater. Sci. 2009, 44, 5563–5568. [Google Scholar] [CrossRef]
  7. Kim, C.-H.; Park, K.-J.; Yoon, Y.-J.; Hong, M.-H.; Hong, J.-O.; Hur, K.-H. Role of yttrium and magnesium in the formation of core-shell structure of BaTiO3 grains in MLCC. J. Eur. Ceram. Soc. 2008, 28, 1213–1219. [Google Scholar] [CrossRef]
  8. Chazono, H.; Kishi, H. Sintering Characteristics in the BaTiO3–Nb2O5–Co3O4 Ternary System: II, Stability of So-called “Core–Shell” Structure. J. Am. Ceram. Soc. 2008, 83, 101–106. [Google Scholar] [CrossRef]
  9. Hennings, D.F.K.; Schreinemacher, B.S. Temperature-stable dielectric materials in the system BaTiO3-Nb2O5-Co3O4. J. Eur. Ceram. Soc. 1994, 14, 463–471. [Google Scholar] [CrossRef]
  10. Park, Y.; Song, S.A. Influence of core-shell structured grain on dielectric properties of cerium-modified barium titanate. J. Mater. Sci. Mater. Electron. 1995, 6, 380–388. [Google Scholar] [CrossRef]
  11. Tian, Z.; Wang, X.; Zhang, Y.; Fang, J.; Song, T.-H.; Hur, K.H.; Lee, S.; Li, L. Formation of Core-Shell Structure in Ultrafine-Grained BaTiO3-Based Ceramics Through Nanodopant Method. J. Am. Ceram. Soc. 2010, 93, 171–175. [Google Scholar] [CrossRef]
  12. Yasukawa, K.; Nishimura, M.; Nishihata, Y.; Mizuki, J.I. Core–Shell Structure Analysis of BaTiO3 Ceramics by Synchrotron X-Ray Diffraction. J. Am. Ceram. Soc. 2007, 90, 1107–1111. [Google Scholar] [CrossRef]
  13. Hennings, D.; Rosenstein, G. Temperature-Stable Dielectrics Based on Chemically Inhomogeneous BaTiO3. J. Am. Ceram. Soc. 1984, 67, 249–254. [Google Scholar] [CrossRef]
  14. Hsiang, H.-I.; Mei, L.-T.; Chun, Y.-J. Dielectric Properties and Microstructure of Nb-Co Codoped BaTiO3–(Bi0.5Na0.5)TiO3 Ceramics. J. Am. Ceram. Soc. 2009, 92, 2768–2771. [Google Scholar] [CrossRef]
  15. Shen, Z.; Wang, X.; Li, L. Dielectric properties and microstructures of Ta-doped BaTiO3–(Bi0.5Na0.5)TiO3 ceramics for X9R applications. J. Mater. Sci. Mater. Electron. 2017, 28, 3768–3773. [Google Scholar] [CrossRef]
  16. Datta, K.; Thomas, P.; Roleder, K. Anomalous Phase Transitions of Lead-Free Piezoelectric xNa0.5Bi0.5TiO3-(1-x)BaTiO3 Solid Solutions With Enhanced Phase Transition Temperatures. Phys. Rev. B 2010, 82, 224105. [Google Scholar] [CrossRef]
  17. Gao, L.; Huang, Y.; Hu, Y.; Du, H. Dielectric and ferroelectric properties of (1−x)BaTiO3–xBi0.5Na0.5TiO3 ceramics. Ceram. Int. 2007, 33, 1041–1046. [Google Scholar] [CrossRef]
  18. Chen, L.; Hui, K.; Wang, H.; Zhao, P.; Li, L.; Wang, X. Effects of Ho2O3 doping and sintering temperature on the core-shell structure of X9R Nb-modified BaTiO3-(Bi0.5Na0.5)TiO3 ceramics. J. Eur. Ceram. Soc. 2019, 39, 3710–3715. [Google Scholar] [CrossRef]
  19. Wang, H.; Li, Q.; Jia, Y.; Yadav, A.K.; Yan, B.; Shen, Q.; Li, M.; Quan, Q.; Fan, H. Enhanced dielectric temperature stability and energy-storage properties of (Y0.5Nb0.5)4+ co-doped (Bi0.5Na0.5)0.94Ba0.06TiO3 lead-free relaxor ceramics. J. Mater. Sci. 2021, 56, 14672–14683. [Google Scholar] [CrossRef]
  20. Dobal, P.S.; Dixit, A.; Katiyar, R.S.; Yu, Z.; Guo, R.; Bhalla, A.S. Micro-Raman scattering and dielectric investigations of phase transition behavior in the BaTiO3–BaZrO3 system. J. Appl. Phys. 2001, 89, 8085–8091. [Google Scholar] [CrossRef]
  21. Kumar, A.; Rivera, I.; Katiyar, R.S. Investigation of local structure of lead-free relaxor Ba(Ti0.70Sn0.30)O3 by Raman spectroscopy. J. Raman. Spectrosc. 2009, 40, 459–462. [Google Scholar] [CrossRef]
  22. Begg, B.D.; Finnie, K.S.; Vance, E.R. Raman study of the relationship between room-temperature tetragonality and the Curie point of barium titanate. J. Am. Ceram. Soc. 1996, 79, 2666–2672. [Google Scholar] [CrossRef]
  23. Jeon, S.-C.; Lee, C.-S.; Kang, S.-J.L. The Mechanism of Core/Shell Structure Formation during Sintering of BaTiO3-Based Ceramics. J. Am. Ceram. Soc. 2012, 95, 2435–2438. [Google Scholar] [CrossRef]
Figure 1. (a) XRD patterns of BT-NBT and BT-NBT-YM samples, (b) the magnified data for BT-NBT-YM samples, (c) the tetragonality c/a of samples from Pawley refinements.
Materials 14 06802 g001
Figure 2. Raman spectra of pure BT-NBT ceramics and Yb-Mg codoped BT-NBT ceramics at room temperature, where (a) undoped BT-NBT; (b) x = 0; (c) x = 0.005; (d) x = 0.01; (e) x = 0.015; (f) x = 0.02; (g) x = 0.025.
Materials 14 06802 g002
Figure 3. (a) Raman spectra of undoped BT-NBT ceramics at different temperatures; (b) Raman spectra of BT-NBT-YM (x = 0.015) ceramics at different temperatures.
Materials 14 06802 g003
Figure 4. TEM image of BT-NBT-YM ceramic (x = 0.015). A, B, C: the core, shell region of a grain and grain boundary.
Materials 14 06802 g004
Figure 5. Temperature-dependent permittivity (εr′) and the dielectric loss (tanδ) of the BT-NBT-YM samples at different frequencies. (a) BT-NBT, (b) x = 0, (c) x = 0.005, (d) x = 0.01, (e) x = 0.015, (f) x = 0.02, and (g) x = 0.025; A, B indicates the different peaks of εr′–T. f: frequency.
Materials 14 06802 g005
Publisher’s Note: MDPI stays neutral with regard to jurisdictional claims in published maps and institutional affiliations.

