Communication

Laser Desorption/Ionization Mass Spectrometry as a Potential Tool for Evaluation of Hydroxylation Degree of Various Types of Titanium Dioxide Materials

by
Małgorzata Kasperkowiak
1,
Monika Kurowska
2,
Maciej Zalas
2 and
Rafał Frański
2,*
1
Center for Advanced Technology, Adam Mickiewicz University, Uniwersytetu Poznańskiego 10, 61-614 Poznań, Poland
2
Faculty of Chemistry, Adam Mickiewicz University, Uniwersytetu Poznańskiego 8, 61-614 Poznań, Poland
*
Author to whom correspondence should be addressed.
Materials 2021, 14(22), 6848; https://doi.org/10.3390/ma14226848
Submission received: 20 September 2021 / Revised: 25 October 2021 / Accepted: 9 November 2021 / Published: 13 November 2021
(This article belongs to the Section Advanced Materials Characterization)

Abstract

:
For many applications, TiO2 must have a unique surface structure responsible for its desirable physicochemical properties. Therefore the fast and easy methods of TiO2 surface characterization are of great interest. Heated TiO2 samples and dye-modified TiO2 samples were analyzed by laser desorption/ionization mass spectrometry. In the negative ion mode, two types of ions were detected, namely (TiO2)n and (TiO2)nOH. It has been established that the samples can be differentiated based on the relative ion abundances, especially with respect to the free hydroxyl group population. It indicates that laser desorption ionization mass spectrometry has the potential for the investigation of the surface properties of various TiO2 materials.

1. Introduction

TiO2 is one of the world’s most common material, widely used in many fields of science and branches of industry as well as in everyday life. For example, it has been applied as a pigment (e.g., in toothpaste [1]), as semiconductors (e.g., in solar cells [2]), as catalysts (e.g., in biodiesel production [3]), as gas sensors (e.g., as alcohol vapor sensor [4]), etc.
For many of its applications, TiO2 must have a unique surface structure that provides desirable physicochemical properties of TiO2, necessary for its effective use. One of the most important features of the TiO2 surface is the number and distribution of the hydroxyl groups present on it [5,6,7,8,9]. For example, it has been demonstrated and discussed in detail, that the surface hydroxylation degree is of crucial importance for selective adsorption of Cr(VI) [10], photocatalytic oxidation/degradation of methyl ethyl ketone [11], phenolphthalein [12], methyl orange, rhodamine B, p-chlorophenol [13], methylene blue [14], adsorption of CO2, SO2, NO2 [15]. The most common method for the study of surface hydroxylation degree, or more precisely the tool which enables comparison of the TiO2 hydroxylation degrees, is the Fourier-transform infrared spectroscopy (FTIR) [8,9,10,11,12,13,14,15], which sometimes is supported by X-ray photoelectron spectroscopy (XPS), temperature-programmed desorption or surface acid–base ion-exchange reactions method [7,10,13].
A specific TiO2 application is in the mass spectrometry, namely as a substrate (solid matrix) in the surface-assisted laser desorption/ionization mass spectrometry [16,17,18,19]. There are also a number of papers reporting TiO2 surface modification or generation of interesting gas-phase titanium-oxide clusters by subjectingTiO2 surface to laser beam action [20,21,22,23,24]. The goal of this work is to check if laser desorption/ionization mass spectrometry (LDI-MS) may be used for TiO2 surface characterization, namely to evaluate the TiO2 hydroxylation degree. For this purpose, the samples of TiO2 prepared at different temperatures and dye-modified TiO2 samples have been analyzed by LDI-MS.

2. Materials and Methods

Samples of heated TiO2 were prepared by solvothermal hydrolysis of titanium tetraisopropoxide (Aldrich, Poznań, Poland) and heating (calcination) of the obtained material at different temperatures (100, 200, 300, 400, 500 and 600 °C) according to the procedure described elsewhere [25]. The obtained samples were characterized by FT-IR spectra recorded on an IFS-66/s spectrometer (Bruker, Billerica, MA, USA) using KBr powder as a diluent.
The dye-modified TiO2 samples were prepared from commercially available P25 TiO2 Aeroxide (Evonik, Essen, Germany) by using four different dyes (Scheme 1) according to the procedure described elsewhere [26,27,28].
The LDI TOF MS (laser desorption/ionization time of flight mass spectrometry, was used to generate the gas-phase clusters. Portions of 1 µL of TiO2 suspension in methanol, were spotted onto the target (MTP 384 ground steel, Bruker Daltonics, Bremen, Germany). During MS experiments, an Ultraflex TOF/TOF spectrometer (Bruker Daltonics, Bremen, Germany) was operated in reflection mode (both positive and negative) in the range of m/z 50–1500. For m/z > 1000, the clusters were characterized by low intensity. This spectrometer is equipped with a SmartBeam II laser (λ = 355 nm). Metastable fragmentation of selected ions was induced by laser without further use of collision gas. The LIFT technology was employed [29]. The software flexControl v.3.4 was used for data acquisition and collection, whereas flexAnalysis v.3.4 was used for data manipulation, evaluation, and processing.

3. Results and Discussion

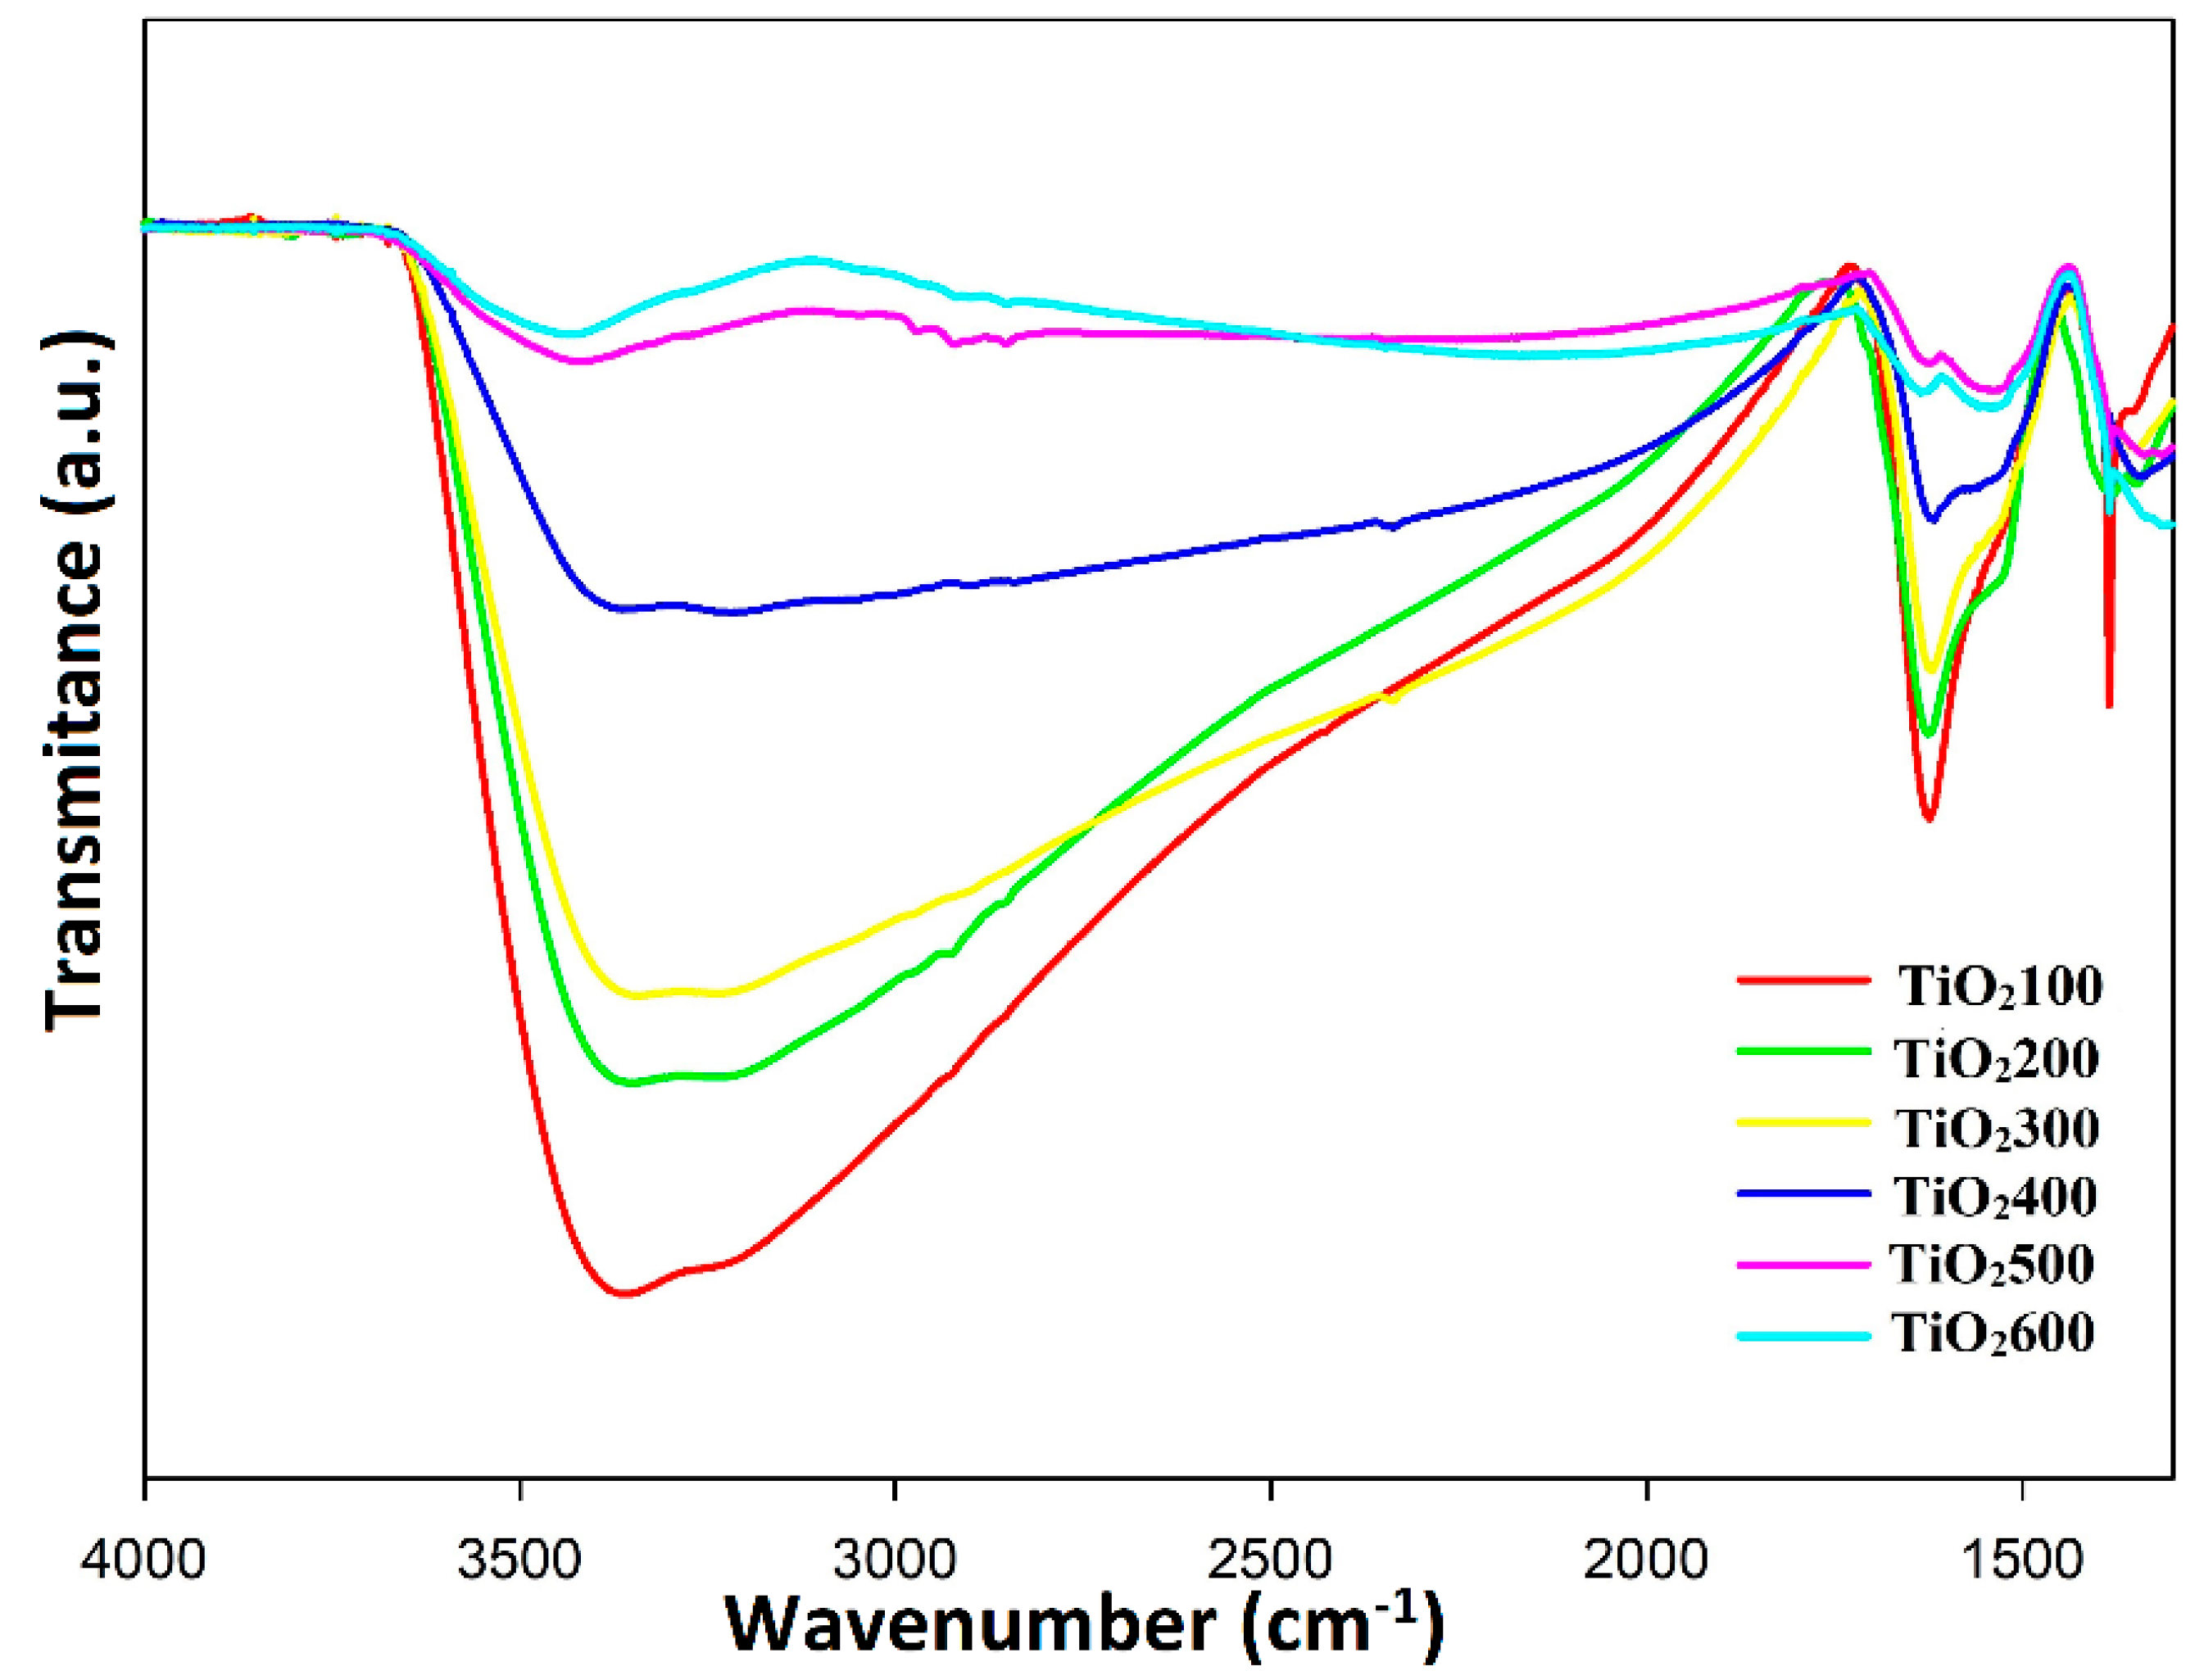
Figure 1 shows the FTIR spectra of heated TiO2 samples. The intensities of the absorption bands at about 3400 and 1630 cm−1 indicate that the number of hydroxyl groups decreases in the order TiO2100 > TiO2200 > TiO2300 >> TiO2400 >> TiO2500 ≅ TiO2600.
The heating of TiO2 affects not only the hydroxylation degree, but also a number of other surface parameters, e.g., surface area, pore-volume, surface morphology, oxygen and titanium vacancies, surface roughness, surface micro-topography, etc. [30,31,32,33,34]. These parameters have a minor influence on the FTIR spectra, but may significantly affect the LDI mass spectra (which is easy to justify). Furthermore, the ions observed under LDI conditions are not only a result of the laser desorption/ionization process but also of the processes which occur in the laser plume containing energetic ions, neutrals, and electrons (in this hot cloud of particles, a number of gas-phase reactions can occur). Therefore, the key question is if moderate differences in the surface chemical composition, e.g., the hydroxylation degree, are reflected on the LDI mass spectra.
Figure 2 shows the LDI mass spectrum of TiO2400, obtained in the negative ion mode, in the m/z range 50–200 and 200–1000 (for clarity), as a representative example. The other LDI mass spectra are shown in the Supplementary Material (Figures S1 and S2). Thanks to the characteristic isotope signals (e.g., Figure S3), the titanium-containing ions can be easy identified and the lack of the characteristic isotope signals of titanium indicates that we deal with background/contaminant ions (e.g., that at m/z 113 most probably corresponds to [(HCOO)2Na], since formic acid is a common contamination of methanol, other contaminant ions may be PO3 at m/z 79, CH3SO3 at m/z 95, H2PO4 and HSO4, both at m/z 97, [35]). Two types of titanium-containing ions were identified, namely (TiO2)n and (TiO2)nOH (the formers are open-shell ions). It is clearly seen that with increasing n, we deal with a decrease in the (TiO2)nOH/(TiO2)n ratio. It may be justified by the relative electron affinities of (TiO2)nOH and (TiO2)n [5]. The key question is if the observed relative abundances of the titanium-containing ions depend on the surface properties of TiO2 samples subjected to the LDI process. The presence of OH-containing ions suggests that it may be possible to correlate the ion abundances with the hydroxylation degree of the TiO2 surface.
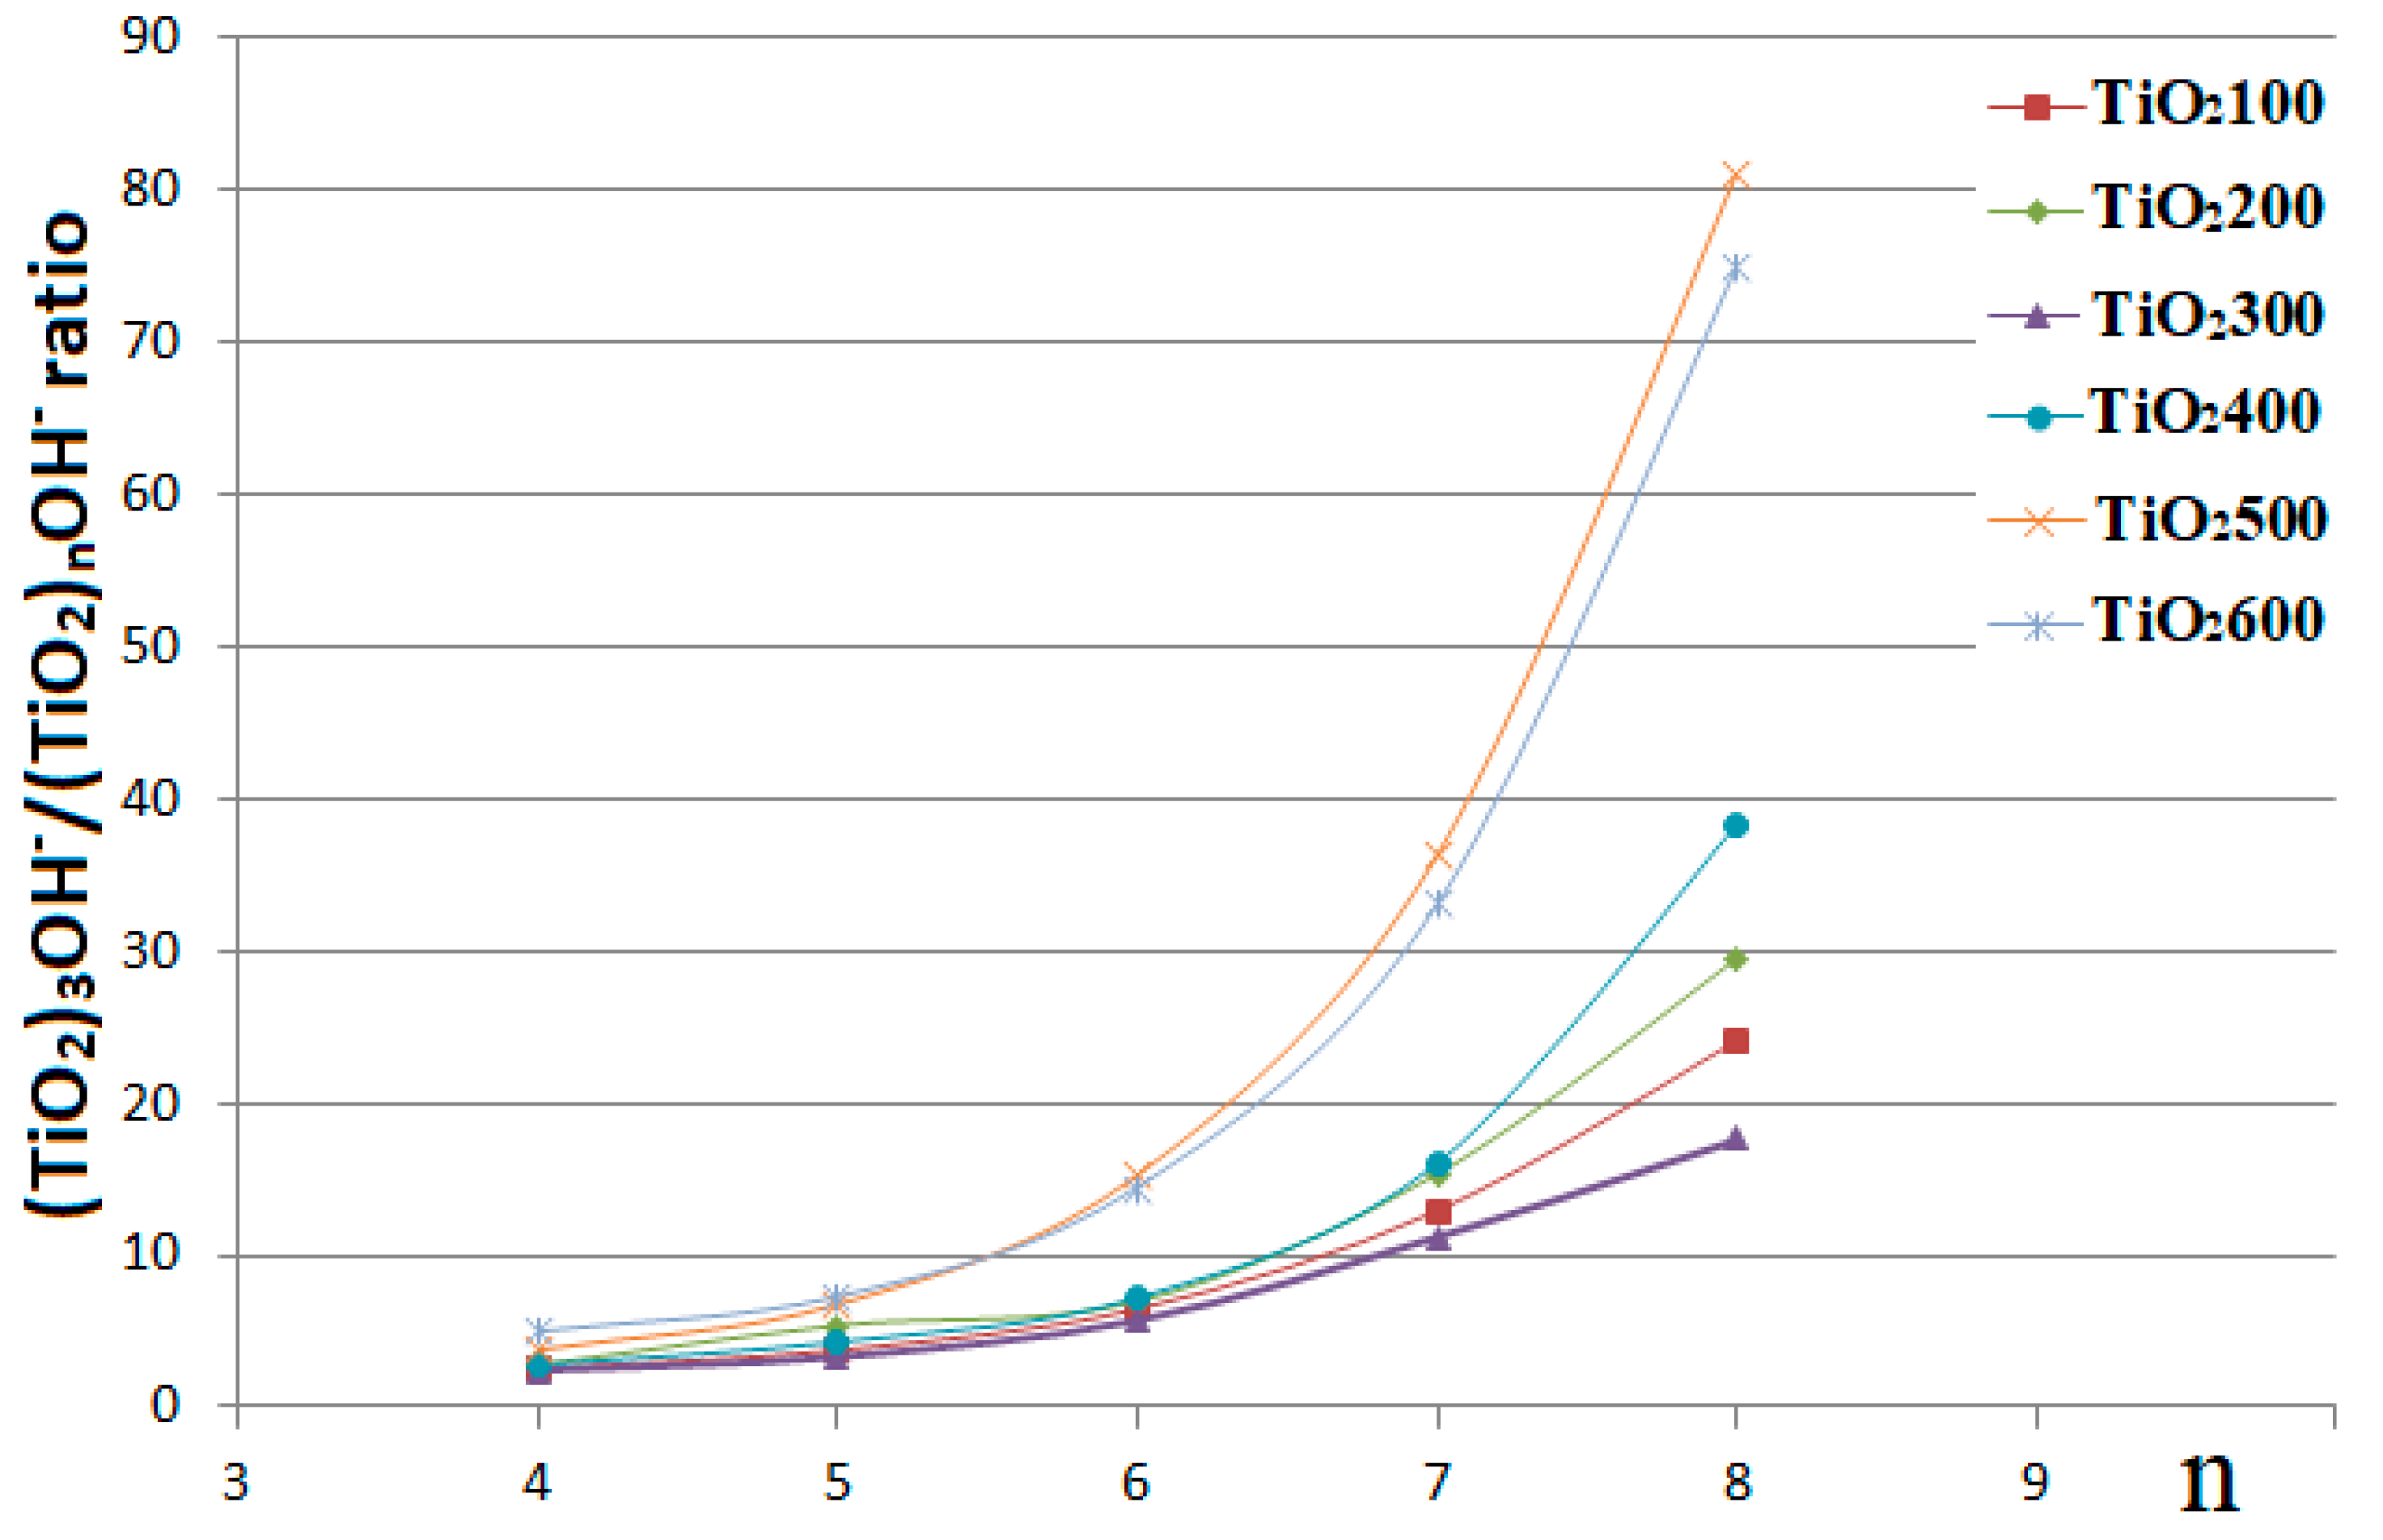
The heating of the TiO2 results in an increase of particle size [25]; thus, it is expected that for TiO2 samples heated at higher temperatures, the ion abundances at a higher m/z range will be higher. However, the opposite situation was observed. It is visible that for TiO2 samples heated at higher temperatures, the ion abundances at a higher m/z range are lower (Figure S2). Thus, it is plausible that this phenomenon may depend on the surface hydroxylation degree. Figure 3 shows the breakdown plots of the (TiO2)3OH/(TiO2)nOH ratio against the n number ((TiO2)3OH is an abundant ion at m/z 257, (the ions TiO2OH and (TiO2)2OH have similar abundances as (TiO2)3OH). Except for the TiO2300 plot, the obtained plots, shown in Figure 3, reflect very well the hydroxylation degree, analogically as the FTIR spectrum shown in Figure 1.
It is worth adding that sometimes the desired specific properties of TiO2 can be obtained by its calcination at a given temperature. For example, the highest photocatalytic activity of TiO2 calcinated at 300 °C was attributed to the fact that at 300 °C the best trade-off between a few surface properties (including surface hydroxyl groups population) was reached [11]. In our case (Figure 3), it is clear that the surface properties of TiO2300 are responsible for the specific plot which deviates from the others.
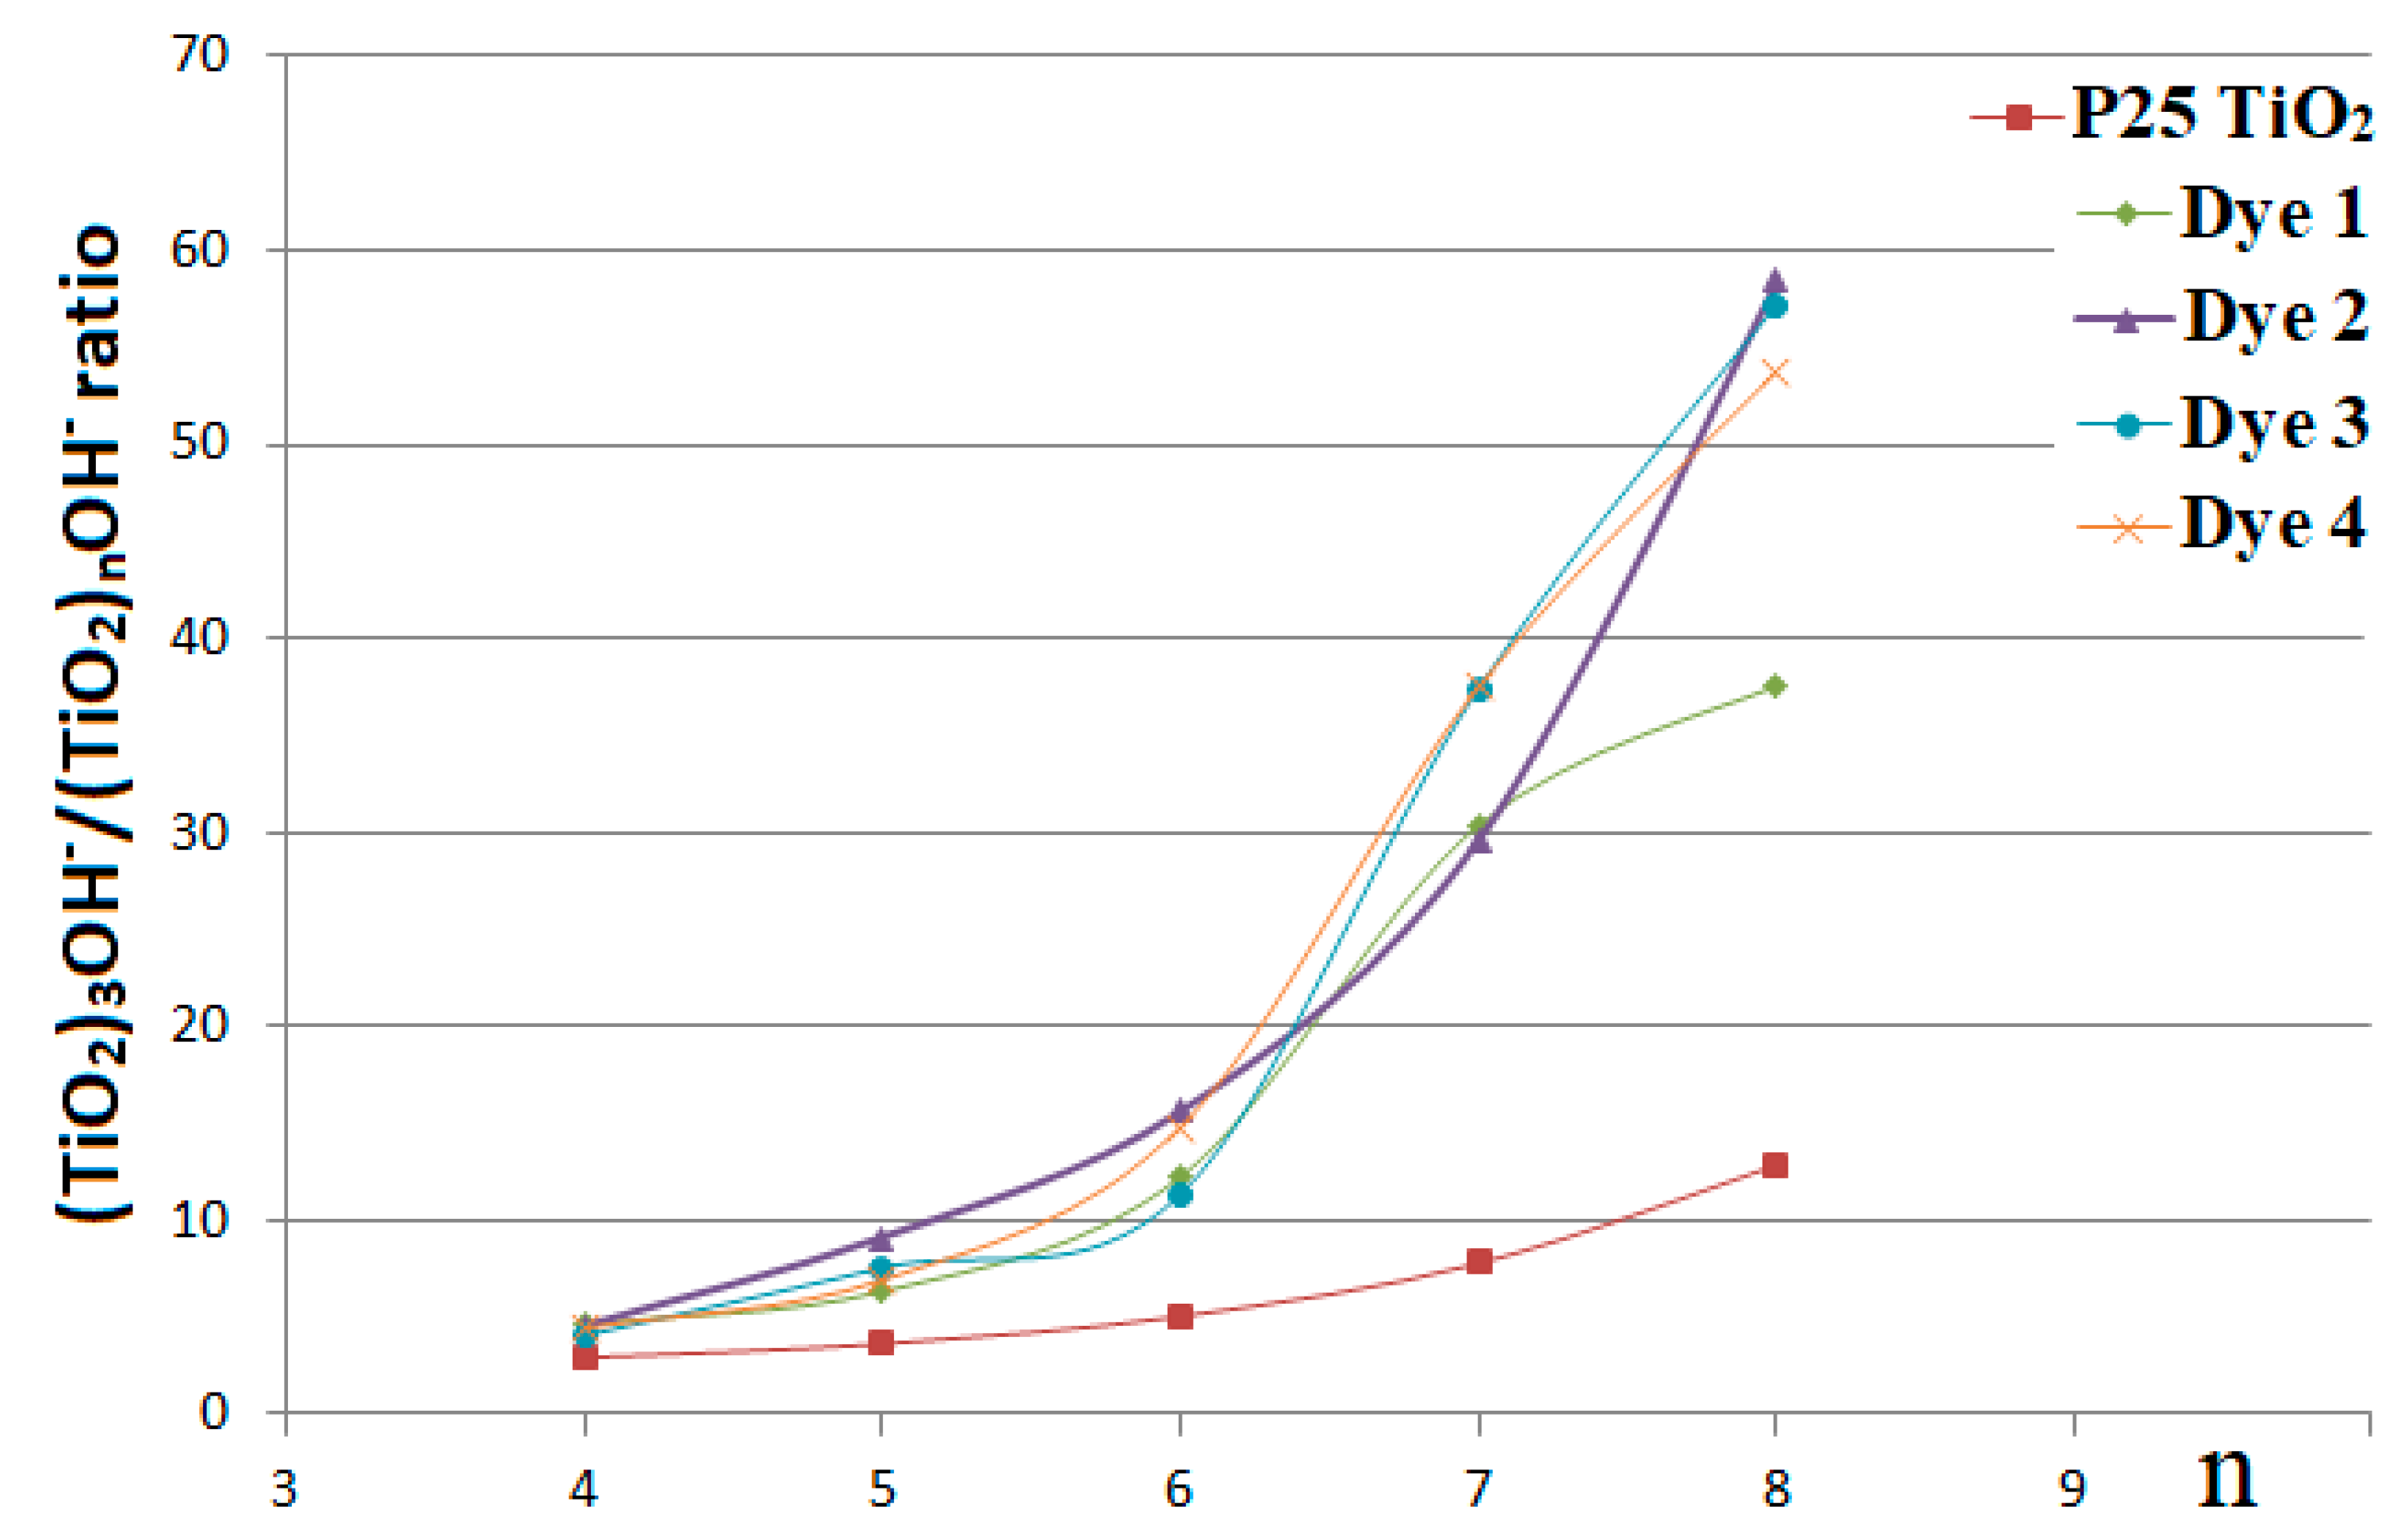
It can be taken for granted that the dye-modified TiO2 samples have similar free surface hydroxyl group populations and they differ only in the dye structures. Figure S4 (Supplementary Material) shows the LDI mass spectra of the unmodified P25 TiO2 and dye-modified samples and Figure 4 shows the breakdown plots of (TiO2)3OH/(TiO2)nOH ratio against the n number obtained for the unmodified P25 TiO2 and dye-modified samples.
It is clear that dye-modification yielded similar changes in the course of the plots as heating (Figure 3 and Figure 4). Namely, a substantial increase in the (TiO2)3OH/(TiO2)nOH ratio was observed for n ≥ 6. Furthermore, the dye structures have minor (or moderate at most) influences on the character of the plots.
We also checked if the (TiO2)nOH/(TiO2)n ratio depends on the hydroxylation degree. The obtained plots, shown in the Supplementary Material (Figures S5 and S6), can be used for the comparison/differentiation of the TiO2 samples; however, the comparison of the hydroxylation degrees has to be performed with caution as briefly discussed in the Supplementary Material.
It was also found that the TiO2/(TiO2)3OH ratio also may depend on the hydroxylation degree, as shown in the Supplementary Material, Figure S7. It may be argued that the abundances of ions at the low m/z range (TiO2 at m/z 80) may be affected by background/contaminant ions. However, it is plausible that the obtained TiO2/(TiO2)3OH ratios reflect well the hydroxylation degree, especially for heated TiO2 samples (Figure S7). Furthermore, in contrast to the (TiO2)3OH/(TiO2)nOH ratio, the ratio TiO2/(TiO2)3OH does not show any exceptional behavior of TiO2300. Therefore, Figure S7 can be a good supplement to the plots shown in Figure 3 and Figure 4.
We also obtained the LDI mass spectra in the positive ion mode (Supplementary Material, Figure S8), but they were found to be useless for the purpose of this work. The ions (TiO2)n+ and TiO(TiO2)n+ were detected but in low abundance. Additionally, a number of abundant non-Ti-containing ions was detected as well (background/contamination).
There is a number of papers devoted to the gas-phase studies of neutral and charged titanium oxide clusters [23,24,36,37,38,39,40,41,42], since they provide some insight into the properties of bulk titanium oxide at the molecular level. Therefore, the (TiO2)n and (TiO2)nOH ions were subjected to further analysis, to get the spectra of metastable ions (LIFT mass spectra). The gas-phase metastable decompositions of (TiO2)n ions were found to be trivial, namely, the loss of TiO2 molecule occurred (Supplementary Material, Figure S9). The gas-phase metastable decompositions of (TiO2)n ions were trivial; namely, the loss of the TiO2 molecule occurred (Supplementary Material, Figure S9). It has been reported that (TiO2)n ions are very reactive towards trace of gases inside the instrument and are not prone to lose TiO2 molecule [23,24]. However, in tandem mass spectrometry, the gas-phase cluster ions may have different structures and dissociation behaviors [23]. The results obtained for (TiO2)nOH ions were quite surprising. In the obtained LIFT mass spectra, we detected the (TiO2)nH2O ions (Supplementary Material, Figure S10). Just to note, there is no doubt that in the full scan mass spectra, we deal with (TiO2)nOH ions, not with (TiO2)nH2O ions (Supplementary Material, Figure S3).
It is difficult rationalize how the (TiO2)nH2O ions can be formed from (TiO2)nOH ions. Most probably, at first (TiO2)nOH ions lose the OH radical producing (TiO2)n ions. Such a process has already been observed for (TiO2)3OH ion [24]. We are aware that the occurrence of this process may be disputable since it is the formation of two odd-electron species from the even-electron ion. Furthermore, in mass spectrometry, OH radical loss is not a favored process, even in electron ionization conditions. The produced (TiO2)n ions undergo two processes: losses of TiO2 molecules and reactions with traces of water inside the mass spectrometer, and the processes may occur in any order. In other words, in our experiments, the (TiO2)n ions formed under LIFT conditions are very reactive towards gas-phase water impurities, in contrast to the (TiO2)n ions produced in the LDI source. It must be added that our results are not contrary to those reported in [23,34], which have been obtained in different conditions (e.g., with respect to the reaction time). On the other hand, it indicates that the behavior of the gas-phase titanium oxide cluster is very sensitive to the conditions used.

Supplementary Materials

The following are available online at https://www.mdpi.com/article/10.3390/ma14226848/s1, Figure S1: LDI mass spectra of TiO2 samples, obtained in the negative ion mode, in the m/z range 50–200. Figure S2: LDI mass spectra of TiO2 samples, obtained in the negative ion mode, in the m/z range 200–1000. Figure S3: The obtained isotope pattern of (TiO2)7OH ion, shown as a representative example. Figure S4: LDI mass spectra of the unmodified P25 TiO2 and dye-modified samples. Figure S5: The breakdown plots of the (TiO2)nOH/(TiO2)n ratio against the n number obtained for heated TiO2 samples. Figure S6: The breakdown plots of the (TiO2)nOH/(TiO2)n ratio against the n number obtained for unmodified P25 TiO2 and dye-modified samples. Figure S7: The TiO2/(TiO2)3OH ratios obtained for heated TiO2 samples, unmodified (P25 TiO2) and dye-modified samples. Figure S8: LDI mass spectra of TiO2 samples obtained in the positive ion mode. Figure S9: Exemplary LIFT mass spectra of (TiO2)n ions. Figure S10: Exemplary LIFT mass spectra of (TiO2)nOH ions.

Author Contributions

Conceptualization: M.Z. and R.F.; methodology: M.K. (Małgorzata Kasperkowiak), M.Z. and R.F.; formal analysis: M.K. (Małgorzata Kasperkowiak), M.K. (Monika Kurowska), M.Z. and R.F.; investigation: M.K. (Małgorzata Kasperkowiak), M.K. (Monika Kurowska), M.Z. and R.F.; writing—original draft preparation: M.K. (Monika Kurowska) and R.F.; writing—review and editing: M.K. (Małgorzata Kasperkowiak), M.Z. and R.F.; funding acquisition, M.K. (Małgorzata Kasperkowiak), M.Z. and R.F. All authors have read and agreed to the published version of the manuscript.

Funding

This research received no external funding.

Institutional Review Board Statement

Not applicable.

Informed Consent Statement

Not applicable.

Data Availability Statement

Data are available on request at corresponding authors.

Conflicts of Interest

The authors declare no conflict of interest.

References

  1. Riedle, S.; Pele, L.C.; Otter, D.E.; Hewitt, R.E.; Singh, H.; Roy, N.C.; Powell, J.J. Pro-inflammatory adjuvant properties of pigment-grade titanium dioxide particles are augmented by a genotype that potentiates interleukin 1β processing. Part. Fibre Toxicol. 2017, 14, 51. [Google Scholar] [CrossRef] [Green Version]
  2. Nowotny, J. Titanium dioxide-based semiconductors for solar-driven environmentally friendly applications: Impact of point defects on performance. Energy Environ. Sci. 2008, 1, 565–572. [Google Scholar] [CrossRef]
  3. Carlucci, C.; Degennaro, L.; Luisi, R. Titanium dioxide as a catalyst in biodiesel production. Catalysts 2019, 9, 75. [Google Scholar] [CrossRef] [Green Version]
  4. Taha, S.; Begum, S.; Narwade, V.N.; Halge, D.; Dadge, J.W.; Mahabole, M.P.; Khairnar, R.D.; Bogle, K.A. Titanium dioxide nanostructure based alcohol vapor sensor. AIP Conf. Proc. 2020, 2220, 020195. [Google Scholar]
  5. Berardo, E.; Kaplan, F.; Bhaskaran-Nair, K.; Shelton, W.A.; Van Setten, M.J.; Kowalski, K.; Zwijnenburg, M.A. Benchmarking the fundamental electronic properties of small TiO2 nanoclusters by GW and coupled cluster theory calculations. J. Chem. Theory Comput. 2017, 13, 3814–3828. [Google Scholar] [CrossRef]
  6. Di Valentin, C.; Pacchioni, G. Electronic structure of defect states in hydroxylated and reduced rutile TiO2(110) surfaces. Phys. Rev. Lett. 2006, 97, 166803. [Google Scholar] [CrossRef] [PubMed]
  7. Sun, Y.; Sun, S.; Liao, X.; Wen, J.; Yin, G.; Pu, X.; Yao, Y.; Huang, Z. Effect of heat treatment on surface hydrophilicity-retaining ability of titanium dioxide nanotubes. Appl. Surf. Sci. 2018, 440, 440–447. [Google Scholar] [CrossRef]
  8. Tipawan, K.; Warawoot, T. Effects of air exposure time and annealing temperature on superhydrophobic surface of titanium dioxide films. Key Eng. Mater. 2017, 751, 137–142. [Google Scholar]
  9. El Seoud, O.A.; Ramadan, A.R.; Sato, B.M.; Pires, P.A.R. Surface properties of calcinated titanium dioxide probed by solvatochromic indicators: Relevance to catalytic applications. J. Phys. Chem. C 2010, 114, 10436–10443. [Google Scholar] [CrossRef]
  10. Li, Y.; Bian, Y.; Qin, H.; Zhang, Y.; Bian, Z. Photocatalytic reduction behavior of hexavalent chromium on hydroxyl modified titanium dioxide. Appl. Catal. B 2017, 206, 293–299. [Google Scholar] [CrossRef]
  11. Mamaghani, A.H.; Haghighat, F.; Lee, C.-S. Effect of titanium dioxide properties and support material on photocatalytic oxidation of indoor air pollutants. Build. Environ. 2021, 189, 107518. [Google Scholar] [CrossRef]
  12. Sean, N.A.; Leaw, W.L.; Nur, H. Effect of calcination temperature on the photocatalytic activity of carbon-doped titanium dioxide revealed by photoluminescence study. J. Chin. Chem. Soc. 2019, 66, 1277–1283. [Google Scholar] [CrossRef]
  13. Li, W.; Du, D.; Yan, T.; Kong, D.; You, J.; Li, D. Relationship between surface hydroxyl groups and liquid-phase photocatalytic activity of titanium dioxide. J. Colloid Interface Sci. 2015, 444, 42–48. [Google Scholar] [CrossRef]
  14. Du, J.; Wu, Q.; Zhong, S.; Gu, X.; Liu, J.; Guo, H.; Zhang, W.; Peng, H.; Zou, J. Effect of hydroxyl groups on hydrophilic and photocatalytic activities of rare earth doped titanium dioxide thin films. J. Rare Earths 2015, 33, 148–153. [Google Scholar] [CrossRef]
  15. Nanayakkara, C.E.; Larish, W.A.; Grassian, V.H. Titanium dioxide nanoparticle surface reactivity with atmospheric gases, CO2, SO2, and NO2: Roles of surface hydroxyl groups and adsorbed water in the formation and stability of adsorbed products. J. Phys. Chem. C 2014, 118, 23011–23021. [Google Scholar] [CrossRef]
  16. Nakamura, Y.; Soejima, T. TiO2 Nanocoral structures as versatile substrates for surface-assisted laser desorption/ionization mass spectrometry. ChemNanoMat 2019, 5, 447–455. [Google Scholar] [CrossRef]
  17. Kim, M.-J.; Yun, T.G.; Noh, J.-Y.; Song, Z.; Kim, H.-R.; Kang, M.-J.; Pyun, J.-C. Laser-induced surface reconstruction of nanoporous au-modified TiO2 nanowires for in situ performance enhancement in desorption and ionization mass spectrometry. Adv. Funct. Mater. 2021, 31, 2102475. [Google Scholar] [CrossRef]
  18. Piret, G.; Kim, D.; Drobecq, H.; Coffinier, Y.; Melnyk, O.; Schmuki, P.; Boukherrou, R. Surface-assisted laser desorption–ionization mass spectrometry on titanium dioxide (TiO2) nanotube layers. Analyst 2012, 137, 3058–3063. [Google Scholar] [CrossRef]
  19. Lee, K.-H.; Chiang, C.-K.; Lin, Z.-H.; Chang, H.-T. Determining enediol compounds in tea using surface-assisted laser desorption/ionization mass spectrometry with titanium dioxide nanoparticle matrices. Rapid Commun. Mass Spectrom. 2007, 21, 2023–2030. [Google Scholar] [CrossRef] [PubMed]
  20. Museur, L.; Manousaki, A.; Anglos, D.; Tsibidis, G.D.; Kanaev, A. Pathways control in modification of solid surfaces induced by temporarily separated femtosecond laser pulses. Appl. Surf. Sci. 2021, 566, 150611. [Google Scholar] [CrossRef]
  21. Tsibidis, G.D.; Museur, L.; Kanaev, A. The role of crystalline orientation in the formation of surface patterns on solids irradiated with femtosecond laser double pulses. Appl. Sci. 2020, 10, 8811. [Google Scholar] [CrossRef]
  22. Hong, R.; Shi, J.; Li, Z.; Liao, J.; Tao, C.; Wang, Q.; Lin, H.; Zhang, D. Surface enhanced raman scattering of defective TiO2 thin film decorated with silver nanoparticles by laser ablation. Opt. Mater. 2020, 109, 110338. [Google Scholar] [CrossRef]
  23. Bian, S.; Ma, Y.; Shi, Y.; Fan, X.; Kong, X. Superhalogen species of titanium oxide related clusters generated by laser ablation. J. Phys. Chem. A 2019, 123, 6787–6791. [Google Scholar] [CrossRef] [PubMed]
  24. Barthen, N.; Millon, E.; Aubriet, F. Study of cluster anions generated by laser ablation of titanium oxides: A high resolution approach based on fourier transform ion cyclotron resonance mass spectrometry. J. Am. Soc. Mass Spectrom. 2011, 22, 508–519. [Google Scholar] [CrossRef] [Green Version]
  25. Zalas, M.; Schroeder, G. Template free synthesis of locally-ordered mesoporous titania and its application in dye-sensitized solar cells. Mater. Chem. Phys. 2012, 134, 170–176. [Google Scholar] [CrossRef]
  26. Zalas, M.; Gierczyk, B.; Bossic, A.; Mussini, P.R.; Kleine, M.; Pankiewicz, R.; Makowska-Janusik, M.; Popenda, Ł.; Stampor, W. The influence of anchoring group position in ruthenium dye molecule on performance of dye-sensitized solar cells. Dyes Pigm. 2018, 150, 335–346. [Google Scholar] [CrossRef]
  27. Longo, C.; De Paoli, M. Dye-sensitized solar cells: A successful combination of materials. J. Braz. Chem. Soc. 2003, 14, 889–901. [Google Scholar] [CrossRef]
  28. Zalas, M.; Gierczyk, B.; Klein, M.; Siuzdak, K.; Pędziński, T.; Łuczak, T. Synthesis of a novel dinuclear ruthenium polypyridine dye for dye-sensitized solar cells application. Polyhedron 2014, 67, 381–387. [Google Scholar] [CrossRef]
  29. Neubert, H.; Halket, J.M.; Ocaña, M.F.; Patel, R.K.P. MALDI post source decay and LIFT-TOF/TOF investigation of α-cyano-4-hydroxycinnamic acid cluster interferences. J. Am. Soc. Mass Spectrom. 2004, 15, 336–343. [Google Scholar] [CrossRef] [PubMed] [Green Version]
  30. Neupane, M.P.; Park, I.S.; Lee, M.H.; Bae, T.S.; Watari, F. Influence of heat treatment on morphological changes of nano-structured titanium oxide formed by anodic oxidation of titanium in acidic fluoride solution. Bio-Med. Mater. Eng. 2009, 19, 77–83. [Google Scholar] [CrossRef] [PubMed]
  31. Haq, S.; Rehman, W.; Waseem, M.; Javed, R.; Rehman, M.; Shahid, M. Effect of heating on the structural and optical properties of TiO2 nanoparticles: Antibacterial activity. Appl. Nanosci. 2018, 8, 11–18. [Google Scholar] [CrossRef] [Green Version]
  32. Lee, Y.-J.; Cui, D.Z.; Jeon, H.-R.; Chung, H.J.; Park, Y.-J.; Kim, O.-S.; Kim, Y.-J. Surface characteristics of thermally treated titanium surfaces. J. Periodontal. Implant. Sci. 2012, 42, 81–87. [Google Scholar] [CrossRef] [Green Version]
  33. Uddin, M.J.; Cesano, F.; Chowdhury, A.C.; Trad, T.; Cravanzola, S.; Martra, G.; Mino, L.; Zecchina, A.; Scarano, D. Surface structure and phase composition of TiO2 P25 particles after thermal treatments and HF etching. Front. Mater. 2020, 7, 192. [Google Scholar] [CrossRef]
  34. Vorontsov, A.V.; Valdés, H.; Smirniotis, P.G.; Paz, Y. Recent advancements in the understanding of the surface chemistry in TiO2 photocatalysis. Surfaces 2020, 3, 72–92. [Google Scholar] [CrossRef] [Green Version]
  35. Keller, B.O.; Sui, J.; Young, A.B.; Whittal, R.M. Interferences and contaminants encountered in modern mass spectrometry. Anal. Chim. Acta 2008, 627, 71–81. [Google Scholar] [CrossRef]
  36. Matsuda, Y.; Bernstein, E.R. On the titanium oxide neutral cluster distribution in the gas phase: Detection through 118 nm single-photon and 193 nm multiphoton ionization. J. Phys. Chem. A 2005, 109, 314–319. [Google Scholar] [CrossRef] [PubMed]
  37. Garcia, J.M.; Heald, L.F.; Shaffer, R.E.; Sayres, S.G. Oscillation in excited state lifetimes with size of sub-nanometer neutral (TiO2)n clusters observed with ultrafast pump−probe spectroscopy. J. Phys. Chem. Lett. 2021, 12, 4098–4103. [Google Scholar] [CrossRef] [PubMed]
  38. Li, S.; Dixon, D.A. Molecular structures and energetics of the (TiO2)n (n = 1−4) clusters and their anions. J. Phys. Chem. A 2008, 112, 6646–6666. [Google Scholar] [CrossRef] [PubMed]
  39. Guan, B.; Lu, W.; Fang, J.; Cole, R.B. Characterization of synthesized titanium oxide nanoclusters by MALDI-TOF mass spectrometry. J. Am. Soc. Mass Spectrom. 2007, 18, 517–524. [Google Scholar] [CrossRef] [Green Version]
  40. Velegrakis, M.; Massaouti, M.; Jadraque, M. Collision-induced dissociation studies on gas-phase titanium oxide cluster cations. Appl. Phys. A 2012, 108, 127–131. [Google Scholar] [CrossRef]
  41. Jadraque, M.; Sierra, B.; Sfounis, A.; Velegrakis, M. Photofragmentation of mass-selected titanium oxide cluster cations. Appl. Phys. B 2010, 100, 587–590. [Google Scholar] [CrossRef]
  42. Velegrakis, M.; Sfounis, A. Formation and photodecomposition of cationic titanium oxide clusters. Appl. Phys. A 2009, 97, 765–770. [Google Scholar] [CrossRef]
Scheme 1. Structures of dyes used for modification of P25 TiO2.
Materials 14 06848 sch001
Figure 1. FTIR spectra of TiO2 samples.
Materials 14 06848 g001
Figure 2. LDI mass spectra of TiO2400 obtained in the negative ion mode, in the m/z range 50–200 and 200–1000.
Materials 14 06848 g002
Figure 3. The breakdown plots of the (TiO2)3OH/(TiO2)nOH ratio against the n number obtained for heated TiO2 samples..
Materials 14 06848 g003
Figure 4. The breakdown plots of the (TiO2)3OH/(TiO2)nOH ratio against the n number obtained for the unmodified P25 TiO2 and dye-modified samples.
Materials 14 06848 g004
Publisher’s Note: MDPI stays neutral with regard to jurisdictional claims in published maps and institutional affiliations.