
A Numerical Study on 3D Printed Cementitious Composites Mixes Subjected to Axial Compression


 ,
, 

_Zhu.png)
Abstract
:1. Introduction
2. Materials and Method
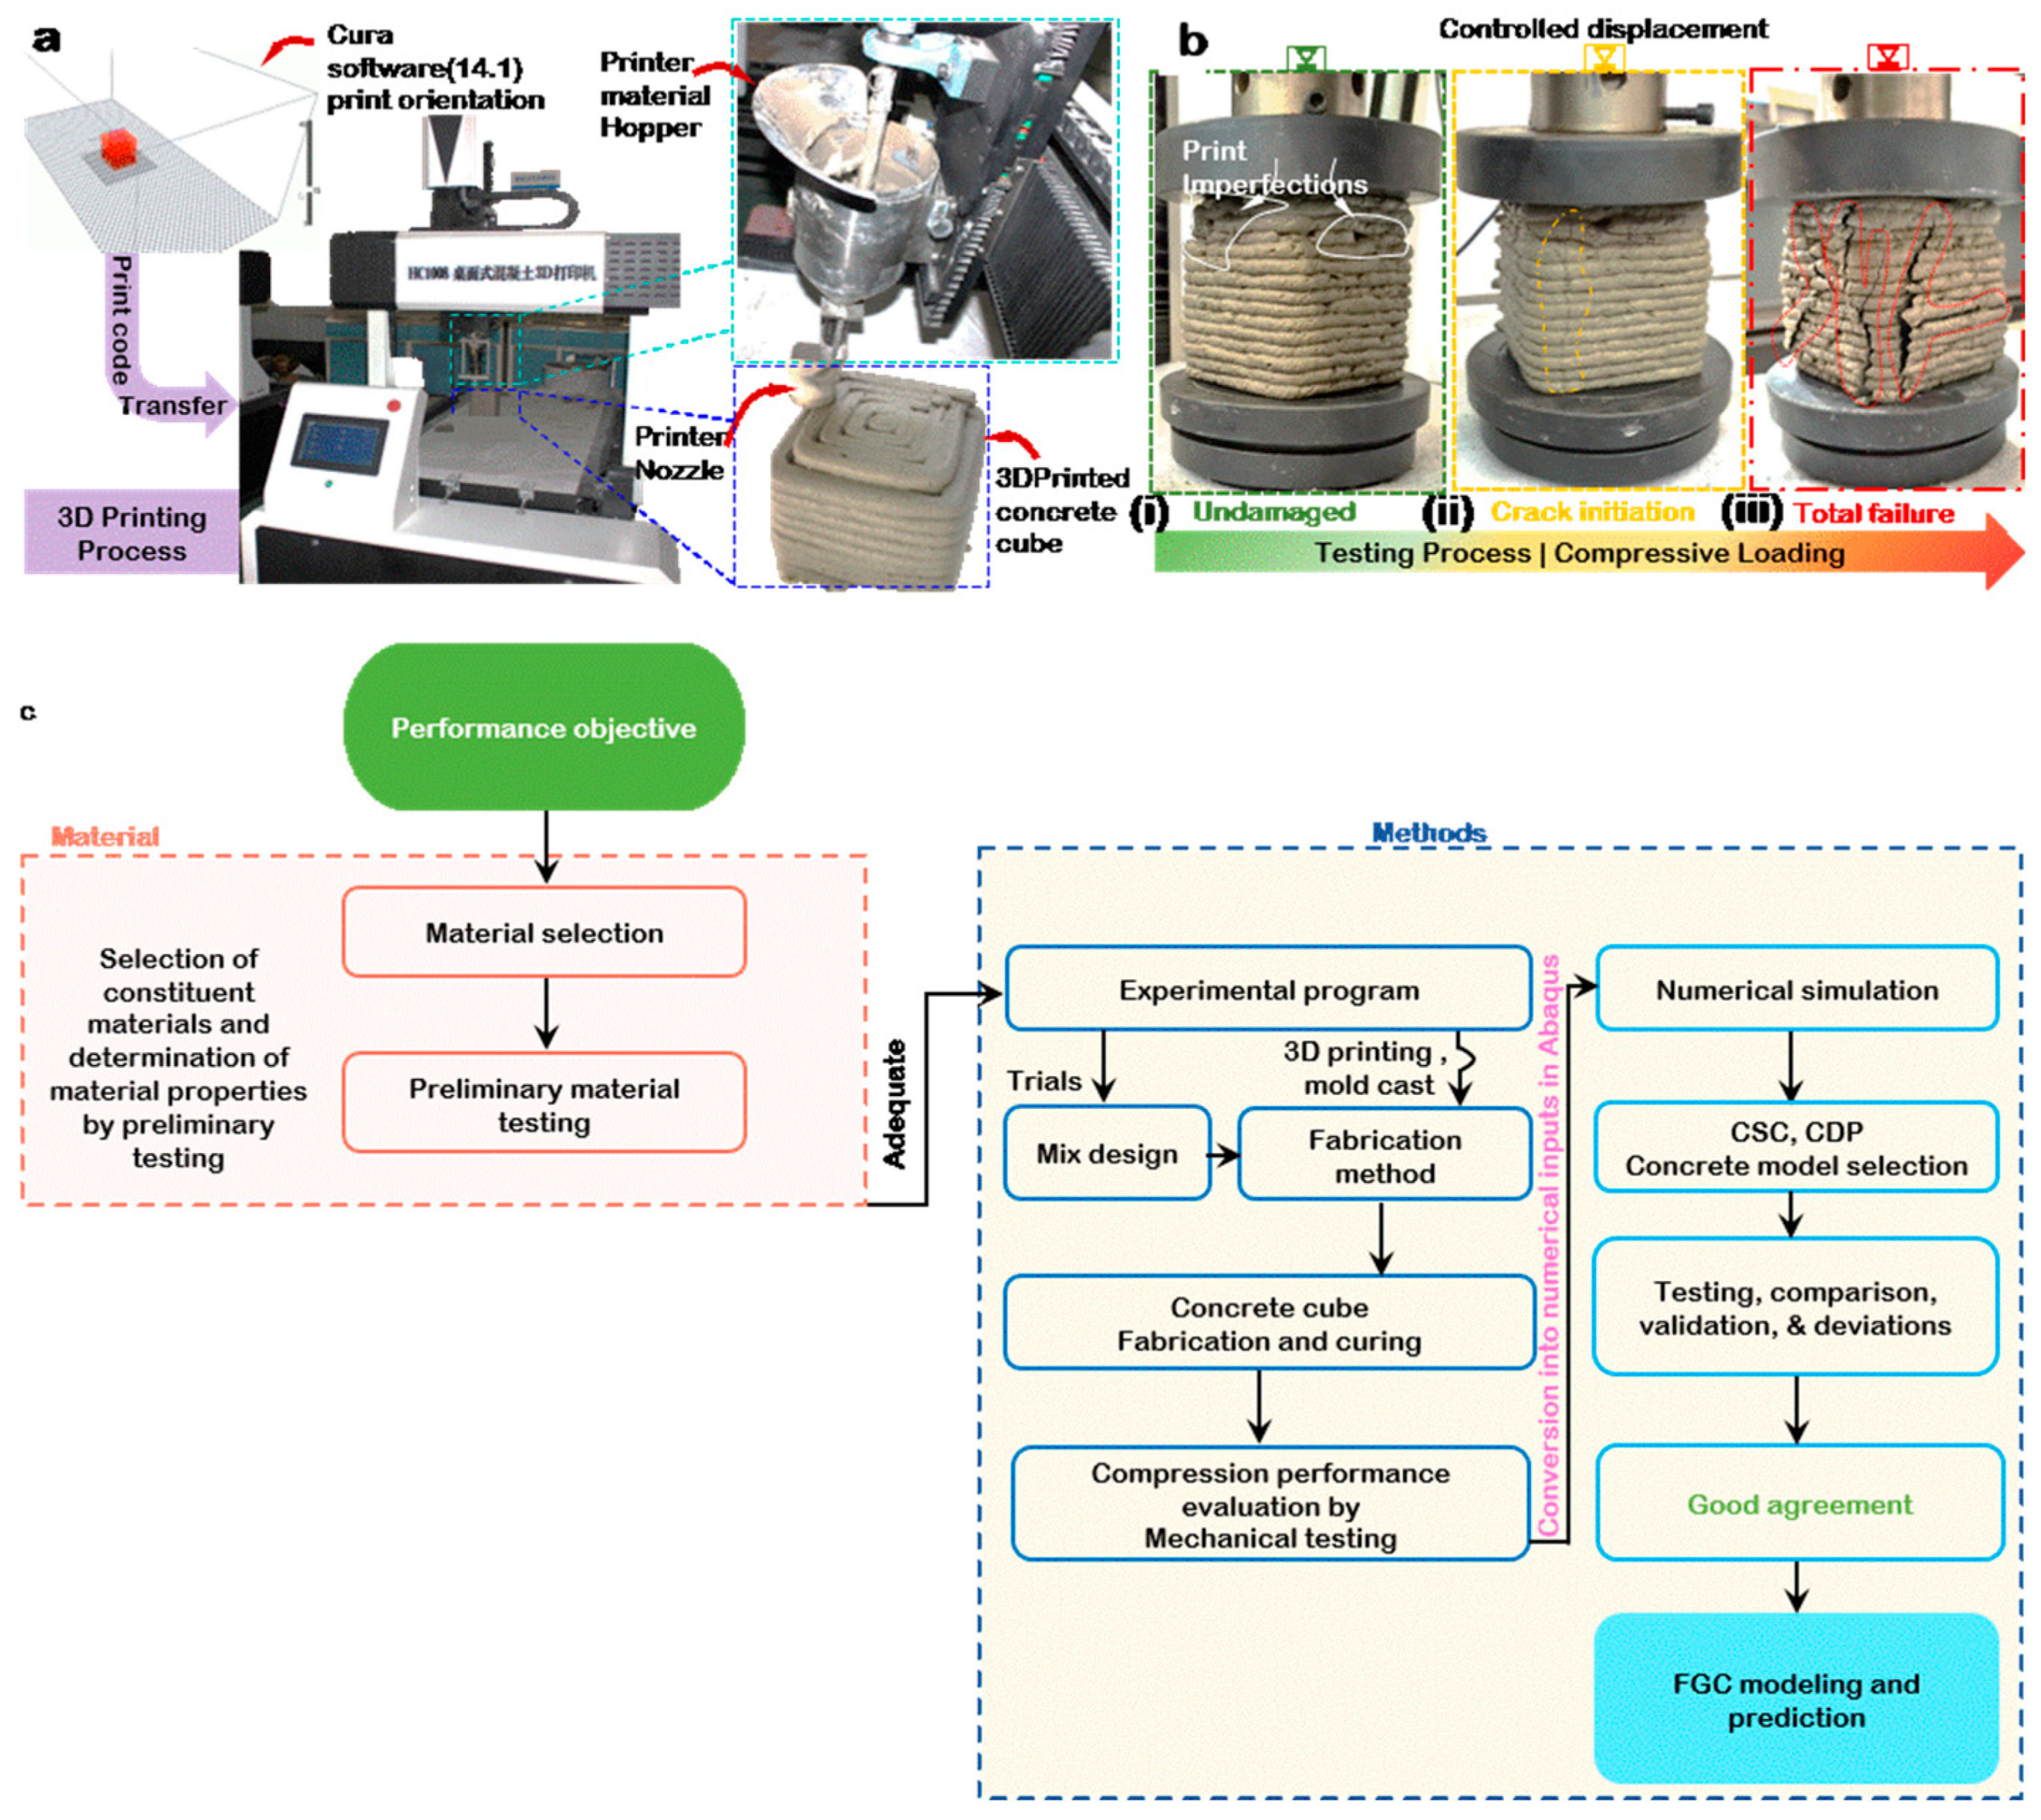
2.1. Fabrication and Testing
2.2. Performance Evaluation and Prediction by Modeling
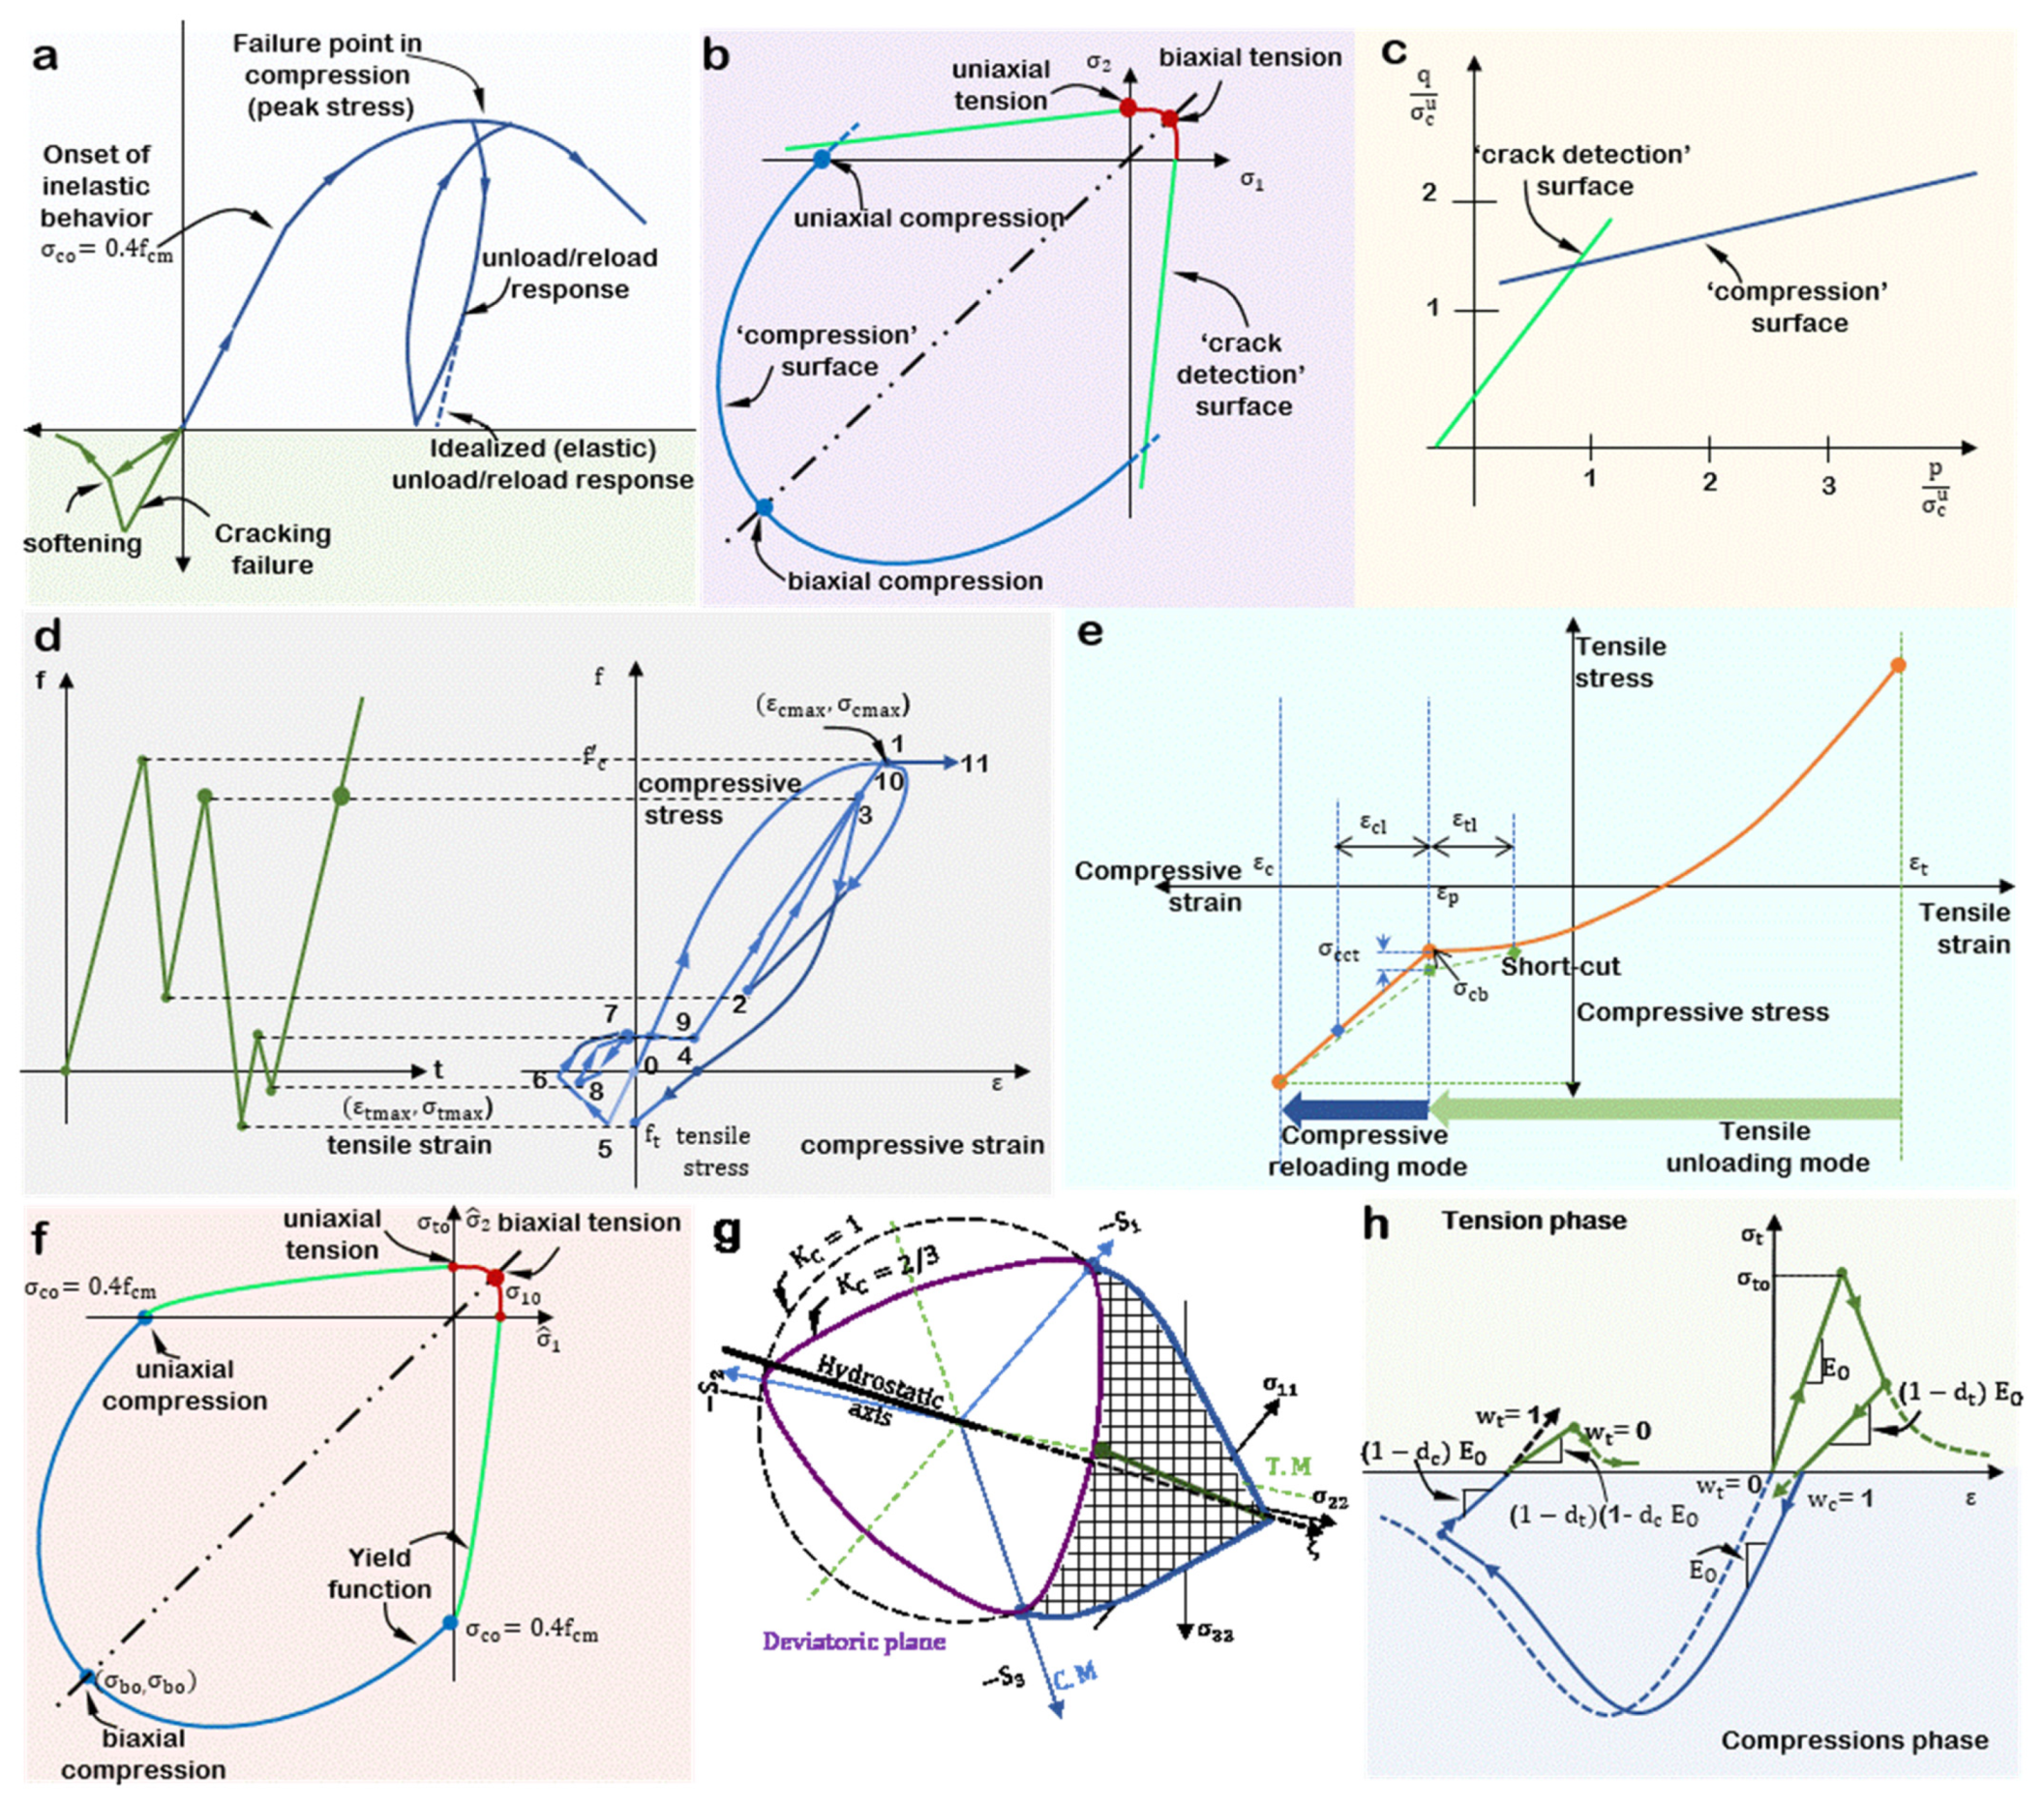
2.2.1. Abaqus Concrete Smeared Cracking (CSC)
2.2.2. Maekawa–Fukuura Concrete Model (MFC)
2.2.3. Concrete Damaged Plasticity (CDP)
3. Results and Discussion
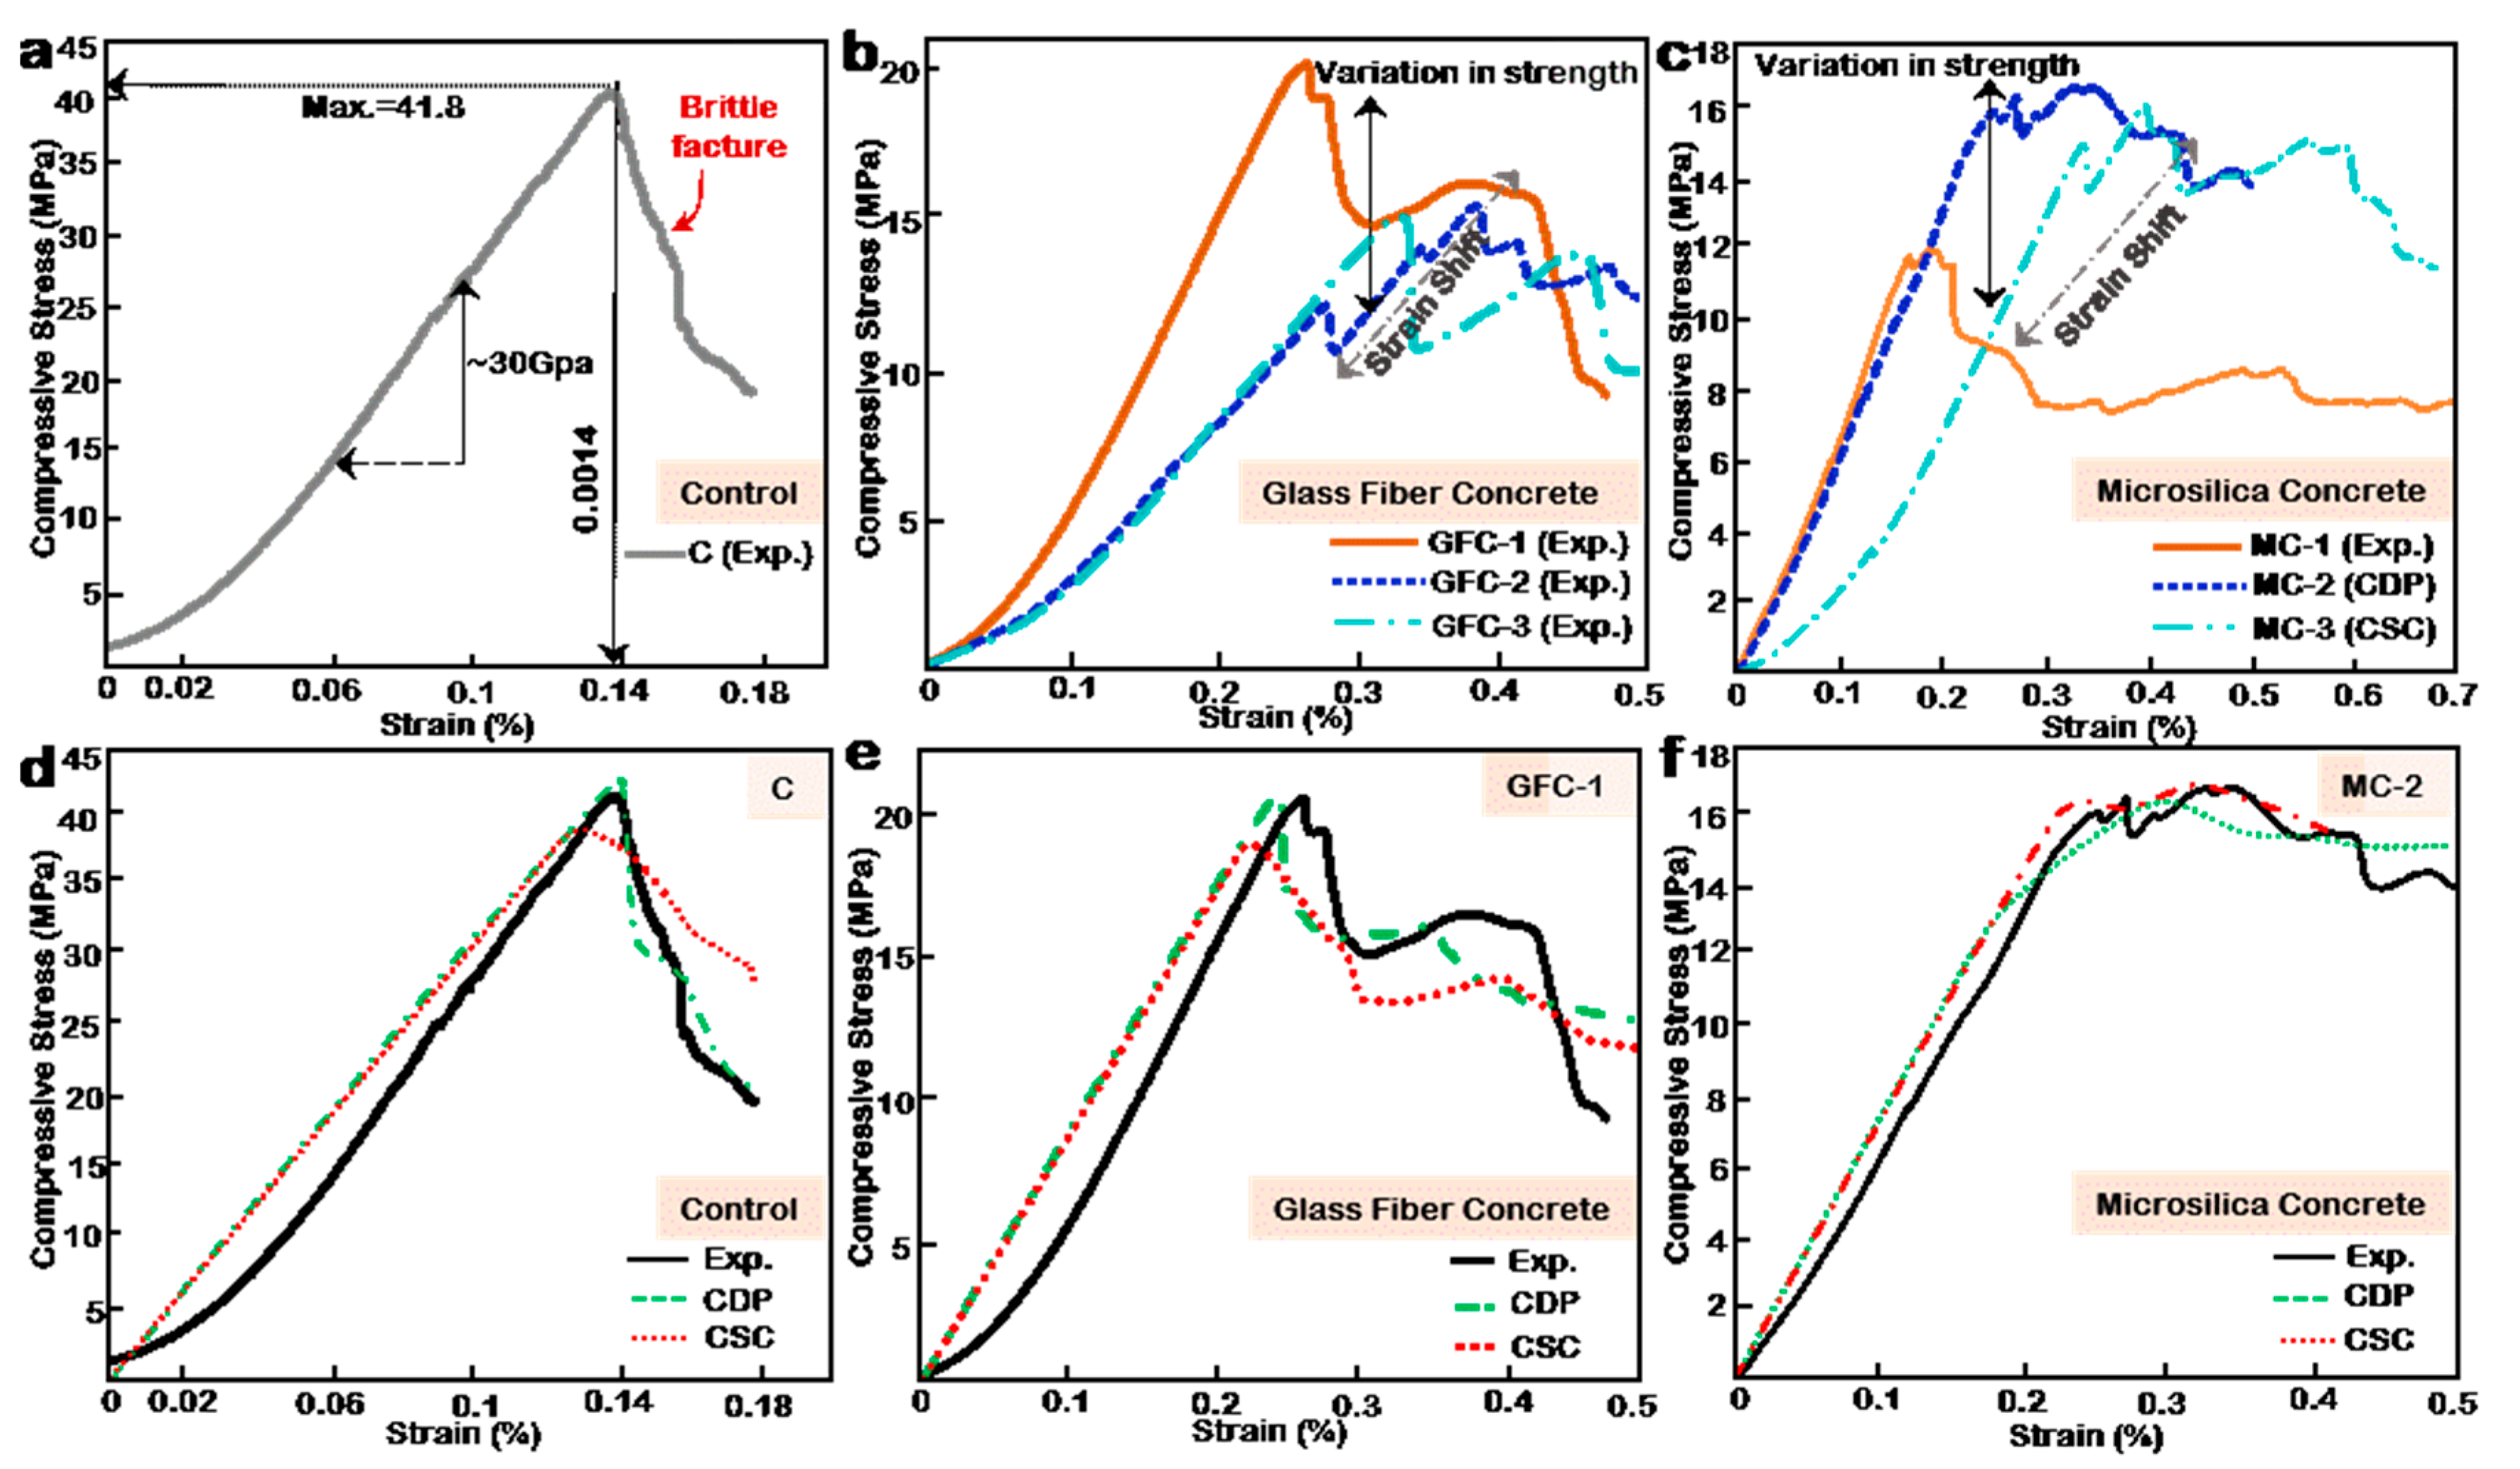
3.1. Compressive Performance
3.2. Numerical Modeling of the Cubes, Result Comparison and Validation
3.3. Modulation of FGC by Multilayering Approach Using CDP
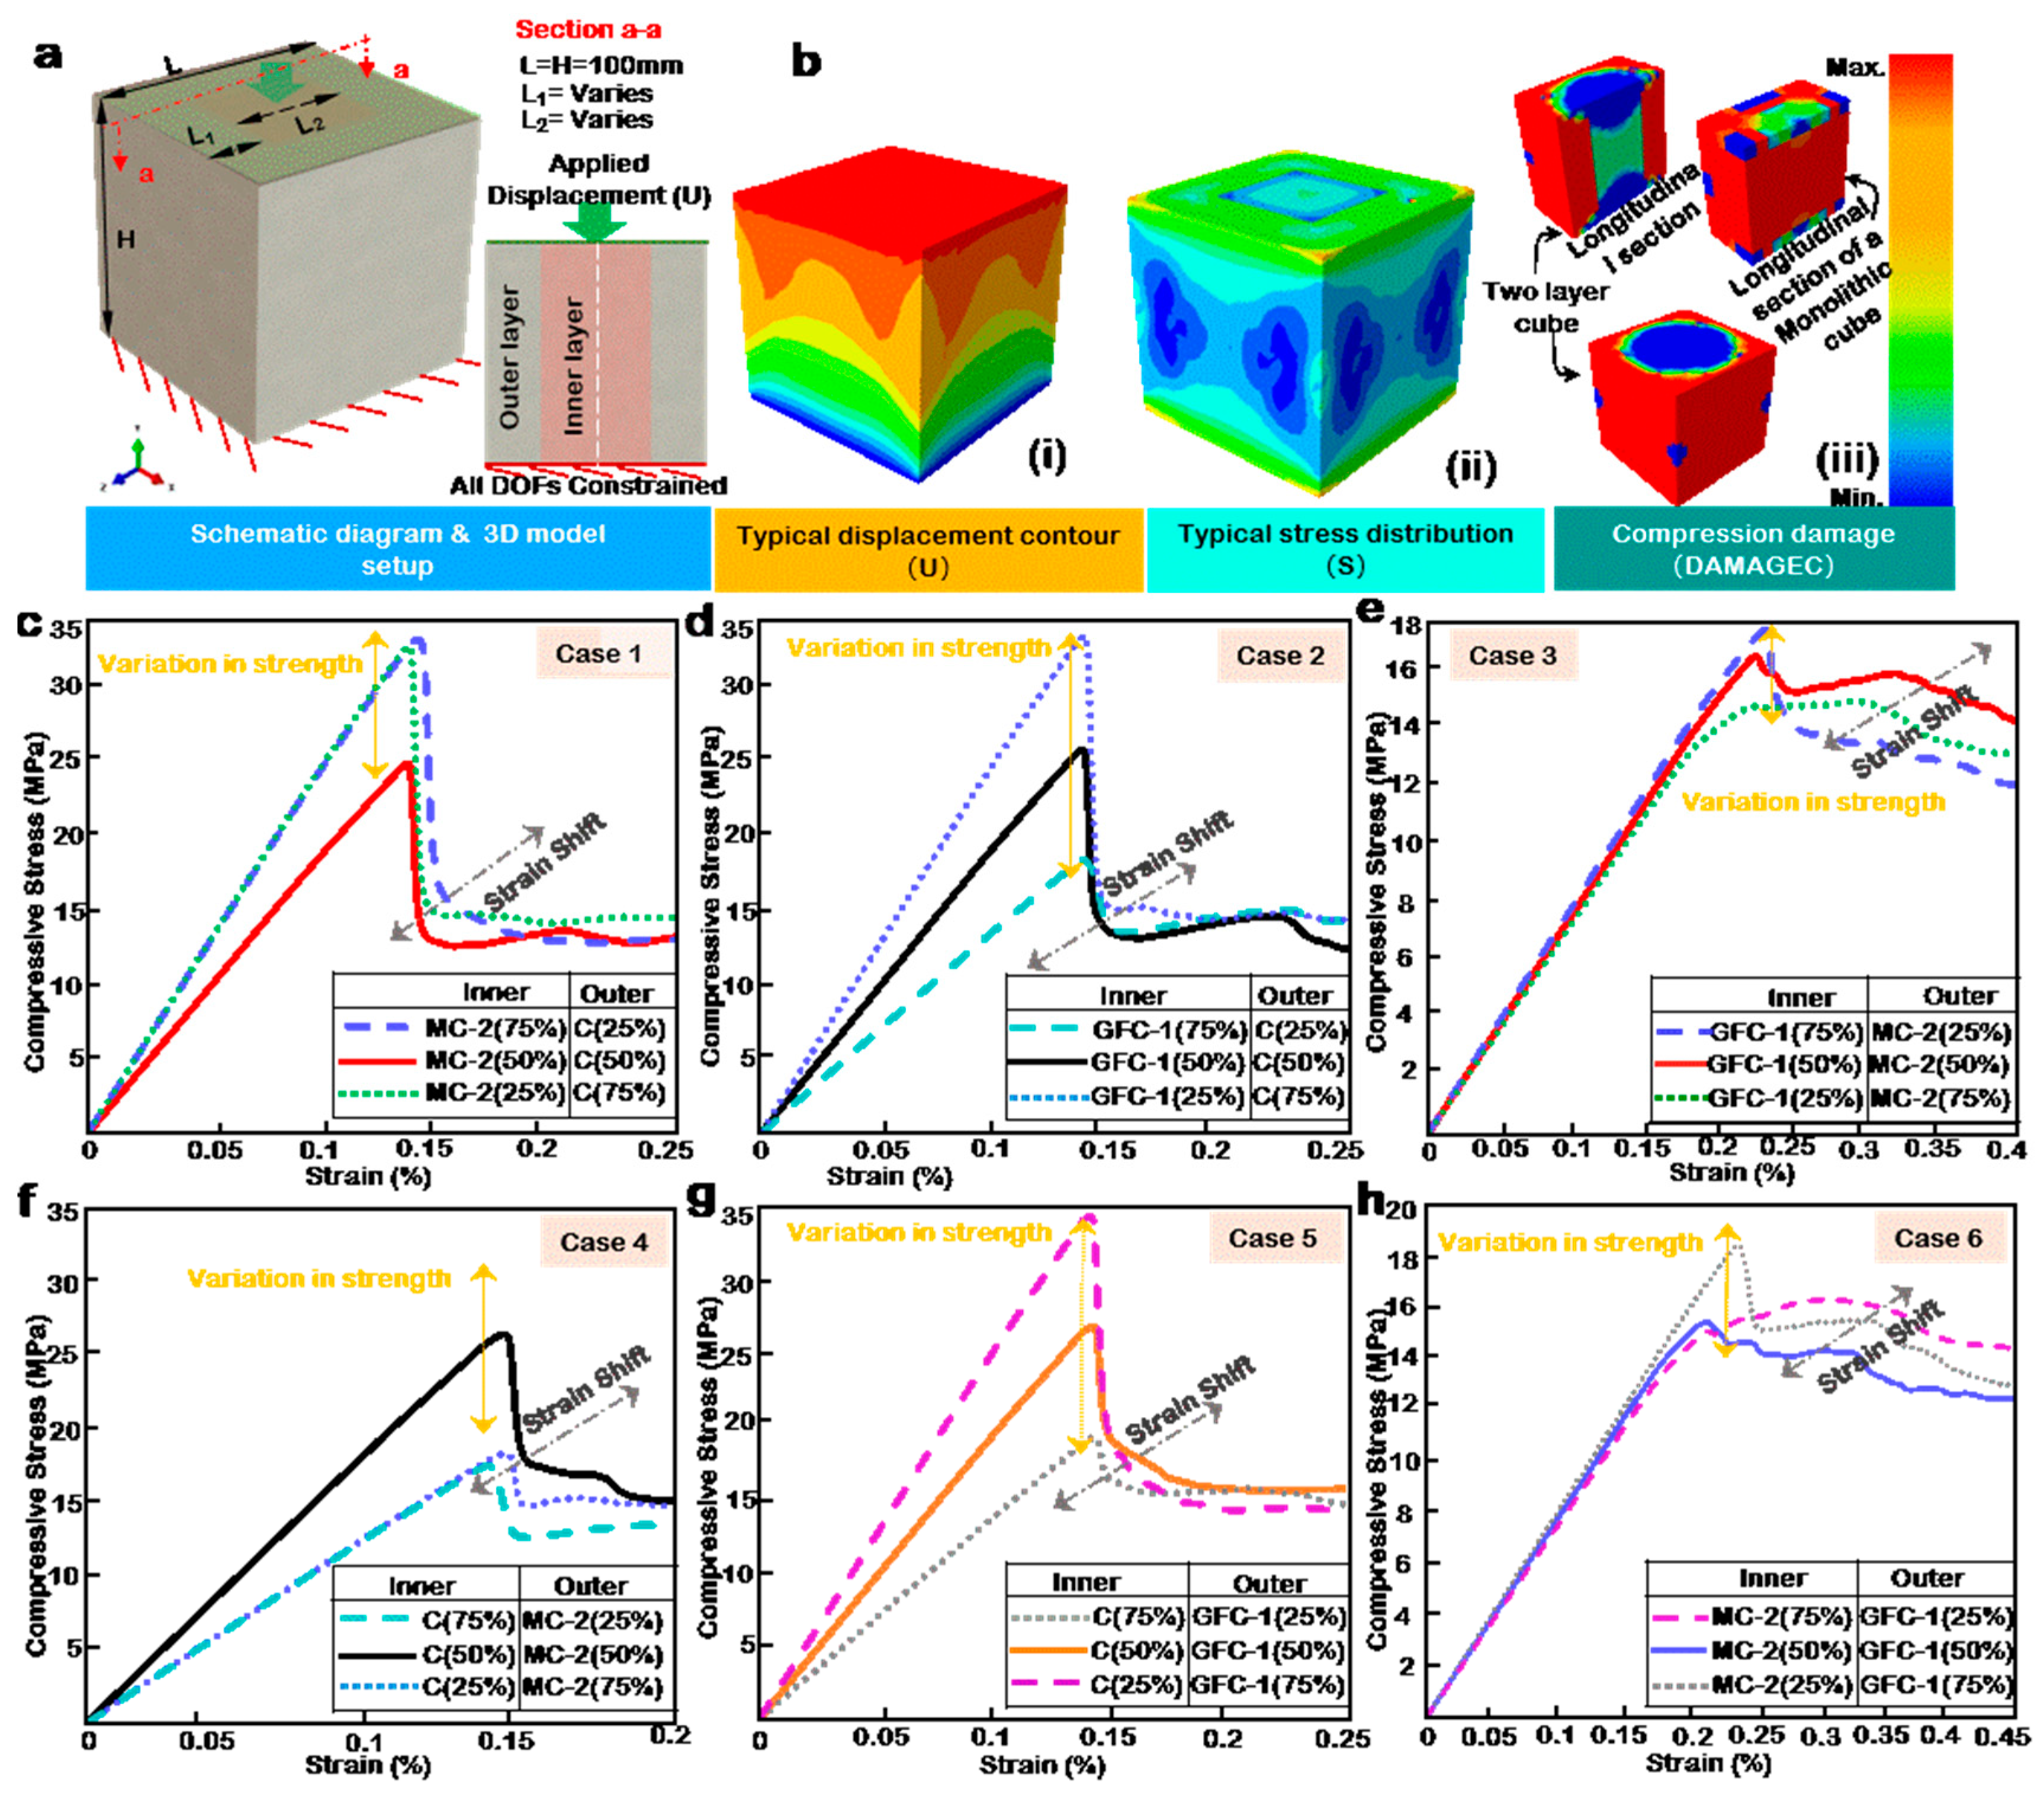
3.4. Influence of Layer Volume
3.5. Influence of Layer Positions and Volume Reversal
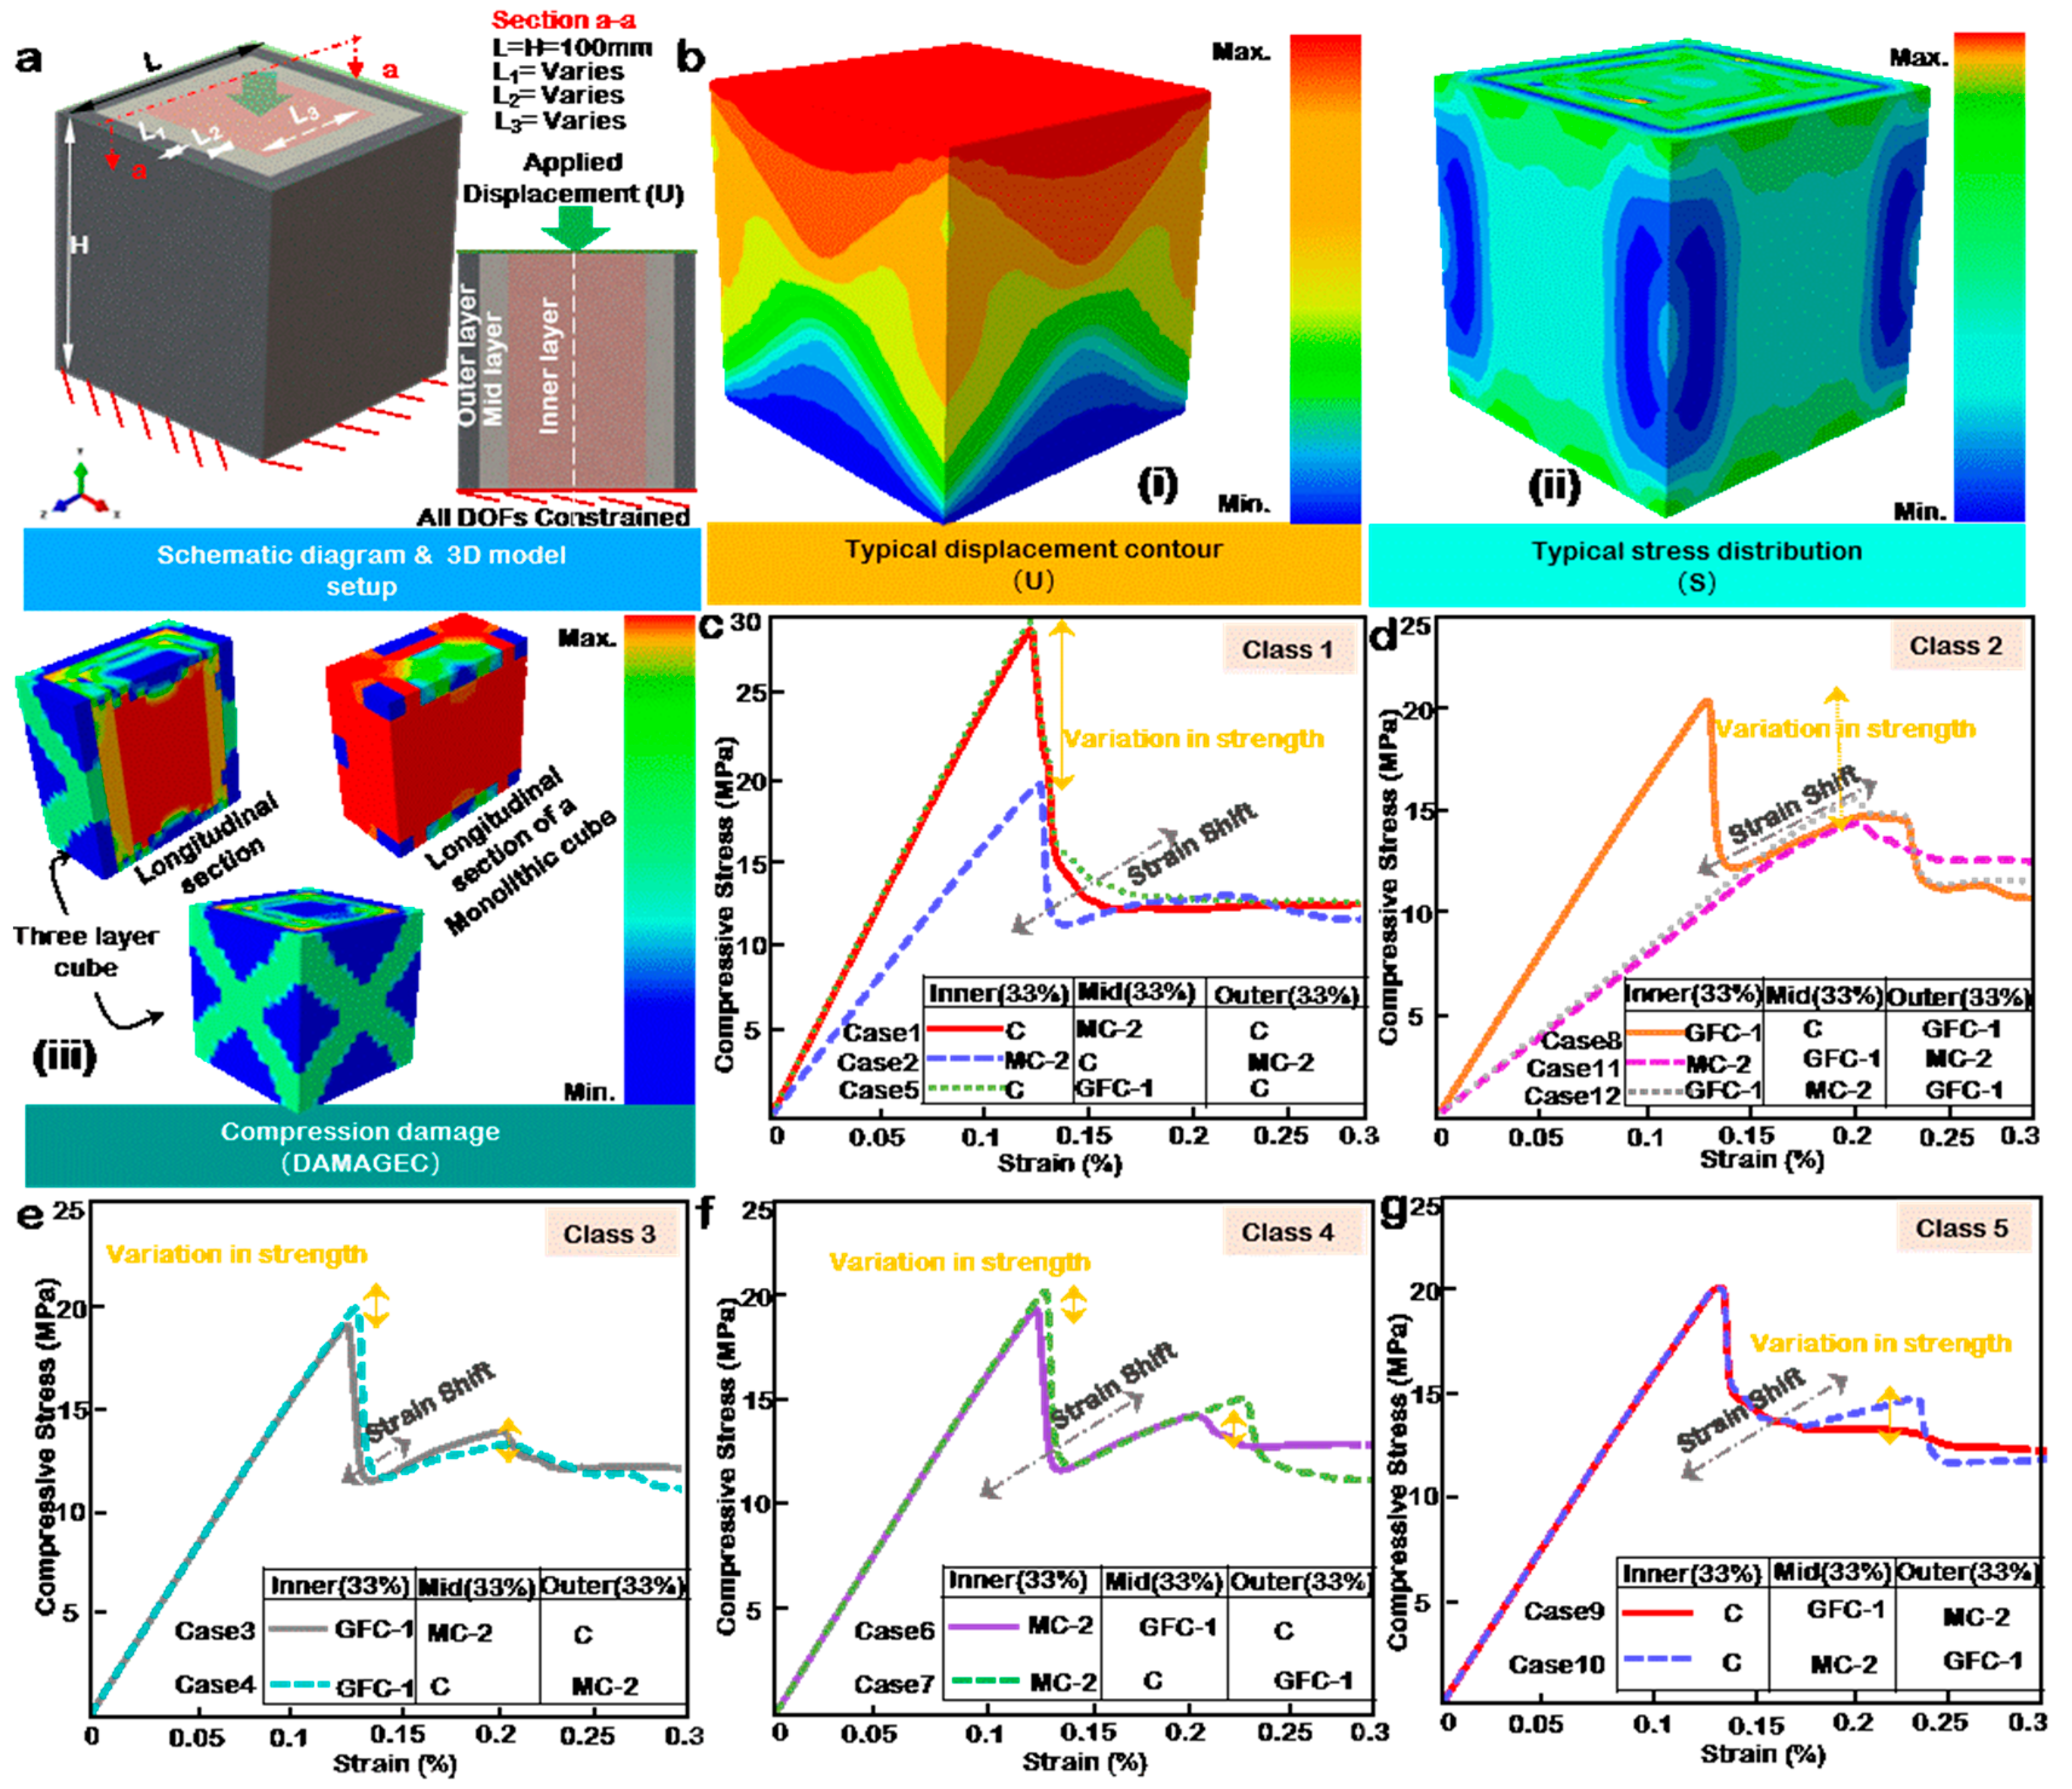
3.6. Beyond a Two-Layer Configuration
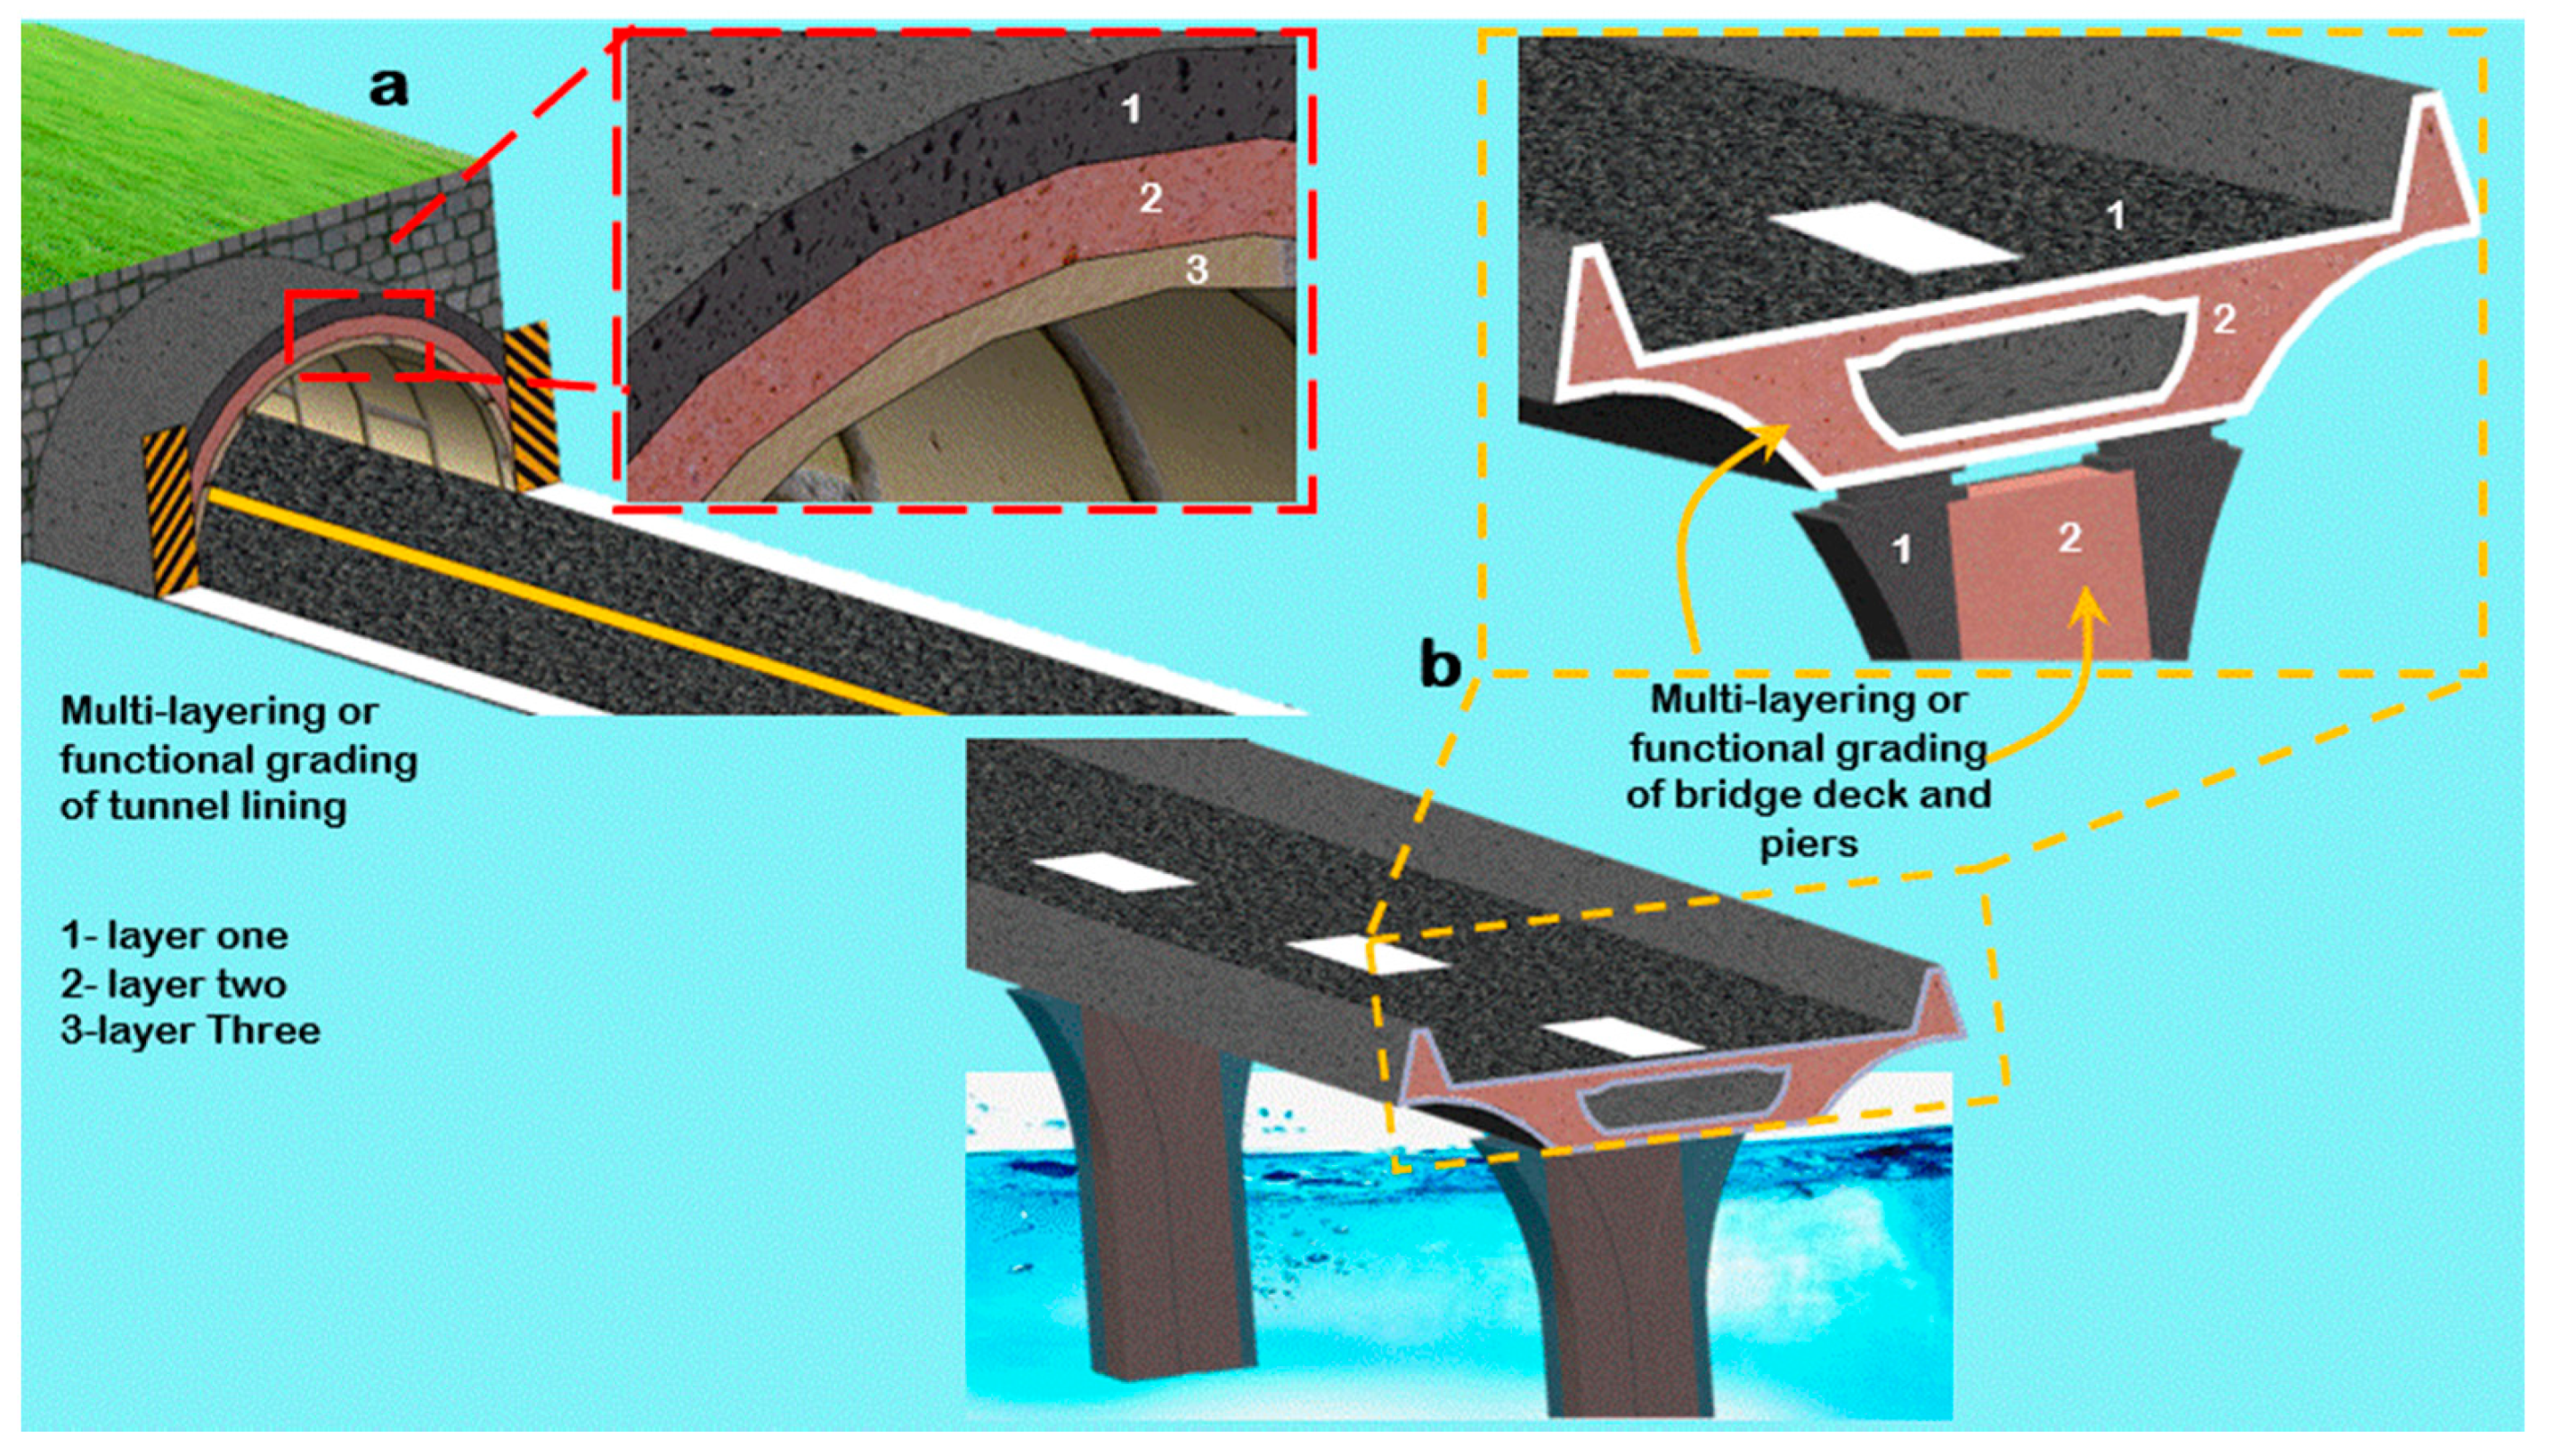
4. Conceptual Applications
5. Conclusions
- The addition of glass fiber to concrete can improve the strain performance as multi-strength peaks and fairly extended strains. However, the addition of glass fiber to 3D printed concrete will influence printability and reduce the mechanical performance of the resulting printed concrete by the unavoidable imperfection of surface and internal voids.
- The addition of microsilica to concrete has the effect of a stretched-out post-failure regime. In other words, it considerably reduces the brittle failure of concrete by sustaining a large strain at maximum load. However, in 3d printing, microsilica can result in a highly cohesive mix, lacking adequate followability, thus yielding a highly stratified sample after printing resulting in print imperfections such as bulking or necking.
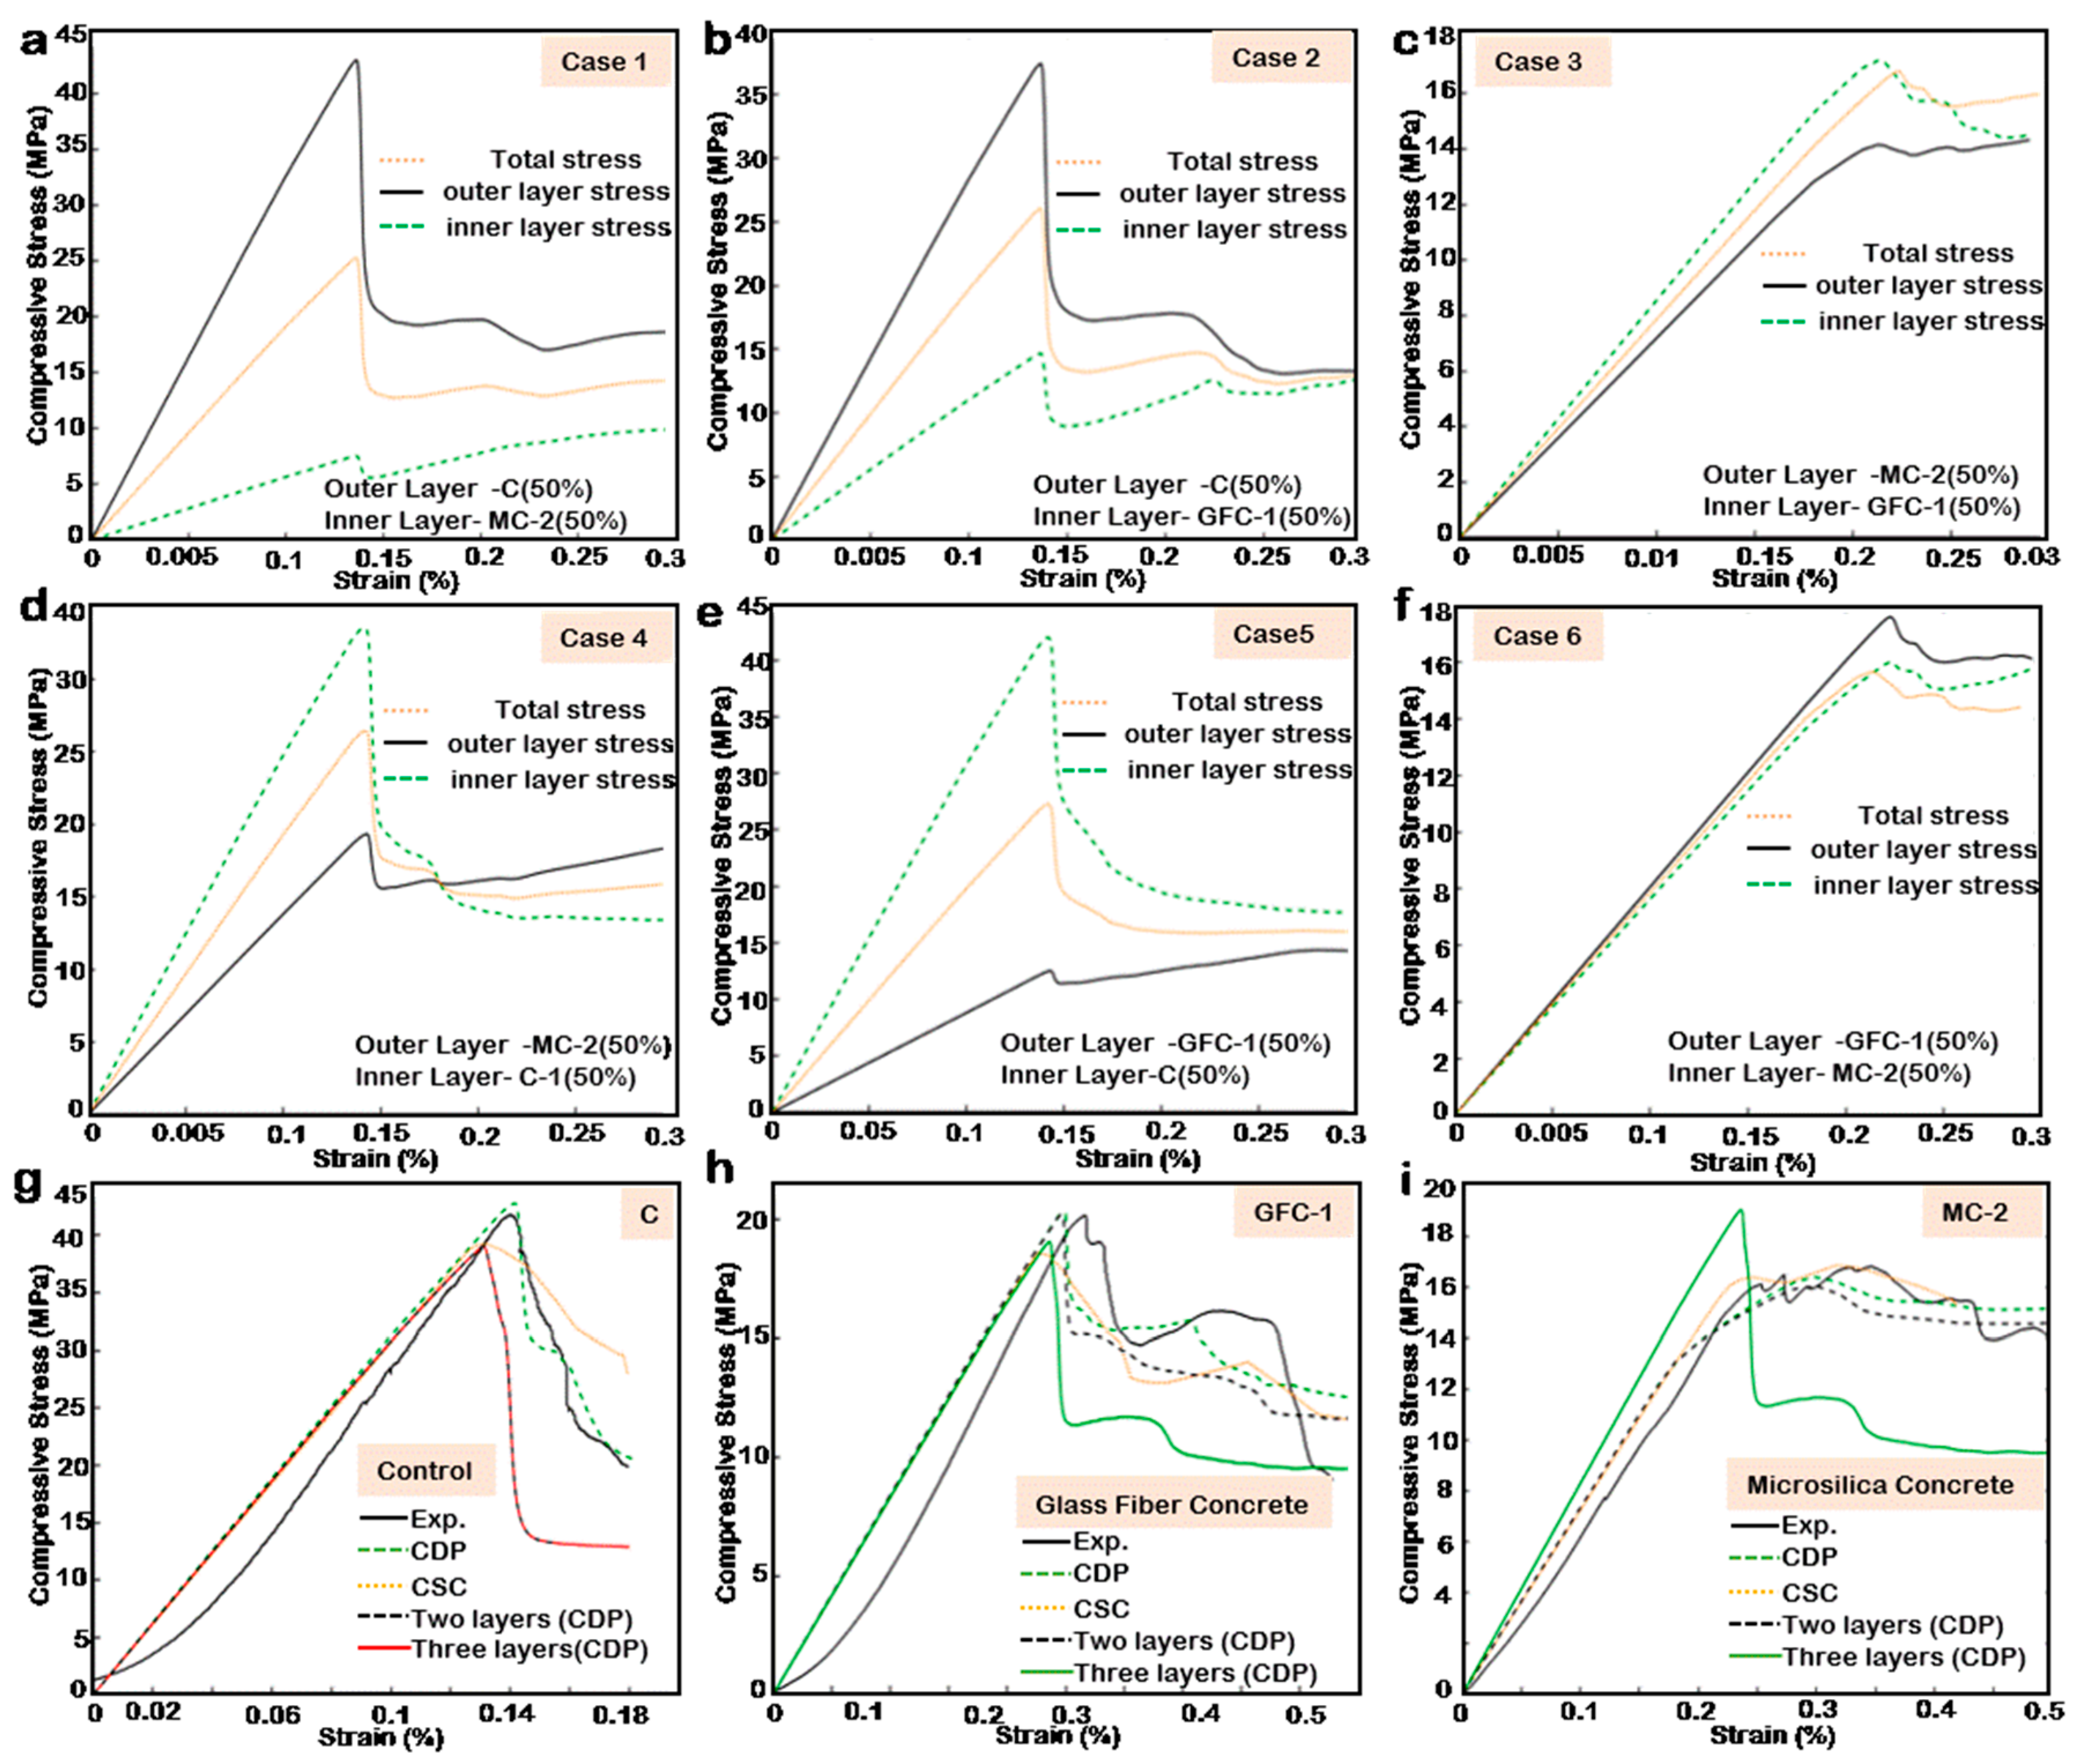
- For a two-layer configuration, the difference in the respective material strengths greatly influences the role of position and material volume. In other words, when the difference in material strength is high (Case 1, Case 2, Case 4, and Case 5), the stress–strain plot flips with position interchange, as shown in Cases 1 and 4 in Figure 4c,f. However, when the difference in strength is low, the position’s role is minimal, and layer volume governs the performance.
- When the stress–strain performances of the combined materials are similar, the resulting stress–strain plot amplifies the weaknesses and strengths of the source materials.
- The stress–strain behavior of the outer layer of concrete sample influences to a great extent the post-failure performance of the sample. Thus, in multilayering of concrete, the post-failure performance objective should influence the choice of materials regarding positioning. In addition, the peak strength should guide decision-making regarding volumetric ratios.
- A three-layer configuration model is influenced by volume if two of the three layers are allotted the same material. Furthermore, layer position has minimal to zero influence on the concrete models’ performance, provided each layer is allotted a different material and has equal volume.
Author Contributions
Funding
Data Availability Statement
Conflicts of Interest
Appendix A

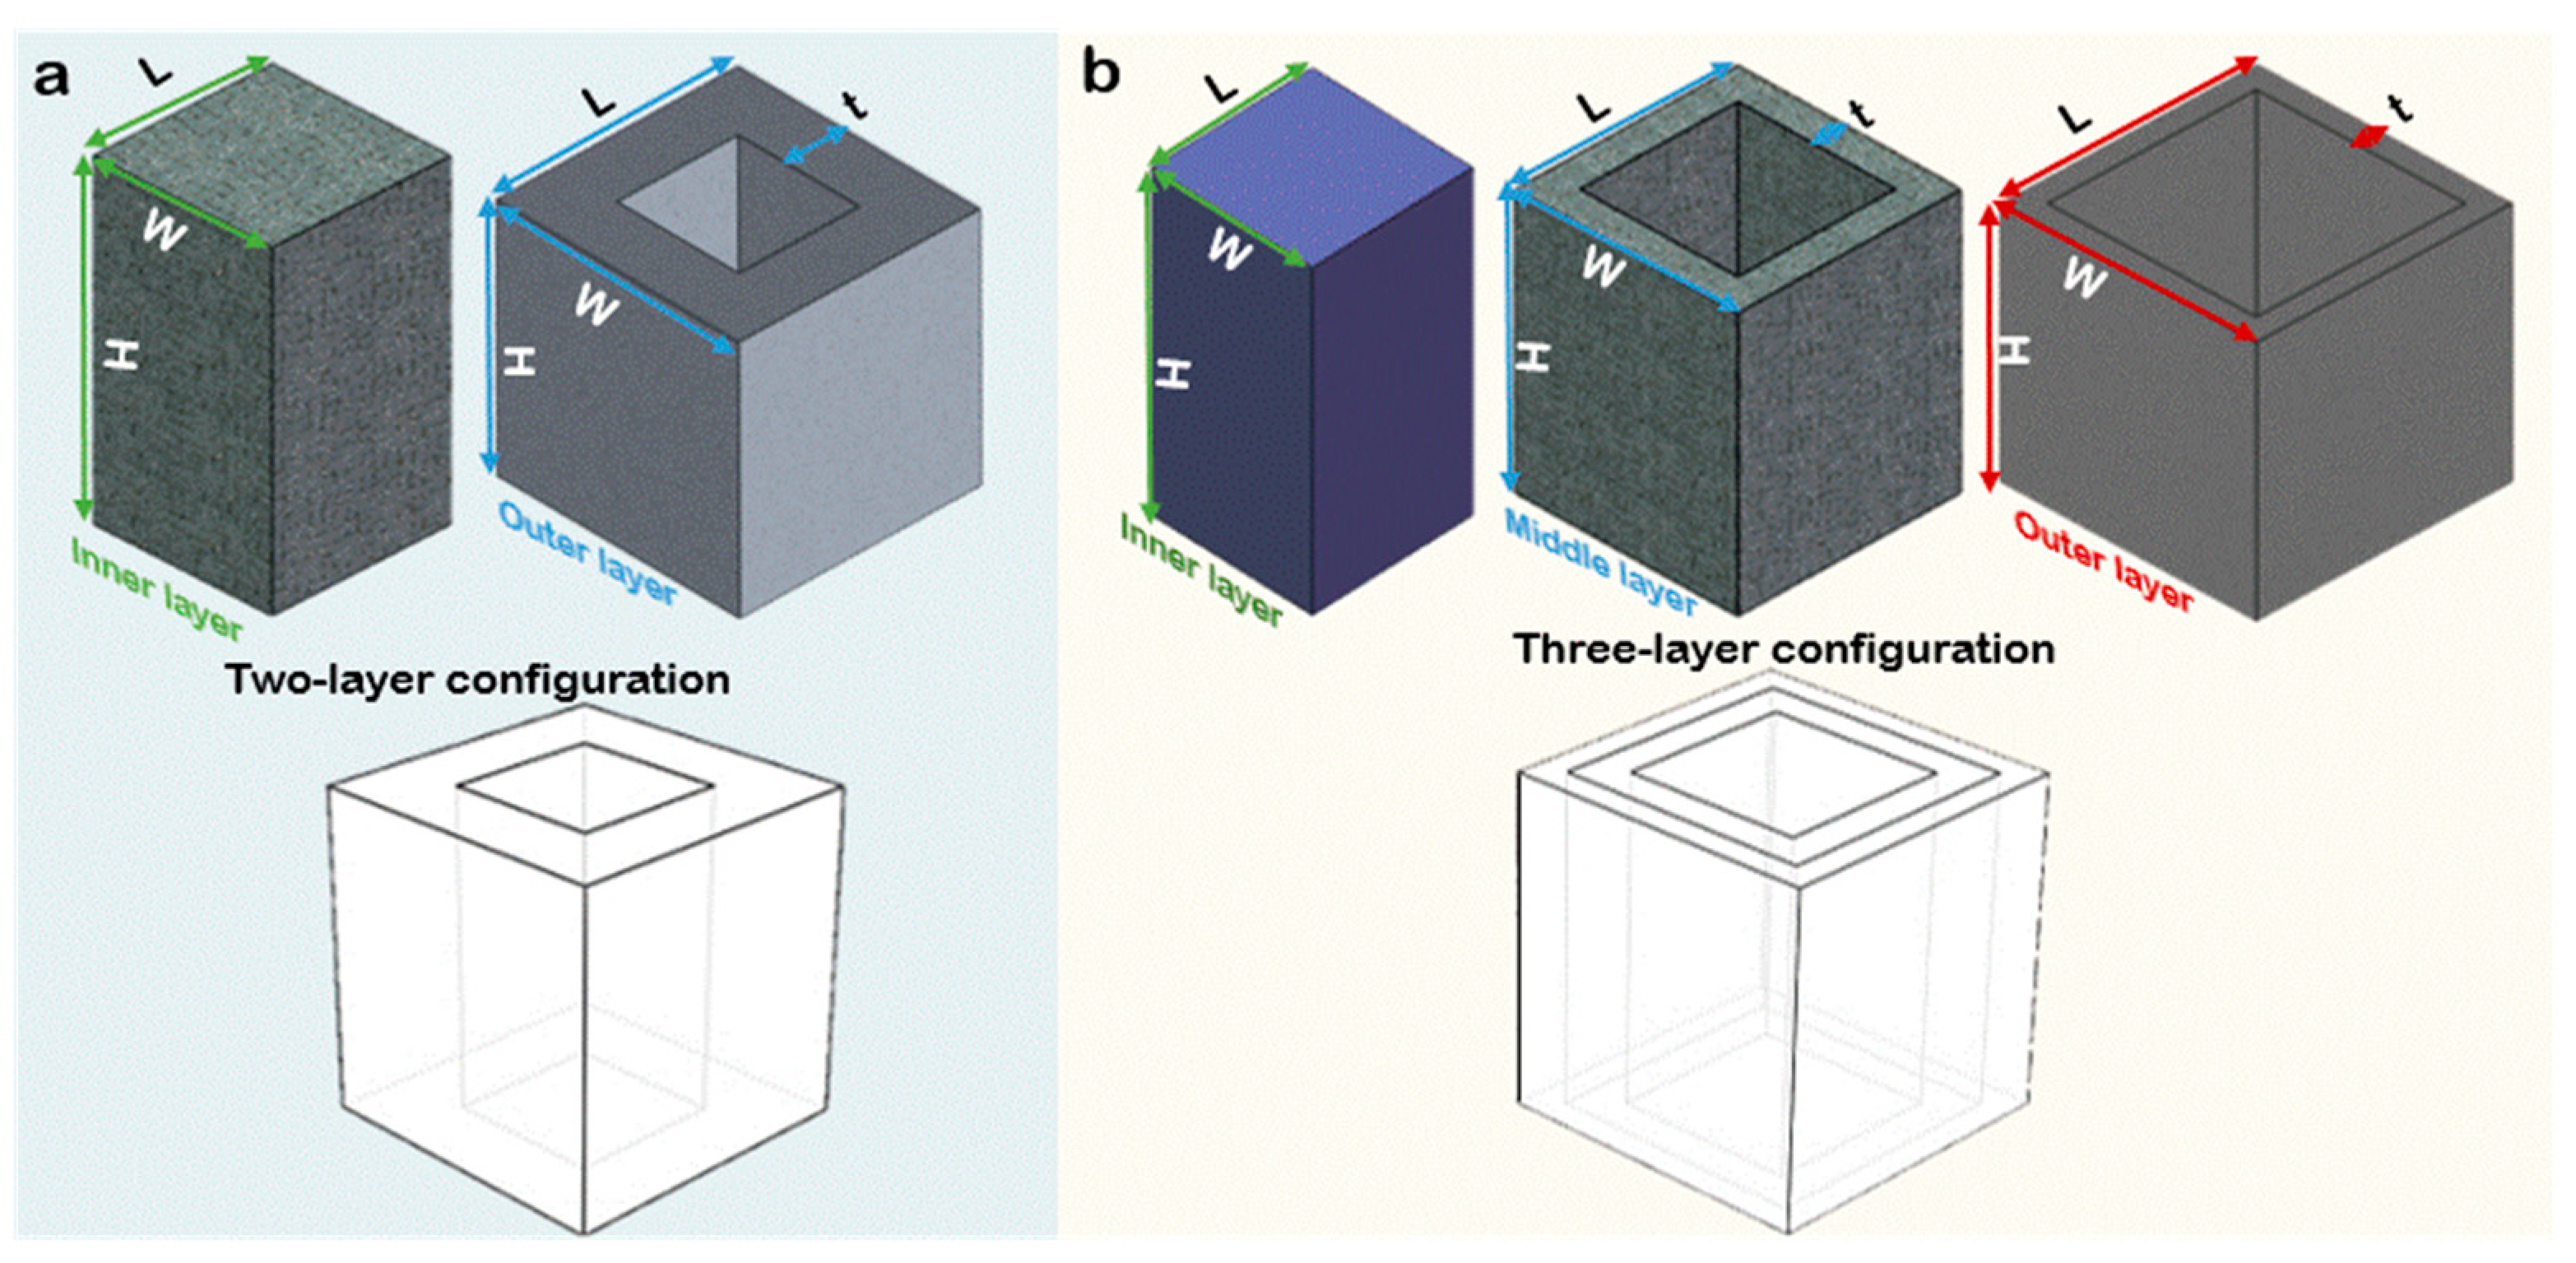
| Configuration | Volume (%) | Position | Width W (mm) | Length L (mm) | Height H (mm) | Thickness t (mm) |
|---|---|---|---|---|---|---|
| Two-layer | 25 | Inner | 50.00 | 50.00 | 100.00 | - |
| 75 | Outer | 100.00 | 100.00 | 100.00 | 25 | |
| 50 | Inner | 70.72 | 70.72 | 100.00 | - | |
| 50 | Outer | 100.00 | 100.00 | 100.00 | 14.64 | |
| 75 | Inner | 86.60 | 86.60 | 100.00 | - | |
| 25 | Outer | 100.00 | 100.00 | 100.00 | 6.7 | |
| Three-layer | 33 | Inner | 57.73 | 57.73 | 100.00 | - |
| 33 | Middle | 81.65 | 81.65 | 100.00 | 11.95 | |
| 33 | Outer | 100.00 | 100.00 | 100.00 | 9.175 |
Appendix A.1. Compressive Stress–Strain Modeling
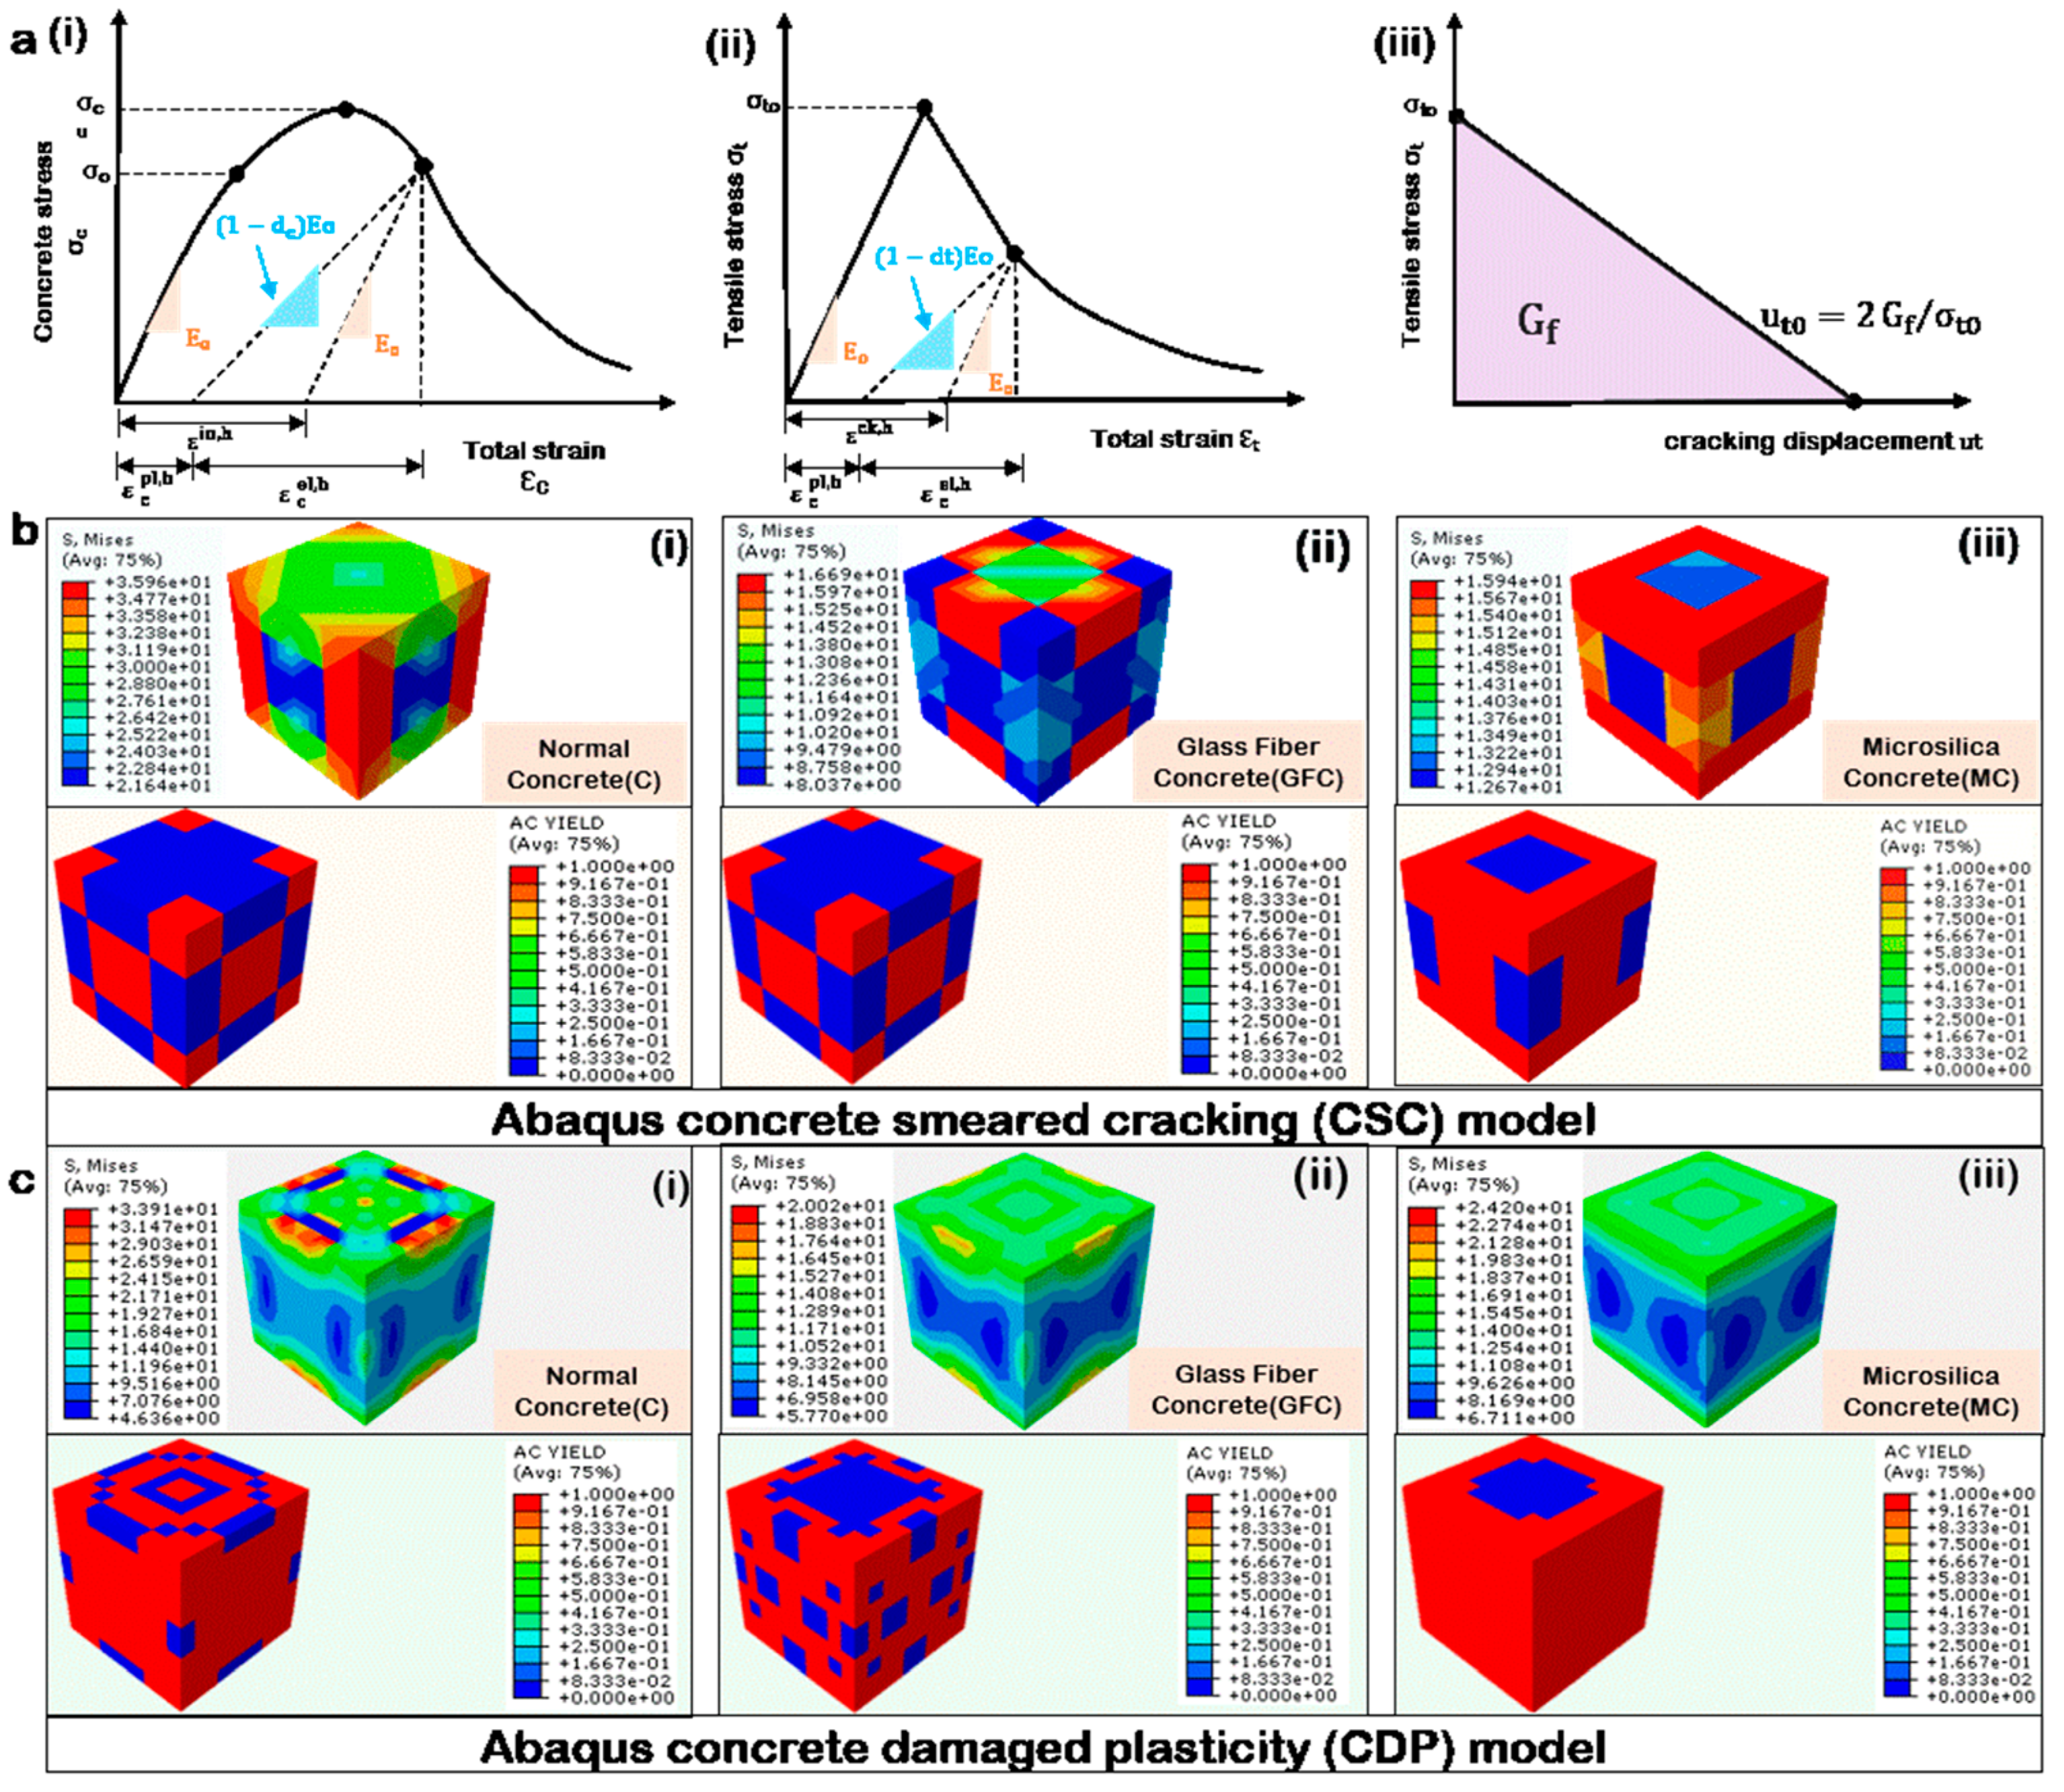
Appendix A.2. Tensile Stress–Strain Modeling
Appendix A.3. Boundary Conditions, Solvers, Loading Rate and Input Data
| Compression | Tension | ||||||
|---|---|---|---|---|---|---|---|
| Yield Stress (N/mm2) | Inelastic Strain | Damage Parameters | Direct Strain | Yield Stress (N/mm2) | Fracture Energy (N.mm/mm2) | Damage Parameters | Displacement Rate |
| 27.4663 # | 0 # | 0 | 0.00095 | 3.531510255 | 0.1418483 | 0 | 0 |
| 40.0668 * | 6.949 × 10⁻⁵ * | 0 | 0.0014 * | 0.99 | 1 | ||
| 33.1797 | 0.00044819 | 0.1718 | 0.00155 | ||||
| 23.4759 | 0.00084542 | 0.4140 | 0.001625 | ||||
| 20.8940 | 0.00105616 | 0.4785 | 0.00175 | ||||
| 17.2352 | 0.00142766 | 0.5698 | 0.002 | ||||
| 10.1460 | 0.00196307 | 0.7467 | 0.0023 | ||||
| Compression | Tension | ||||||
|---|---|---|---|---|---|---|---|
| Yield Stress (N/mm2) | Inelastic Strain | Damage Parameters | Direct Strain | Yield Stress (N/mm2) | Fracture Energy (N.mm/mm2) | Damage Parameters | Displacement Rate |
| 15 # | 0 # | 0 | 0.0019 | 3.028683453 | 0.124446573 | 0 | 0 |
| 19.36424 * | 7.947 × 10⁻⁵ * | 0 | 0.0025 * | 0.99 | 1 | ||
| 11.07944 | 0.0016150 | 0.427840 | 0.003 | ||||
| 11.49108 | 0.00206361 | 0.406582 | 0.0035 | ||||
| 11.95366 | 0.00250579 | 0.382694 | 0.004 | ||||
| 7.5821 | 0.00355223 | 0.608448 | 0.0045 | ||||
| Compression | Tension | ||||||
|---|---|---|---|---|---|---|---|
| Yield Stress (N/mm2) | Inelastic Strain | Damage Parameters | Direct Strain | Yield Stress (N/mm2) | Fracture Energy (N.mm/mm2) | Damage Parameters | Displacement Rate |
| 12.4455 # | 0 # | 0 | 0.0019 | 1.7672209 | 0.117664076 | 0 | 0 |
| 16.47673 * | 4.618 × 10⁻⁵ * | 0 | 0.0024* | 0.99 | 1 | ||
| 14.96941 | 0.0007615 | 0.0914817 | 0.0029 | ||||
| 15.84147 | 0.0011369 | 0.0385549 | 0.0034 | ||||
| 14.18350 | 0.0018737 | 0.1391801 | 0.0039 | ||||
| 12.32112 | 0.002639 | 0.2522110 | 0.0044 | ||||
| 12.18422 | 0.0031593 | 0.2605198 | 0.0049 | ||||
| 11.529645 | 0.0037529 | 0.3002470 | 0.0054 | ||||
| Dilation Angle (°) | Eccentricity | fB0/fc0 | K | Viscosity Parameter | Density (t/mm3) | Young’s Modulus (N/mm2) | Poisson’s Ratio | ||
|---|---|---|---|---|---|---|---|---|---|
| 35 | 0.1 | 1.16 | 0.67 | 0.007985 | 1.81 × 10⁻⁹ | 30,000 (C) | 8000 (GFC-1) | 7000 (MC-2) | 0.22 |
Appendix A.4. Stress Contributions and Effect of Interlayer Boundary Condition
References
- Craveiro, F.; Nazarian, S.; Bartolo, H.; Bartolo, P.; Duarte, J. An automated system for 3D printing functionally graded concrete-based materials. Addit. Manuf. 2020, 33, 101146. [Google Scholar] [CrossRef]
- Vilppo, J.; Kouhia, R.; Hartikainen, J.; Kolari, K.; Fedoroff, A.; Calonius, K. Anisotropic damage model for concrete and other quasi-brittle materials. Int. J. Solids Struct. 2021, 225, 111048. [Google Scholar] [CrossRef]
- Zhang, X.; Wu, H.; Li, J.; Pi, A.; Huang, F. A constitutive model of concrete based on Ottosen yield criterion. Int. J. Solids Struct. 2020, 193, 79–89. [Google Scholar] [CrossRef]
- Behbahani, A.E.; Barros, J.A.O.; Ventura-Gouveia, A. Plastic-damage smeared crack model to simulate the behaviour of structures made by cement based materials. Int. J. Solids Struct. 2015, 73, 20–40. [Google Scholar] [CrossRef] [Green Version]
- Yu, K.; McGee, W.; Ng, T.Y.; Zhu, H.; Li, V.C. 3D-printable engineered cementitious composites (3DP-ECC): Fresh and hardened properties. Cem. Concr. Res. 2021, 143, 106388. [Google Scholar] [CrossRef]
- Wolfs, R.J.M.; Bos, F.P.; Salet, T.A.M. Hardened properties of 3D printed concrete: The influence of process parameters on interlayer adhesion. Cem. Concr. Res. 2019, 119, 132–140. [Google Scholar] [CrossRef]
- Bai, G.; Wang, L.; Ma, G.; Sanjayan, J.; Bai, M. 3D printing eco-friendly concrete containing under-utilised and waste solids as aggregates. Cem. Concr. Compos. 2021, 120, 104037. [Google Scholar] [CrossRef]
- Muthukrishnan, S.; Ramakrishnan, S.; Sanjayan, J. Effect of alkali reactions on the rheology of one-part 3D printable geopolymer concrete. Cem. Concr. Compos. 2021, 116, 103899. [Google Scholar] [CrossRef]
- Muthukrishnan, S.; Kua, H.W.; Na Yu, L.; Chung, J.K.H. Fresh Properties of Cementitious Materials Containing Rice Husk Ash for Construction 3D Printing. J. Mater. Civ. Eng. 2020, 32, 04020195. [Google Scholar] [CrossRef]
- Muthukrishnan, S.; Ramakrishnan, S.; Sanjayan, J. Technologies for improving buildability in 3D concrete printing. Cem. Concr. Compos. 2021, 122, 104144. [Google Scholar] [CrossRef]
- Chen, X.; Zhuge, Y.; Al-Gemeel, A.N.; Xiong, Z. Compressive behaviour of concrete column confined with basalt textile reinforced ECC. Eng. Struct. 2021, 243, 112651. [Google Scholar] [CrossRef]
- Sukontasukkul, P.; Chindaprasirt, P.; Pongsopha, P.; Phoo-Ngernkham, T.; Tangchirapat, W.; Banthia, N. Effect of fly ash/microsilica ratio and curing condition on mechanical properties of fiber-reinforced geopolymer. J. Sustain. Ce-Ment-Based Mater. 2020, 9, 218–232. [Google Scholar] [CrossRef]
- Ghosh, S.; Deb, A. The role of material fabric in concrete under uniaxial compression. Int. J. Solids Struct. 2021, 226, 111079. [Google Scholar] [CrossRef]
- Chang, Y.; Shi, J.; Hou, Y.; Lu, T. Experimental study on the uniaxial compression performance of ultra-high-performance concrete constrained by stirrups and fibers. Eng. Struct. 2021, 243, 112656. [Google Scholar] [CrossRef]
- Banthia, N. Hybrid fiber reinforced concrete (HyFRC): Fiber synergy in high strength matrices. Mater. Struct. 2004, 37, 707–716. [Google Scholar] [CrossRef]
- Banthia, N.; Majdzadeh, F.; Wu, J.; Bindiganavile, V. Fiber synergy in Hybrid Fiber Reinforced Concrete (HyFRC) in flexure and direct shear. Cem. Concr. Compos. 2014, 48, 91–97. [Google Scholar] [CrossRef]
- Kasagani, H.; Rao, C. Effect of graded fibers on stress strain behaviour of Glass Fiber Reinforced Concrete in tension. Constr. Build. Mater. 2018, 183, 592–604. [Google Scholar] [CrossRef]
- Banthia, N.; Nandakumar, N. Crack growth resistance of hybrid fiber reinforced cement composites. Cem. Concr. Compos. 2003, 25, 3–9. [Google Scholar] [CrossRef]
- Nematollahi, B.; Xia, M.; Sanjayan, J.; Vijay, P. Effect of Type of Fiber on Inter-Layer Bond and Flexural Strengths of Extrusion-Based 3D Printed Geopolymer. Mater. Sci. Forum 2018, 939, 155–162. [Google Scholar] [CrossRef]
- Arunothayan, A.R.; Nematollahi, B.; Ranade, R.; Bong, S.H.; Sanjayan, J.G.; Khayat, K.H. Fiber orientation effects on ultra-high performance concrete formed by 3D printing. Cem. Concr. Res. 2021, 143, 106384. [Google Scholar] [CrossRef]
- Hambach, M.; Volkmer, D. Properties of 3D-printed fiber-reinforced Portland cement paste. Cem. Concr. Compos. 2017, 79, 62–70. [Google Scholar] [CrossRef]
- Wu, Z.; Khayat, K.H.; Shi, C. Changes in rheology and mechanical properties of ultra-high performance concrete with microsilica content. Cem. Concr. Res. 2019, 123, 105786. [Google Scholar] [CrossRef]
- Lin, Y.; Yan, J.; Wang, Z.; Fan, F.; Zou, C. Effect of microsilicas on fluidity of UHPC: Experiments, influence mechanism and evaluation methods. Constr. Build. Mater. 2019, 210, 451–460. [Google Scholar] [CrossRef]
- Nili, M.; Afroughsabet, V. The long-term compressive strength and durability properties of microsilica fiber-reinforced concrete. Mater. Sci. Eng. 2012, 531, 107–111. [Google Scholar] [CrossRef]
- Mazloom, M.; Ramezanianpour, A.A.; Brooks, J.J. Effect of microsilica on mechanical properties of high-strength concrete. Cem. Concr. Compos. 2004, 26, 347–357. [Google Scholar] [CrossRef]
- Siddique, R. Utilization of microsilica in concrete: Review of hardened properties. Resour. Conserv. Recycl. 2011, 55, 923–932. [Google Scholar] [CrossRef]
- Liu, C.; Wang, X.; Chen, Y.; Zhang, C.; Ma, L.; Deng, Z.; Chen, C.; Zhang, Y.; Pan, J.; Banthia, N. Influence of hy-droxypropyl methylcellulose and microsilica on stability, rheological properties, and printability of 3D printing foam concrete. Cem. Concr. Compos. 2021, 122, 104158. [Google Scholar] [CrossRef]
- Li, V.C. Performance Driven Design of Fiber Reinforced Cementitious Composites. In Fibre Reinforced Cement and Concrete: Proceedings of the Fourth RILEM International Symposium; Swamy, R.N., Ed.; Spon: London, UK, 1992; pp. 12–30. Available online: http://hdl.handle.net/2027.42/84754 (accessed on 13 October 2021).
- Yager, J.; Hoult, N.A.; Bentz, E. Evaluating the behaviour of functionally graded reinforced concrete without transverse reinforcement using distributed sensing. Constr. Build. Mater. 2021, 295, 123612. [Google Scholar] [CrossRef]
- Torelli, G.; Fernández, M.G.; Lees, J.M. Functionally graded concrete: Design objectives, production techniques and analysis methods for layered and continuously graded elements. Constr. Build. Mater. 2020, 242, 118040. [Google Scholar] [CrossRef]
- Zhang, N.; Lu, A.; Chen, X. Functionally Graded Concrete Structure. Sustain. Constr. Build. Mater. 2019. [Google Scholar] [CrossRef]
- Roesler, J.; Paulino, G.; Gaedicke, C.; Bordelon, A.; Park, K. Fracture Behavior of Functionally Graded Concrete Materials for Rigid Pavements. Transp. Res. Rec. 2007, 2037, 40–49. [Google Scholar] [CrossRef]
- Sridhar, R.; Prasad, D.R. Damage assessment of functionally graded reinforced concrete beams using hybrid fiber engineered cementitious composites. Structures 2019, 20, 832–847. [Google Scholar] [CrossRef]
- Chan, R.; Liu, X.; Galobardes, I. Parametric study of functionally graded concretes incorporating steel fibres and recycled aggregates. Constr. Build. Mater. 2020, 242, 118186. [Google Scholar] [CrossRef]
- Liu, X.; Yan, M.; Galobardes, I.; Sikora, K. Assessing the potential of functionally graded concrete using fibre reinforced and recycled aggregate concrete. Constr. Build. Mater. 2018, 171, 793–801. [Google Scholar] [CrossRef]
- Jin, Q.; Li, V.C. Development of lightweight engineered cementitious composite for durability enhancement of tall concrete wind towers. Cem. Concr. Compos. 2019, 96, 87–94. [Google Scholar] [CrossRef]
- Jin, Q.; Li, V.C. Structural and durability assessment of ECC/concrete dual-layer system for tall wind turbine towers. Eng. Struct. 2019, 196, 109338. [Google Scholar] [CrossRef]
- Choudhary, S.; Chaudhary, S.; Jain, A.; Gupta, R. Assessment of effect of rubber tyre fiber on functionally graded concrete. Mater. Today Proc. 2020, 28, 1496–1502. [Google Scholar] [CrossRef]
- Choudhary, S.; Chaudhary, S.; Jain, A.; Gupta, R. Valorization of waste rubber tyre fiber in functionally graded concrete. Mater. Today Proc. 2020, 32, 645–650. [Google Scholar] [CrossRef]
- Rahul, A.V.; Santhanam, M.; Meena, H.; Ghani, Z. Mechanical characterization of 3D printable concrete. Constr. Build. Mater. 2019, 227, 116710. [Google Scholar] [CrossRef]
- Earij, A.; Alfano, G.; Cashell, K.; Zhou, X. Non-linear three–dimensional finite–element modelling of reinforced–concrete beams: Computational challenges and experimental validation. Eng. Fail. Anal. 2017, 82, 92–115. [Google Scholar] [CrossRef]
- Michelini, E.; Bernardi, P.; Cerioni, R. Failure analysis of RC beams subjected to shear through different numerical approaches. Eng. Fail. Anal. 2017, 82, 229–242. [Google Scholar] [CrossRef]
- Evangelista, J.F.; Roesler, J.; Paulino, G. Numerical Simulations of Fracture Resistance of Functionally Graded Concrete Materials. Transp. Res. Rec. J. Transp. Res. Board 2009, 2113, 122–131. [Google Scholar] [CrossRef] [Green Version]
- Herrmann, M.; Sobek, W. Functionally graded concrete: Numerical design methods and experimental tests of mass-optimized structural components. Struct. Concr. 2017, 18, 54–66. [Google Scholar] [CrossRef]
- BS EN 12390-3:2019. Testing Hardened Concrete. In Compressive Strength of Test Specimens; British Standards Institution: London, UK, 2019. [Google Scholar]
- Jirásek, M. Damage and Smeared Crack Models. In CISM International Centre for Mechanical Sciences; Springer: Berlin/Heidelberg, Germany, 2011; pp. 1–49. [Google Scholar]
- Hillerborg, A.; Modéer, M.; Petersson, P.-E. Analysis of crack formation and crack growth in concrete by means of fracture mechanics and finite elements. Cem. Concr. Res. 1976, 6, 773–781. [Google Scholar] [CrossRef]
- Vecchio, F.J.; Collins, M.P. The Modified Compression-Field Theory for Reinforced Concrete Elements Subjected to Shear. ACI J. 1986, 83, 219–231. [Google Scholar]
- Selby, R.G.; Vecchio, F.J. A constitutive model for analysis of reinforced concrete solids. Can. J. Civ. Eng. 1997, 24, 460–470. [Google Scholar] [CrossRef]
- Abaqus CSC. Concrete Smeared Cracking. Abaqus-Docs.mit.edu. Available online: https://abaqus-docs.mit.edu/2017/English/SIMACAEMATRefMap/simamat-c-concrete.htm (accessed on 10 August 2021).
- DIANA FEA User Manual 10.5. Maekawa-Fukuura Concrete Model, Retrieved 12 August 2021, from Diana 10.5 documentation. Available online: https://dianafea.com/diana-manuals (accessed on 10 August 2021).
- Abaqus CDP. Concrete Damaged Plasticity. Abaqus-Docs.mit.edu. Available online: https://abaqus-docs.mit.edu/2017/English/SIMACAEMATRefMap/simamat-c-concretedamaged.htm (accessed on 10 August 2021).
- Kmiecik, P.; Kamiński, M. Modelling of reinforced concrete structures and composite structures with concrete strength degradation taken into consideration. Arch. Civ. Mech. Eng. 2011, 11, 623–636. [Google Scholar] [CrossRef]
- Lubliner, J.; Oliver, J.; Oller, S.; Onate, E. A plastic-damage model for concrete. Int. J. Solids Struct. 1989, 25, 299–326. [Google Scholar] [CrossRef]
- Alejano, L.R.; Bobet, A. Drucker–Prager Criterion. Rock Mech. Rock Eng. 2012, 45, 995–999. [Google Scholar] [CrossRef] [Green Version]
- Lee, J.; Fenves, G.L. Plastic-Damage Model for Cyclic Loading of Concrete Structures. J. Eng. Mech. 1998, 124, 892–900. [Google Scholar] [CrossRef]
- Wosatko, A.; Szczecina, M.; Winnicki, A. Selected Concrete Models Studied Using Willam’s Test. Materials 2020, 13, 4756. [Google Scholar] [CrossRef] [PubMed]
- Fedoroff, A.; Calonius, K.; Kuutti, J. Behavior of the Abaqus CDP model in simple stress states. Raken. Mek. 2019, 52, 87–113. [Google Scholar] [CrossRef] [Green Version]
- Karnovsky, I.A. Elastic Stability of Arches. In Theory of Arched Structures; Springer Science and Business Media LLC: Berlin, Germany, 2011; pp. 197–231. [Google Scholar]
- Wahalathantri, B.; Thambiratnam, D.; Chan, T.; Fawzia, S. A Material Model for Flexural Crack Simulation in Reinforced Concrete Elements Using ABAQUS. In Proceedings of the First International Conference on Engineering, Designing and Developing the Built Environment for Sustainable Wellbeing, Queensland, Australia, 17 May 2011; pp. 260–264. [Google Scholar]
- Hafezolghorani, M.; Hejazi, F.; Vaghei, R.; Bin Jaafar, M.S.; Karimzade, K. Simplified Damage Plasticity Model for Concrete. Struct. Eng. Int. 2017, 27, 68–78. [Google Scholar] [CrossRef]
| Constituent | SiO2 | Fe2O3 | AL2O3 | CaO + MgO | C | K2O + Na2O | |
|---|---|---|---|---|---|---|---|
| Weight percentage (%) | >88 | <1.0 | <1.0 | <0.7 | <1.5 | <1.5 | |
| Property | Loss on Ignition | Moisture | PH value (pH) | Specific surface area (m2/kg) | Specific gravity | ||
| Value | <3% | <2% | 4.5–8.5 | 15 | 2.3 | ||
| Material | Length (mm) | Filament Diameter (mm) | Tensile Strength (MPa) | Elastic Modulus (MPa) | Density |
|---|---|---|---|---|---|
| Glass fiber | 3–6 | 0.5 | 1500–1700 | 72,000 | 2500 |
| Category | Tag | Quarry Dust | OPC | Microsilica | Glass Fiber (% vol.) | SRI |
|---|---|---|---|---|---|---|
| Control (C) | Control | 900 | 600 | 80 | - | 0.94 |
| Glass Fiber Concrete (GFC) | GFC-1 | 835 | 600 | 160 | 1.0 | 0.98 |
| GFC-2 | 835 | 600 | 160 | 1.5 | 0.96 | |
| GFC-3 | 835 | 600 | 160 | 2.0 | 0.94 | |
| Microsilica Concrete (MC) | 16%MC-1 | 846 | 600 | 144 | 0.5 | 0.97 |
| 23%MC-2 | 792 | 600 | 207 | 0.5 | 0.96 | |
| 30%MC-3 | 739 | 600 | 270 | 0.5 | 0.96 |
| Model Type | Post-Failure Stiffness | Yield Function | Flow Rule | Crack Detection | Damage Recovery (Loading and Unloading) | |
|---|---|---|---|---|---|---|
| CSC [50] | Continuum, smeared cracking. Cracks are fixed and limited to one per integration point | Damaged-elasticity, strain hardening, and tension softening | Simple compression yield surface & the coulomb line | Associated: over predicts inelastic volume strain | Orientation storage of individual cracks, then “plastic “strains of cracks are calculated | Cracks can close completely when stress across them becomes compressive. Not designed for cyclic loading |
| MFC [51] | Continuum, smeared cracking. It can be rotating or fixed with more than three cracks and up to a maximum of six cracks per integration point | MCC curves and a selection of tension stiffening or softening curves | Reduces the shear modulus of the concrete by K until the failure limit is reached | Governed by plastic dilatancy, a function of the first strain invariant and K | Makes use of K. Stores the orientation of individual cracks; then, stresses are evaluated in the direction of the respective cracks | The crack reclosing option can be defined |
| CDP [52] | Continuum plasticity-based. Fracture energy cracking criterion can be initiated for tensile failure in unreinforced/under-reinforced concrete. | Damaged-elasticity, strain hardening and tension stiffening or softening | Drucker–Prager criteria | Non-associated. Hyperbolic flow potential: fairly accurate | No direct detection. Softening begins beyond tensile failure stress | Compressive stiffness is recoverable upon cracks closure as the loads transition from tensile to compressive. Designed for cyclic loading |
| Inner (Layer Volume: 25%,50%,75%) | ||||
|---|---|---|---|---|
| Outer (layer volume: 25%,50%,75%) | Control (C) | MC-2 | GFC-1 | |
| Control | C | Case 1: C_MC-2 | Case 2: C_GFC-1 | |
| MC-2 | Case 4: MC-2_C | MC-2 | Case 3: MC-2_GFC-1 | |
| GFC-1 | Case 5: GFC-1_C | Case 6: GFC-1_MC-2 | GFC-1 | |
| Inner (Layer Volume: 33.333% Each) | ||||
|---|---|---|---|---|
| Outer and mid (layer volume: 33.333% each) | Control (C) | MC-2 | GFC-1 | |
| Control_MC-2 | Class 1–Case 1: C_MC-2_C | Class 1–Case 2: MC-2_C_MC-2 | Class 3–Case 3,4: C_MC-2_GFC-1 MC-2_C_GFC-1 | |
| Control_GFC-1 | Class 1–Case 5: C_GFC-1_C | Class 4–Case 6,7: C-GFC-1_MC-2 GFC-1_C_MC-2 | Class 2–Case 8: GFC-1_C_GFC-1 | |
| MC-2_GFC-1 | Class 5–Case 9,10: MC-2_GFC-1_C GFC-1_MC-2_C | Class 2–Case 11: MC-2_GFC-1_MC-2 | Class 2–Case 12: GFC-1_MC-2_GFC-1 | |
Publisher’s Note: MDPI stays neutral with regard to jurisdictional claims in published maps and institutional affiliations. |
© 2021 by the authors. Licensee MDPI, Basel, Switzerland. This article is an open access article distributed under the terms and conditions of the Creative Commons Attribution (CC BY) license (https://creativecommons.org/licenses/by/4.0/).
Share and Cite
Liu, H.; Egbe, K.-J.I.; Wang, H.; Matin Nazar, A.; Jiao, P.; Zhu, R. A Numerical Study on 3D Printed Cementitious Composites Mixes Subjected to Axial Compression. Materials 2021, 14, 6882. https://doi.org/10.3390/ma14226882
Liu H, Egbe K-JI, Wang H, Matin Nazar A, Jiao P, Zhu R. A Numerical Study on 3D Printed Cementitious Composites Mixes Subjected to Axial Compression. Materials. 2021; 14(22):6882. https://doi.org/10.3390/ma14226882
Chicago/Turabian StyleLiu, Hanqiu, King-James Idala Egbe, Haipeng Wang, Ali Matin Nazar, Pengcheng Jiao, and Ronghua Zhu. 2021. "A Numerical Study on 3D Printed Cementitious Composites Mixes Subjected to Axial Compression" Materials 14, no. 22: 6882. https://doi.org/10.3390/ma14226882
APA StyleLiu, H., Egbe, K.-J. I., Wang, H., Matin Nazar, A., Jiao, P., & Zhu, R. (2021). A Numerical Study on 3D Printed Cementitious Composites Mixes Subjected to Axial Compression. Materials, 14(22), 6882. https://doi.org/10.3390/ma14226882