
Effect of Temperature on Microstructure and Mechanical Properties of Fe-9Ni-2Cu Steel during the Tempering Process


Abstract
:1. Introduction
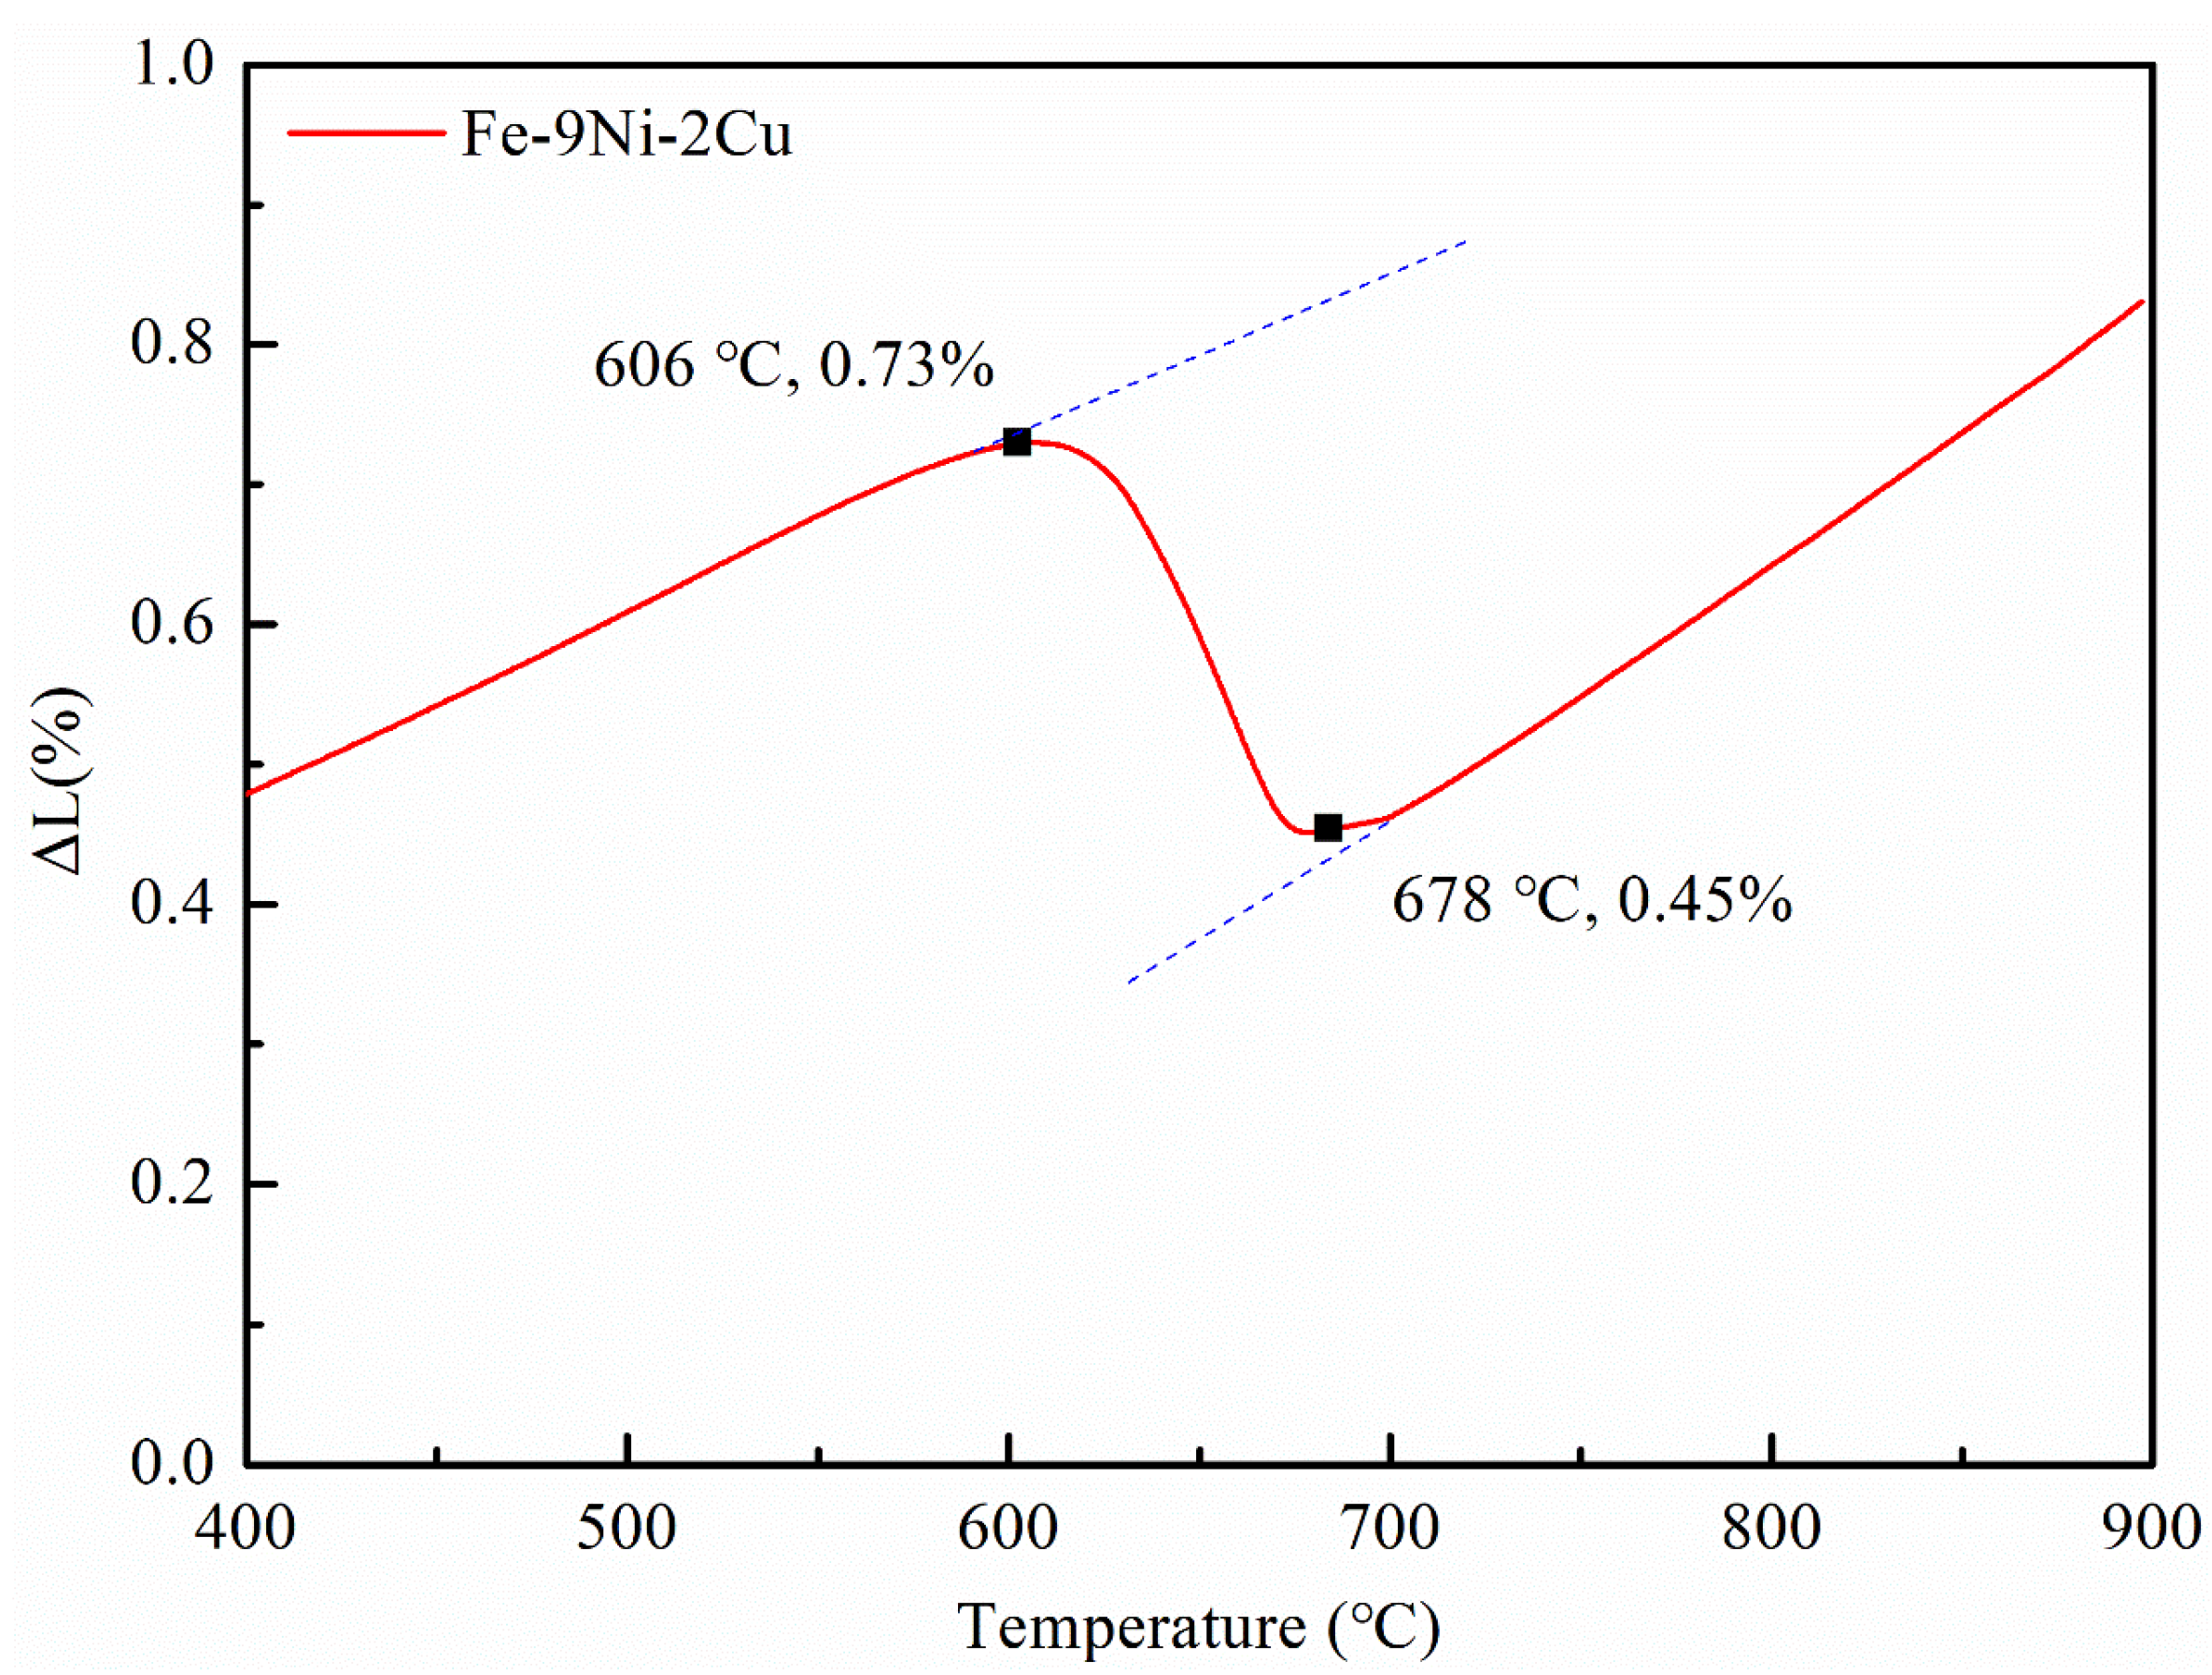
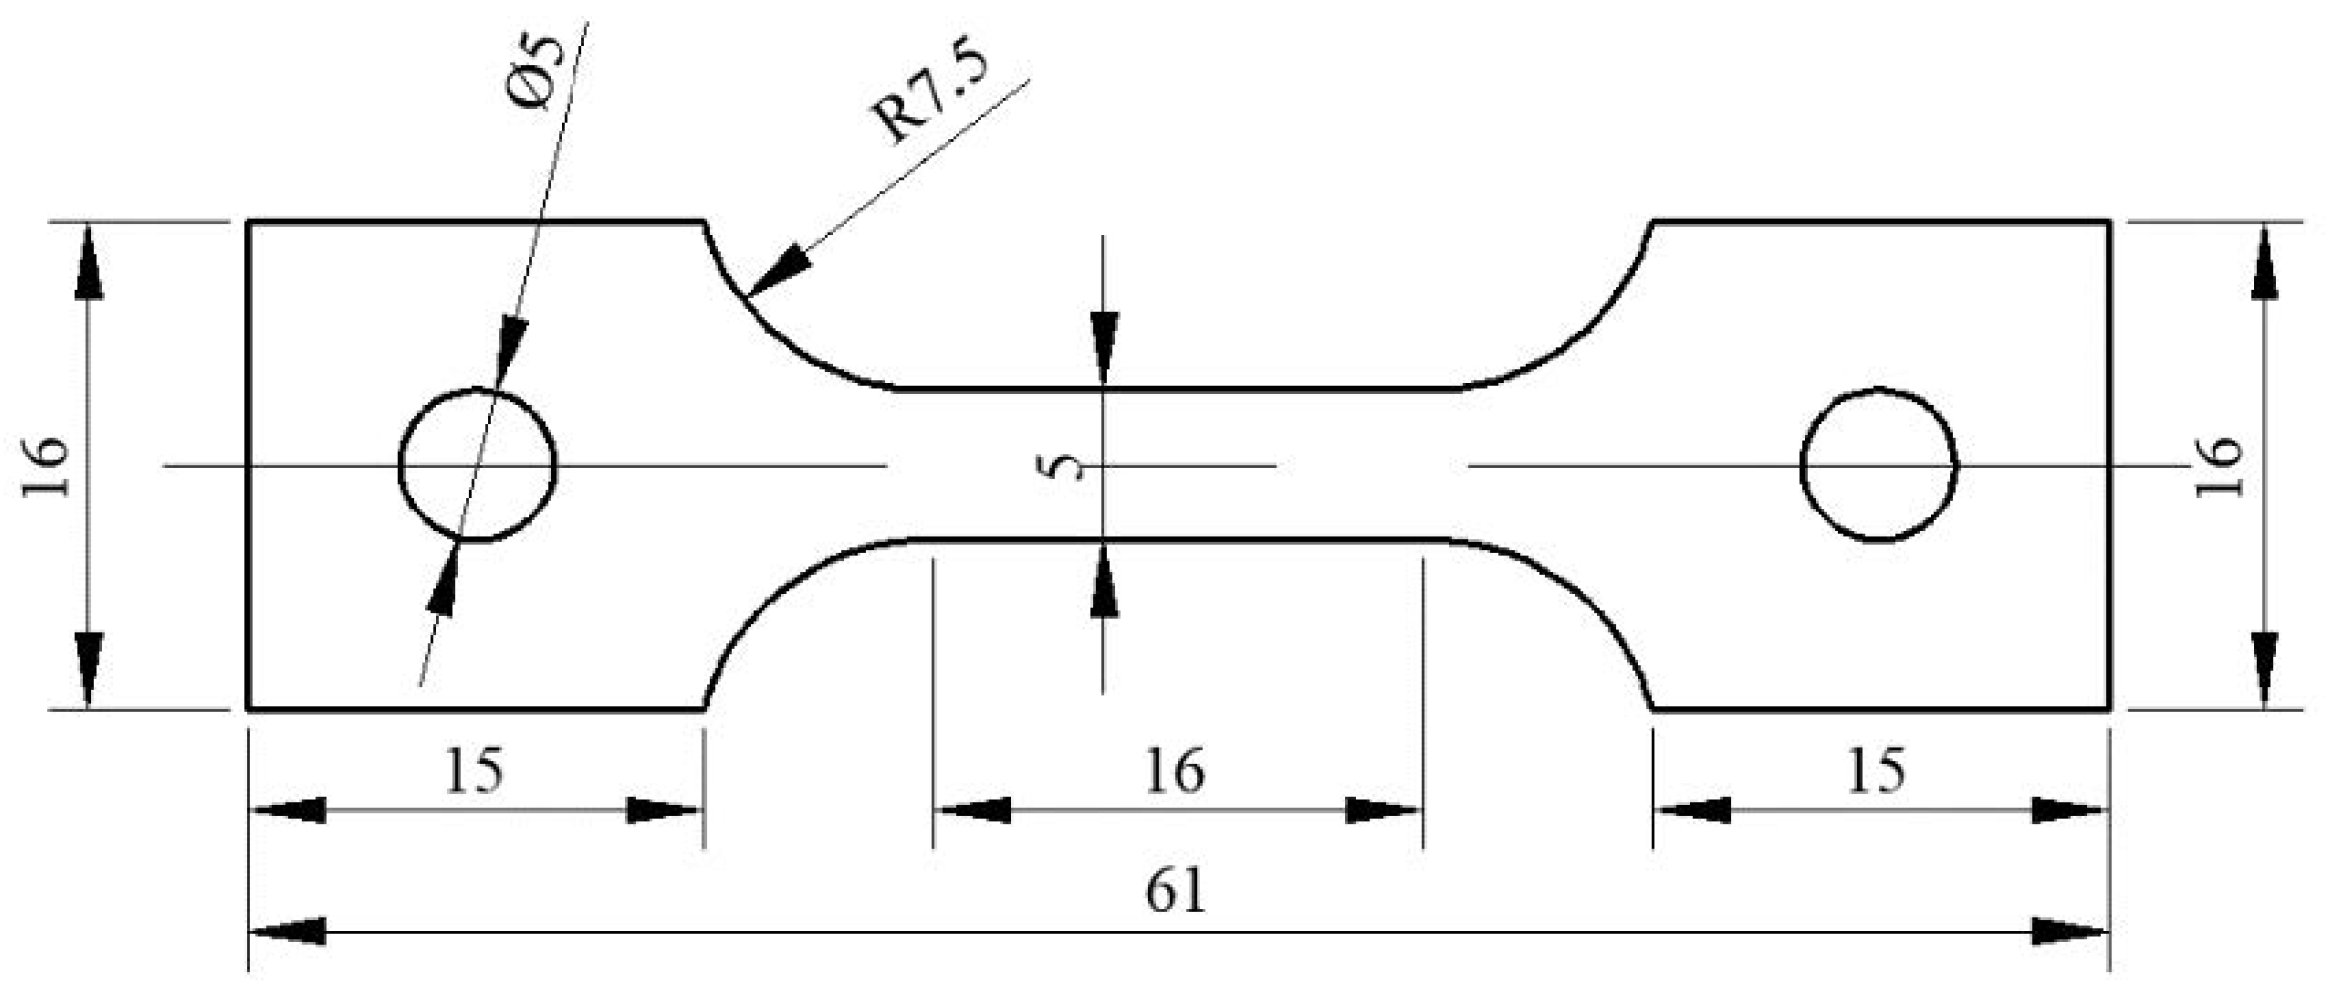
2. Experiment
3. Results
3.1. Mechanical Properties
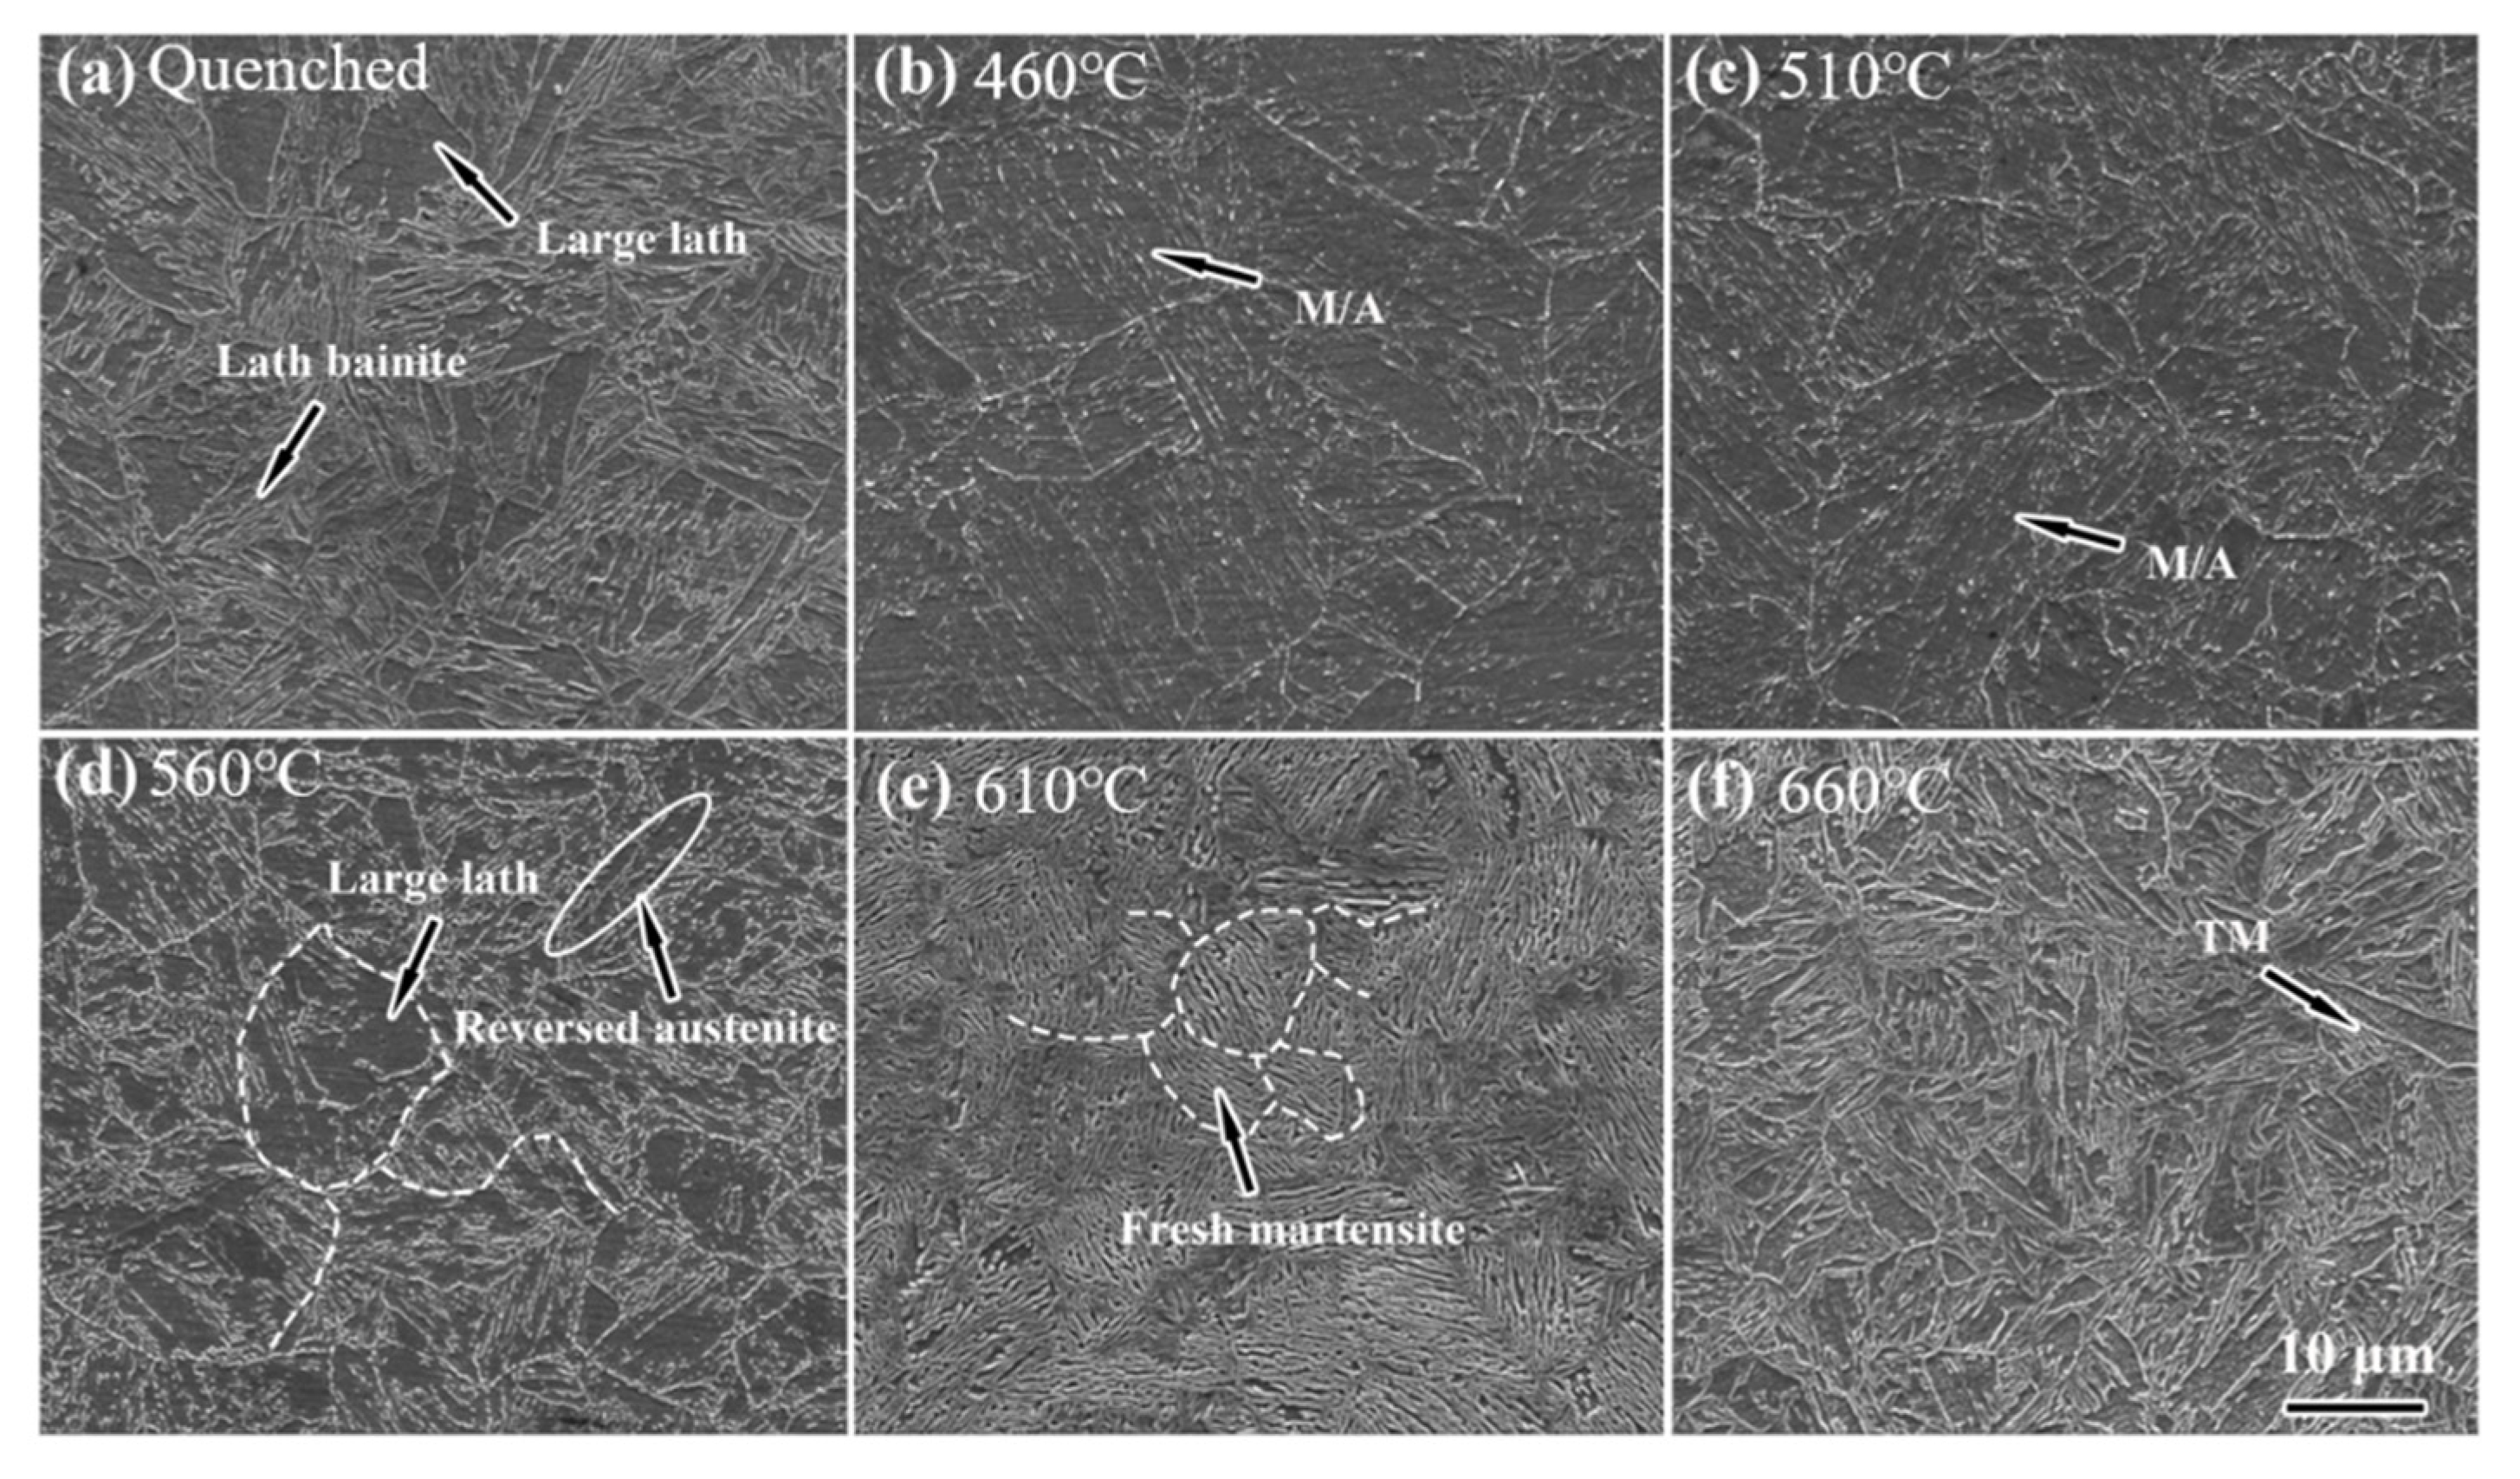
3.2. Microstructure Characterization
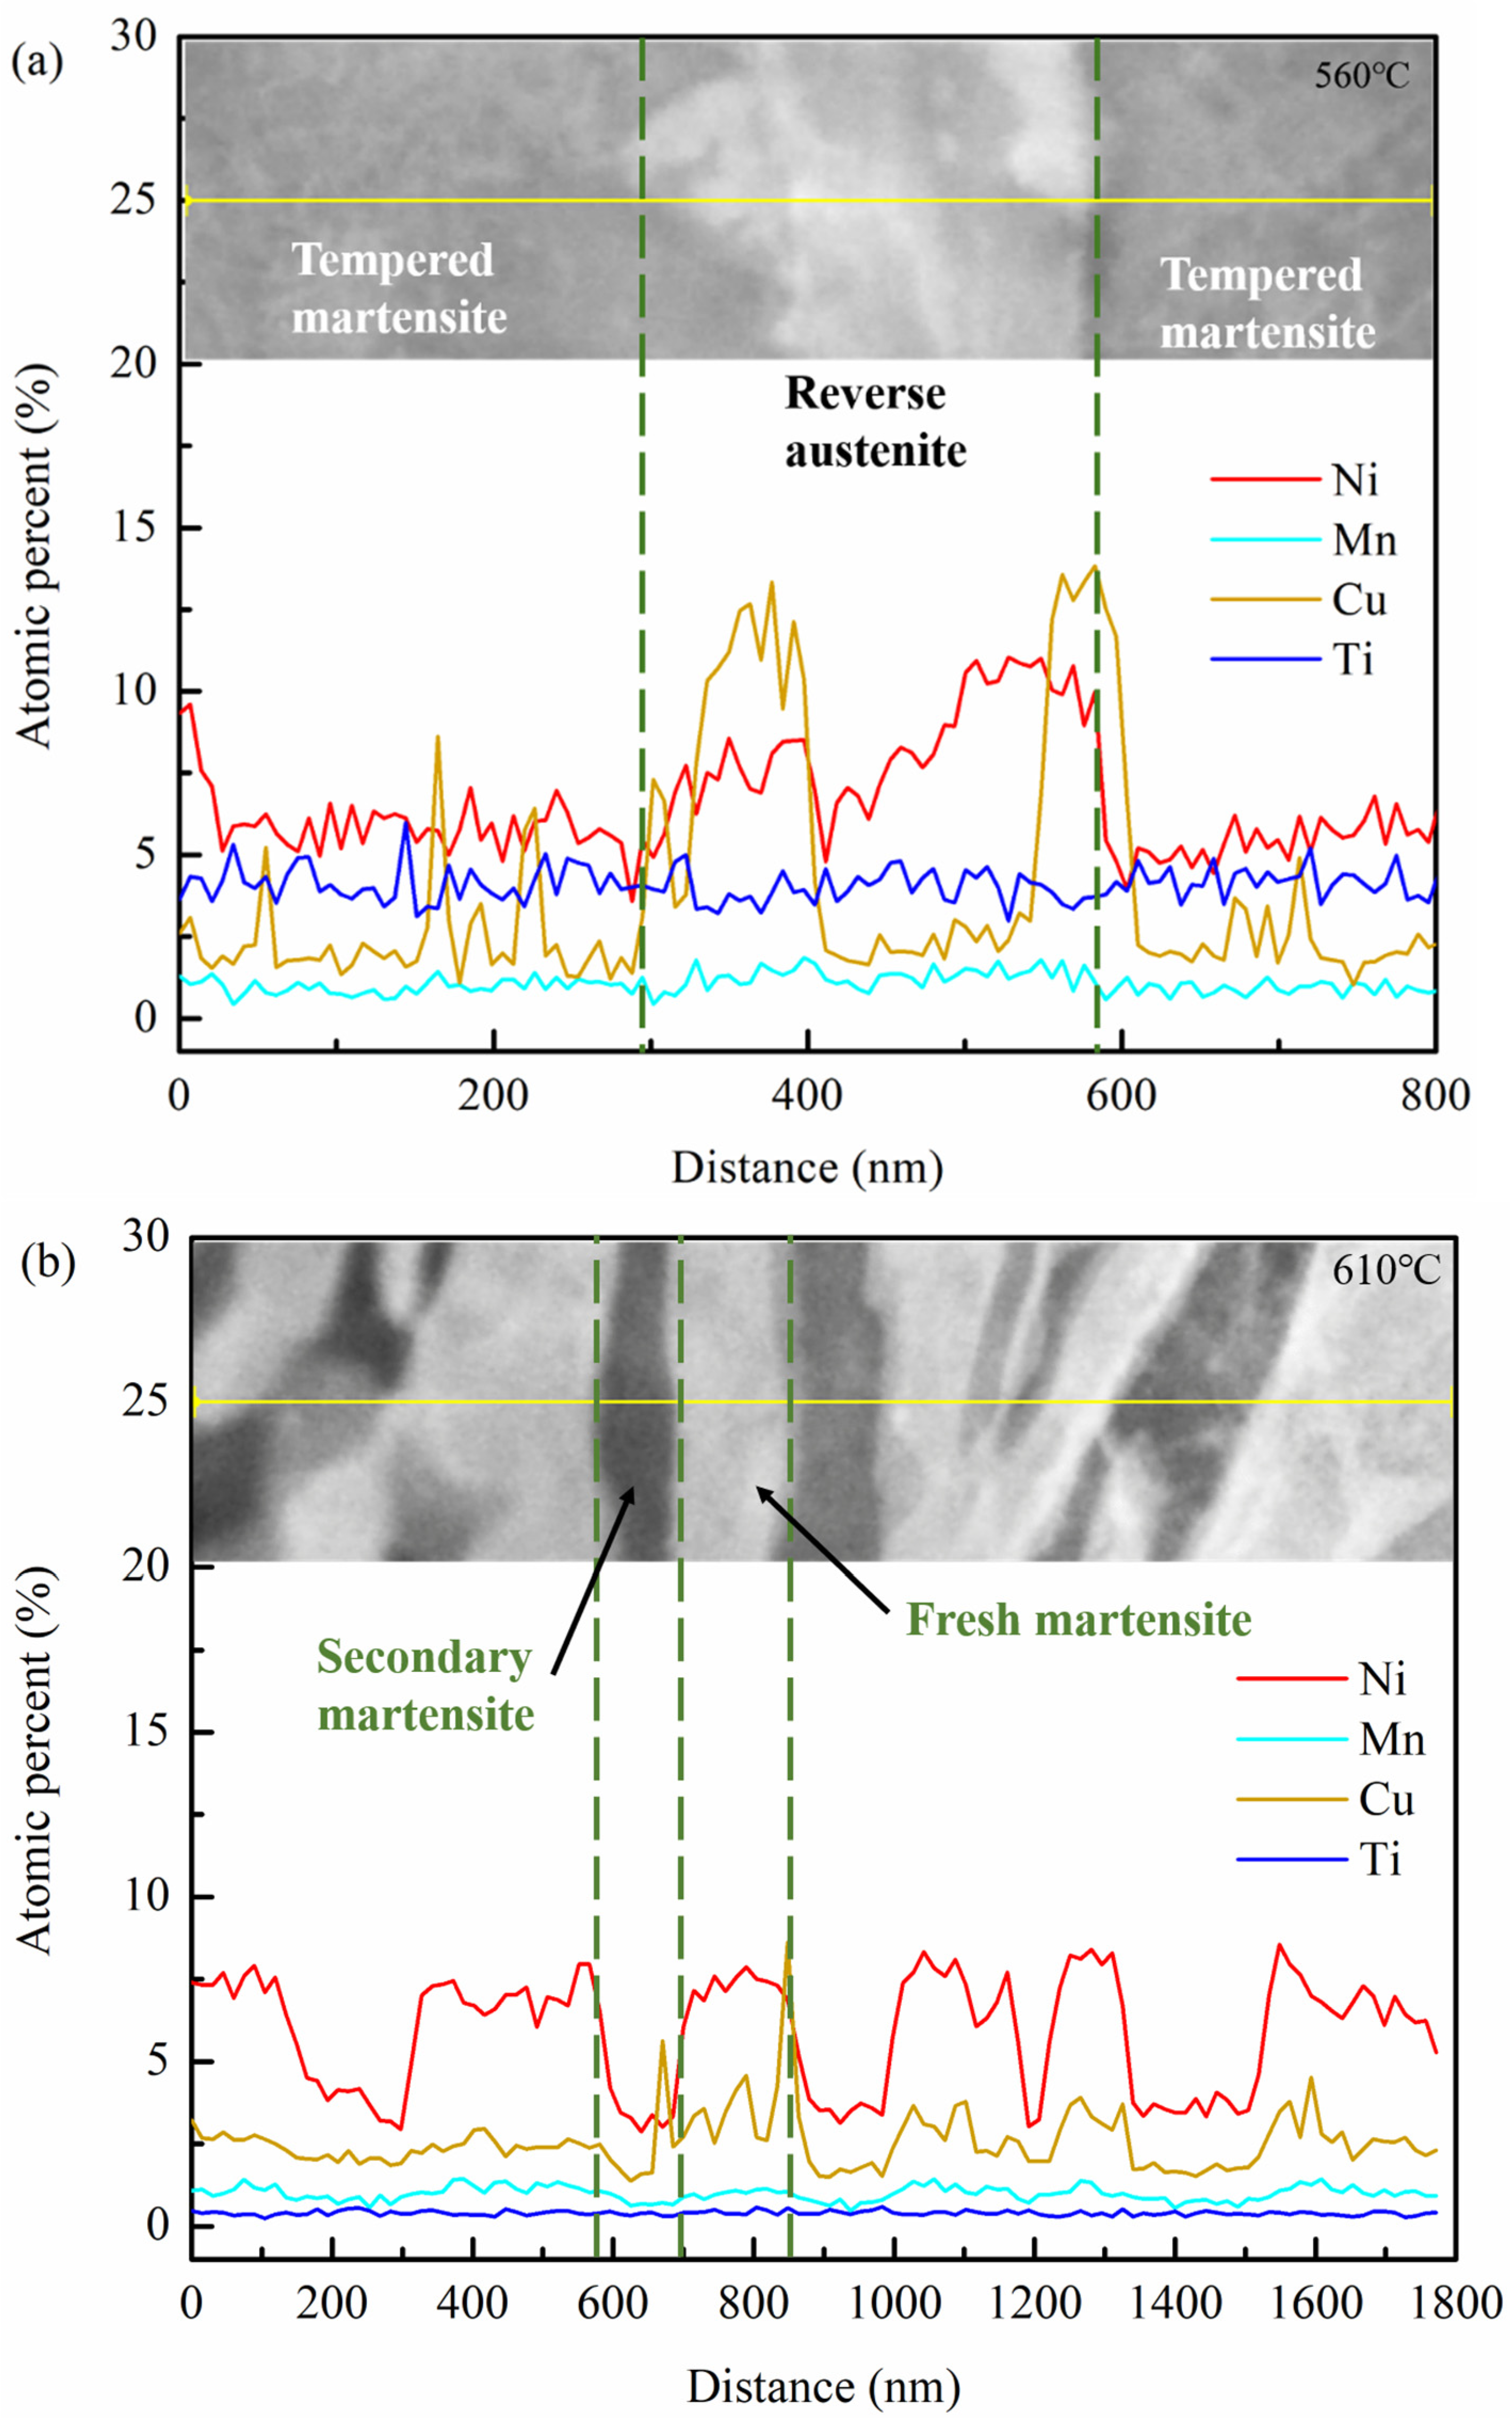
4. Discussion
5. Conclusions
- (1)
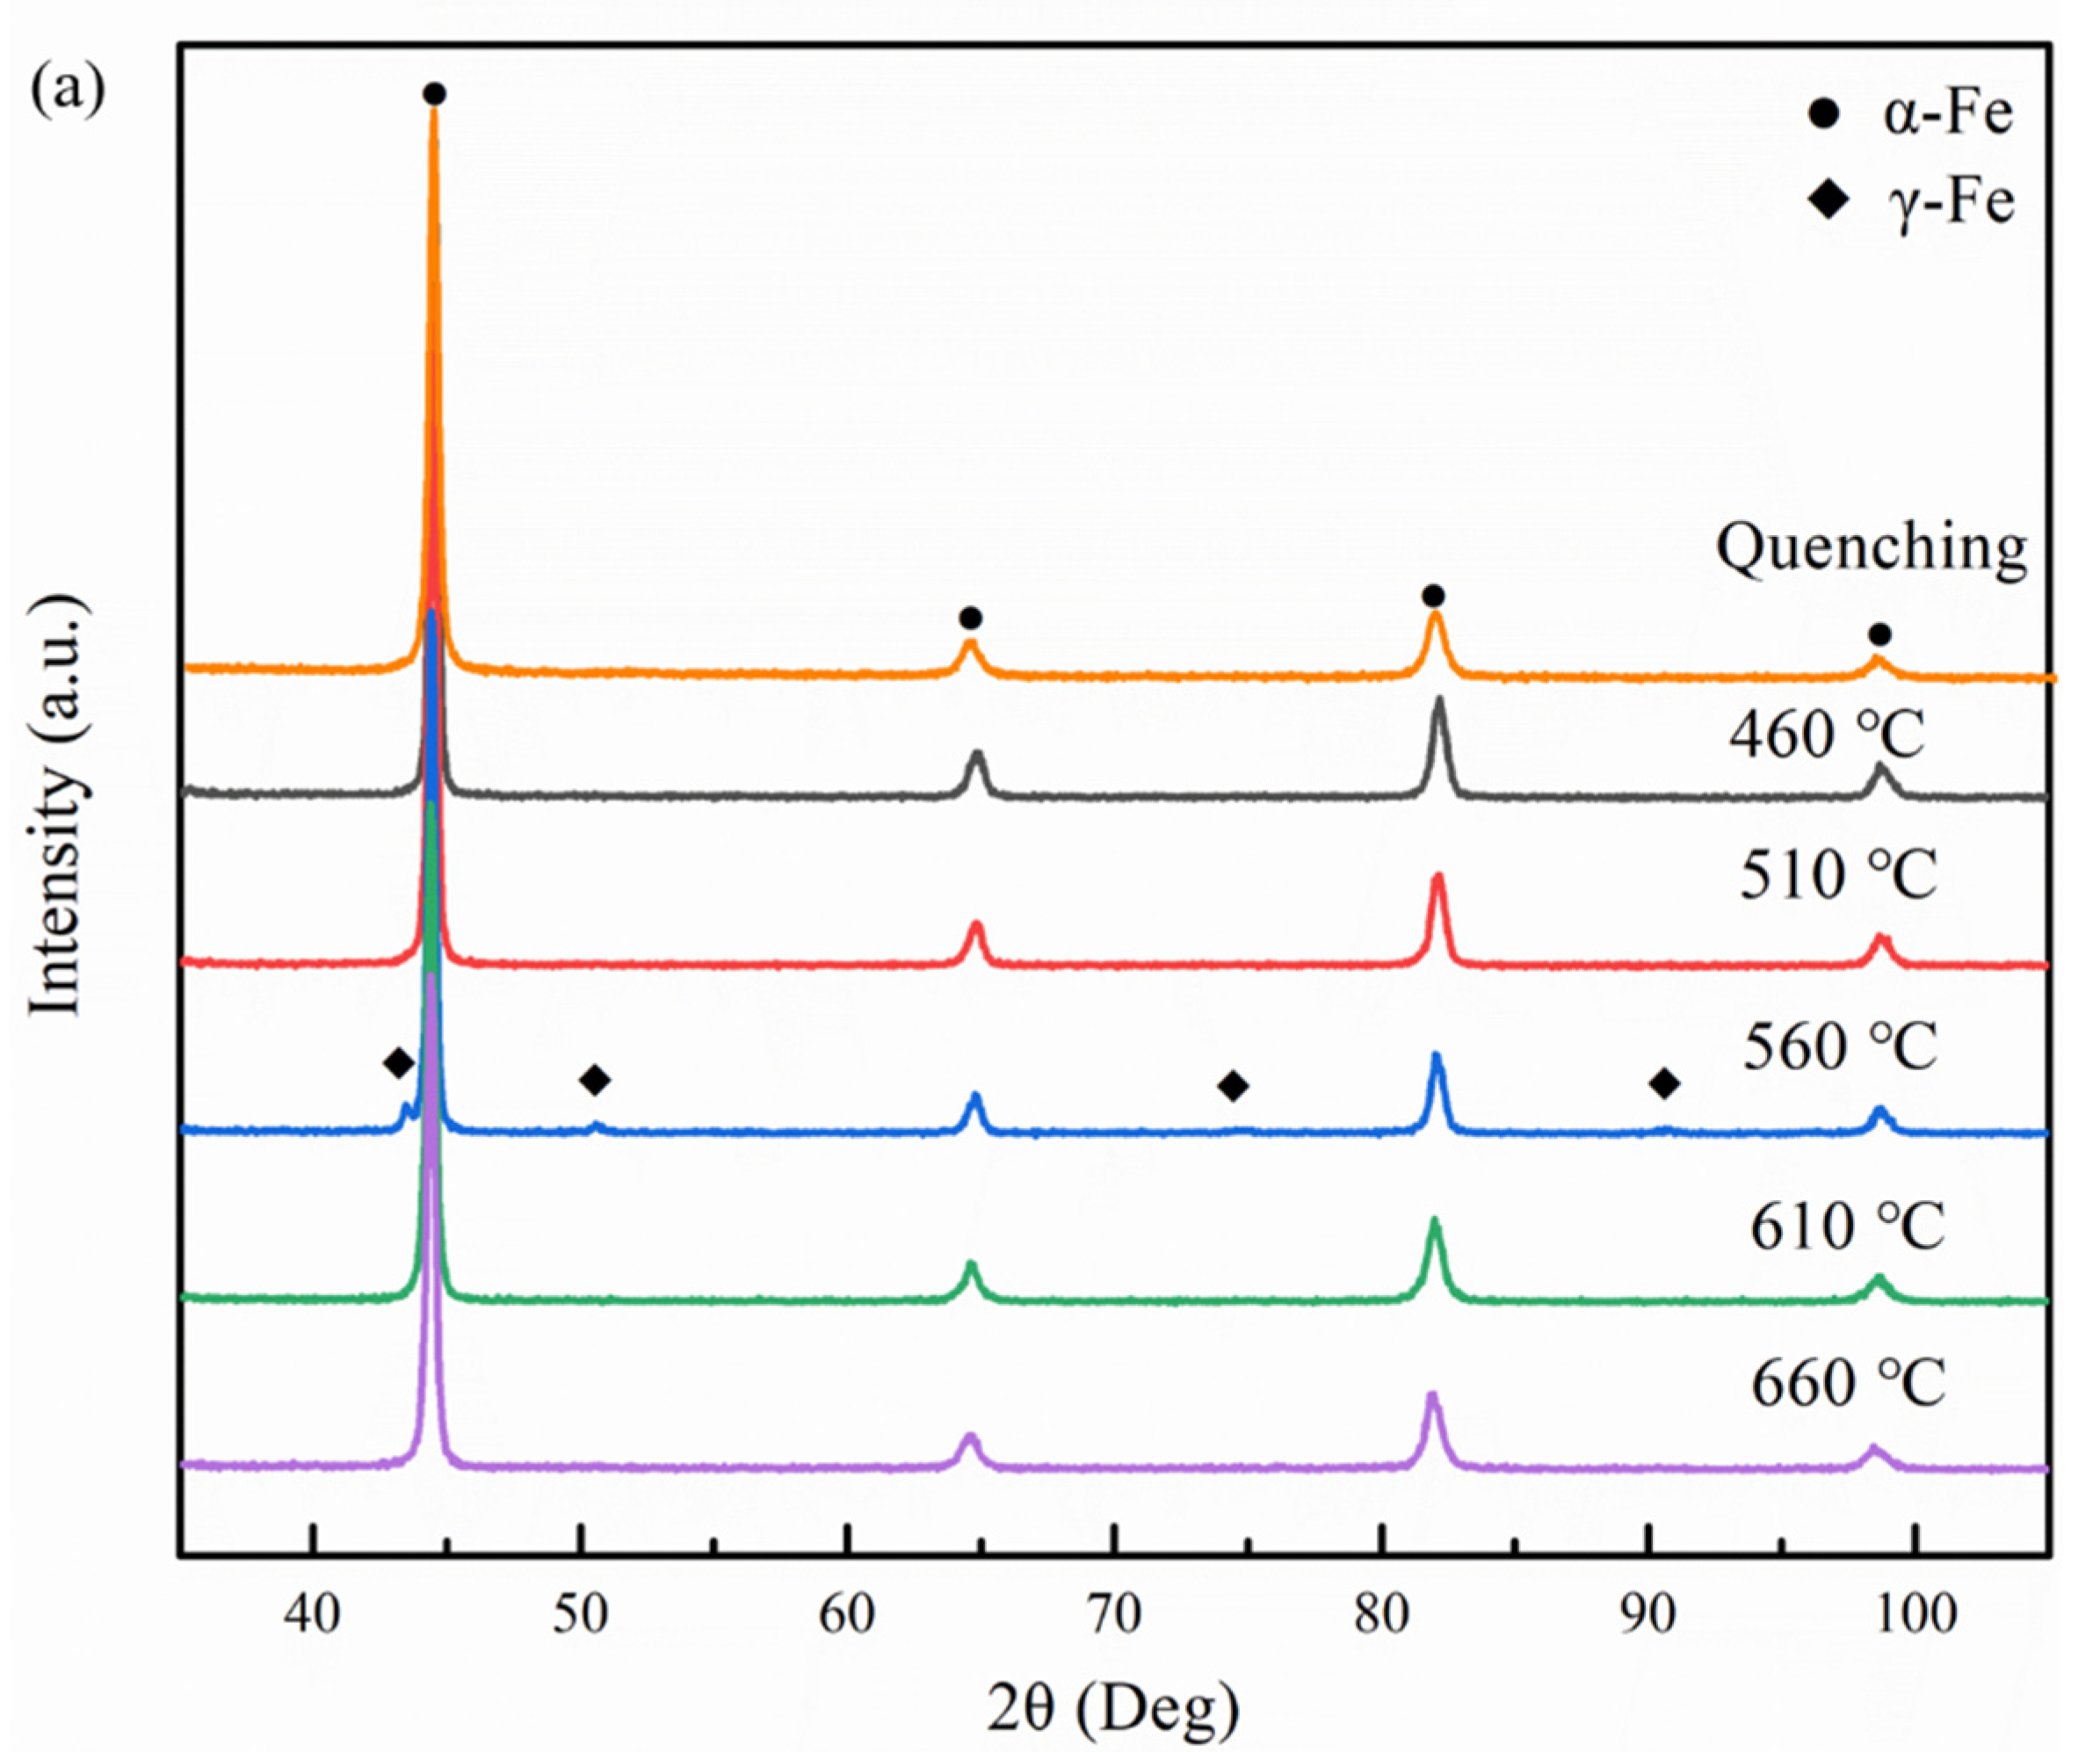
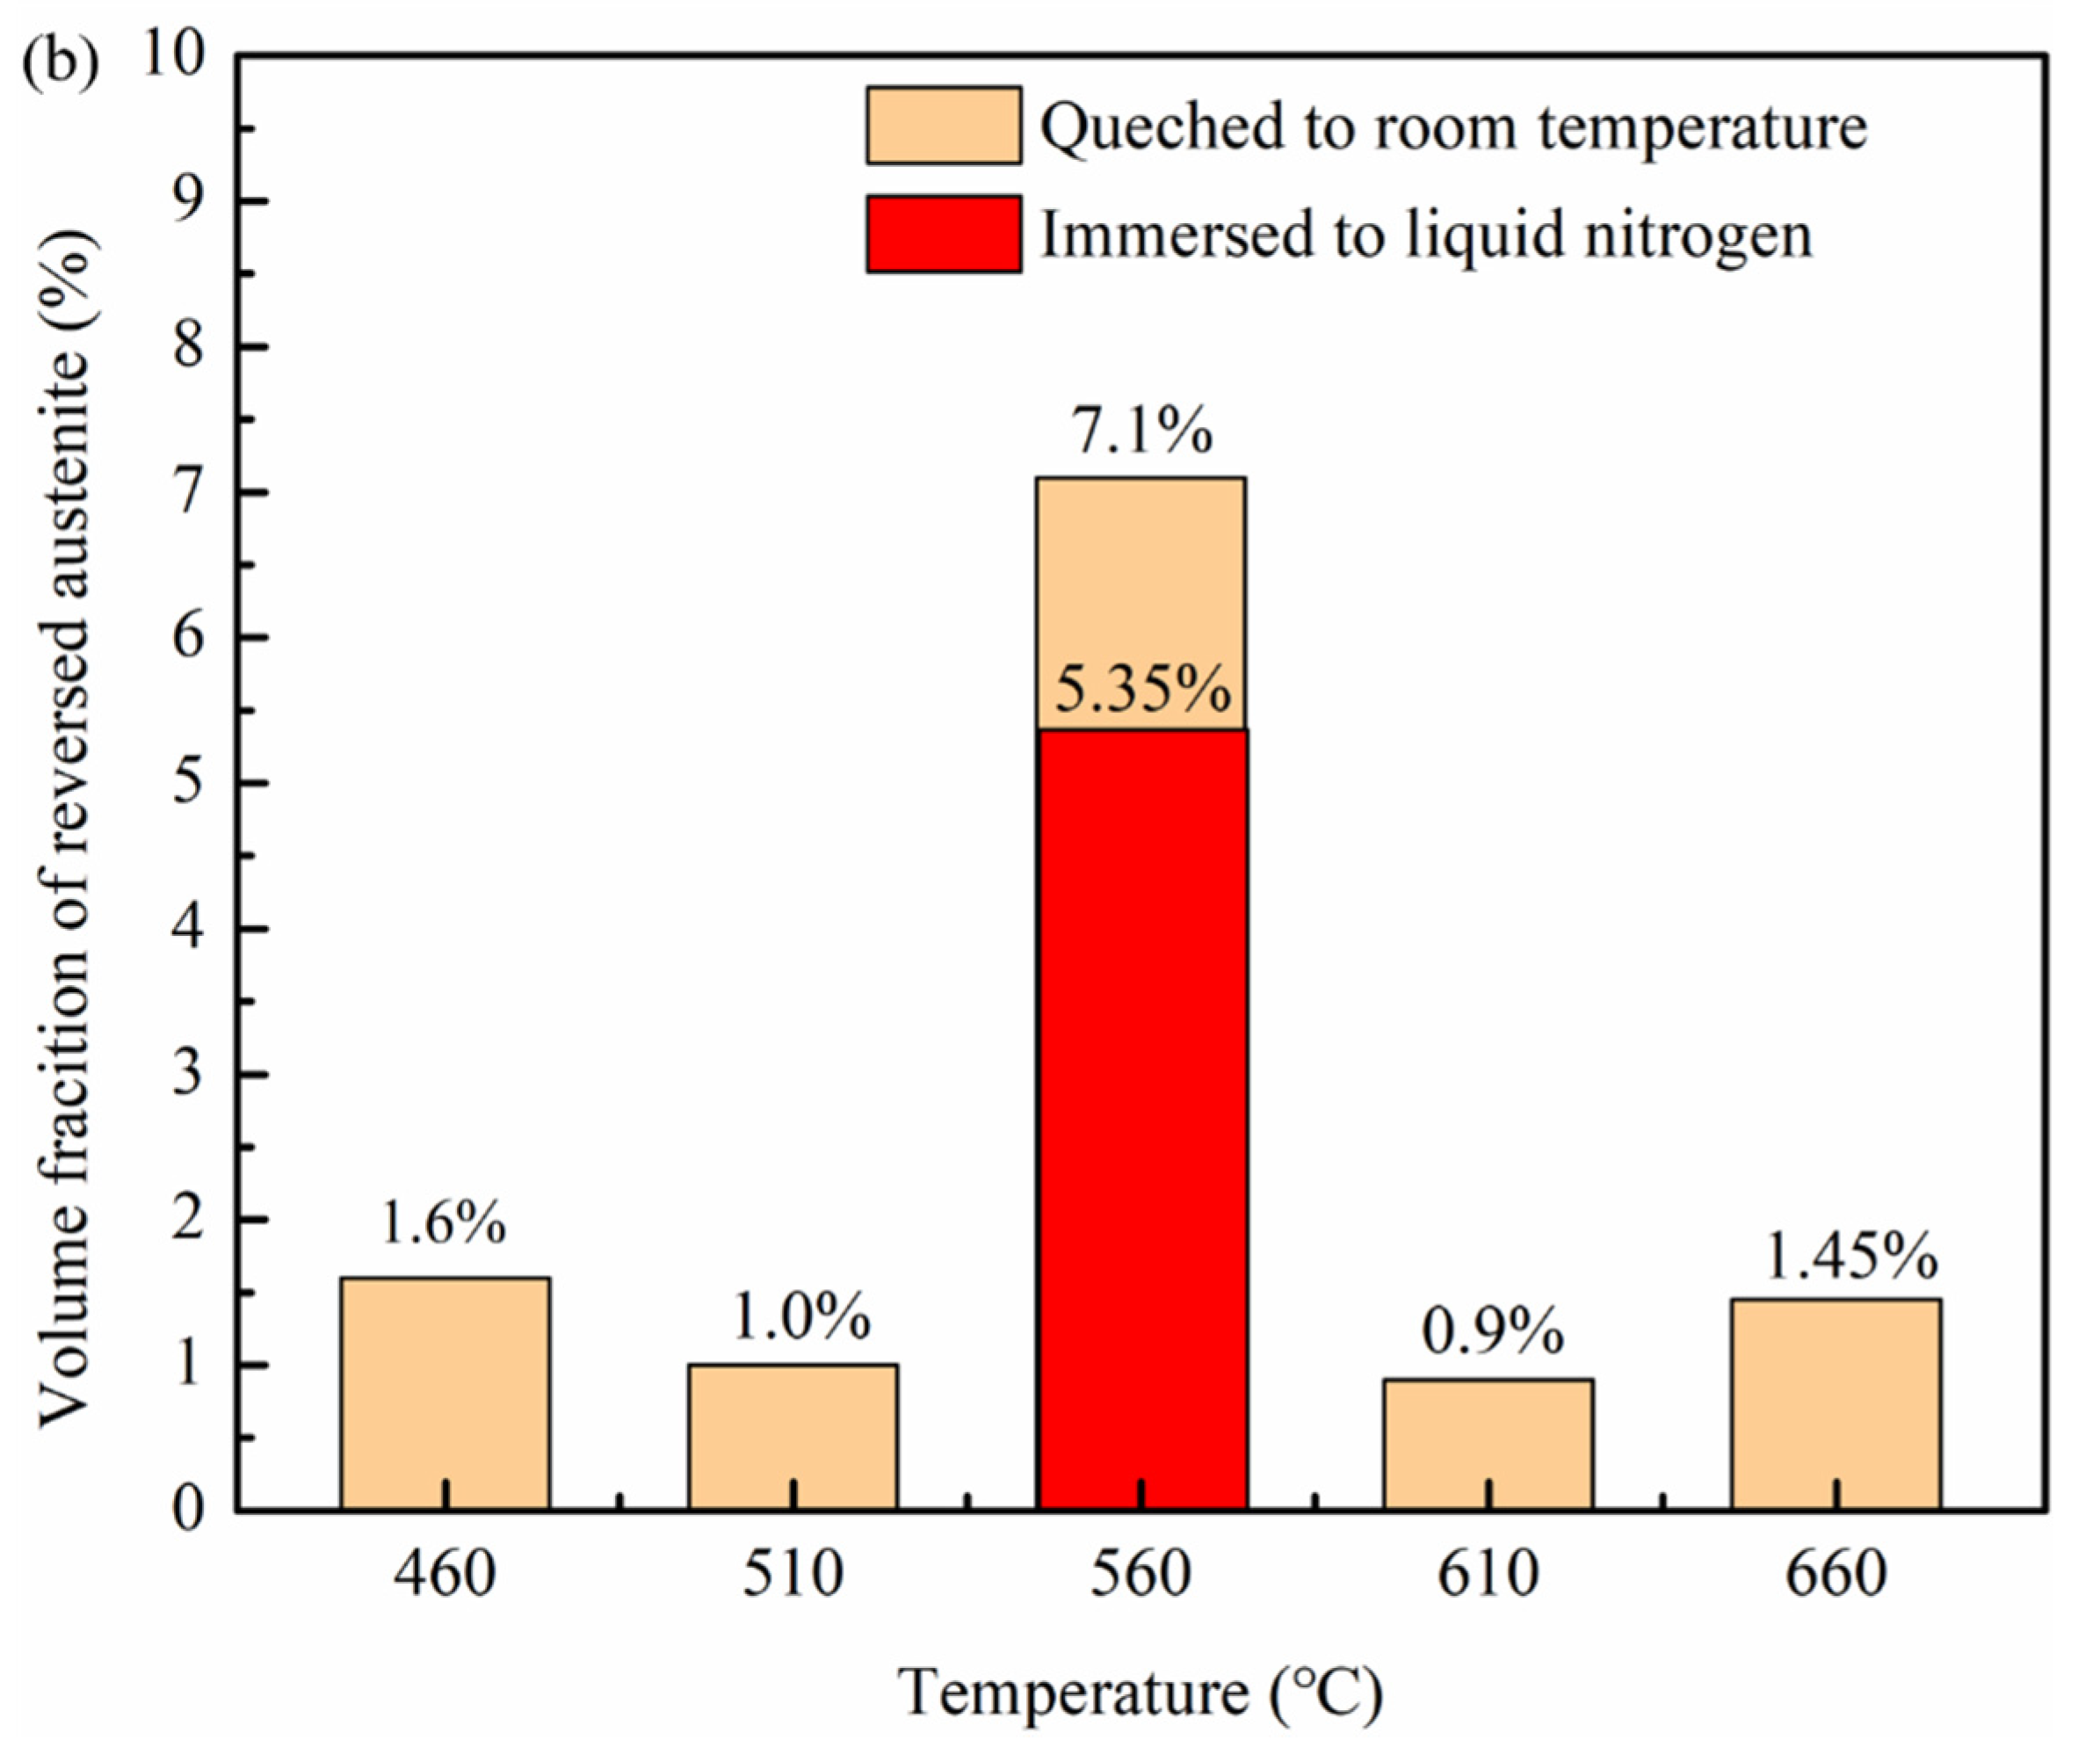
- The tempering temperature has a significant effect on the content of reversed austenite. With the increase of tempering temperature, the content of reversed austenite increases first and then decreases. The reversed austenite nucleated at the boundary of lath martensite first, and the higher content and better stability of the reversed austenite could be obtained after tempering at 560 °C.
- (2)
- After tempering, the toughness and elongation of Fe-9Ni-2Cu steel are significantly improved. The stable reversed austenite can adsorb alloying elements in the matrix, which can purify the matrix to form large strip bundles and improve toughness greatly. The hardness of fresh martensite is improved to some extent.
- (3)
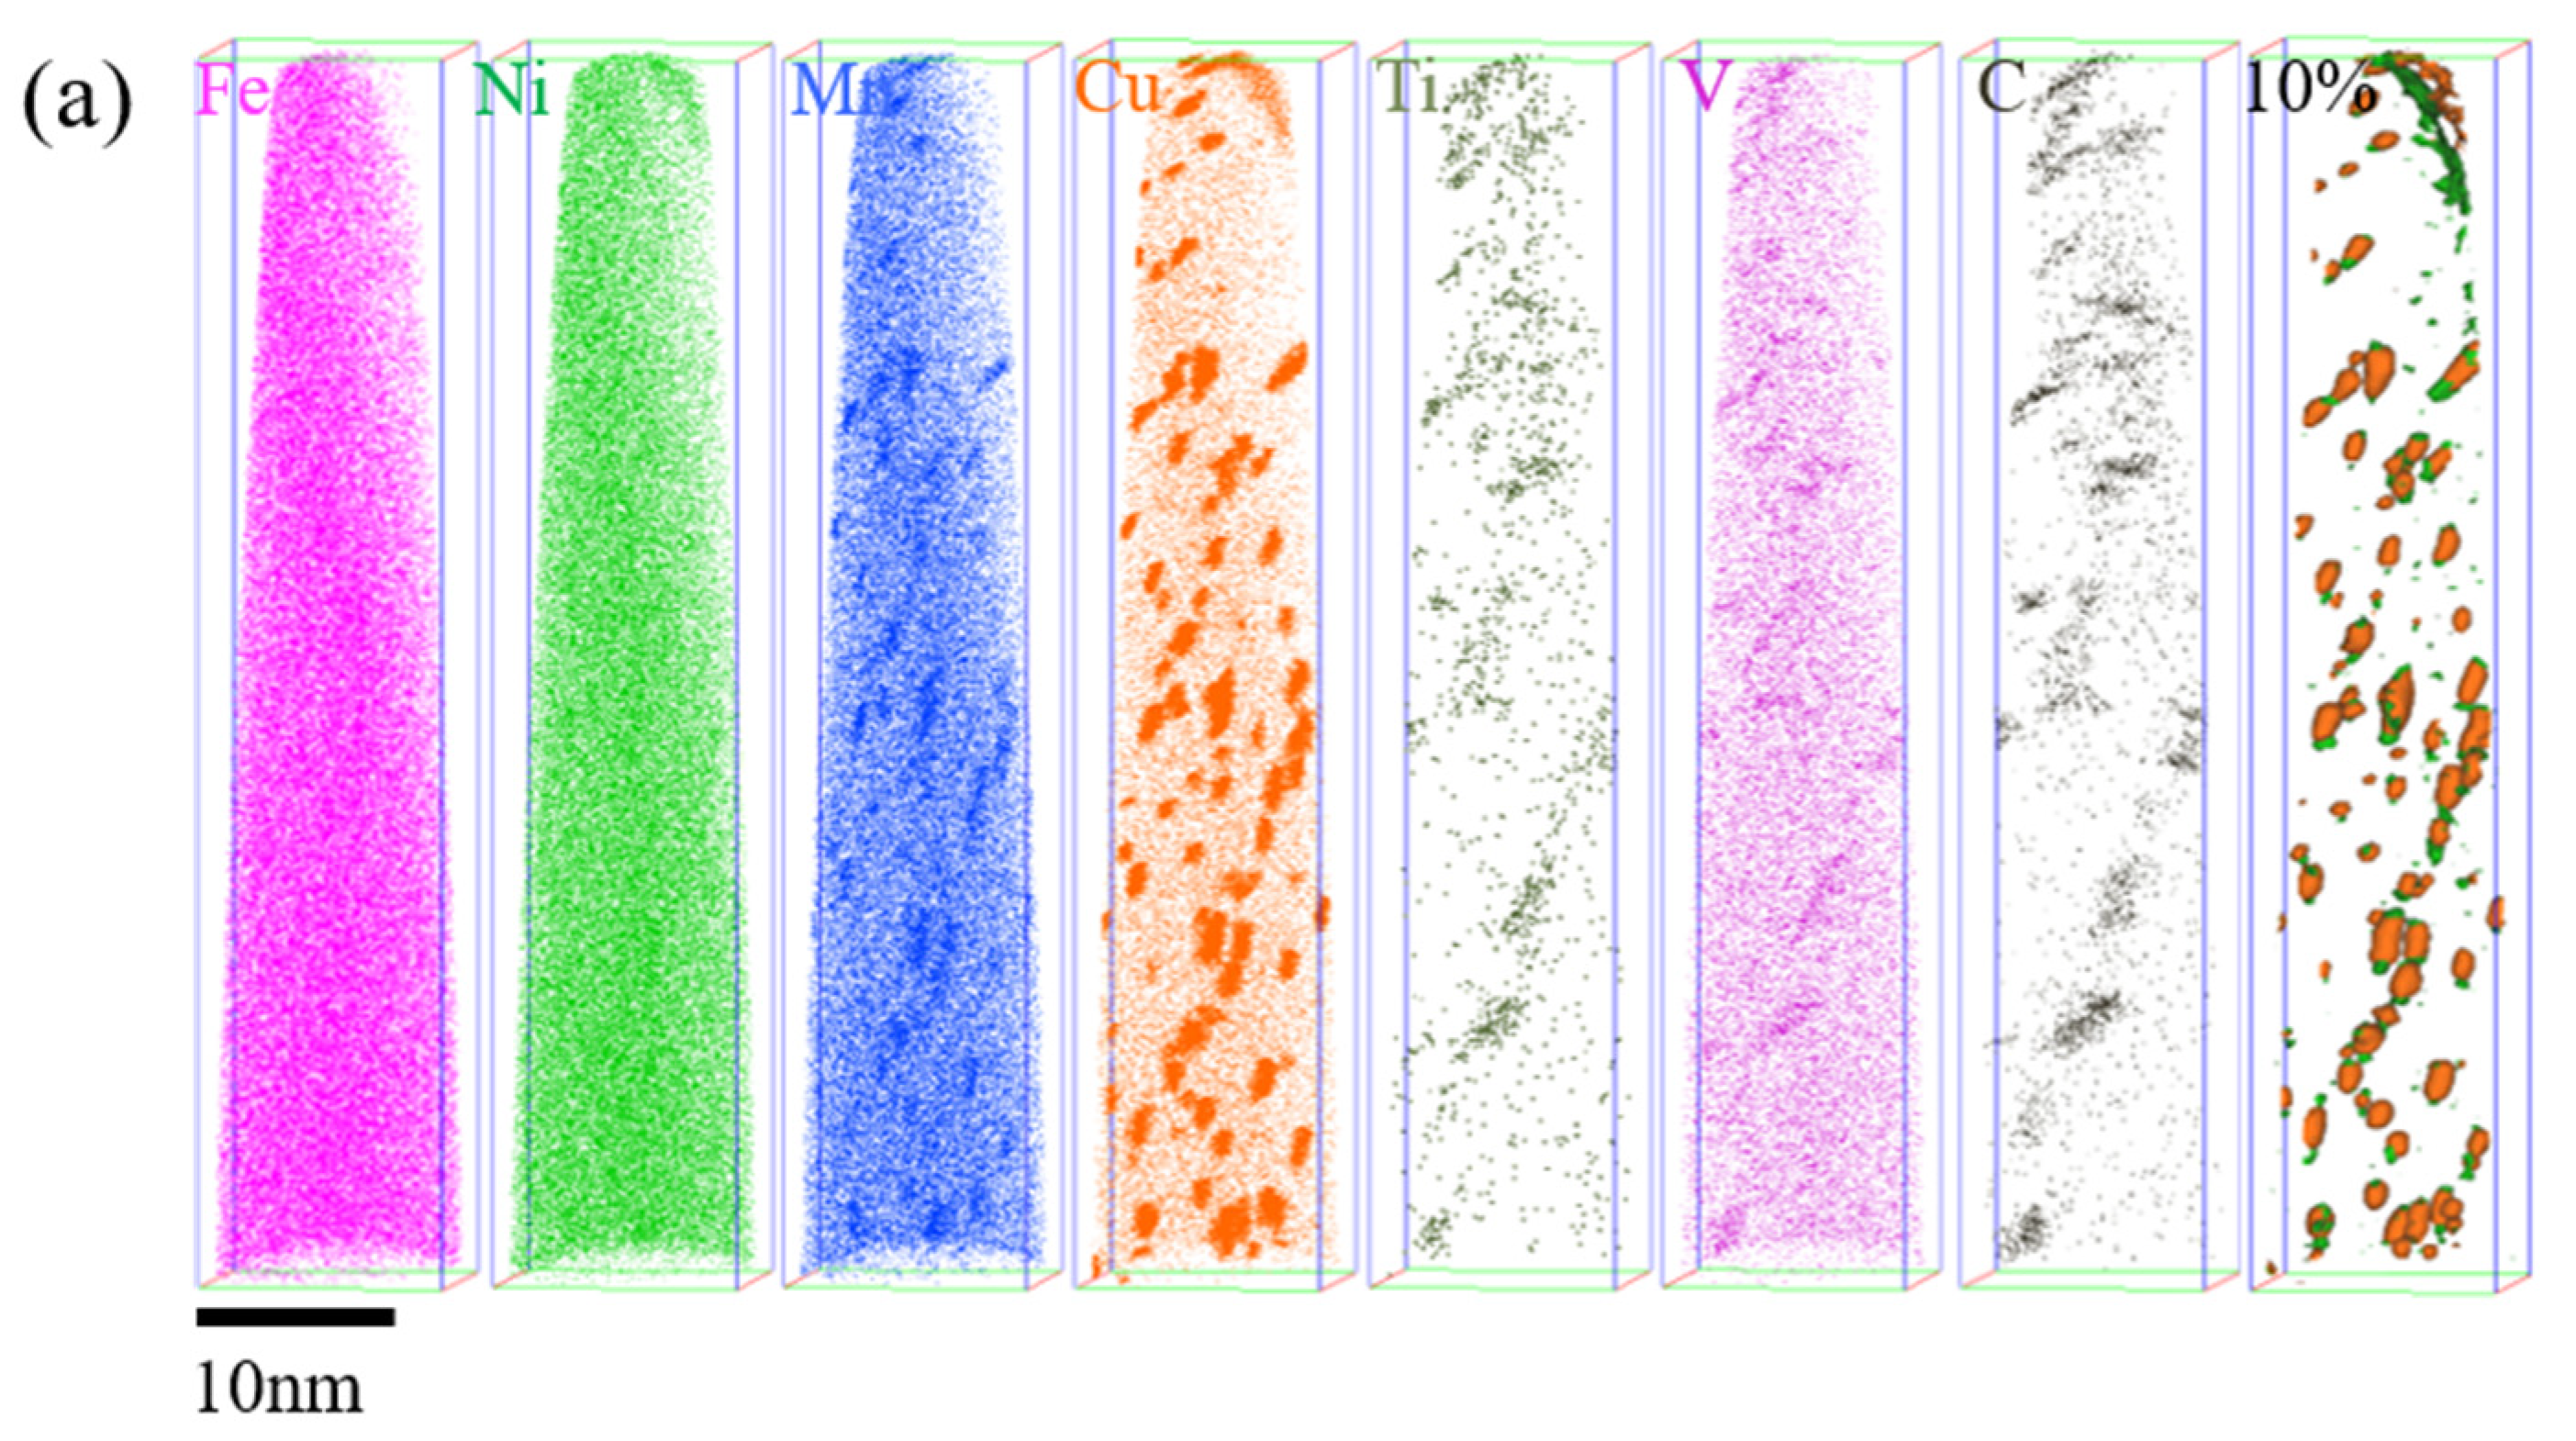
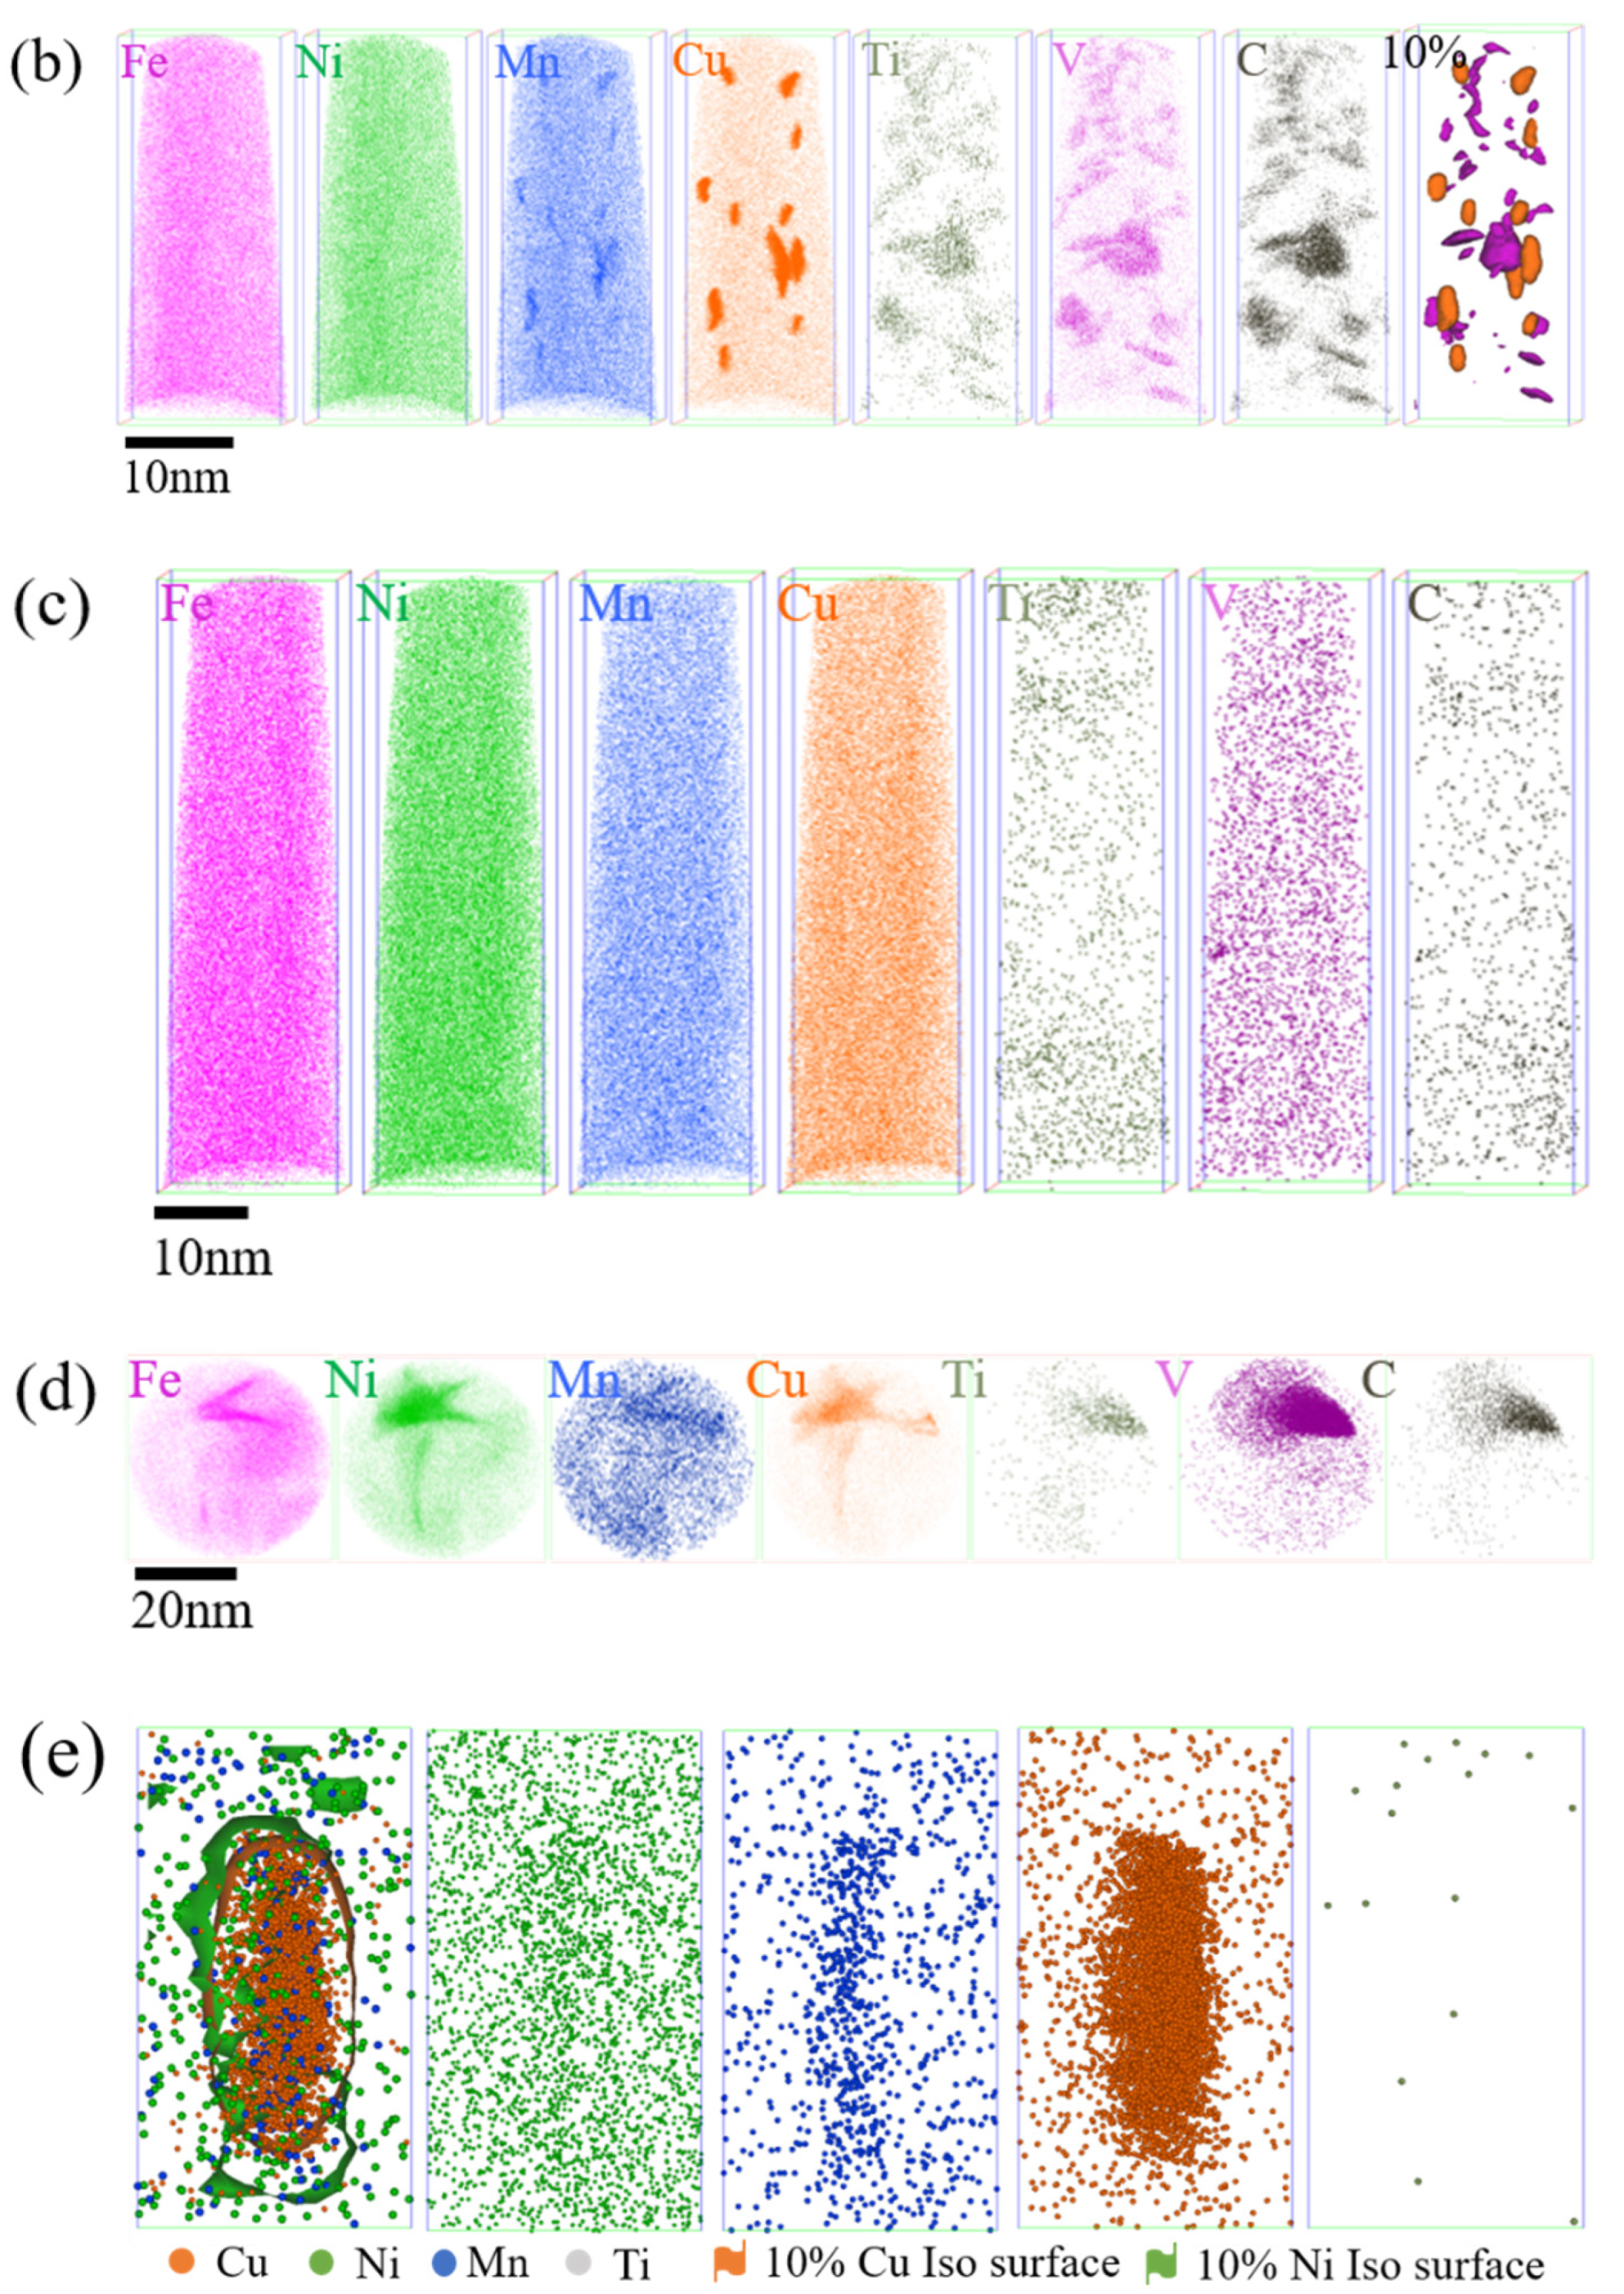
- After tempering Fe-9Ni-2Cu steel at different temperatures, Ni and Mn atoms tend to converge near the Cu atomic clusters to form a Cu-rich phase at 460 °C, which has an obvious precipitation-strengthening effect on the strength and hardness of the sample steel. As shown in Figure 11, when the tempering temperature is 560 °C, NiMn tends to be clustered at edge of the Cu-rich phase. At 610 °C, the Cu-rich phase and carbides are re-dispersed, and Cu atom segregation occurs at the reversed austenite/matrix interface.
Author Contributions
Funding
Institutional Review Board Statement
Informed Consent Statement
Data Availability Statement
Conflicts of Interest
References
- Fultz, B.; Kim, J.I.; Kim, Y.H.; Morris, J.W. The Chemical Composition of Precipitated Austenite in 9Ni Steel. Metall. Trans. A 1986, 17, 967–972. [Google Scholar] [CrossRef]
- Filho, J.D.C.; Passos, E.K.D.; Gonzaga, R.S.; Santos, D.D.; Maia, V.P.; Juliano, D.R. The Influence of the Welding Process on the Ultrasonic Inspection of 9%Ni Steel Pipe Circumferential Welded Joints. Materials 2020, 13, 961. [Google Scholar] [CrossRef] [Green Version]
- Kim, Y.K.; Oh, B.T.; Kim, J.H. Effects of Crack Tip Constraint on the Fracture Toughness Assessment of 9% Ni Steel for Cryogenic Application in Liquefied Natural Gas Storage Tanks. Materials 2020, 13, 5250. [Google Scholar] [CrossRef]
- Wang, L.B.; Xing, S.L.; Shen, Z.Z.; Liu, H.B.; Jiang, C.H.; Ji, V.; Zhao, Y.T. The synergistic role of Ti microparticles and CeO2 nanoparticles in tailoring microstructures and properties of high-quality Ni matrix nanocomposite coating. J. Mater. Sci. Technol. 2021, 105, 182–193. [Google Scholar] [CrossRef]
- Park, M.; Kim, J.; Pyo, C.; Son, J.; Kim, J. Research for the Optimal Flux-Cored Arc Welding Process of 9% Nickel Steel Using Multi Object Optimization with Solidification Crack Susceptibility. Materials 2021, 14, 1659. [Google Scholar] [CrossRef] [PubMed]
- Syn, C.K.; Fultz, B.; Morris, J.W. Mechanical Stability of Retained Austenite in Tempered 9Ni Steel. Metall. Trans. A 1978, 9, 1635–1640. [Google Scholar] [CrossRef] [Green Version]
- Cao, H.W.; Luo, X.H.; Zhan, G.F.; Liu, S. Effect of Mn Content on Microstructure and Cryogenic Mechanical Properties of a 7% Ni Steel. Acta Metall. Sin. Eng. Lett. 2018, 31, 699–705. [Google Scholar] [CrossRef] [Green Version]
- Zhao, X.Q.; Pan, T.; Wang, Q.F.; Su, H.; Yang, C.F.; Yang, Q.X. Effect of Tempering Temperature on Microstrueture and Mechanical Properties of Steel Containing Ni of 9%. J. Iron Steel Res. Int. 2011, 18, 47–51. [Google Scholar] [CrossRef]
- Chen, S.H.; Zhao, M.J.; Li, X.Y.; Rong, L.J. Compression Stability of Reversed Austenite in 9Ni Steel. J. Mater. Sci. Technol. 2012, 28, 558–561. [Google Scholar] [CrossRef]
- Zhao, H.Y.; Liu, R.P.; Wang, C.J.; Liang, J.X.; Hu, J.Q. Influence of QLT and QT heat treatment process on properties of 9Ni steel. Heat Treat. Metals. 2018, 43, 100–104. (In Chinese) [Google Scholar]
- Li, R.B.; Qin, P.Q.; Chen, Y.Q.; Li, K.; Long, W.Y. Effect of different intercritical quenching temperature on microstructure and properties of 9Ni Steel. Heat Treat. Met. 2021, 46, 18–22. (In Chinese) [Google Scholar]
- Wang, C.J.; Liang, J.X.; Liu, Z.B.; Yang, Z.Y.; Sun, X.J.; Yong, Q.L. Effect of Metastable Austenite on Mechanical Property and Mechanism in Cryogenic Steelapplied in Oceaneering. Acta Metall. Sin. 2016, 52, 385–393. (In Chinese) [Google Scholar]
- Hou, W.; Liu, Q.D.; Gu, J.F. Nano-sized austenite and Cu precipitates formed by using intercritical tempering plus tempering and their effect on the mechanical property in a low carbon Cu bearing 7 Ni steel. Mater. Sci. Eng. A 2020, 780, 139186. [Google Scholar] [CrossRef]
- Fonda, R.W.; Spanos, G. Effects of Cooling Rate on Transformations in a Fe-9 Pct Ni Steel. Metall. Mater. Trans. A 2014, 45, 5982–5989. [Google Scholar] [CrossRef]
- Kinney, C.C.; Pytlewski, K.R.; Khachaturyan, A.G.; Morris, J.W. The microstructure of lath martensite in quenched 9Ni steel. Acta Mater. 2014, 69, 372–385. [Google Scholar] [CrossRef]
- Yang, Y.H.; Cai, Q.W.; Tang, D.; Wu, H.B. Precipitation and stability of reversed austenite in 9Ni steel. Int. J. Miner. Metall. Mater. 2010, 17, 587–595. [Google Scholar] [CrossRef]
- Liu, W.Q.; Gu, J.F.; Liu, W.Q. On the Role of Ni in Cu Precipitation in Multicomponent Steels. Metall. Mater. Trans. A 2013, 44, 4434–4439. [Google Scholar] [CrossRef]
- DeSa, J.D.; Gama, R.D.; Gomes, J.A. The effect of heat treatment on environment assisted cracking susceptibility of 9% Ni steel. Corros. Eng. Sci. Technol. 2021, 56, 179–188. [Google Scholar]
- Sun, C.; Liu, S.L.; Misra, R.D.K.; Li, Q.; Li, D.H. Influence of intercritical tempering temperature on impact toughness of a quenched and tempered medium-Mn steel: Intercritical tempering versus traditional tempering. Mater. Sci. Eng. A 2018, 711, 484–491. [Google Scholar] [CrossRef]
- Wang, L.B.; Xing, S.L.; Liu, H.B.; Jiang, C.H.; Vincent, J. Improved wear properties of Ni Ti nanocomposite coating with tailored spatial microstructures by extra adding CeO2 nanoparticles. Surf. Coat. Technol. 2020, 399, 126119. [Google Scholar] [CrossRef]
- Zheng, H.; Li, Y.; Li, W.; Jin, X.J. Effect of Austenite Stability on Work-harding Behavior of QLT-processed 9Ni Steels. J. Mater. Sci. Eng. 2019, 37, 517–523. [Google Scholar]
- Jain, D.; Seidman, D.N.; Barrick, E.J.; DuPont, J.N. Atom-Probe Tomographic Investigation of Austenite Stability and Carbide Precipitation in a TRIP-Assisted 10 Wt Pct Ni Steel and Its Weld Heat-Affected Zones. Metall. Mater. Trans. A 2018, 49, 1031–1043. [Google Scholar] [CrossRef]
- Köse, C. Dissimilar Laser Beam Welding of AISI 420 Martensitic Stainless Steel to AISI 2205 Duplex Stainless Steel: Effect of Post-Weld Heat Treatment on Microstructure and Mechanical Properties. J. Mater. Eng. Perform. 2021, 30, 7417–7448. [Google Scholar] [CrossRef]
- Bagheri, Y.; Kamali, H.; Kamali, E.; Nedjad, S.H. Formation of nodular bainite in an Fe-9.10Ni-0.06C (wt. %) alloy: A new microstructure for cryogenic steels. Scr. Mater. 2022, 208, 114343. [Google Scholar] [CrossRef]
- Jain, D.; Isheim, D.; Zhang, X.J.; Ghosh, G.; Seidman, D.N. Thermally Stable Ni-rich Austenite Formed Utilizing Multistep Intercritical Heat Treatment in a Low-Carbon 10 Wt Pct Ni Martensitic Steel. Metall. Mater. Trans. A 2017, 48, 3642–3654. [Google Scholar] [CrossRef]
- Araujo, M.A.C.; Vogt, J.B.; Bouquerel, J. Retained austenite-aided cyclic plasticity of the quenched 9Ni steel. Int. J. Fatigue 2021, 152, 106445. [Google Scholar] [CrossRef]
- Zhang, S.H.; Wang, P.; Li, D.Z.; Li, Y.Y. Investigation of the evolution of retained austenite in Fe-13%Cr-4%Ni martensitic stainless steel during intercritical tempering. Mater. Des. 2015, 84, 385–394. [Google Scholar] [CrossRef]
- Morawiec, M.; Grajcar, A.; Zalecki, W.; Garcia-Mateo, C.; Opiela, M. Dilatometric Study of Phase Transformations in 5 Mn Steel Subjected to Different Heat Treatments. Materials 2020, 13, 958. [Google Scholar] [CrossRef] [Green Version]


| Element | C | Si | Mn | Ni | Cu | V | Ti | Al | Fe |
|---|---|---|---|---|---|---|---|---|---|
| Mass fraction (%) | 0.057 | 0.070 | 0.59 | 9.0 | 2.0 | 1.5 | 0.011 | 0.02 | Ball |
Publisher’s Note: MDPI stays neutral with regard to jurisdictional claims in published maps and institutional affiliations. |
© 2021 by the authors. Licensee MDPI, Basel, Switzerland. This article is an open access article distributed under the terms and conditions of the Creative Commons Attribution (CC BY) license (https://creativecommons.org/licenses/by/4.0/).
Share and Cite
Huang, X.; Wang, L.; Wang, Z.; Wang, Z.; Liu, Q. Effect of Temperature on Microstructure and Mechanical Properties of Fe-9Ni-2Cu Steel during the Tempering Process. Materials 2021, 14, 7141. https://doi.org/10.3390/ma14237141
Huang X, Wang L, Wang Z, Wang Z, Liu Q. Effect of Temperature on Microstructure and Mechanical Properties of Fe-9Ni-2Cu Steel during the Tempering Process. Materials. 2021; 14(23):7141. https://doi.org/10.3390/ma14237141
Chicago/Turabian StyleHuang, Xi, Lianbo Wang, Zemin Wang, Zhanyong Wang, and Qingdong Liu. 2021. "Effect of Temperature on Microstructure and Mechanical Properties of Fe-9Ni-2Cu Steel during the Tempering Process" Materials 14, no. 23: 7141. https://doi.org/10.3390/ma14237141