Article

Influence of the Size of the Fiber Filler of Corn Stalks in the Polylactide Matrix Composite on the Mechanical and Thermomechanical Properties

by
Daniel Łączny
1,*,
Marek Macko
1,
Krzysztof Moraczewski
2,
Zbigniew Szczepański
1 and
Andrzej Trafarski
2
1
Faculty of Mechatronics, Kazimierz Wielki University, Chodkiewicza 30, 85-064 Bydgoszcz, Poland
2
Institute of Material Engineering, Kazimierz Wielki University, Chodkiewicza 30, 85-064 Bydgoszcz, Poland
*
Author to whom correspondence should be addressed.
Materials 2021, 14(23), 7281; https://doi.org/10.3390/ma14237281
Submission received: 10 November 2021 / Revised: 21 November 2021 / Accepted: 25 November 2021 / Published: 28 November 2021
(This article belongs to the Section Advanced Composites)

Abstract

:
This paper presents results of a study on the effect of filler size in the form of 15 wt% corn stalk (CS) fibers on the mechanical and thermomechanical properties of polylactide (PLA) matrix composites. In the test, polylactidic acid (PLA) is filled with four types of length of corn stalk fibers with a diameter of 1 mm, 1.6 mm, 2 mm and 4 mm. The composites were composed by single screw extrusion and then samples were prepared by injection molding. The mechanical properties of the composites were determined by static tensile test, static bending test and Charpy impact test while the thermo-mechanical properties were determined by dynamic mechanical thermal analysis (DMTA). The composite structures were also observed using X-ray microcomputed tomography and scanning electron microscopy. In the PLA/CS composites, as the filler fiber diameter increased, the degradation of mechanical properties relative to the matrix was observed including tensile strength (decrease 22.9–51.1%), bending strength (decrease 18.9–36.6%) and impact energy absorption (decrease 58.8–69.8%). On the basis of 3D images of the composite structures for the filler particles larger than 2 mm a weak dispersion with the filler was observed, which is reflected in a significant deterioration of the mechanical and thermomechanical properties of the composite. The best mechanical and thermomechanical properties were found in the composite with filler fiber of 1 mm diameter. Processing resulted in a more than 6-fold decrease in filler fiber length from 719 ± 190 µm, 893 ± 291 µm, 1073 ± 219 µm, and 1698 ± 636 µm for CS1, CS1.6, CS2, and CS4 fractions, respectively, to 104 ± 43 µm, 123 ± 60 µm, 173 ± 60 µm, and 227 ± 89 µm. The fabricated green composites with 1 to 2 mm corn stalk fiber filler are an alternative to traditional plastic based materials in some applications.

1. Introduction

The properties of polymer materials such as low density, high chemical resistance, barrier properties, high mechanical strength, and ease of processing have led to their use in many everyday products [1,2,3]. In 2019, 367 million tons of polymer plastics were produced globally of which more than 90% are obtained from fossil resources [4]. Problems regarding environmental pollution with their waste and the declining stocks of fossil fuels from which most of them are produced resulted in many studies on total or partial replacement of synthetic polymeric materials with natural and renewable ones [5,6,7,8]. In addition, modern society and international legislation promotes the production of sustainable materials and the circular model, in which green composites fit well [9,10].
Green composites usually consist of biodegradable and/or bio-based polymer matrix and natural organic fibers/particles as reinforcement or filler [11,12]. They are characterized by lower production cost, biodegradability, aesthetic and more “natural” appearance, as well as often inferior mechanical properties compared to synthetic composites [13]. Over the past years, studies have been conducted on a wide range of biodegradable polymer matrices obtained from both natural and petrochemical sources [13,14]. Among the polymer matrices used in green composites, polylactide (PLA) is very popular. It belongs to the group of bioplastics, i.e., polymers produced both from natural resources and biodegradable to water, carbon dioxide, and biomass within a few to several weeks [15]. The PLA is a thermoplastic aliphatic polyester produced from the polymerization of lactic acid (LA), which is derived from the fermentation of renewable plant-based raw materials such as corn, potato, rice, and soy [16]. It is classified as a sustainable material because it is possible to compost it and further use its decomposition products as fertilizer in agricultural production [17]. The PLA is a polymer with a high tensile strength of 70 MPa and an elastic modulus of 3 GPa. This polymer can be recycled 7 to even 10 times [18]. The disadvantages of PLA include high brittleness, high flammability, poor thermal stability, and poor barrier properties [19]. Therefore, materials are often added to the PLA matrix in order to improve the polymer properties [20], including various lignocellulosic fibers such as bamboo [21], Opuntia ficus-indica and Posidonia oceanica [12,22], wood [23] and hemp [24].
The fibers/particles that provide reinforcement or filler roles in the green composite can be of plant or animal origin. Natural fibers, compared to mineral fibers, have lower density, biodegradability, reduced health risks, lower purchase cost, and lower abrasiveness to prevent equipment damage. The main disadvantages of natural fibers are poor filler compatibility, hygroscopicity, inconsistency of fibers, poor thermal stability, low durability and variability of properties depending on processing methods, fiber type, environmental conditions and modification [25,26]. The mechanical properties of composites reinforced with fibrous fillers are affected by the distribution of fiber in the composite structure, their size including diameter and length, thermal and chemical stability of the matrix, fiber strength and elasticity, and the nature of the fiber–matrix interface [27]. Fiber modification is often conducted to improve the bonding in the composite between the hydrophilic filler and the hydrophobic polymer matrix resulting in, among others, an increase in the mechanical properties of the composite [28,29,30]. Fillers from agricultural, forestry, or food industry by-products have a smaller carbon footprint, [31] while not increasing competition for food [32].
Corn stalks are one of the wastes generated from the cultivation of corn grains, which plays a significant role in the agri-food industry and is a fundamental food ingredient in many diets around the world [33]. In 2019, 1116 million tons of corn grain was obtained and production is expected to increase by 20% in 20 years [34]. Each 1 kg of dry corn grain yielded produces about half a kilogram of corn stalks and half a kilogram of other types of crop residues including leaves, cobs and husks, more than 90% of which are left in the field or are burned [35,36]. The corn stalk is a non-homogeneous material consisting of skin and flesh. The skin is characterized by high hardness and tensile strength, while the flesh has low density and good thermal insulation properties [37,38]. Corn stalks can be used to produce biogas, biocarbon, and biomethane [39,40,41]. Chipboard [42], insulation boards, and polymer composites [43,44] can be produced from them. Corn stalk fibers, both chemically modified [45] and unmodified [46,47], are used in polymer composites. Despite their high availability, low purchase price and good mechanical properties, corn stalks are rarely used as a filler for biodegradable polymers. The target fiber size of corn stalks used in polymer composites is usually obtained on shredders and knife mills [45,46,48]. The shape and size of the fiber used in the composite affect its final properties [12,22,49]. There are no studies analyzing the effect of corn stalk fiber size in polylactide matrix composites before and after processing on mechanical and thermomechanical properties.
The purpose of this paper was to investigate the effect of corn stalk fiber size on the mechanical (tensile strength, bending strength, impact strength) and thermomechanical properties of corn stalk/polylactide composites prepared by single screw extrusion and injection molding. In the present study, corn stalks collected from the surrounding areas were only subjected to drying, shredded on a single disc shredding system, separated into fractions and then blended with polylactide. Fiber size analysis of corn stalks before processing by optical microscopy and after processing by scanning electron microscopy was performed. In addition, the fiber distribution in the composite was analyzed using computer microtomography. An innovation of presented research was the possibility of testing biodegradable polylactide composites containing natural fillers with the best possible mechanical properties only by choosing an appropriate filler size and not by chemical modification of the fibers as it has been used so far. This will allow to obtain good biodegradable composites without degrading their biodegradation properties, which could be reduced by adding synthetic chemicals on the modified fibers.

2. Materials and Methods

2.1. Materials

The PLA polylactide Inego 3251D from (NatureWorks, Minnetonka, MN, USA) with a density of 1.24 g/cm3, molecular weight of 55.4 g/mol, and MFI of 35 g/10 min (190 °C/2.16 kg), which is dedicated to injection molding applications, was used for this study. From whole corn plants 31.255 (Limagrain, Mogilno, Poland) harvested manually by cutting 10 cm above the ground, corn stalks were separated and then dried at 18 °C for 1450 h.

2.2. Shredding and Screening of the Corn Stalk

Shredding of corn stalks was carried out on a ULR-2.0/2004 universal laboratory shredder (Bydgoszcz, Poland) equipped with a disc-shredding system operating at a peripheral speed of the moving disc of 16.5 m/s. The moving disc had triangle-shaped holes and the stationary disc had rectangular and triangle-shaped holes, as shown in Figure 1.
The shredded material was screened using an Anlysette 3 Pro sieve analyzer (Fritsch, Idar-Oberstein, Germany). Five DIN-ISO 3310/1 measuring sieves (Retsch, Eragny, France) with mesh sizes of 4 mm, 2 mm, 1.6 mm, 1 mm, and 0.8 mm were used for screening. The material was sieved in batches of 50 g for a period of 10 min at an amplitude of 2.5 Hz. A 120 g fraction obtained on each of the 2 mm, 1.6 mm, 1 mm, and 0.8 mm mesh sieves was used for further testing due to the higher mass proportion of corn stalk skin in these fractions [43].

2.3. Preparation of Samples

Based on previous studies on the effect of filler amount of shredded corn stalks in PLA matrix composites on mechanical properties, it was determined that the composite samples in this study would contain 15 wt% filler amount [46,50]. The PLA granules and fractions of shredded corn stalks were dried in a SUP-100 laboratory dryer (Wamed, Warsaw, Poland) at 40 °C for 48 h to remove moisture. The materials were then weighed using an analytical balance WAS 160/X (Radwag, Radom, Poland) and composite formulations were prepared containing 15 wt% filler from each fraction of shredded corn stalks. The composite formulations were designated as PLA/CS4, PLA/CS2, PLA/CS1.6, and PLA/CS1, respectively. The manually mixed composite formulations were poured into the hopper of a W25-30D single-screw extruder (Metalchem, Gliwice, Poland). The extrusion temperature profile was identical for all compositions (1st section, 150 °C; 2nd section, 155 °C; 3rd section, 155 °C; head, 155 °C). The screw speed was set at 30 rpm. The sample containing pure polylactide was extruded under identical conditions as the composite formulations. The resulting extrudates were cooled with compressed air and granulated using a knife granulator. The obtained granules from each composition were dried in a SUP-100 laboratory dryer (Wamed, Warsaw, Poland) at 40 °C for 48 h and then dumbbell-shaped samples were produced by injection molding on a TRX 80 Eco injection molding machine (Tederic, Shanqhai, China). The injection molding process for all compositions was conducted under the following conditions: 1st screw section temperature—170 °C, 2nd screw section temperature—170 °C, 3rd screw section temperature—175 °C, injection temperature—180 °C, mold temperature—35 °C, injection pressure—248 bar, cooling time—60 s.

2.4. Characteristics of PLA and Composites

The density was determined using MVP-D160E pycnometer (Quantachrome Instruments, Ashland, VA, USA) according to the PN-EN ISO 1183 standard [51]. Helium was used in the study. The density value was calculated as the arithmetic mean of 2 measurements.
For mechanical tensile, bending, and impact tests, ten samples from each composition were used per test. The bending and tensile tests of samples were carried out on an Instron 3367 testing machine (Instron, Norwood, MA, USA) at room temperature of 20 ± 2 °C and Charpy impact tests were carried out on unnotched samples using an XJ 5Z impact hammer (Liangong, Shandong, China) at the same temperature. Static tensile test was carried out according to EN ISO 527 [52] with a tensile speed of 50 mm/min. Static bending test was carried out according to EN ISO 14125 [53], where the support spacing was 64 mm and the bending speed was 20 mm/min. Impact tests were carried out according to PN-EN ISO 179-2 [54] using a hammer of 2 J. The results are the arithmetic mean of each test.
The effect of temperature on the mechanical properties of PLA and PLA/CS samples was investigated by dynamic mechanical analyzer type Q800 (TA Instruments, New Castle, DE, USA) according to PN-EN ISO 6721 [55]. Tests were carried out in the temperature range from 25 to 150 °C with a heating rate of 3 °C/min. Samples were cuboid in shape with dimensions of 80 mm × 10 mm × 4 mm. The deformation strain was 0.01% and the frequency was 1 Hz.
Observations of the corn stalk fiber surface of each fraction obtained from sieve analysis were made using a DMS-350 digital microscope (Leica Microsystems, Heerbrugg, Switzerland), and the resulting microphotographs were analyzed in Leica Application Suite LAS 4.12 software.
Observations of the composite structure were conducted using Skyscan 1273 X-ray microtomography (Bruker, Karlsruhe, Germany) and scanning electron microscopy (SEM) with a Phenom XL microscope (Thermo Fisher Scientific, Waltham, MA, USA). The microtomography study was conducted with the following parameters: scaled image pixel size, 4.9 µm; exposure time, 570 ms; voltage, 50 kV; and current, 50 µA. The samples for microtomography were cut from the center of standard paddles and had dimensions of 10 mm × 4 mm × 30 mm. The SEM test was carried out at an accelerating voltage of 5 kV in a high vacuum of 0.1 Pa. The surface of the test samples for SEM was coated with a layer of gold in an MCM-100P low vacuum sputtering machine (Sec, Gyeonggi-do, Korea) for 30 s to avoid electrostatic discharge during the test. The surface observations of samples were conducted in mapping mode, with a BSD Full (Back Scatter Detector).

3. Results

3.1. Density

The measured density of pure PLA granules was 1.2562 ± 0.0013 g/cm3. The obtained value differed slightly from the producer’s reported density [56]. The composites produced had a lower density than pure PLA (Table 1) due to the lower density of the CS filler relative to the matrix. Ma et al. observed that the CS fiber content in the phenolic resin matrix polymer composite also resulted in a decrease in the density of the composite produced [44]. The density differences between the composites studied may have been influenced by the content of various components of the corn stalk including the skin and flesh. The skin has a higher density than the flesh [43].

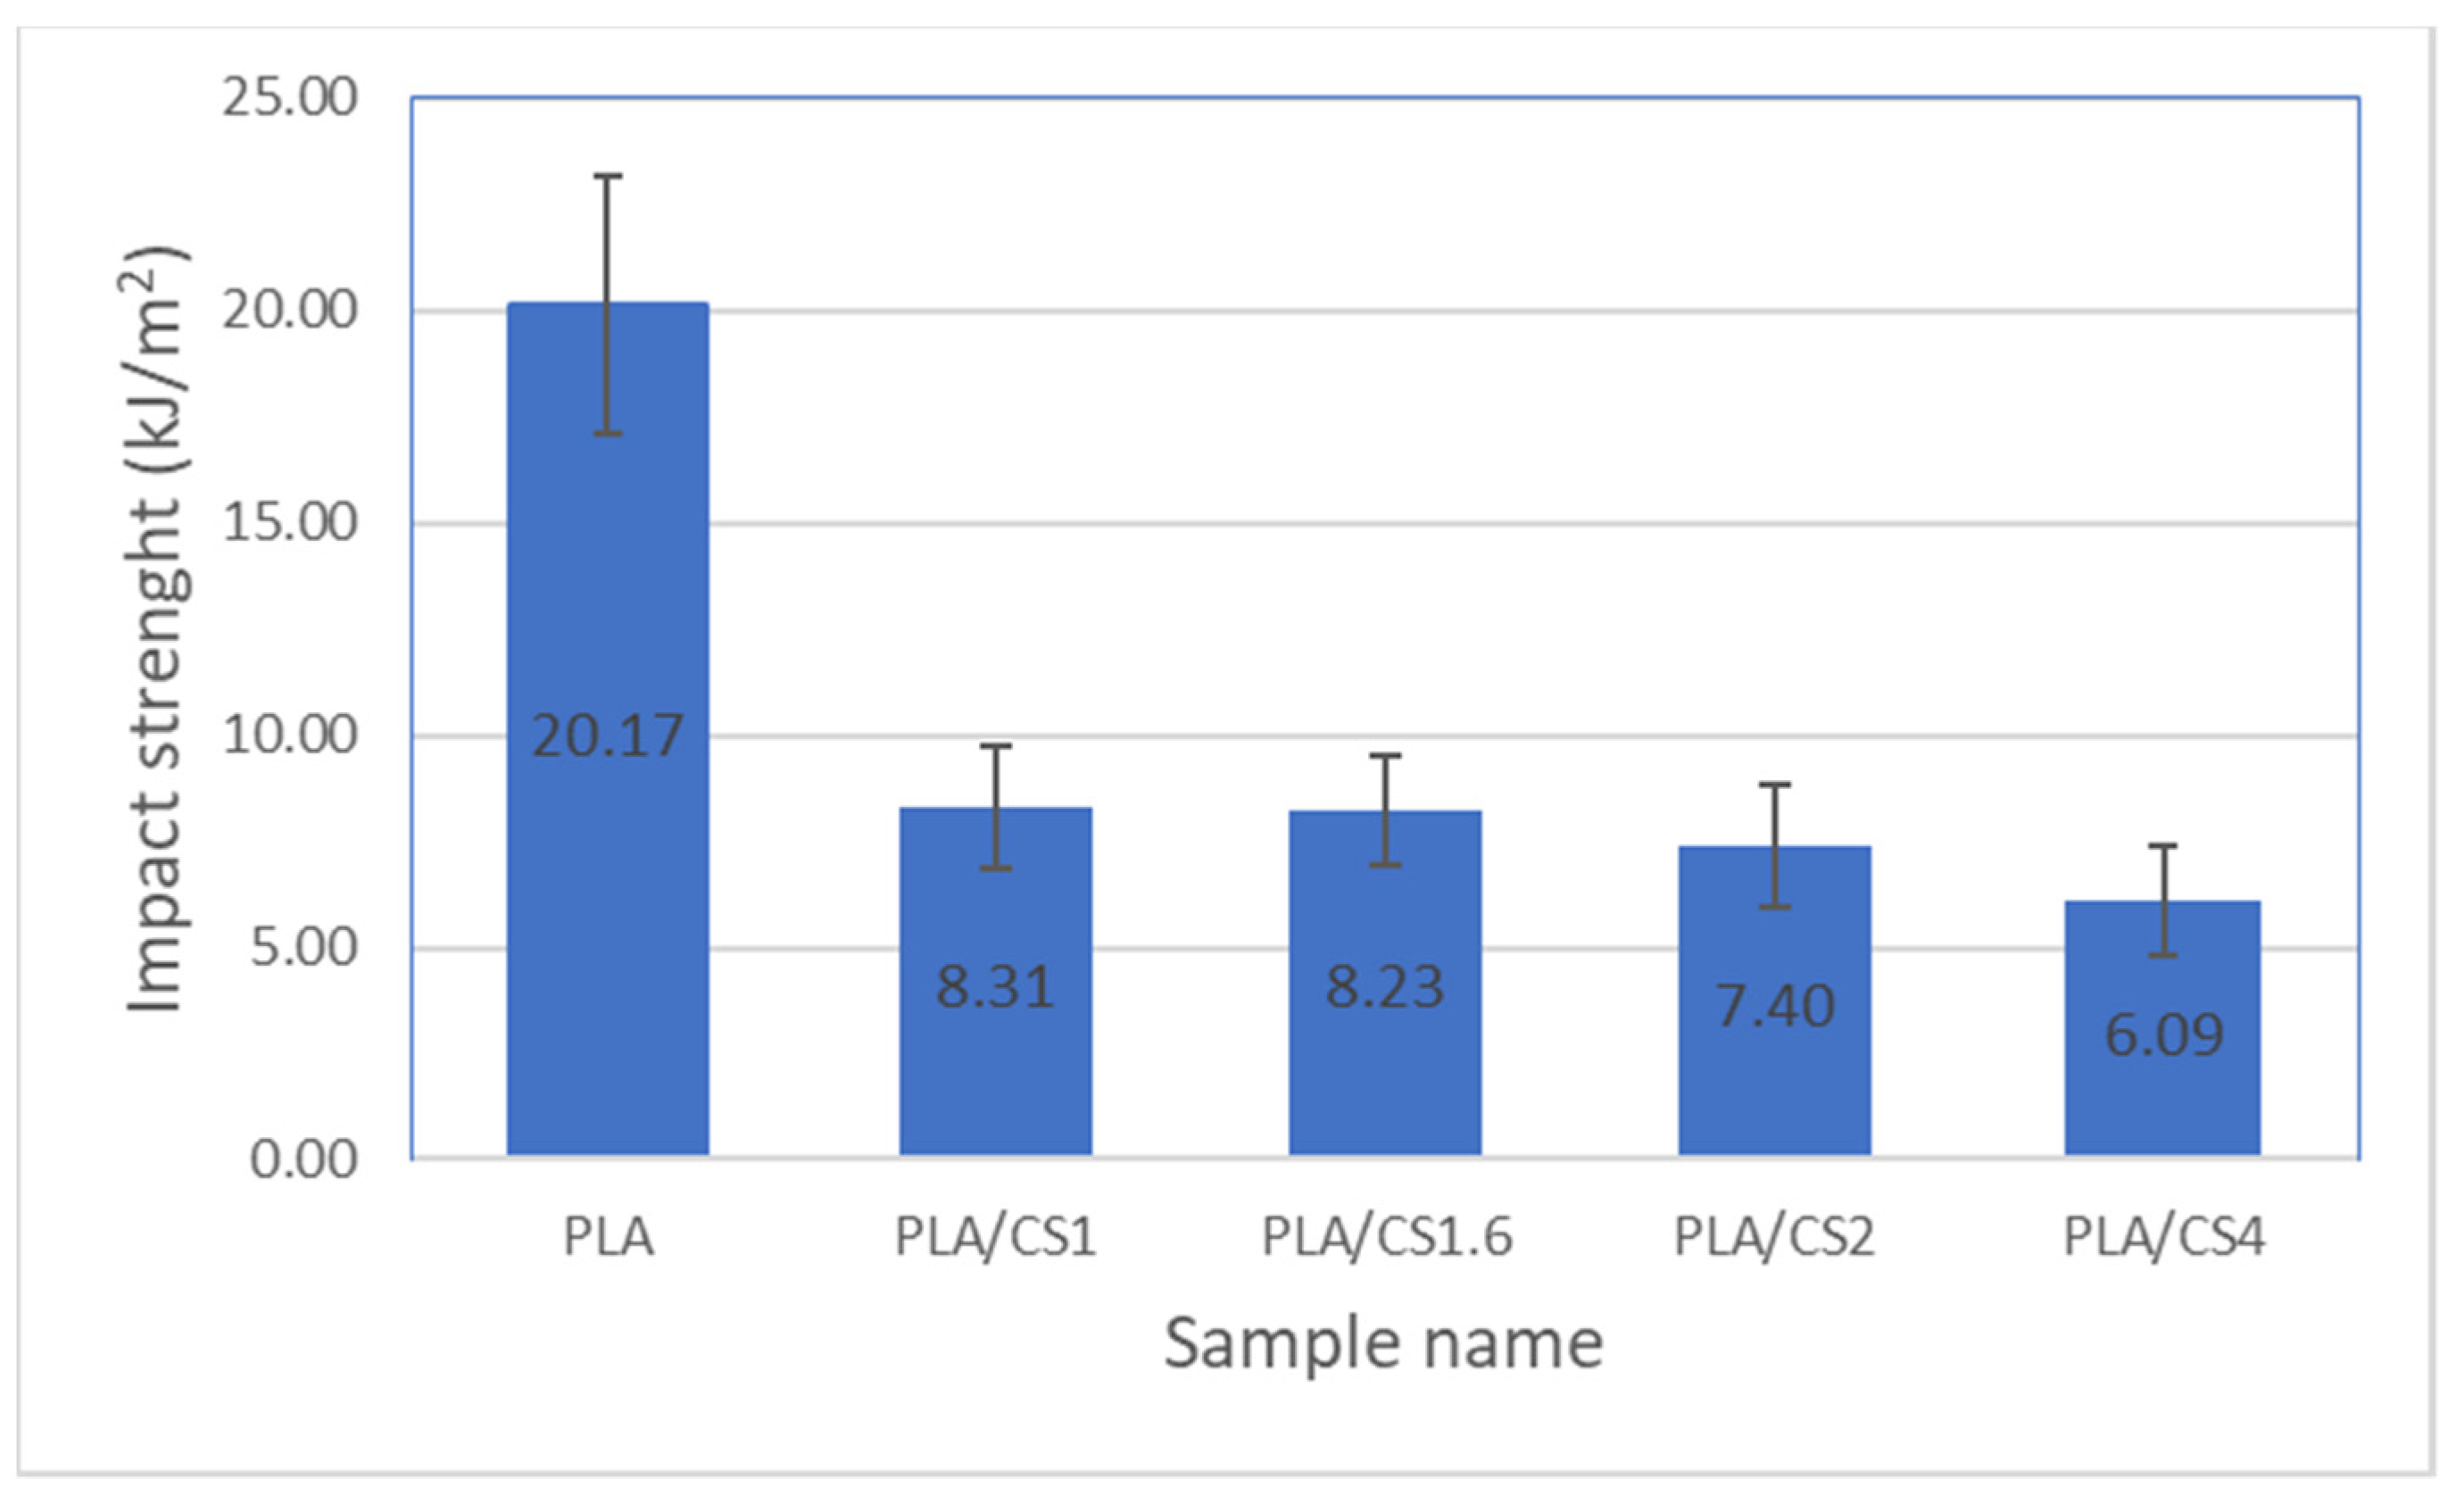
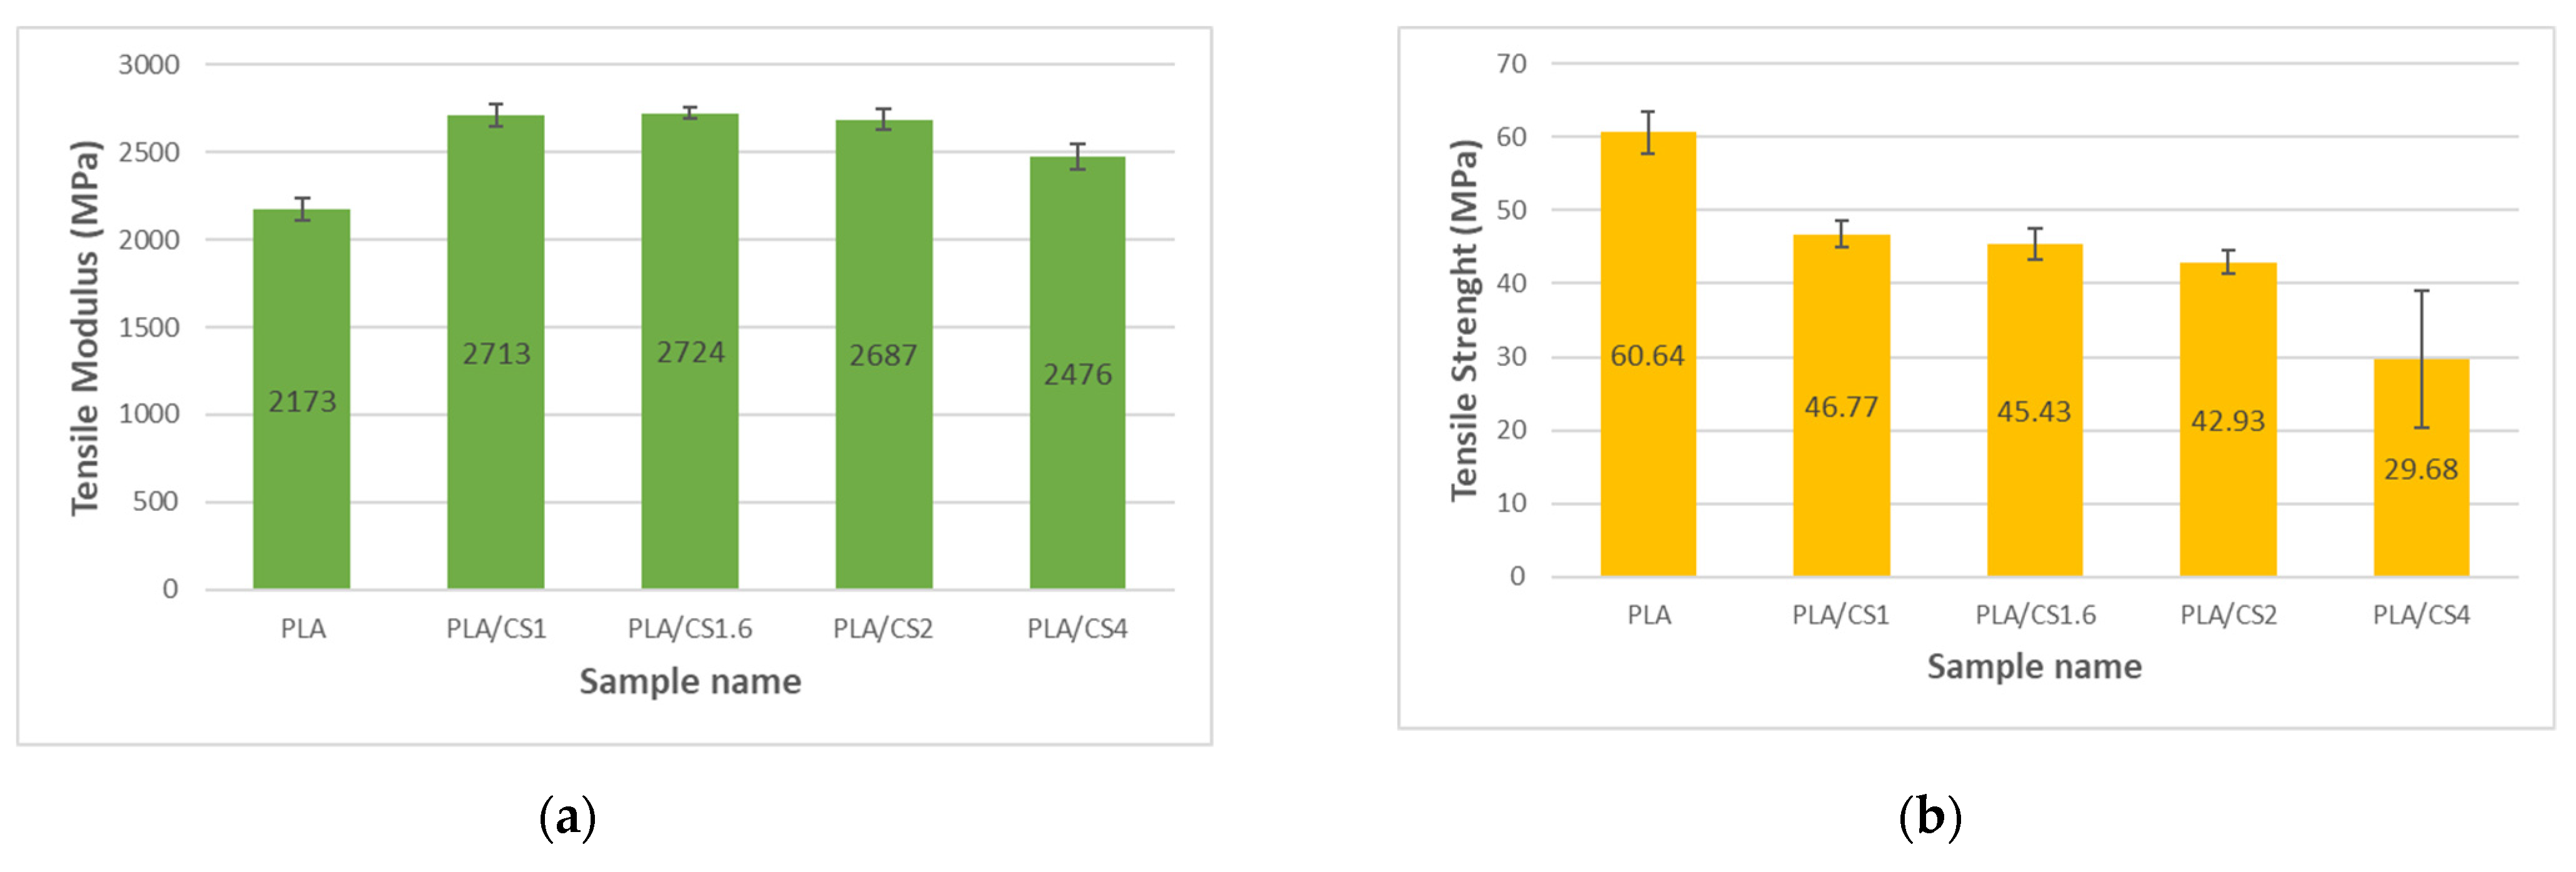
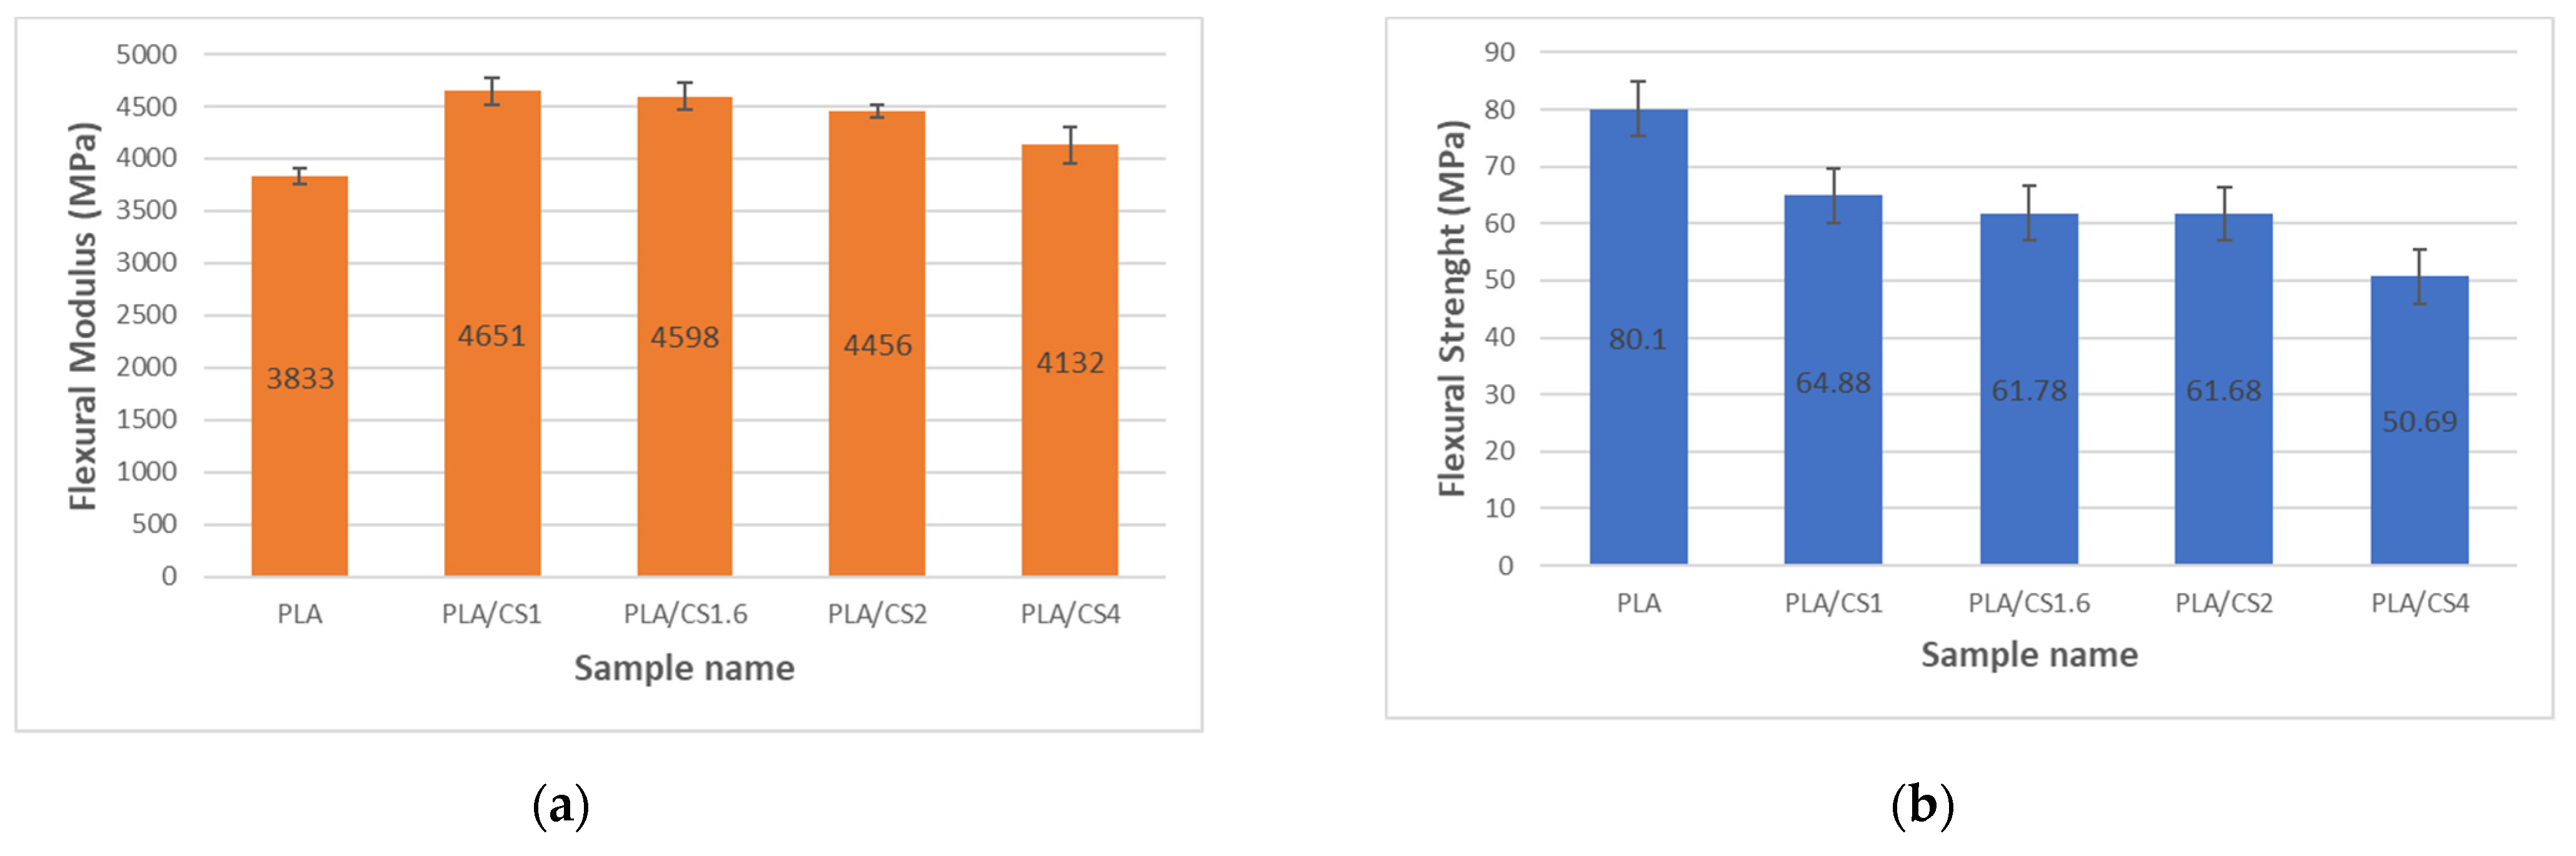
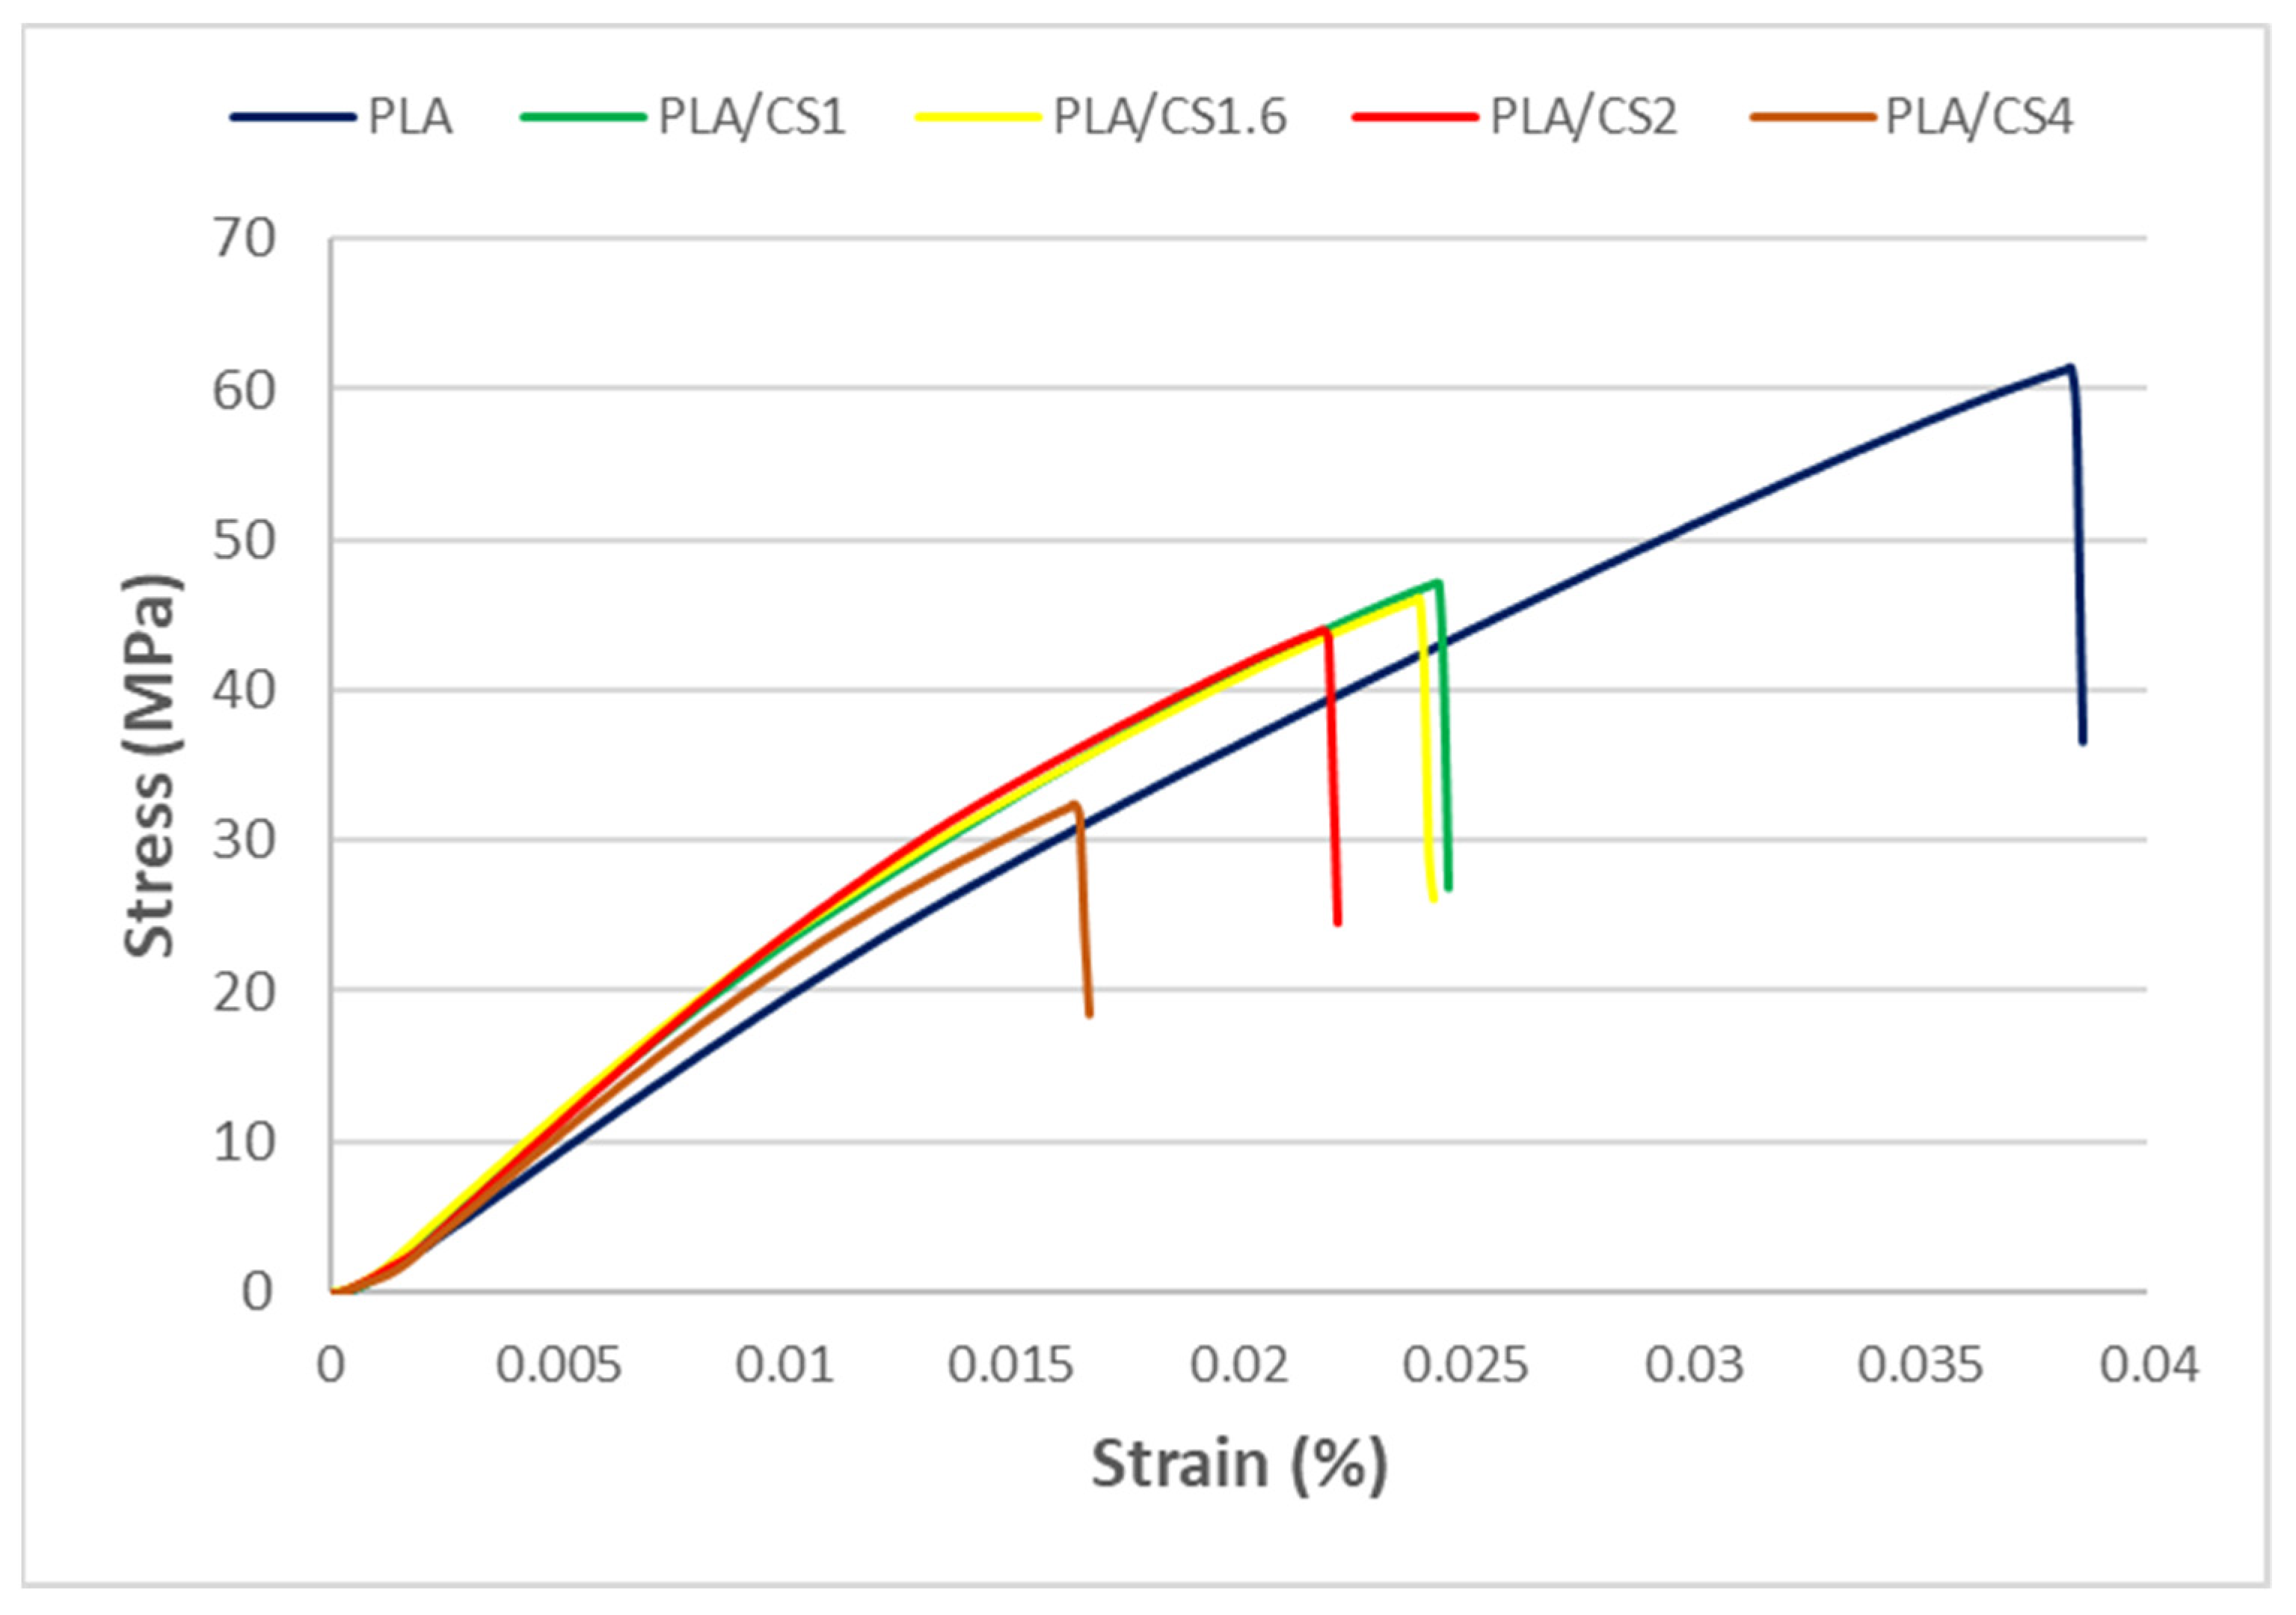
3.2. Characteristics of Mechanical Properties

Figure 2 shows the effect of corn stalk fiber size on the impact energy of produced samples. The samples containing pure PLA absorbed the impact energy best. As the filler fiber size increases, the impact energy decreases from 8.31 ± 1.64 kJ/m2 for PLA/CS1 samples up to 6.09 ± 1.08 kJ/m2 for PLA/CS4 samples which may be related to the deterioration of fiber dispersion with fiber length. A similar correlation was observed by Golmakani et al. where the impact energy decreased with increasing wood flour size in the polyethylene matrix composite [57].
The tensile and bending properties of injection molded samples of pure PLA and PLA/CS composites are shown in Table 2 and Table 3, respectively.
The PLA samples showed the lowest elastic modulus in both tension (Figure 3a) and bending (Figure 4a) of 2173 ± 65 MPa for tension and 3833 ± 71 MPa for bending, respectively. The use of CS fiber resulted in an increase in tensile and bending modulus in the composites relative to the matrix which is also observed with other types of natural fibers [58]. The highest tensile modulus of elasticity amounting to 2724 ± 34 MPa was for the PLA/CS1.6 sample, while the highest bending modulus of elasticity amounting to 4651 ± 129 MPa was for the PLA/CS1 sample. For the PLA/CS4 samples, in which the filler particles had a diameter of 4 mm, a significant decrease in modulus of elasticity both in tension and bending can be observed in relation to the other composites with CS filler. Similar decrease in tensile and bending modulus values in polymer composites with fibrous fillers for particles with diameter over 2 mm was observed by Stanciu et al. [59].
The highest tensile strength (Figure 3b) as well as bending strength (Figure 4b) of pure PLA samples were 60.64 ± 2.82 MPa for tension and 80.01 ± 2.3 MPa for bending, respectively. The value of tested PLA tensile strength was slightly different from that reported by the producer [56]. The tensile and bending strengths of the CS composites decreased with increasing fiber diameter from 46.77 ± 1.73 MPa for PLA/CS1 to 29.68 ± 9.33 MPa for PLA/CS4 in tension and from 64.88 ± 2.5 MPa for PLA/CS1 to 50.69 ± 5.3 MPa for PLA/CS4. However, there is a noticeable slight difference between the obtained tensile and bending strength values for filler particles in the range of 1 to 2 mm and a large decrease in strength for particles above 2 mm. Figure 5 shows the stress–strain curves for tensile tests of pure PLA and PLA/CS composite samples.
Similar correlation as for tensile and bending modulus and strength is also observed for tensile and bending strain. The pure PLA samples have the highest tensile strain and bending strain values of 4 ± 0.7% for tension and 2.24 ± 0.42% for bending, respectively. The use of CS fiber reduced the strain to about 1.53–2.34% for tensile and 1.6–1.79% for bending, which is a frequently observed effect of lignocellulosic particle filler [60].
Deterioration of the mechanical properties of PLA/CS composites relative to pure PLA is related to the poor interfacial adhesion occurring between the hydrophilic lignocellulosic CS fiber and the hydrophobic polymer matrix. The weak interfacial adhesion results in poor stress transfer between the composite components [60,61]. As the fiber diameter increases, the contact area with the matrix increases which causes an increase in stress intensification points and defects leading to the formation of sites for crack initiation causing sample failure even at lower loading values. Nourbachsh et al. indicated that a greater number of filler fiber–matrix contact areas in smaller particles results in improved tensile strength [62]. It is also possible that as the lignocellulosic material particles decrease, there is better and more uniform mixing with the polymer matrix as well as better flow through the injection hole resulting in better mechanical properties [63,64].
Improvement of interfacial adhesion in lignocellulosic filler composite is possible by using pretreatment of filler fibers including corn stalks. Luo et al. showed that pretreatment with epoxy emulsion modified with isocyanates of corn fibers used as a filler in PLA matrix composite allows to increase the interfacial adhesion between composite components, which results, among others, in improvement of mechanical properties [45].

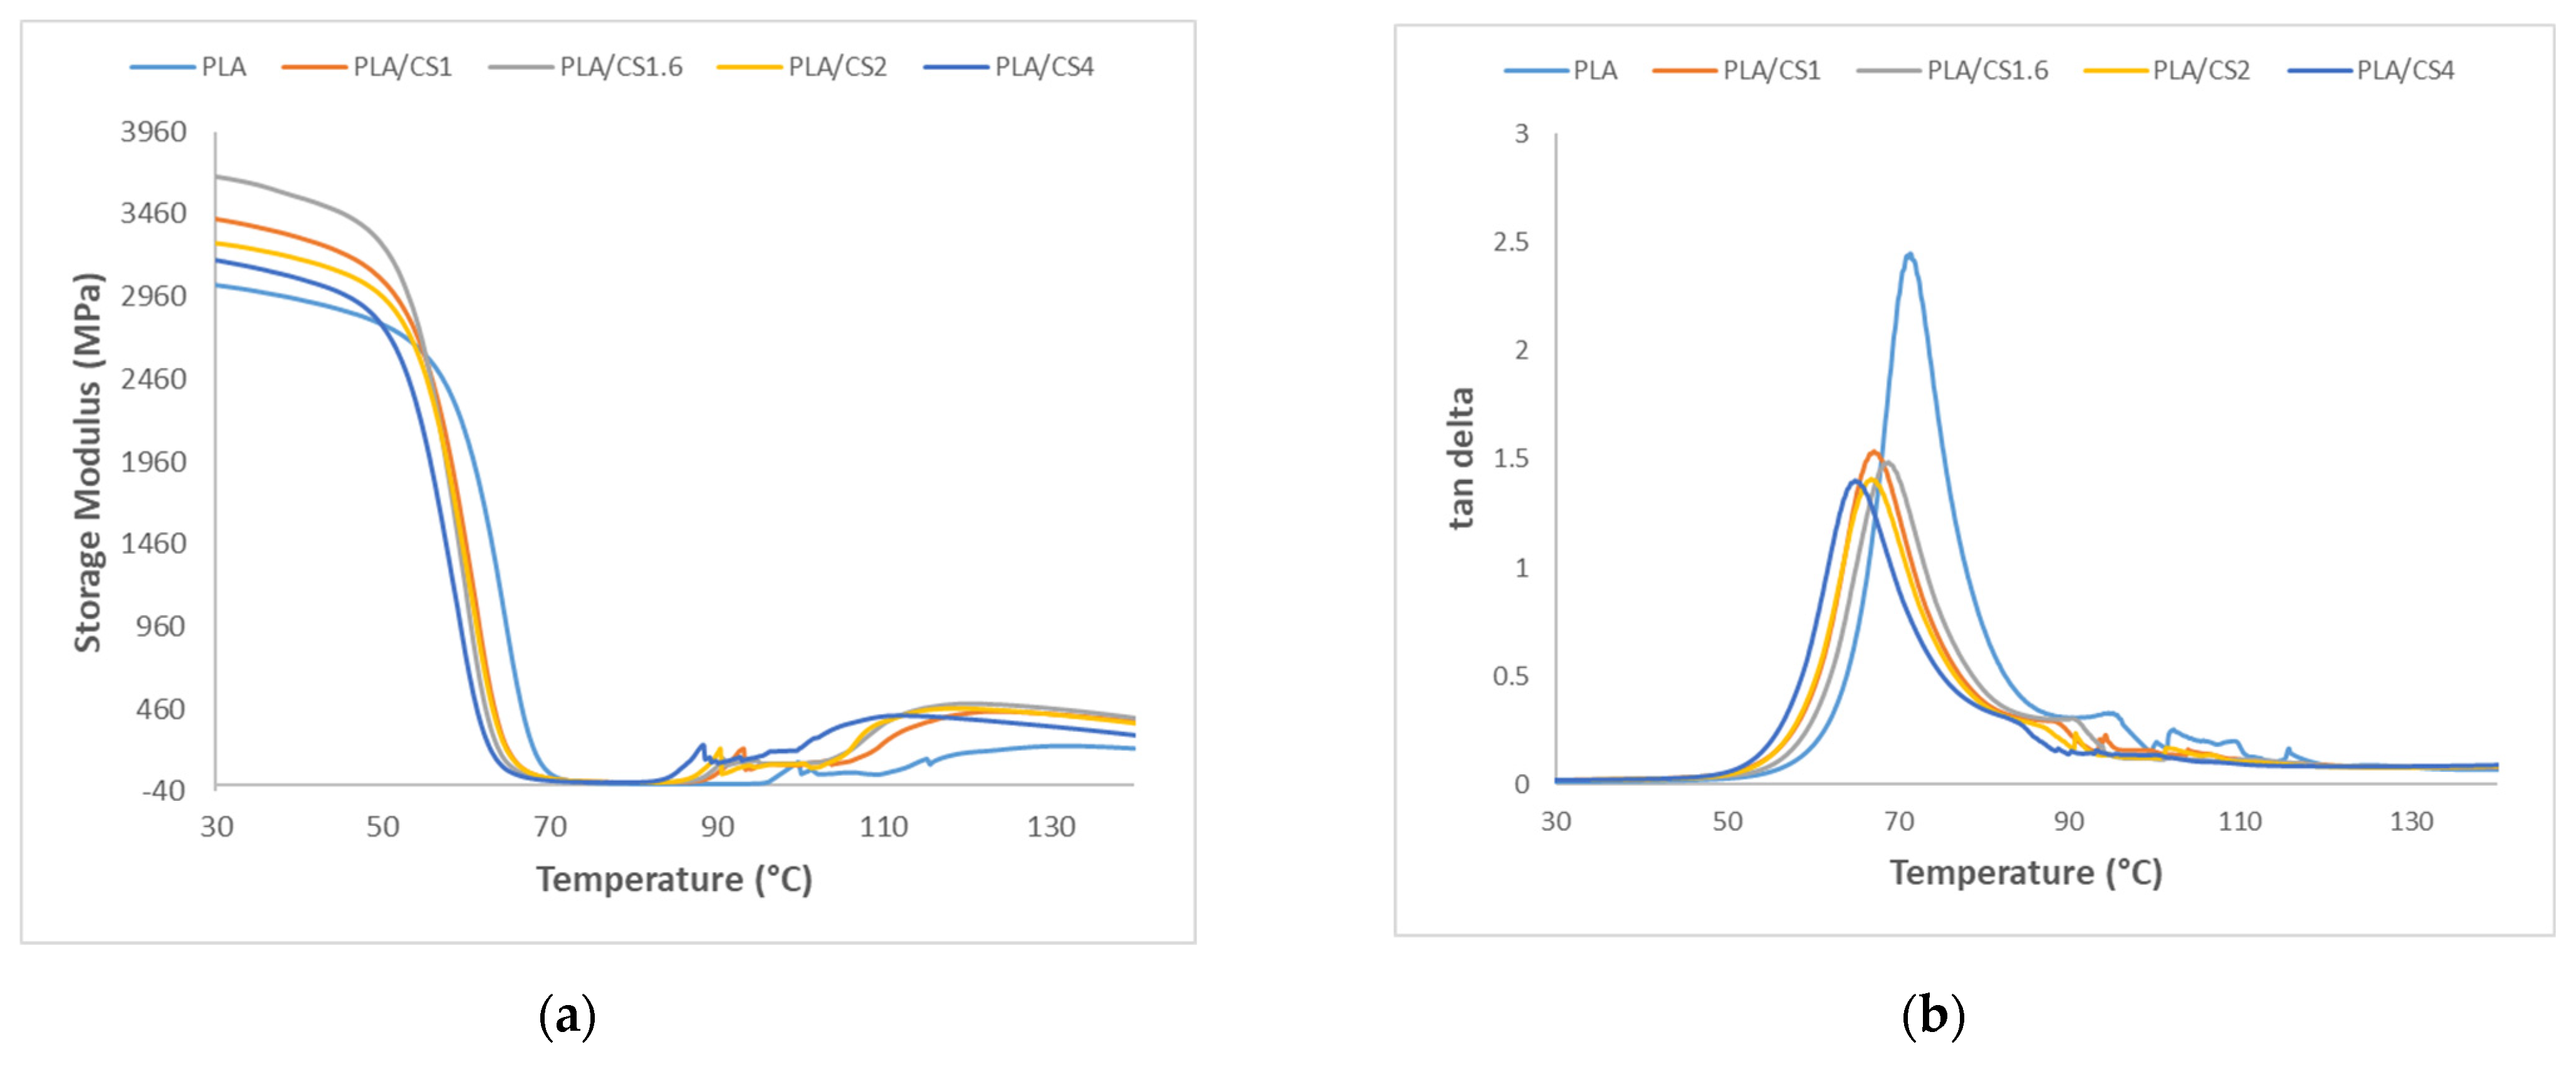
3.3. Characteristics of Thermomechanical Properties

The viscoelastic properties of pure PLA and PLA/CS composite samples have been investigated by dynamic mechanical analysis (DMA) method with measurement of the change in the conservation modulus (G′) and damping ratio (tan δ) as a function of temperature, as shown as curves in Figure 6. The variation of conservative modulus E′ with increasing temperature, shown in Figure 6a, indicates that at low temperatures below 50 °C, a relatively high stiffness is observed for all tested samples, which decreases quickly at temperatures between 50 °C and 80 °C due to reaching the alpha (α)-relaxation temperature of the polymer. On the other hand, in the temperature range between 100 and 140 °C, the phenomenon of cold crystallization is observed.
The maximum value of tan δ and the temperature at which this value is obtained as well as the values of E′ measured at 30 °C, 50 °C, 75 °C, and 120 °C for the samples of pure PLA and PLA/CS composites are presented in Table 4. All PLA/CS composites showed higher E′ values than pure PLA. The largest difference is observed after the glass transition area at 75 °C where the E′ value for the PLA/CS2 sample relative to unfilled PLA is 300% higher, indicating a large effect on the E′ value of the hard fillers in the thermoplastic matrix. A similar effect in changing the E′ value of PLA reinforcement with lignocellulosic fibers has been described previously [65,66]. A more than twofold increase in E′ values of 227%, 250%, 240%, and 208% is also observed in PLA/CS composites relative to pure PLA at 120 °C for PLA/CS1, PLA/CS1.6, PLA/CS2, and PLA/CS4, respectively. Additionally, the presence of fibers causes the cold crystallization phenomenon to occur at lower temperatures. The greatest increase in E′ relative to the PLA matrix at 30 °C, 50 °C, 75 °C, and 120 °C occurs in the PLA/CS1 composite.
Figure 6b shows the change in damping ratio (tan δ) as a function of temperature. The peak for the pure PLA sample was at 71.65 °C, while peaks were obtained at slightly lower temperatures for the PLA/CS composite samples. The highest tan δ value of 2.419 was obtained for pure PLA samples while PLA/CS samples had a lower value, which decreased along with increasing fiber length from 1.536 for PLA/CS1 to 1.398 for PLA/CS4. The decrease in tan δ value caused by partial suppression of PLA chain relaxation by CS fibers which consequently results in fewer PLA chains undergoing glass transition [67].

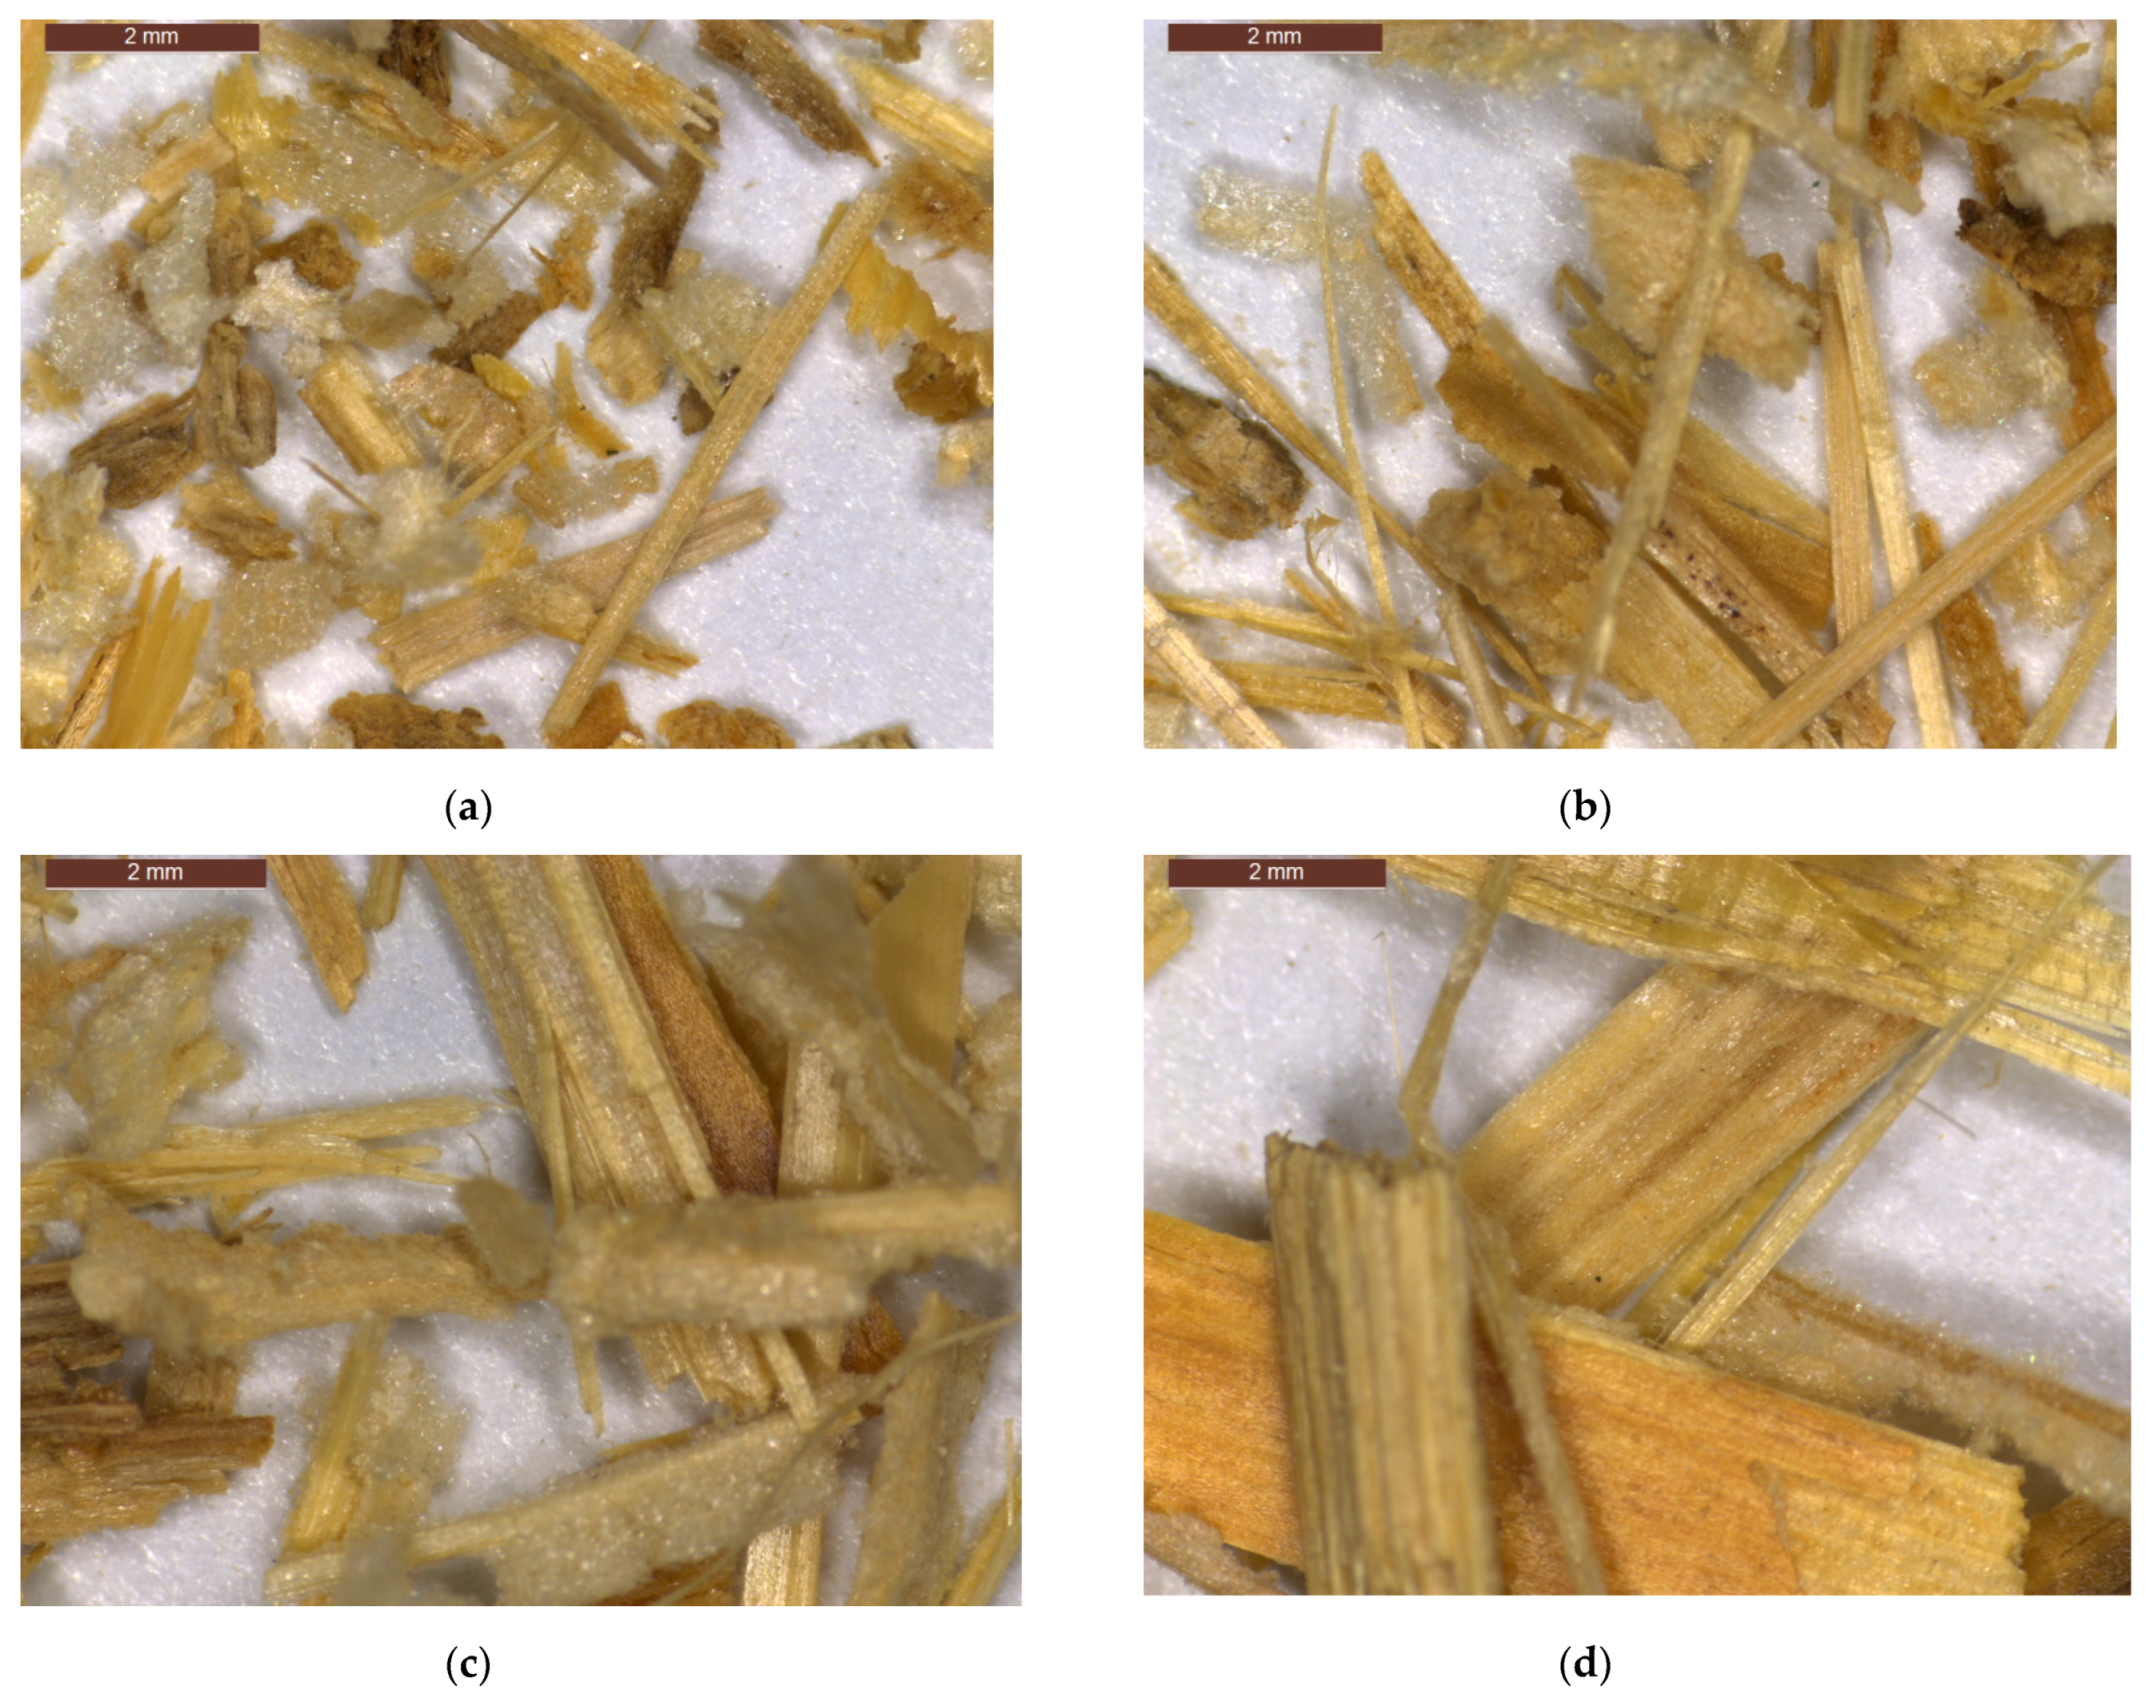
3.4. Characteristics of Corn Stalk Fiber Length before Processings

Figure 7 shows the microphotographs from the optical microscope analysis for each corn stalk fraction. The average corn stalk fiber diameter was 719 ± 190 µm, 893 ± 291 µm, 1073 ± 219 µm, and 1698 ± 636 µm for the CS1, CS1.6, CS2, and CS4 fractions, respectively. The CS1 fraction has the least elongated particles which is reflected in the highest diameter to length ratio value of 0.59 while for the other fractions it was 0.41, 0.44, and 0.36 for CS1.6, CS2, and CS4, respectively. Both components of corn stalks are visible in all fractions, where the intensity of flesh decreases as the size of fraction increases.

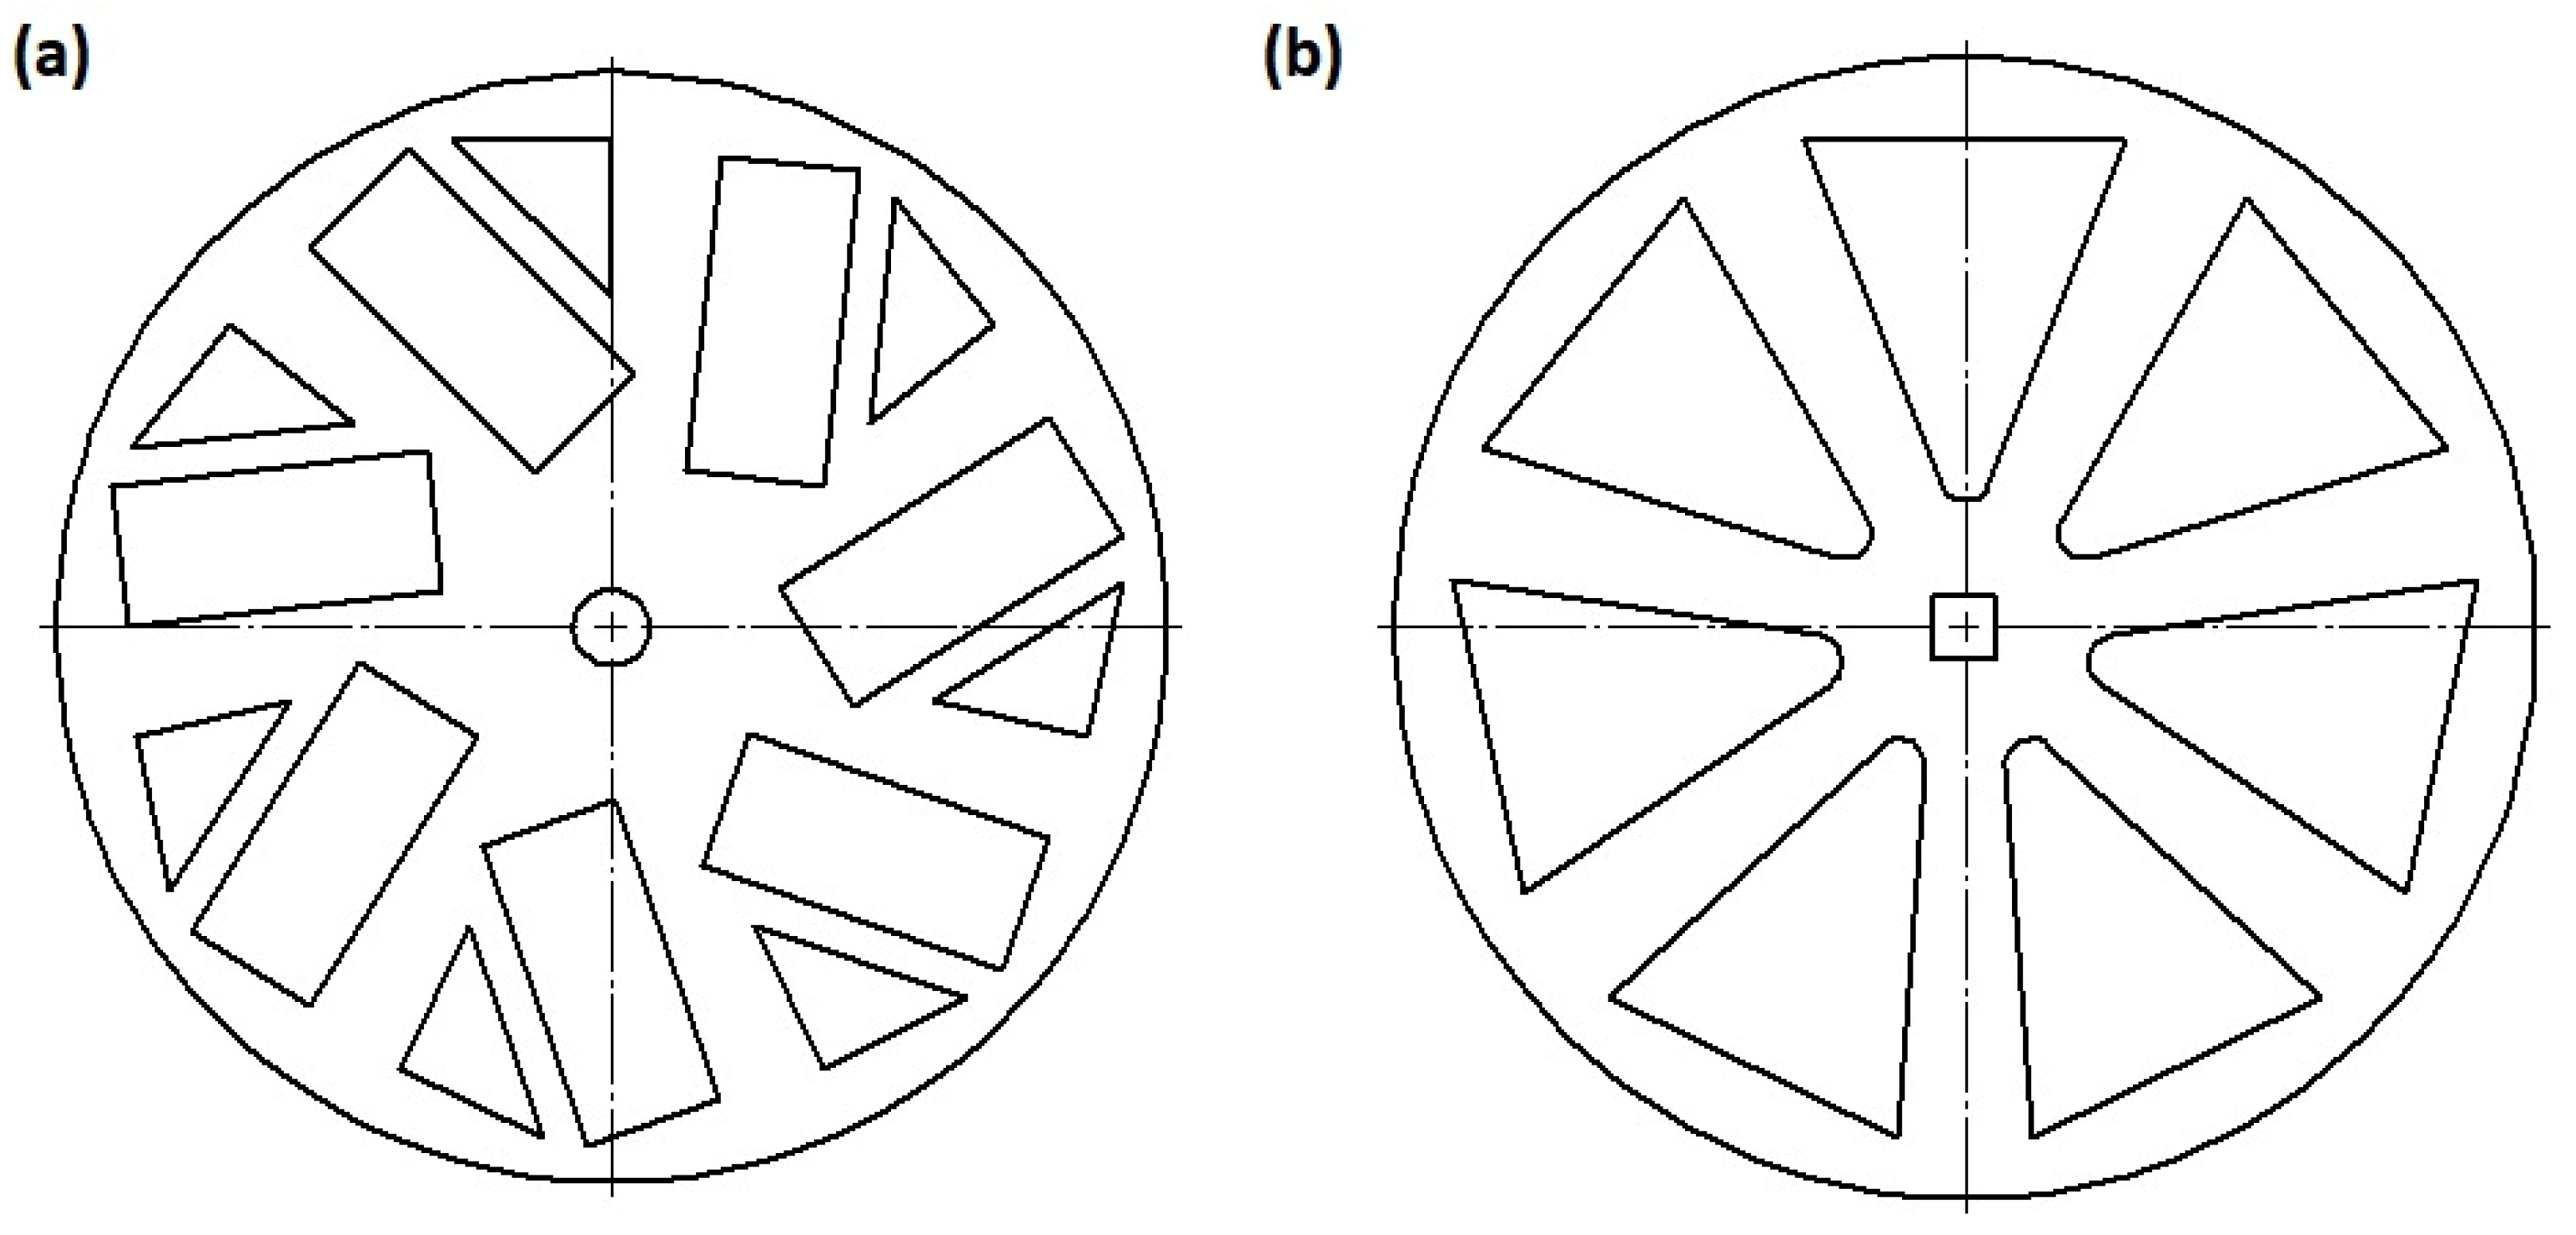
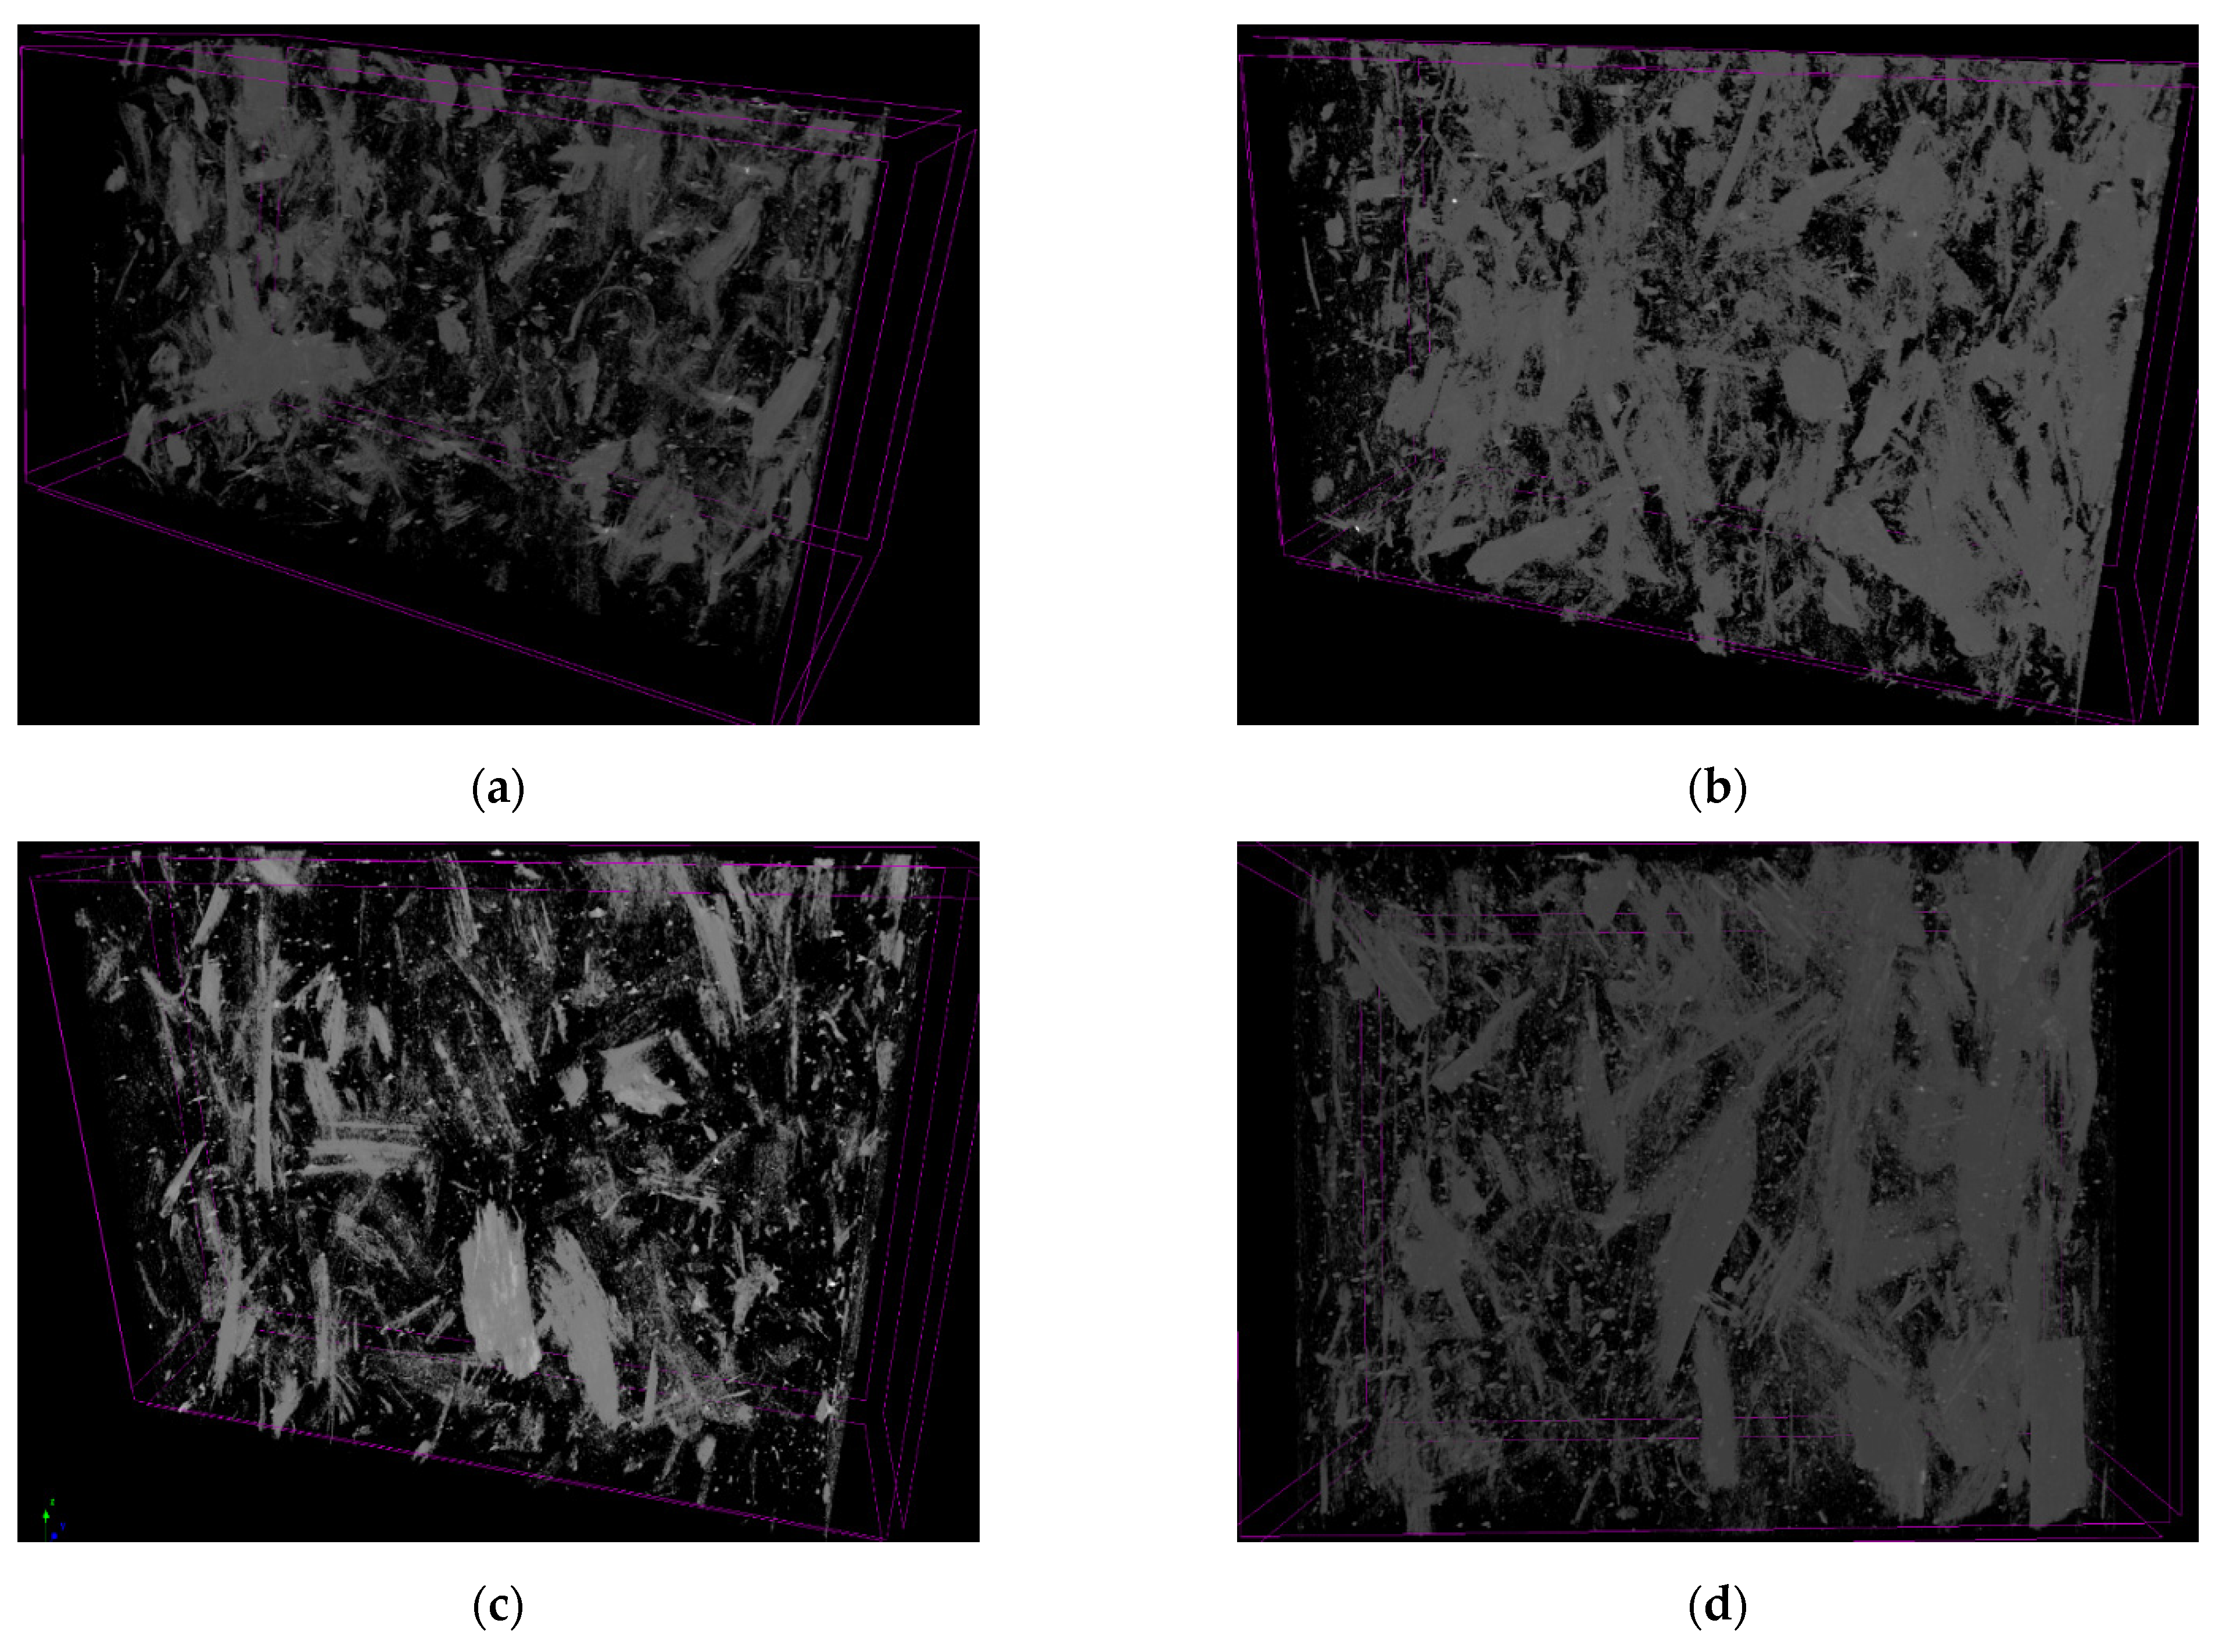
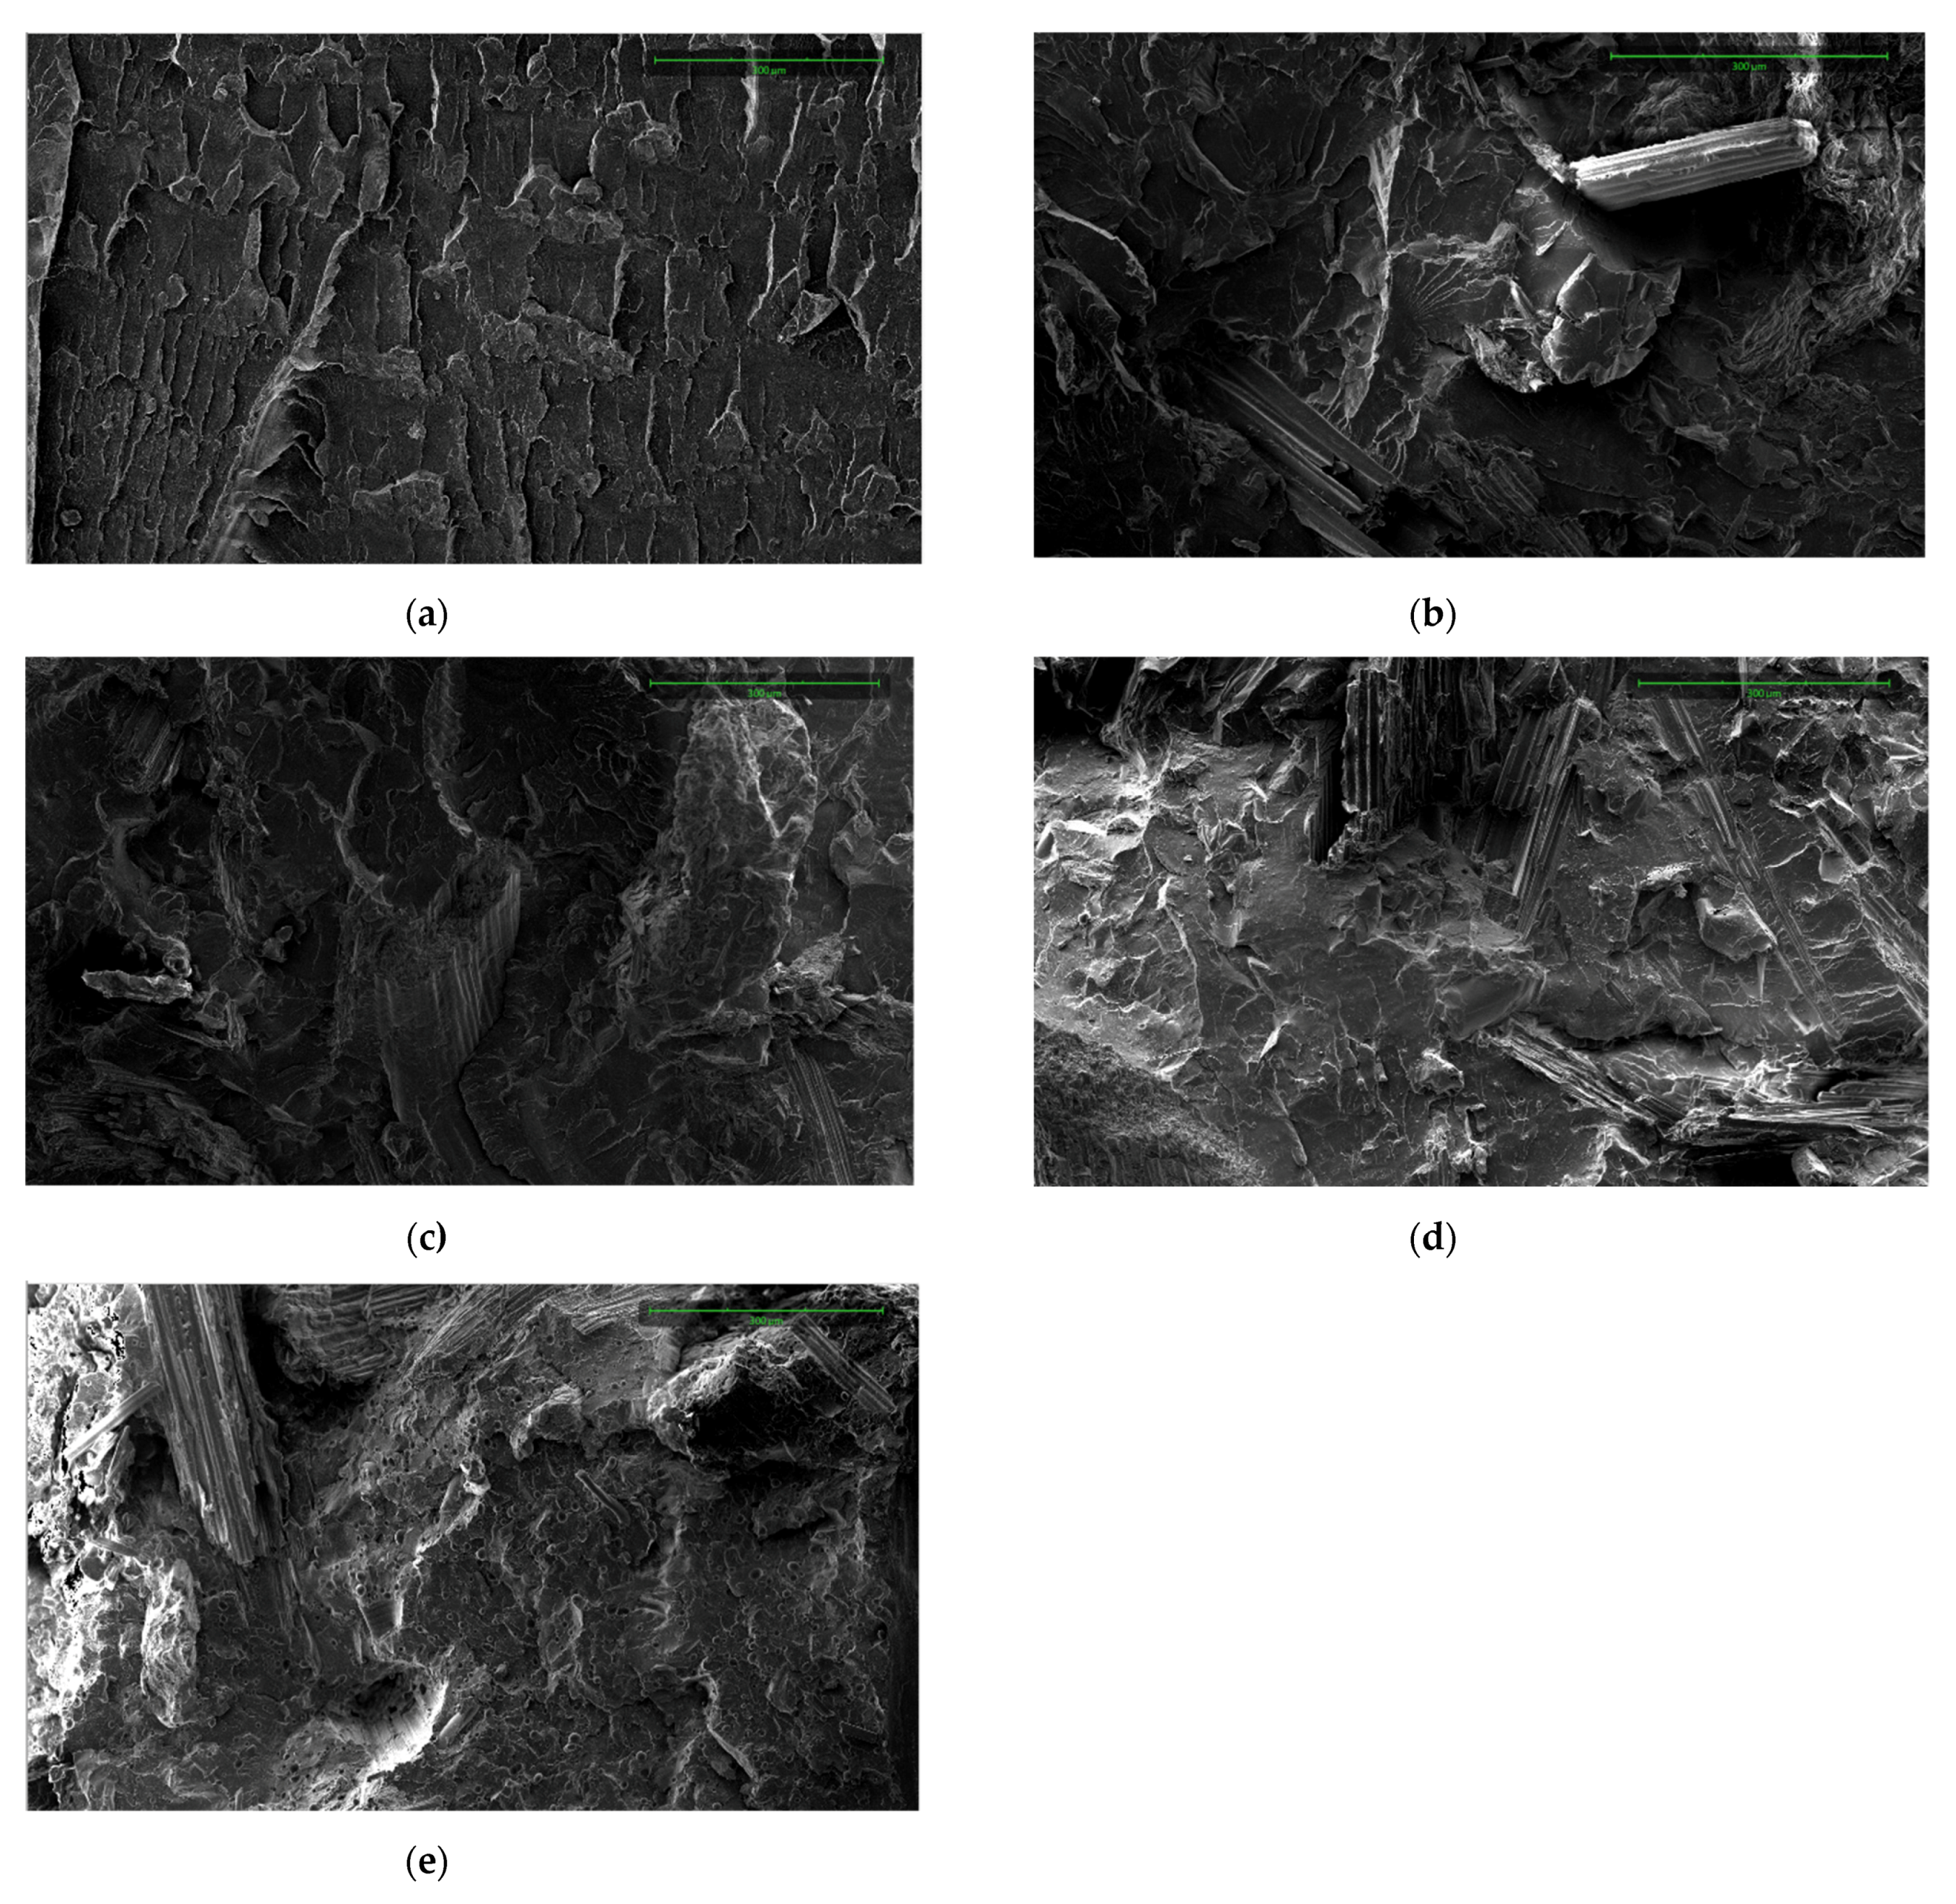
3.5. Analysis of Fiber Orientation and Size in the Composite

Images of cross sections of CS composites in a plane parallel to the main direction of material flow in the mold were taken using microtomography. The composite cross sections from the middle section are shown in Figure 8a–d for PLA/CS1, PLA/CS1.6, PLA/CS2, and PLA/CS4 samples, respectively. Based on the obtained composite cross sections, 3D image reconstructions were carried out, which are shown in Figure 9a–d for PLA/CS1, PLA/CS1.6, PLA/CS2, and PLA/CS4 samples, respectively. In all the samples, the CS fibers have a chaotic distribution. Figure 9 shows that in the PLA/CS1, PLA/CS1.6, and PLA/CS2 composites, the CS fibers were uniformly mixed with the binder, while the PLA/CS4 composite shows clusters of CS fibers, which may be responsible for the significant deterioration of mechanical properties of the green composite. In all composites small metal precipitates (≈1 wt%) are observed, most probably due to the disc wear of the grinding system.
Image 10 shows SEM images with 500x magnification of the fracture surface after impact test of pure PLA and PLA/CS composite samples. The observed homogeneous and smooth surface in Figure 3a corresponds to the PLA sample. The gaps between the corn stalk fibers and the polylactide matrix visible in Figure 10b–e indicate poor interfacial adhesion between the fiber and matrix which results in low stress transfer from matrix to filler [68,69] and decrease in mechanical properties. The average fiber diameter observed in SEM is 104 ± 43 µm, 123 ± 60 µm, 173 ± 60 µm, and 227 ± 89 µm for PLA/CS1, PLA/CS1.6, PLA/CS2, and PLA/CS4 samples, respectively. Composite processing resulted in a 693%, 726%, 622%, and 748% decrease in average filler fiber diameter for the sample.

4. Conclusions

The mechanical and thermomechanical properties of polymer composites with lignocellulosic fillers are significantly affected by the properties of their components, the quality of bonding between the polymer matrix and the lignocellulosic material, and the homogeneous and uniform distribution of the filler in a composite.
The effect of corn stalk particle size on the mechanical and thermomechanical properties of a polylactide matrix polymer composite was investigated. Corn stalk fiber was used in four sizes—1 mm, 1.6 mm, 2 mm, and 4 mm. It was observed that the mechanical and thermomechanical properties deteriorated with increasing filler size due to better transfer of finer fiber particles of mechanical stresses in the composite. The use of fiber particles larger than 2 mm causes poor dispersion with the polymer matrix, which significantly affects the deterioration of mechanical and thermomechanical properties of the composite. The composite with filler fiber of 1 mm diameter had the best mechanical and thermomechanical properties.
The SEM images indicated that the corn stalk fibers had low interfacial adhesion with the polylactide matrix. Processing resulted in a more than 6-fold decrease in filler fiber length from 719 ± 190 µm, 893 ± 291 µm, 1073 ± 219 µm, and 1698 ± 636 µm for CS1, CS1.6, CS2, and CS4 fractions, respectively, to 104 ± 43 µm, 123 ± 60 µm, 173 ± 60 µm, and 227 ± 89 µm.
In conclusion, corn stalk fiber with a size between 1 and 2 mm has a good potential for their use in the production of green polymer composites compatible with sustainable natural resource management and constitutes an alternative to traditional filler materials.
Further studies will focus on the rheological and structural analysis of the investigated composites.

Author Contributions

Conceptualization, D.Ł. and K.M.; methodology, D.Ł. and A.T.; software, D.Ł., A.T. and Z.S.; validation, D.Ł., M.M. and K.M.; formal analysis, D.Ł.; investigation, D.Ł.; resources, D.Ł.; data curation, D.Ł.; writing—original draft preparation, D.Ł.; writing—review and editing, M.M. and K.M.; visualization, D.Ł.; supervision, M.M. and K.M.; project administration, M.M.; funding acquisition, D.Ł. All authors have read and agreed to the published version of the manuscript.

Funding

This research received no external funding.

Institutional Review Board Statement

Not applicable.

Informed Consent Statement

Not applicable.

Data Availability Statement

Data available on request due to restrictions (privacy or ethical). The data presented in this study are available on request from the corresponding author. The data are not publicly available due to the privacy of results belonging to Kazimierz Great University.

Conflicts of Interest

The authors declare no conflict of interest.

References

  1. Khoo, H.H.; Tan, R.B.H.; Chng, K.W.L. Environmental impacts of conventional plastic and bio-based carrier bags. Int. J. Life Cycle Assess. 2010, 15, 284–293. [Google Scholar] [CrossRef]
  2. Gholami, F.; Pakzad, L.; Behzadfar, E. Morphological, interfacial and rheological properties in multilayer polymers: A review. Polymer 2020, 208, 122950. [Google Scholar] [CrossRef]
  3. Zhou, Y.; Wang, Y.; Wang, Y.; Li, X. Humidity-Enabled Ionic Conductive Trace Carbon Dioxide Sensing of Nitrogen-Doped Ti3C2Tx MXene/Polyethyleneimine Composite Films Decorated with Reduced Graphene Oxide Nanosheets. Anal. Chem. 2020, 92, 16033–16042. [Google Scholar] [CrossRef]
  4. Plastics Europe. Plastics–The Facts 2020; An Analysis of European Plastics Production, Demand and Waste Data. Available online: https://www.plasticseurope.org/application/files/5716/0752/4286/AF_Plastics_the_facts-WEB-2020-ING_FINAL.pdf (accessed on 10 March 2021).
  5. Akil, H.M.; Omar, M.F.; Mazuki, A.A.M.; Safiee, S.; Ishak, Z.A.M.; Abu Bakar, A. Kenaf fiber reinforced composites: A review. Mater. Des. 2011, 32, 4107–4121. [Google Scholar] [CrossRef]
  6. Jiménez, A.M.; Delgado-Aguilar, M.; Tarrés, Q.; Quintana, G.; Fullana-i-Palmer, P.; Mutjè, P.; Espinach, F.X. Sugarcane bagasse reinforced composites: Studies on the young’s modulus and macro and micro-mechanics. Bioresources 2017, 12, 3618–3629. [Google Scholar] [CrossRef] [Green Version]
  7. Stefaniak, K.; Masek, A. Green Copolymers Based on Poly(Lactic Acid)—Short Review. Materials 2021, 14, 5254. [Google Scholar] [CrossRef]
  8. Wu, W.; Cao, X.; Zhang, Y.; He, G. Polylactide/halloysite nanotube nanocomposites: Thermal, mechanical properties, and foam processing. J. Appl. Polym. Sci. 2013, 130, 443–452. [Google Scholar] [CrossRef]
  9. Interreg Europe. Sustainable Waste Management in a Circular Economy. A Policy Brief from the Policy Learning Platform on Environment and Resource Efficiency. Available online: https://www.interregeurope.eu/fileadmin/user_upload/plp_uploads/policy_briefs/Policy_brief_on_waste_management.pdf (accessed on 16 March 2021).
  10. Carbonell-Verdu, A.; Boronat, T.; Quiles-Carrillo, L.; Fenollar, O.; Dominici, F.; Torre, L. Valorization of Cotton Industry Byproducts in Green Composites with Polylactide. J. Polym. Environ. 2020, 28, 2039–2053. [Google Scholar] [CrossRef]
  11. Zini, E.; Scandola, M. Green composites: An overview. Polym Compos. 2011, 32, 1905–1915. [Google Scholar] [CrossRef]
  12. Scaffaro, R.; Maio, A.; Gulino, E.F.; Alaimo, G.; Morreale, M. Green Composites Based on PLA and Agricultural or Marine Waste Prepared by FDM. Polymers 2021, 13, 1361. [Google Scholar] [CrossRef]
  13. Abhiram, Y.; Das, A.; Sharma, K.K. Green composites for structural and non-structural applications: A review. Mater. Today Proc. 2021, 44, 2658–2664. [Google Scholar] [CrossRef]
  14. Ghanbarzadeh, B.; Almasi, H. Biodegradable polymers. In Biodegradation-Life of Science; Chamy, R., Rosenkranz, F., Eds.; InTech Publications: Rijeka, Croatia, 2013; pp. 141–186. [Google Scholar]
  15. Haider, T.P.; Volker, C.; Kramm, J.; Landfester, K.; Wurm, F.R. Plastics of the future? The impact of biodegradable polymers on the environment and on society. Angew. Chem. 2019, 58, 50–62. [Google Scholar] [CrossRef] [Green Version]
  16. Rasal, R.M.; Janorkar, A.V.; Hirt, D.E. Poly(lactic acid) modifications. Prog. Polym. Sci. 2010, 35, 338–356. [Google Scholar] [CrossRef]
  17. Kumar Bajpai, P.; Singh, I.; Madaan, J. Development and characterization of PLA-based green composites: A review. J. Themoplast. Compos. Mater. 2014, 27, 52–81. [Google Scholar] [CrossRef]
  18. Zenkiewicz, M.; Richert, J.; Rytlewski, P.; Moraczewski, K.; Stepczyńska, M.; Karasiewicz, T. Characterisation of multi-extruded poly (lactic acid). Polym. Test. 2009, 28, 412–418. [Google Scholar] [CrossRef]
  19. Gross, R.A.; Kalra, B. Biodegradable Polymers for the Environment. Science 2002, 297, 803–807. [Google Scholar] [CrossRef] [Green Version]
  20. Cao, X.; Chi, X.; Deng, X.; Sun, Q.; Gong, X.; Yu, B.; Yuen, A.C.Y.; Wu, W.; Li, R.K.Y. Facile Synthesis of Phosphorus and Cobalt Co-Doped Graphitic Carbon Nitride for Fire and Smoke Suppressions of Polylactide Composite. Polymers 2020, 12, 1106. [Google Scholar] [CrossRef]
  21. Wang, F.; Zhou, S.; Yang, M.; Chen, Z.; Ran, S. Thermo-Mechanical Performance of Polylactide Composites Reinforced with Alkali-Treated Bamboo Fibers. Polymers 2018, 10, 401. [Google Scholar] [CrossRef] [Green Version]
  22. Scaffaro, R.; Maio, A.; Gulino, E.F.; Megna, B. Structure-property relationship of PLA-Opuntia Ficus Indica biocomposites. Compos. Part B 2019, 167, 199–206. [Google Scholar] [CrossRef]
  23. Huda, M.S.; Drzal, L.T.; Misra, M.; Mohanty, A.K. Wood-fiber-reinforced poly(lactic acid) composites: Evaluation of the physicomechanical and morphological properties. J. Appl. Polym. Sci. 2006, 102, 4856–4869. [Google Scholar] [CrossRef]
  24. Hu, R.; Lim, J.K. Fabrication and Mechanical Properties of Completely Biodegradable Hemp Fiber Reinforced Polylactic Acid Composites. J. Compos. Mater. 2007, 41, 1655–1669. [Google Scholar] [CrossRef]
  25. Espinach, F.X. Advances in Natural Fibers and Polymers. Materials 2021, 14, 2607. [Google Scholar] [CrossRef]
  26. Sathishkumar, T.P.; Navaneethakrishnan, P.; Shankar, S.; Rajasekar, R.; Rajini, N. Characterization of natural fibre and composites—A review. J. Reinf. Plast. Compos. 2013, 32, 1457–1476. [Google Scholar] [CrossRef]
  27. Gupta, M.K.; Bharti, A. Natural fiber reinforced polymercomposites: A review on dynamic mechanical properties. Curr. Trends Fash. Technol. Text. Eng. 2017, 1, 1–4. [Google Scholar] [CrossRef] [Green Version]
  28. Wei, L.; McDonald, A.G. A review on grafting of biofibers for biocomposites. Materials 2016, 9, 303. [Google Scholar] [CrossRef] [PubMed]
  29. Masłowski, M.; Miedzianowska, J.; Strzelec, K. Natural rubber composites filled with cereals straw modified with acetic and maleic anhydride: Preparation and properties. J. Polym. Environ. 2018, 26, 4141–4157. [Google Scholar] [CrossRef] [Green Version]
  30. Miedzianowska, J.; Masłowski, M.; Rybiński, P.; Strzelec, K. Properties of chemically modified (selected silanes) lignocellulosic filler and its application in natural rubber biocomposites. Materials 2020, 13, 4163. [Google Scholar] [CrossRef] [PubMed]
  31. Mohanty, A.K.; Vivekanandhan, S.; Pin, J.M.; Misra, M. Composites from renewable and sustainable resources: Challenges and innovations. Science 2018, 362, 536–542. [Google Scholar] [CrossRef] [Green Version]
  32. Muscat, A.; de Olde, E.; Kovacic, Z.; de Boer, I.; Ripoll-Bosch, R. Food, energy or biomaterials? Policy coherence across agro-food and bioeconomy policy domains in the EU. Environ. Sci. Policy 2021, 123, 21–30. [Google Scholar] [CrossRef]
  33. Chhabra, N.; Kaur, A. Studies on Physical and Engineering Characteristics of Maize, Pearl Millet and Soybean. J. Pharmacogn. Phytochem. 2017, 6, 1–5. [Google Scholar]
  34. Bank PKO World and Domestic Cereal Market in the 2019/20. Available online: https://www.pkobp.pl/media_files/738e5a0e-0dc9-4577-94ed-9871ea36b9fe.pdf (accessed on 18 March 2021).
  35. Hong, J.; Ren, L.; Hong, J.; Xu, C. Environmental impact assessment of corn straw utilization in China. J. Clean. Prod. 2016, 112, 1700–1708. [Google Scholar] [CrossRef]
  36. Sokhansanj, S.; Mani, S.; Tagore, S.; Turhollow, A.F. Techno-economic analysis of using corn stover to supply heat and power to a corn ethanol plant–Part 1: Cost of feedstock supply logistics. Biomass Bioenergy 2010, 34, 75–81. [Google Scholar] [CrossRef]
  37. Kovács, Á.; Kerényi, G. Physical Characteristics and Mechanical Behaviour of Maize Stalks for Machine Development. Int. Agrophysics 2019, 33, 427–436. [Google Scholar] [CrossRef]
  38. Czajkowski, Ł.; Wojcieszak, D.; Olek, W.; Przybył, J. Thermal properties of fractions of corn stover. Constr. Build. Mater. 2019, 210, 709–712. [Google Scholar] [CrossRef]
  39. Yuan, X.; Li, P.; Wang, H.; Wang, X.; Cheng, X.; Cui, Z. Enhancing the anaerobic digestion of corn stalks using composite microbial pretreatment. J. Microbiol. Biotechnol. 2011, 21, 746–752. [Google Scholar] [CrossRef] [PubMed] [Green Version]
  40. Kadam, K.L.; McMillan, J.D. Availability of corn stover as a sustainable feedstock for bioethanol production. Bioresour. Technol. 2003, 88, 17–25. [Google Scholar] [CrossRef]
  41. Menardo, S.; Airoldi, G.; Cacciatore, V.; Balsari, P. Potential biogas and methane yield of maize stover fractions and evaluation of some possible stover harvest chains. Biosyst. Eng. 2015, 129, 352–359. [Google Scholar] [CrossRef]
  42. Wu, T.; Wang, X.; Kito, K. Effects of pressures on the mechanical properties of corn straw bio-board. Eng. Agric. Environ. Food 2015, 8, 123–129. [Google Scholar] [CrossRef] [Green Version]
  43. Mayer-Laigle, C.; Haurie Ibarra, L.; Breysse, A.; Palumbo, M.; Mabille, F.; Lacasta Palacio, A.M.; Barron, C. Preserving the Cellular Tissue Structure of Maize Pith Though Dry Fractionation Processes: A Key Point to Use as Insulating Agro-Materials. Materials 2021, 14, 5350. [Google Scholar] [CrossRef]
  44. Ma, Y.; Wu, S.; Zhuang, J.; Tong, J.; Xiao, Y.; Qi, H. The Evaluation of Physio-Mechanical and Tribological Characterization of Friction Composites Reinforced by Waste Corn Stalk. Materials 2018, 11, 901. [Google Scholar] [CrossRef] [Green Version]
  45. Luo, H.; Xiong, G.; Ma, C.; Chang, P.; Yao, F.; Zhu, Y.; Zhang, C.; Wan, Y. Mechanical and thermo-mechanical behaviors of sizingtreated corn fiber/polylactide composites. Polym. Test. 2014, 32, 45–52. [Google Scholar] [CrossRef]
  46. Łączny, D.; Macko, M.; Moraczewski, K. Mechanical properties of polylactide matrix composite reinforced with long maize stalk fibers. Adv. Sci. Technol. Res. J. 2021, (in press). [Google Scholar]
  47. Nyambo, C.; Mohanty, A.K.; Misra, M. Polylactide-Based Renewable Green Composites from Agricultural Residues and Their Hybrids. Biomacromolecules 2010, 11, 1654–1660. [Google Scholar] [CrossRef]
  48. Panthapulakkal, S.; Sain, M. Injection Molded Wheat Straw and Corn Stem Filled Polypropylene Composites. J. Polym. Environ. 2006, 14, 265–272. [Google Scholar] [CrossRef]
  49. Jiang, D.; Wang, Y.; Li, B.; Sun, C.; Guo, Z. Environmentally Friendly Alternative to Polyester Polyol by Corn Straw on Preparation of Rigid Polyurethane Composite. Compos. Commun. 2020, 17, 109–114. [Google Scholar] [CrossRef]
  50. Zhang, P.; Wang, B.; Gao, D.; Wen, L. The Study on the Mechanical Properties of Poly(lactic acid)/Straw Fiber Composites. Appl. Mech. Mater. 2012, 200, 312–315. [Google Scholar] [CrossRef]
  51. PN-EN ISO 1183-3:2003. Plastics–Methods for Determining the Density of Non-porous Plastics–Part 3: Gas Pycnometer Method; Polish Committee for Standardization: Warsaw, Poland, 2003. [Google Scholar]
  52. PN-EN ISO 527-1:2020-01. Plastics–Determination of Mechanical Properties under Static Stretching–Part 1: General Principles; Polish Committee for Standardization: Warsaw, Poland, 2020. [Google Scholar]
  53. PN-EN ISO 14125:2001/A1:2011. Plastic Composites Reinforced Fiber–Determination of Bending Properties; Polish Committee for Standardization: Warsaw, Poland, 2011. [Google Scholar]
  54. PN-EN ISO 179-2:2020-12. Plastics–Determination of Charpy Impact–Part 2: Instrumental Impact Test; Polish Committee for Standardization: Warsaw, Poland, 2020. [Google Scholar]
  55. PN-EN ISO 6721-1:2019-07. Plastics–Determination of Dynamic Mechanical Properties–Part 1: General Principles; Polish Committee for Standardization: Warsaw, Poland, 2019. [Google Scholar]
  56. NatureWorks LLC. Ingeo Biopolymer 3251D Technical Data Sheet. Available online: https://www.natureworksllc.com/~/media/Files/NatureWorks/Technical-Documents/Technical-Data-Sheets/TechnicalDataSheet_3251D_injection-molding_pdf.pdf?la=en (accessed on 1 November 2021).
  57. Golmakani, M.E.; Wiczenbach, T.; Malikan, M.; Aliakbari, R.; Eremeyev, V.A. Investigation of Wood Flour Size, Aspect Ratios, and Injection Molding Temperature on Mechanical Properties of Wood Flour/Polyethylene Composites. Materials 2021, 14, 3406. [Google Scholar] [CrossRef]
  58. Omrani, E.; Menezes, P.L.; Rohatgi, P.K. State of the art on tribological behavior of polymer matrix composites reinforced with natural fibers in the green materials world. Eng. Sci. Technol. Int. J. 2016, 19, 717–736. [Google Scholar] [CrossRef] [Green Version]
  59. Stanciu, M.D.; Teodorescu Draghicescu, H.; Tamas, F.; Terciu, O.M. Mechanical and Rheological Behaviour of Composites Reinforced with Natural Fibres. Polymers 2020, 12, 1402. [Google Scholar] [CrossRef]
  60. Mysiukiewicz, O.; Barczewski, M.; Kloziński, A. The Influence of Sub-Zero Conditions on the Mechanical Properties of Polylactide-Based Composites. Materials 2020, 13, 5789. [Google Scholar] [CrossRef]
  61. Luo, H.; Zhang, C.; Xiong, G.; Wan, Y. Effects of alkali and alkali/silane treatments of corn fibers on mechanical and thermal properties of its composites with polylactic acid. Polym. Compos. 2015, 32, 3499–3507. [Google Scholar] [CrossRef]
  62. Nourbakhsh, A.; Ashori, A. Fundamental Studies on Wood–Plastic Composites: Effects of Fiber Concentration and Mixing Temperature on the Mechanical Properties of Poplar/PP Composite. Polym. Compos. 2008, 29, 569–573. [Google Scholar] [CrossRef]
  63. Nourbakhsh, A.; Karegarfard, A.; Ashori, A.; Nourbakhsh, A. Effects of Particle Size and Coupling Agent Concentration on Mechanical Properties of Particulate-Filled Polymer Composites. J. Compos. Mater. 2010, 23, 169–174. [Google Scholar] [CrossRef]
  64. Cui, Y.; Lee, S.; Noruziaan, B.; Cheung, M.; Tao, J. Fabrication and Interfacial Modification of Wood/Recycled Plastic Composite Materials. Compos. Part A Appl. Sci. Manuf. 2008, 39, 655–661. [Google Scholar] [CrossRef]
  65. Quiles-Carrillo, L.; Montanes, N.; Sammon, C.; Balart, R.; Torres-Giner, S. Compatibilization of highly sustainable polylactide/almond shell flour composites by reactive extrusion with maleinized linseed oil. Ind. Crop. Prod. 2018, 111, 878–888. [Google Scholar] [CrossRef]
  66. Aguero, A.; Quiles-Carrillo, L.; Jorda-Vilaplana, A.; Fenollar, O.; Montanes, N. Effect of different compatibilizers on environmentally friendly composites from poly(lactic acid) and diatomaceous earth. Polym. Int. 2019, 68, 893–903. [Google Scholar] [CrossRef]
  67. Torres-Giner, S.; Montanes, N.; Fenollar, O.; García-Sanoguera, D.; Balart, R. Development and optimization of renewable vinyl plastisol/wood flour composites exposed to ultraviolet radiation. Mater. Des. 2016, 108, 648–658. [Google Scholar] [CrossRef]
  68. Asim, M.; Jawaid, M.; Abdan, K.; Ishak, M.R. Effect of Alkali and silane treatments on mechanical and fibre-matrix bond strength of kenaf and pineapple leaf fibres. J. Bionic Eng. 2016, 13, 426–435. [Google Scholar] [CrossRef]
  69. Lopattananon, N.; Panawarangkul, K.; Sahakaro, K.; Ellis, B. Performance of pineapple leaf fiber–natural rubber composites: The effect of fiber surface treatments. J. Appl. Polym. Sci. 2006, 102, 1974–1984. [Google Scholar] [CrossRef]
Figure 1. View of the disks of shredding system: (a) stationary disk, (b) moving disc.
Materials 14 07281 g001
Figure 2. Impact strength of PLA and its composites.
Materials 14 07281 g002
Figure 3. Impact of corn stalk fiber size on tensile (a) modulus; (b) strength.
Materials 14 07281 g003
Figure 4. Impact of corn stalk fiber size on flexural (a) modulus; (b) strength.
Materials 14 07281 g004
Figure 5. Stress–strain curve in tensile tests of pure PLA and PLA/CS composite samples.
Materials 14 07281 g005
Figure 6. Change of (a) storage modulus and (b) dynamic damping factor (tan δ) as a function of the temperature of pure PLA and PLA/CS composite samples.
Materials 14 07281 g006
Figure 7. Optical micrographs of corn stalk fiber fractions (a) CS1; (b) CS1.6; (c) CS2; (d) CS4.
Materials 14 07281 g007
Figure 8. Cross-sections of composites CS: (a) PLA/CS1; (b) PLA/CS1.6; (c) PLA/CS2; (d) PLA/CS4.
Materials 14 07281 g008
Figure 9. 3D images of composites CS: (a) PLA/CS1; (b) PLA/CS1.6; (c) PLA/CS2; (d) PLA/CS4.
Materials 14 07281 g009
Figure 10. SEM micrographs of composite samples: (a) PLA; (b) PLA/CS1; (c) PLA/CS1.6; (d) PLA/CS2; (e) PLA/CS4.
Materials 14 07281 g010
Table 1. Density of tested samples.
Sample NameDensity (g/cm3)
PLA1.2562 ± 0.0013
PLA/CS11.2318 ± 0.0025
PLA/CS1.61.2134 ± 0.0021
PLA/CS21.2489 ± 0.0011
PLA/CS41.1995 ± 0.0026
Table 2. Tensile properties of tested samples.
Sample NameModulus of Elasticity (MPa)Tensile Strength (MPa)Strain at Break (%)
PLA2173 ± 6560.64 ± 2.824 ± 0.7
PLA/CS12713 ± 6646.77 ± 1.732.34 ± 0.13
PLA/CS1.62724 ± 3445.43 ± 2.192.30 ± 0.17
PLA/CS22687 ± 6042.93 ± 1.662.17 ± 0.15
PLA/CS42476 ± 7429.68 ± 9.331.53 ± 0.55
Table 3. Flexural properties of tested samples.
Sample NameModulus of Elasticity (MPa)Flexural Strength (MPa)Flexural Break (%)
PLA3833 ± 7180.01 ± 10.32.24 ± 0.42
PLA/CS14651 ± 12964.88 ± 2.51.79 ± 0.19
PLA/CS1.64598 ± 13661.78 ± 3.31.76 ± 0.25
PLA/CS24456 ± 5661.68 ± 2.91.71 ± 0.15
PLA/CS44132 ± 17150.69 ± 5.31.60 ± 0.06
Table 4. Thermomechanical properties of tested samples.
Sample NameE′30 °C (MPa)E′50 °C (MPa)E′75 °C (MPa)E′130 °C (MPa)tan δ/Temperature (°C)
PLA3028278911.98194.42.419/71.65
PLA/CS13446314825.2440.71.536/69.74
PLA/CS1.63712344632.67485.61.488/70.54
PLA/CS23306302935.89466.41.406/71.17
PLA/CS43208296628.12404.11.398/69.92
Publisher’s Note: MDPI stays neutral with regard to jurisdictional claims in published maps and institutional affiliations.

